Data Quality Dashboard
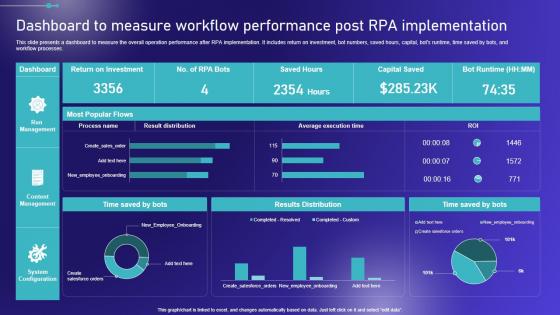
Dashboard To Measure Workflow Performance Post Embracing Robotic Process Portrait PDF
This slide presents a dashboard to measure the overall operation performance after RPA implementation. It includes return on investment, bot numbers, saved hours, capital, bots runtime, time saved by bots, and workflow processes. Are you in need of a template that can accommodate all of your creative concepts This one is crafted professionally and can be altered to fit any style. Use it with Google Slides or PowerPoint. Include striking photographs, symbols, depictions, and other visuals. Fill, move around, or remove text boxes as desired. Test out color palettes and font mixtures. Edit and save your work, or work with colleagues. Download Dashboard To Measure Workflow Performance Post Embracing Robotic Process Portrait PDF and observe how to make your presentation outstanding. Give an impeccable presentation to your group and make your presentation unforgettable. This slide presents a dashboard to measure the overall operation performance after RPA implementation. It includes return on investment, bot numbers, saved hours, capital, bots runtime, time saved by bots, and workflow processes.
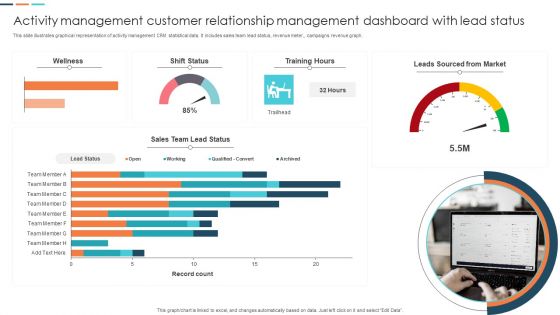
Activity Management Customer Relationship Management Dashboard With Lead Status Portrait PDF
This slide illustrates graphical representation of activity management CRM statistical data. It includes sales team lead status, revenue meter, campaigns revenue graph. Showcasing this set of slides titled Activity Management Customer Relationship Management Dashboard With Lead Status Portrait PDF. The topics addressed in these templates are Sales Team Lead Status, Leads Sourced From Market. All the content presented in this PPT design is completely editable. Download it and make adjustments in color, background, font etc. as per your unique business setting.
Strategies To Mitigate Cyber Security Risks Dashboard Incident Tracking Ppt Model PDF
Presenting this set of slides with name strategies to mitigate cyber security risks dashboard incident tracking ppt model pdf. The topics discussed in these slides are application whitelisting, patch applications, patch operating systems, restrict admin privileges, disable untrusted microsoft office macros, user application hardening, multi factor authentication, daily backup important data. This is a completely editable PowerPoint presentation and is available for immediate download. Download now and impress your audience.
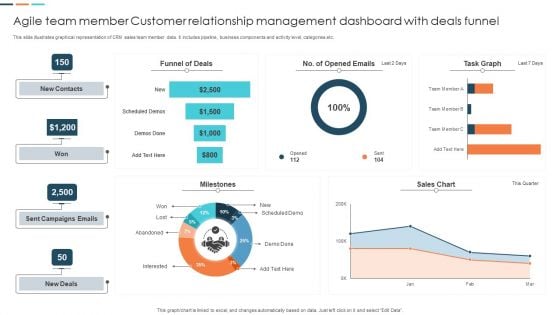
Agile Team Member Customer Relationship Management Dashboard With Deals Funnel Mockup PDF
This slide illustrates graphical representation of CRM sales team member data. It includes pipeline, business components and activity level, categories etc. Pitch your topic with ease and precision using this Agile Team Member Customer Relationship Management Dashboard With Deals Funnel Mockup PDF. This layout presents information on Funnel Of Deals, Sent Campaigns Emails, Sales Chart. It is also available for immediate download and adjustment. So, changes can be made in the color, design, graphics or any other component to create a unique layout.
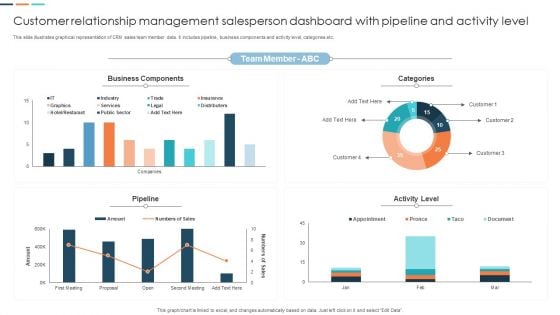
Customer Relationship Management Salesperson Dashboard With Pipeline And Activity Level Designs PDF
This slide illustrates graphical representation of CRM sales team member data. It includes pipeline, business components and activity level, categories etc. Pitch your topic with ease and precision using this Customer Relationship Management Salesperson Dashboard With Pipeline And Activity Level Designs PDF. This layout presents information on Categories, Business Components, Team Member. It is also available for immediate download and adjustment. So, changes can be made in the color, design, graphics or any other component to create a unique layout.
SD Wan Network Performance Tracking Dashboard Wide Area Network Services Portrait Pdf
This slide represents the SD-WAN network performance tracking dashboard. The purpose of this slide is to demonstrate the performance of the SD-WAN network. The main components include control status, site health, transport interface distribution, WAN edge inventory, edge health, and so on. Slidegeeks has constructed SD Wan Network Performance Tracking Dashboard Wide Area Network Services Portrait Pdf after conducting extensive research and examination. These presentation templates are constantly being generated and modified based on user preferences and critiques from editors. Here, you will find the most attractive templates for a range of purposes while taking into account ratings and remarks from users regarding the content. This is an excellent jumping-off point to explore our content and will give new users an insight into our top-notch PowerPoint Templates. This slide represents the SD-WAN network performance tracking dashboard. The purpose of this slide is to demonstrate the performance of the SD-WAN network. The main components include control status, site health, transport interface distribution, WAN edge inventory, edge health, and so on.
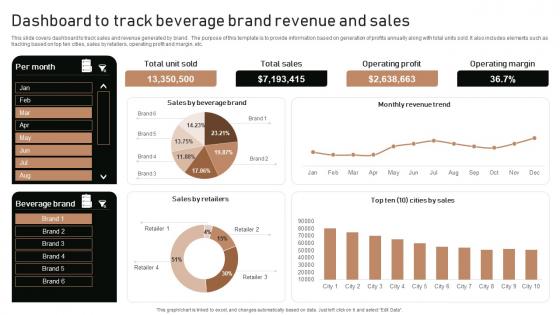
Execution Of Product Lifecycle Dashboard To Track Beverage Brand Revenue And Sales Ideas Pdf
This slide covers dashboard to track sales and revenue generated by brand . The purpose of this template is to provide information based on generation of profits annually along with total units sold. It also includes elements such as tracking based on top ten cities, sales by retailers, operating profit and margin, etc. From laying roadmaps to briefing everything in detail, our templates are perfect for you. You can set the stage with your presentation slides. All you have to do is download these easy-to-edit and customizable templates. Execution Of Product Lifecycle Dashboard To Track Beverage Brand Revenue And Sales Ideas Pdf will help you deliver an outstanding performance that everyone would remember and praise you for. Do download this presentation today. This slide covers dashboard to track sales and revenue generated by brand . The purpose of this template is to provide information based on generation of profits annually along with total units sold. It also includes elements such as tracking based on top ten cities, sales by retailers, operating profit and margin, etc.
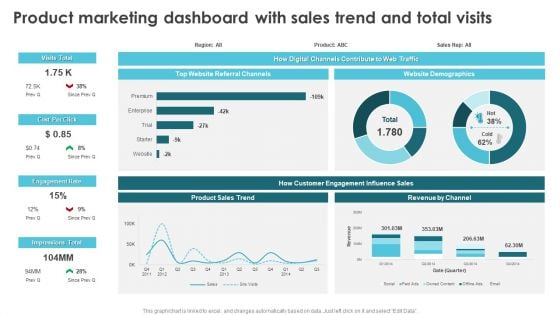
Product Marketing For Generating Product Marketing Dashboard With Sales Trend Designs PDF
This graph or chart is linked to excel, and changes automatically based on data. Just left click on it and select Edit Data. From laying roadmaps to briefing everything in detail, our templates are perfect for you. You can set the stage with your presentation slides. All you have to do is download these easy-to-edit and customizable templates. Product Marketing For Generating Product Marketing Dashboard With Sales Trend Designs PDF will help you deliver an outstanding performance that everyone would remember and praise you for. Do download this presentation today.
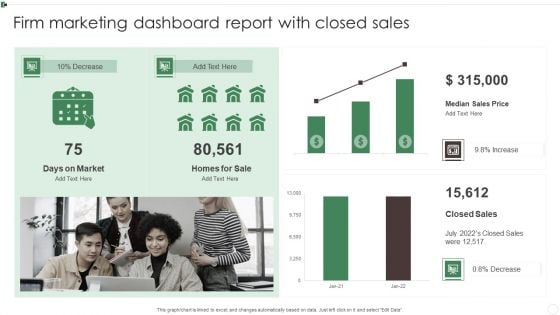
Firm Marketing Dashboard Report With Closed Sales Ppt Slides Graphics Example PDF
This graph or chart is linked to excel, and changes automatically based on data. Just left click on it and select Edit Data. Showcasing this set of slides titled Firm Marketing Dashboard Report With Closed Sales Ppt Slides Graphics Example PDF. The topics addressed in these templates are Days On Market, Homes For Sale, Median Sales Price, Closed Sales. All the content presented in this PPT design is completely editable. Download it and make adjustments in color, background, font etc. as per your unique business setting.
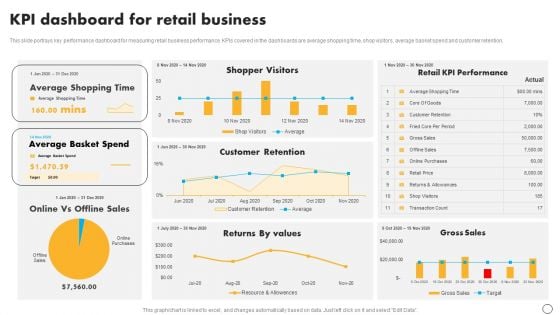
Retail Business Optimization Through Operational Excellence Strategy KPI Dashboard For Retail Business Mockup PDF
This slide portrays key performance dashboard for measuring retail business performance. KPIs covered in the dashboards are average shopping time, shop visitors, average basket spend and customer retention. Boost your pitch with our creative Retail Business Optimization Through Operational Excellence Strategy KPI Dashboard For Retail Business Mockup PDF. Deliver an awe-inspiring pitch that will mesmerize everyone. Using these presentation templates you will surely catch everyones attention. You can browse the ppts collection on our website. We have researchers who are experts at creating the right content for the templates. So you do not have to invest time in any additional work. Just grab the template now and use them.
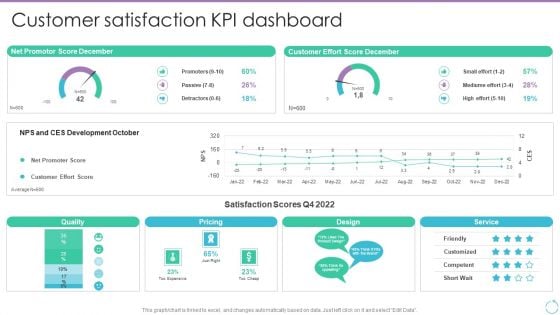
Personal Branding Plan For Executives Customer Satisfaction KPI Dashboard Graphics PDF
This graph or chart is linked to excel, and changes automatically based on data. Just left click on it and select Edit Data. Whether you have daily or monthly meetings, a brilliant presentation is necessary. Personal Branding Plan For Executives Customer Satisfaction KPI Dashboard Graphics PDF can be your best option for delivering a presentation. Represent everything in detail using Personal Branding Plan For Executives Customer Satisfaction KPI Dashboard Graphics PDF and make yourself stand out in meetings. The template is versatile and follows a structure that will cater to your requirements. All the templates prepared by Slidegeeks are easy to download and edit. Our research experts have taken care of the corporate themes as well. So, give it a try and see the results.
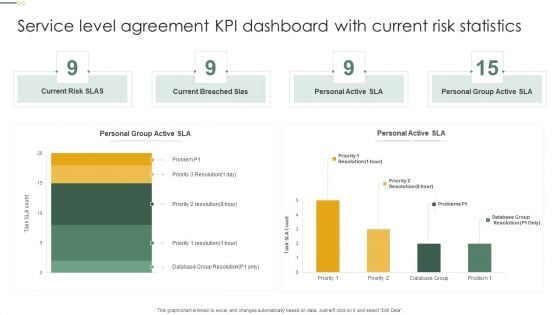
Service Level Agreement KPI Dashboard With Current Risk Statistics Topics PDF
This graph or chart is linked to excel, and changes automatically based on data. Just left click on it and select Edit Data. Pitch your topic with ease and precision using this Service Level Agreement KPI Dashboard With Current Risk Statistics Topics PDF. This layout presents information on Current Risk SLAS, Current Breached Slas, Personal Active SLA It is also available for immediate download and adjustment. So, changes can be made in the color, design, graphics or any other component to create a unique layout.
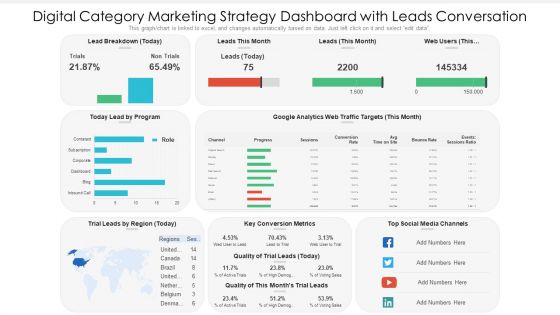
Digital Category Marketing Strategy Dashboard With Leads Conversation Ppt PowerPoint Presentation Slides Information PDF
This graph chart is linked to excel, and changes automatically based on data. Just left click on it and select edit data. Pitch your topic with ease and precision using this digital category marketing strategy dashboard with leads conversation ppt powerpoint presentation slides information pdf. This layout presents information on key conversion metrics, social media channels, lead by program. It is also available for immediate download and adjustment. So, changes can be made in the color, design, graphics or any other component to create a unique layout.
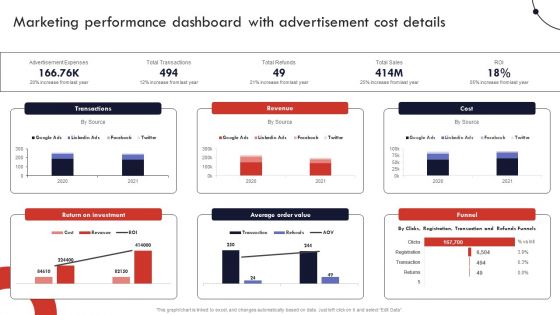
Product And Services Promotion Marketing Performance Dashboard With Advertisement Graphics PDF
This graph or chart is linked to excel, and changes automatically based on data. Just left click on it and select Edit Data. Slidegeeks is here to make your presentations a breeze with Product And Services Promotion Marketing Performance Dashboard With Advertisement Graphics PDF With our easy-to-use and customizable templates, you can focus on delivering your ideas rather than worrying about formatting. With a variety of designs to choose from, youre sure to find one that suits your needs. And with animations and unique photos, illustrations, and fonts, you can make your presentation pop. So whether youre giving a sales pitch or presenting to the board, make sure to check out Slidegeeks first.
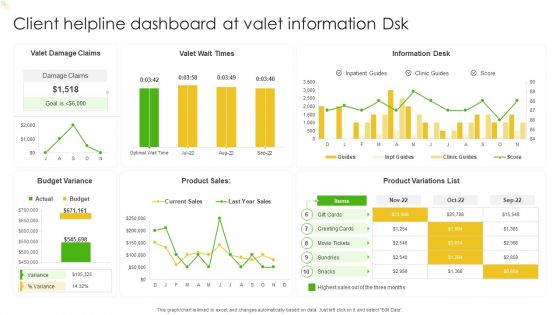
Client Helpline Dashboard At Valet Information Dsk Ppt Gallery Slide Portrait PDF
This graph or chart is linked to excel, and changes automatically based on data. Just left click on it and select Edit Data. Pitch your topic with ease and precision using this Client Helpline Dashboard At Valet Information Dsk Ppt Gallery Slide Portrait PDF. This layout presents information on Valet Damage Claims, Valet Wait Times, Information Desk. It is also available for immediate download and adjustment. So, changes can be made in the color, design, graphics or any other component to create a unique layout.
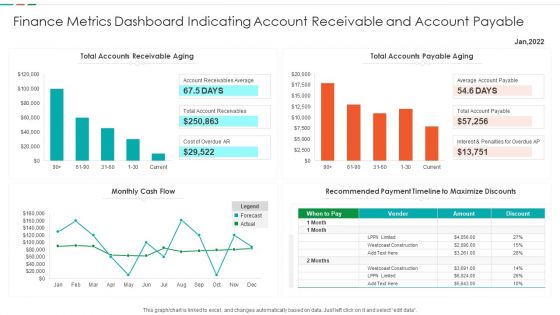
Finance Metrics Dashboard Indicating Account Receivable And Account Payable Demonstration PDF
This graph or chart is linked to excel, and changes automatically based on data. Just left click on it and select edit data. Showcasing this set of slides titled Finance Metrics Dashboard Indicating Account Receivable And Account Payable Demonstration PDF. The topics addressed in these templates are Total Accounts Receivable, Total Accounts Payable, Recommended Payment Timeline, Monthly Cash Flow. All the content presented in this PPT design is completely editable. Download it and make adjustments in color, background, font etc. as per your unique business setting.
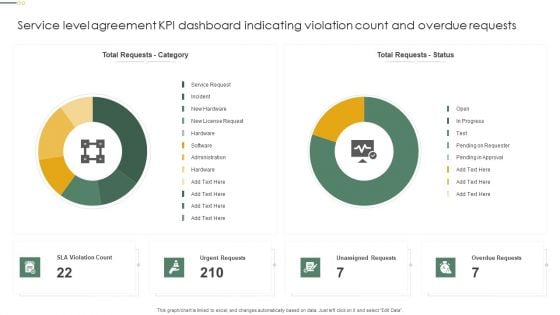
Service Level Agreement KPI Dashboard Indicating Violation Count And Overdue Requests Diagrams PDF
This graph or chart is linked to excel, and changes automatically based on data. Just left click on it and select Edit Data. Showcasing this set of slides titled Service Level Agreement KPI Dashboard Indicating Violation Count And Overdue Requests Diagrams PDF. The topics addressed in these templates are Total Requests Category, Total Requests Status, Urgent Requests. All the content presented in this PPT design is completely editable. Download it and make adjustments in color, background, font etc. as per your unique business setting.
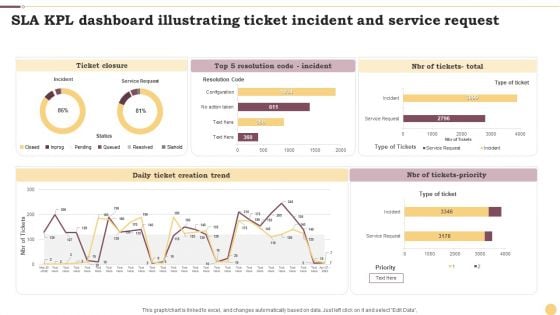
SLA KPL Dashboard Illustrating Ticket Incident And Service Request Ppt File Portrait PDF
This graph or chart is linked to excel, and changes automatically based on data. Just left click on it and select Edit Data. Showcasing this set of slides titled SLA KPL Dashboard Illustrating Ticket Incident And Service Request Ppt File Portrait PDF. The topics addressed in these templates are Ticket Closure, Daily Ticket, Creation Trend, NBR Tickets Priority. All the content presented in this PPT design is completely editable. Download it and make adjustments in color, background, font etc. as per your unique business setting.
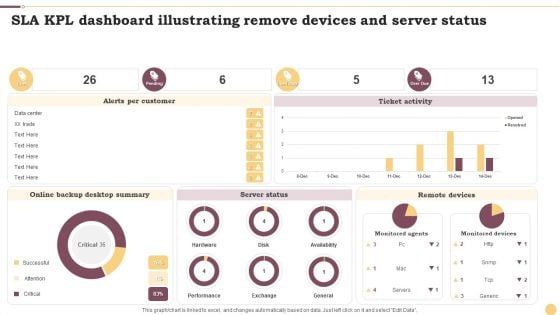
SLA KPL Dashboard Illustrating Remove Devices And Server Status Ppt Inspiration Layout Ideas PDF
This graph or chart is linked to excel, and changes automatically based on data. Just left click on it and select Edit Data. Showcasing this set of slides titled SLA KPL Dashboard Illustrating Remove Devices And Server Status Ppt Inspiration Layout Ideas PDF. The topics addressed in these templates are Alerts Per Customer, Ticket Activity, Server Status. All the content presented in this PPT design is completely editable. Download it and make adjustments in color, background, font etc. as per your unique business setting.
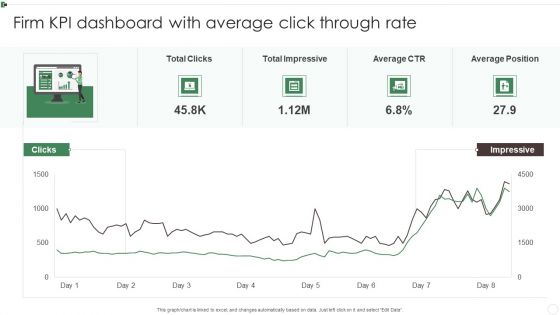
Firm KPI Dashboard With Average Click Through Rate Ppt Inspiration Sample PDF
This graph or chart is linked to excel, and changes automatically based on data. Just left click on it and select Edit Data. Pitch your topic with ease and precision using this Firm KPI Dashboard With Average Click Through Rate Ppt Inspiration Sample PDF. This layout presents information on Total Clicks, Total Impressive, Average CTR, Average Position. It is also available for immediate download and adjustment. So, changes can be made in the color, design, graphics or any other component to create a unique layout.

Firm KPI Dashboard With Schedule Performance Index Ppt Visual Aids PDF
This graph or chart is linked to excel, and changes automatically based on data. Just left click on it and select Edit Data. Pitch your topic with ease and precision using this Firm KPI Dashboard With Schedule Performance Index Ppt Visual Aids PDF. This layout presents information on Project Cost Performance, Project Planning Stage, Monitor And Control. It is also available for immediate download and adjustment. So, changes can be made in the color, design, graphics or any other component to create a unique layout.
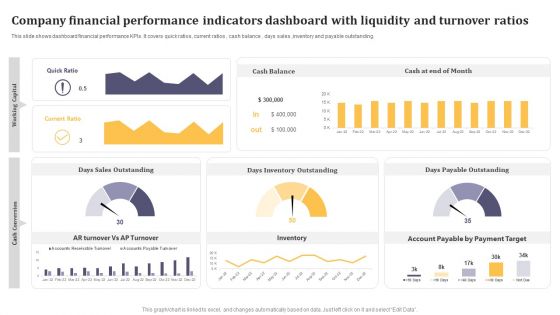
Company Financial Performance Indicators Dashboard With Liquidity And Turnover Ratios Formats PDF
This graph or chart is linked to excel, and changes automatically based on data. Just left click on it and select Edit Data. Pitch your topic with ease and precision using this Company Financial Performance Indicators Dashboard With Liquidity And Turnover Ratios Formats PDF. This layout presents information on Cash Balance, Days Inventory Outstanding, Days Payable Outstanding. It is also available for immediate download and adjustment. So, changes can be made in the color, design, graphics or any other component to create a unique layout.
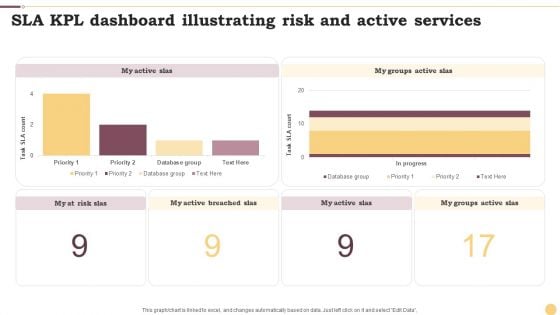
SLA KPL Dashboard Illustrating Risk And Active Services Ppt Portfolio Design Inspiration PDF
This graph or chart is linked to excel, and changes automatically based on data. Just left click on it and select Edit Data. Pitch your topic with ease and precision using this SLA KPL Dashboard Illustrating Risk And Active Services Ppt Portfolio Design Inspiration PDF. This layout presents information on My Active SLAs, Database Group, Priority. It is also available for immediate download and adjustment. So, changes can be made in the color, design, graphics or any other component to create a unique layout.
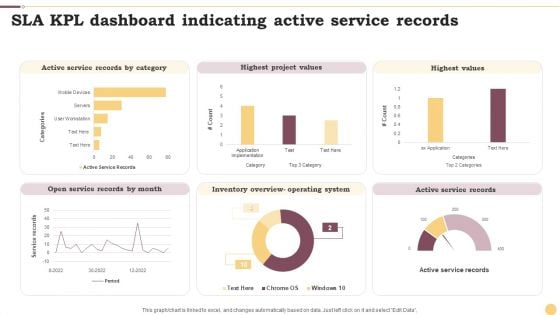
SLA KPL Dashboard Indicating Active Service Records Ppt Professional Graphics Example PDF
This graph or chart is linked to excel, and changes automatically based on data. Just left click on it and select Edit Data. Pitch your topic with ease and precision using this SLA KPL Dashboard Indicating Active Service Records Ppt Professional Graphics Example PDF. This layout presents information on Active Service Records, Highest Project Values, Highest Values. It is also available for immediate download and adjustment. So, changes can be made in the color, design, graphics or any other component to create a unique layout.
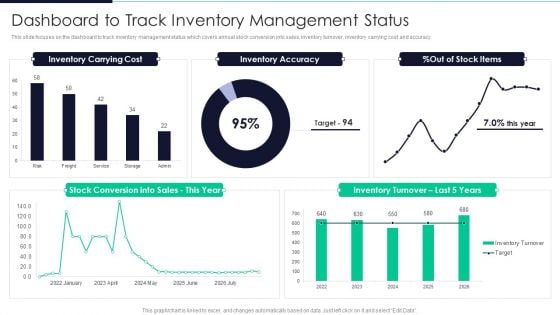
Developing Excellence In Logistics Operations Dashboard To Track Inventory Management Status Information PDF
This slide focuses on the dashboard to track inventory management status which covers annual stock conversion into sales, inventory turnover, inventory carrying cost and accuracy.Deliver and pitch your topic in the best possible manner with this Developing Excellence In Logistics Operations Dashboard To Track Inventory Management Status Information PDF Use them to share invaluable insights on Inventory Accuracy, Inventory Carrying, Inventory Turnover and impress your audience. This template can be altered and modified as per your expectations. So, grab it now.
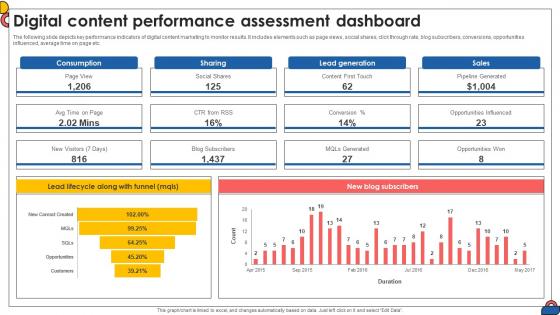
Digital Content Performance Assessment Dashboard Comprehensive Guide To Implement Strategy SS V
The following slide depicts key performance indicators of digital content marketing to monitor results. It includes elements such as page views, social shares, click through rate, blog subscribers, conversions, opportunities influenced, average time on page etc.If your project calls for a presentation, then Slidegeeks is your go-to partner because we have professionally designed, easy-to-edit templates that are perfect for any presentation. After downloading, you can easily edit Digital Content Performance Assessment Dashboard Comprehensive Guide To Implement Strategy SS V and make the changes accordingly. You can rearrange slides or fill them with different images. Check out all the handy templates The following slide depicts key performance indicators of digital content marketing to monitor results. It includes elements such as page views, social shares, click through rate, blog subscribers, conversions, opportunities influenced, average time on page etc.
Marketing Business Operational Excellence Plan KPI Dashboard Ppt Icon Design Ideas PDF
This slide shows marketing KPIs dashboard for operational excellence strategy of an organization. It includes metrics such as total spending, total clicks, cost per acquisition, and campaigns. Showcasing this set of slides titled Marketing Business Operational Excellence Plan KPI Dashboard Ppt Icon Design Ideas PDF. The topics addressed in these templates are Daily Impressions, Acquisitions Campaign. All the content presented in this PPT design is completely editable. Download it and make adjustments in color, background, font etc. as per your unique business setting.
Inbound Lead Performance Tracking Dashboard Enhancing Client Lead Conversion Rates Structure PDF
This slide covers the KPI dashboard for evaluating inbound lead performance. It includes metrics such as lead to opportunity ratio, opportunity to win ratio, lead conversion ratio, inbound leads, and leads in the sales funnel. The Inbound Lead Performance Tracking Dashboard Enhancing Client Lead Conversion Rates Structure PDF is a compilation of the most recent design trends as a series of slides. It is suitable for any subject or industry presentation, containing attractive visuals and photo spots for businesses to clearly express their messages. This template contains a variety of slides for the user to input data, such as structures to contrast two elements, bullet points, and slides for written information. Slidegeeks is prepared to create an impression.
Inbound Lead Performance Tracking Dashboard Improving Lead Generation Process Pictures PDF
This slide covers the KPI dashboard for evaluating inbound lead performance. It includes metrics such as lead to opportunity ratio, opportunity to win ratio, lead conversion ratio, inbound leads, and leads in the sales funnel. The Inbound Lead Performance Tracking Dashboard Improving Lead Generation Process Pictures PDF is a compilation of the most recent design trends as a series of slides. It is suitable for any subject or industry presentation, containing attractive visuals and photo spots for businesses to clearly express their messages. This template contains a variety of slides for the user to input data, such as structures to contrast two elements, bullet points, and slides for written information. Slidegeeks is prepared to create an impression.
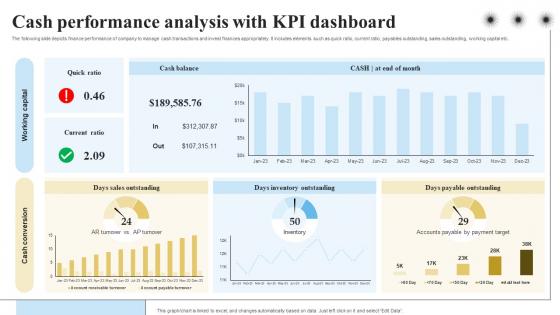
Cash Performance Analysis With KPI Dashboard Objectives And Key Result Methodology For Business
The following slide depicts finance performance of company to manage cash transactions and invest finances appropriately. It includes elements such as quick ratio, current ratio, payables outstanding, sales outstanding, working capital etc. Do you have to make sure that everyone on your team knows about any specific topic I yes, then you should give Cash Performance Analysis With KPI Dashboard Objectives And Key Result Methodology For Business a try. Our experts have put a lot of knowledge and effort into creating this impeccable Cash Performance Analysis With KPI Dashboard Objectives And Key Result Methodology For Business. You can use this template for your upcoming presentations, as the slides are perfect to represent even the tiniest detail. You can download these templates from the Slidegeeks website and these are easy to edit. So grab these today The following slide depicts finance performance of company to manage cash transactions and invest finances appropriately. It includes elements such as quick ratio, current ratio, payables outstanding, sales outstanding, working capital etc.
Robotic Process Automation Dashboard With Monthly Test Execution KPI Icons PDF
This slide covers RPA metrics for analyzing test execution on automated platforms. It also includes test execution metrics such as total test executed, test status, tests executed daily for different operation systems, etc. Pitch your topic with ease and precision using this Robotic Process Automation Dashboard With Monthly Test Execution KPI Icons PDF. This layout presents information on Robotic Process Automation Dashboard, Monthly Test Execution Kpi. It is also available for immediate download and adjustment. So, changes can be made in the color, design, graphics or any other component to create a unique layout.
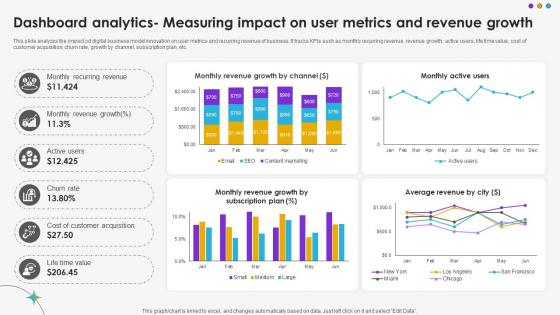
Dashboard Analytics Measuring Impact On User Metrics And Revenue Growth DT SS V
This slide analyzes the impact od digital business model innovation on user metrics and recurring revenue of business. It tracks KPIs such as monthly recurring revenue, revenue growth, active users, life time value, cost of customer acquisition, churn rate, growth by channel, subscription plan, etc.Are you searching for a Dashboard Analytics Measuring Impact On User Metrics And Revenue Growth DT SS V that is uncluttered, straightforward, and original Its easy to edit, and you can change the colors to suit your personal or business branding. For a presentation that expresses how much effort you have put in, this template is ideal With all of its features, including tables, diagrams, statistics, and lists, its perfect for a business plan presentation. Make your ideas more appealing with these professional slides. Download Dashboard Analytics Measuring Impact On User Metrics And Revenue Growth DT SS V from Slidegeeks today. This slide analyzes the impact od digital business model innovation on user metrics and recurring revenue of business. It tracks KPIs such as monthly recurring revenue, revenue growth, active users, life time value, cost of customer acquisition, churn rate, growth by channel, subscription plan, etc.
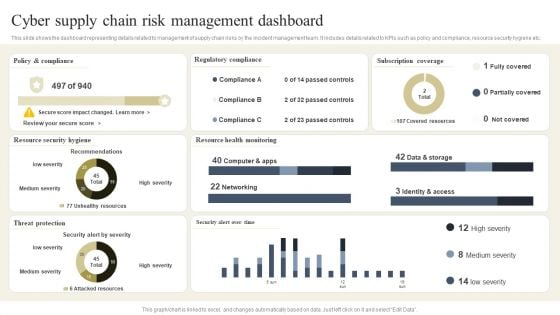
CYBER Security Breache Response Strategy Cyber Supply Chain Risk Management Dashboard Inspiration PDF
This slide shows the dashboard representing details related to management of supply chain risks by the incident management team. It includes details related to KPIs such as policy and compliance, resource security hygiene etc. The CYBER Security Breache Response Strategy Cyber Supply Chain Risk Management Dashboard Inspiration PDF is a compilation of the most recent design trends as a series of slides. It is suitable for any subject or industry presentation, containing attractive visuals and photo spots for businesses to clearly express their messages. This template contains a variety of slides for the user to input data, such as structures to contrast two elements, bullet points, and slides for written information. Slidegeeks is prepared to create an impression.
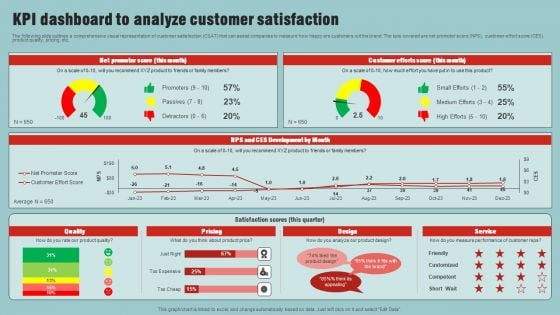
Market Analysis Overview And Different Categories KPI Dashboard To Analyze Customer Satisfaction Elements PDF
The following slide outlines a comprehensive visual representation of customer satisfaction CSAT that can assist companies to measure how happy are customers wit the brand. The kpis covered are net promoter score NPS, customer effort score CES, product quality, pricing, etc. Retrieve professionally designed Market Analysis Overview And Different Categories KPI Dashboard To Analyze Customer Satisfaction Elements PDF to effectively convey your message and captivate your listeners. Save time by selecting pre made slideshows that are appropriate for various topics, from business to educational purposes. These themes come in many different styles, from creative to corporate, and all of them are easily adjustable and can be edited quickly. Access them as PowerPoint templates or as Google Slides themes. You do not have to go on a hunt for the perfect presentation because Slidegeeks got you covered from everywhere.
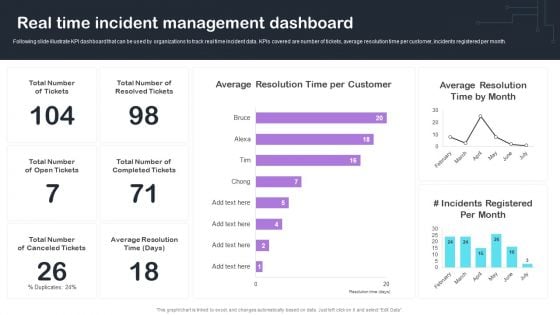
Cyber Risks And Incident Response Playbook Real Time Incident Management Dashboard Guidelines PDF
Following slide illustrate KPI dashboard that can be used by organizations to track real time incident data. KPIs covered are number of tickets, average resolution time per customer, incidents registered per month. This Cyber Risks And Incident Response Playbook Real Time Incident Management Dashboard Guidelines PDF from Slidegeeks makes it easy to present information on your topic with precision. It provides customization options, so you can make changes to the colors, design, graphics, or any other component to create a unique layout. It is also available for immediate download, so you can begin using it right away. Slidegeeks has done good research to ensure that you have everything you need to make your presentation stand out. Make a name out there for a brilliant performance.

Functions Dashboard Performance Revenue Ppt PowerPoint Presentation Complete Deck With Slides
Improve your presentation delivery using this functions dashboard performance revenue ppt powerpoint presentation complete deck with slides. Support your business vision and objectives using this well-structured PPT deck. This template offers a great starting point for delivering beautifully designed presentations on the topic of your choice. Comprising twelve this professionally designed template is all you need to host discussion and meetings with collaborators. Each slide is self-explanatory and equipped with high-quality graphics that can be adjusted to your needs. Therefore, you will face no difficulty in portraying your desired content using this PPT slideshow. This PowerPoint slideshow contains every important element that you need for a great pitch. It is not only editable but also available for immediate download and utilization. The color, font size, background, shapes everything can be modified to create your unique presentation layout. Therefore, download it now.

Business Intelligence KPI Dashboard Ppt PowerPoint Presentation Complete Deck With Slides
Improve your presentation delivery using this Business Intelligence KPI Dashboard Ppt PowerPoint Presentation Complete Deck With Slides. Support your business vision and objectives using this well-structured PPT deck. This template offers a great starting point for delivering beautifully designed presentations on the topic of your choice. Comprising sixteen this professionally designed template is all you need to host discussion and meetings with collaborators. Each slide is self-explanatory and equipped with high-quality graphics that can be adjusted to your needs. Therefore, you will face no difficulty in portraying your desired content using this PPT slideshow. This PowerPoint slideshow contains every important element that you need for a great pitch. It is not only editable but also available for immediate download and utilization. The color, font size, background, shapes everything can be modified to create your unique presentation layout. Therefore, download it now.
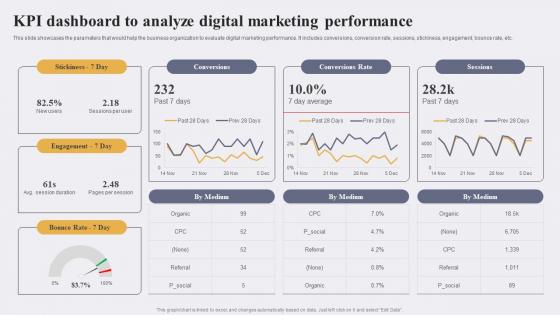
KPI Dashboard To Analyze Digital Marketing Enhancing Conversion Rate By Leveraging Background Pdf
This slide showcases the parameters that would help the business organization to evaluate digital marketing performance. It includes conversions, conversion rate, sessions, stickiness, engagement, bounce rate, etc.If you are looking for a format to display your unique thoughts, then the professionally designed KPI Dashboard To Analyze Digital Marketing Enhancing Conversion Rate By Leveraging Background Pdf is the one for you. You can use it as a Google Slides template or a PowerPoint template. Incorporate impressive visuals, symbols, images, and other charts. Modify or reorganize the text boxes as you desire. Experiment with shade schemes and font pairings. Alter, share or cooperate with other people on your work. Download KPI Dashboard To Analyze Digital Marketing Enhancing Conversion Rate By Leveraging Background Pdf and find out how to give a successful presentation. Present a perfect display to your team and make your presentation unforgettable. This slide showcases the parameters that would help the business organization to evaluate digital marketing performance. It includes conversions, conversion rate, sessions, stickiness, engagement, bounce rate, etc.
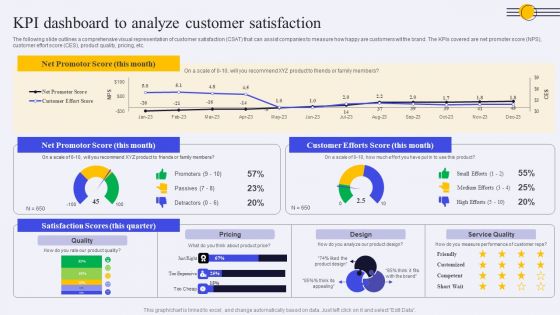
KPI Dashboard To Analyze Customer Satisfaction Ppt PowerPoint Presentation File Infographic Template PDF
The following slide outlines a comprehensive visual representation of customer satisfaction CSAT that can assist companies to measure how happy are customers wit the brand. The KPIs covered are net promoter score NPS, customer effort score CES, product quality, pricing, etc. Coming up with a presentation necessitates that the majority of the effort goes into the content and the message you intend to convey. The visuals of a PowerPoint presentation can only be effective if it supplements and supports the story that is being told. Keeping this in mind our experts created KPI Dashboard To Analyze Customer Satisfaction Ppt PowerPoint Presentation File Infographic Template PDF to reduce the time that goes into designing the presentation. This way, you can concentrate on the message while our designers take care of providing you with the right template for the situation.

Real Time Content Marketing Result Dashboard Ppt Infographic Template Example PDF
The following slide depicts real time content marketing KPI dashboard to monitor traffic flow and manage promotional efforts. It includes elements such as visitors by channel, conversion rate, search, direct, sessions, average time engaged etc. The Real Time Content Marketing Result Dashboard Ppt Infographic Template Example PDF is a compilation of the most recent design trends as a series of slides. It is suitable for any subject or industry presentation, containing attractive visuals and photo spots for businesses to clearly express their messages. This template contains a variety of slides for the user to input data, such as structures to contrast two elements, bullet points, and slides for written information. Slidegeeks is prepared to create an impression.

Strategies For Dynamic Supply Chain Agility Supply Chain Kpi Dashboard For Effective Financial Analysis Demonstration PDF
Mentioned slide illustrates KPI dashboard that can be used by managers to assess financial health of supply chain business. KPIs covered are supply chain costs versus sales, cash to order cycle, warehouse operating cost distribution etc. The Strategies For Dynamic Supply Chain Agility Supply Chain Kpi Dashboard For Effective Financial Analysis Demonstration PDF is a compilation of the most recent design trends as a series of slides. It is suitable for any subject or industry presentation, containing attractive visuals and photo spots for businesses to clearly express their messages. This template contains a variety of slides for the user to input data, such as structures to contrast two elements, bullet points, and slides for written information. Slidegeeks is prepared to create an impression.
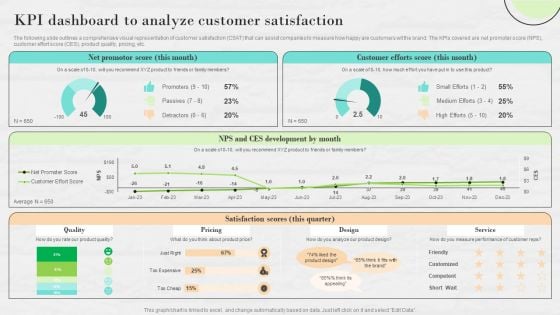
Market Research To Determine Business Opportunities KPI Dashboard To Analyze Customer Satisfaction Graphics PDF
The following slide outlines a comprehensive visual representation of customer satisfaction CSAT that can assist companies to measure how happy are customers wit the brand. The KPIs covered are net promoter score NPS, customer effort score CES, product quality, pricing, etc.Are you in need of a template that can accommodate all of your creative concepts This one is crafted professionally and can be altered to fit any style. Use it with Google Slides or PowerPoint. Include striking photographs, symbols, depictions, and other visuals. Fill, move around, or remove text boxes as desired. Test out color palettes and font mixtures. Edit and save your work, or work with colleagues. Download Market Research To Determine Business Opportunities KPI Dashboard To Analyze Customer Satisfaction Graphics PDF and observe how to make your presentation outstanding. Give an impeccable presentation to your group and make your presentation unforgettable.
Merchandise Launch Kickoff Playbook Product Launch Activities Tracking Dashboard Ideas PDF
This slide provides information regarding product launch activities tracking dashboard in terms of project budget, projected launch date, overdue tasks, workload, risks, etc. Get a simple yet stunning designed Merchandise Launch Kickoff Playbook Product Launch Activities Tracking Dashboard Ideas PDF. It is the best one to establish the tone in your meetings. It is an excellent way to make your presentations highly effective. So, download this PPT today from Slidegeeks and see the positive impacts. Our easy to edit Merchandise Launch Kickoff Playbook Product Launch Activities Tracking Dashboard Ideas PDF can be your go-to option for all upcoming conferences and meetings. So, what are you waiting for Grab this template today.
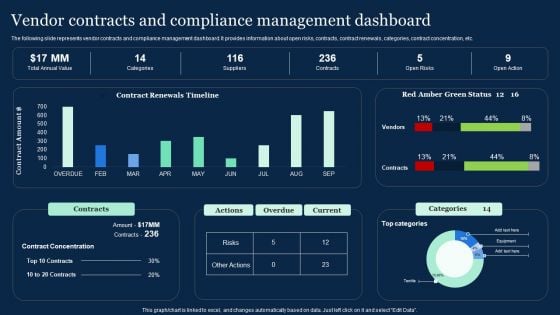
Vendor Contracts And Compliance Management Dashboard Effective Vendor Management For Enhancing Download PDF
The following slide represents vendor contracts and compliance management dashboard. It provides information about open risks, contracts, contract renewals, categories, contract concentration, etc. Get a simple yet stunning designed Vendor Contracts And Compliance Management Dashboard Effective Vendor Management For Enhancing Download PDF. It is the best one to establish the tone in your meetings. It is an excellent way to make your presentations highly effective. So, download this PPT today from Slidegeeks and see the positive impacts. Our easy-to-edit Vendor Contracts And Compliance Management Dashboard Effective Vendor Management For Enhancing Download PDF can be your go-to option for all upcoming conferences and meetings. So, what are you waiting for Grab this template today.
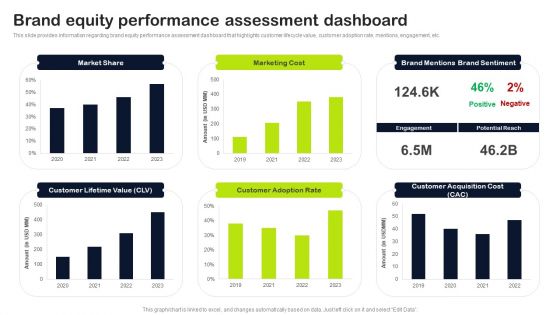
Key Elements Of Strategic Brand Administration Brand Equity Performance Assessment Dashboard Elements PDF
This slide provides information regarding brand equity performance assessment dashboard that highlights customer lifecycle value, customer adoption rate, mentions, engagement, etc. Get a simple yet stunning designed Key Elements Of Strategic Brand Administration Brand Equity Performance Assessment Dashboard Elements PDF. It is the best one to establish the tone in your meetings. It is an excellent way to make your presentations highly effective. So, download this PPT today from Slidegeeks and see the positive impacts. Our easy-to-edit Key Elements Of Strategic Brand Administration Brand Equity Performance Assessment Dashboard Elements PDF can be your go-to option for all upcoming conferences and meetings. So, what are you waiting for Grab this template today.
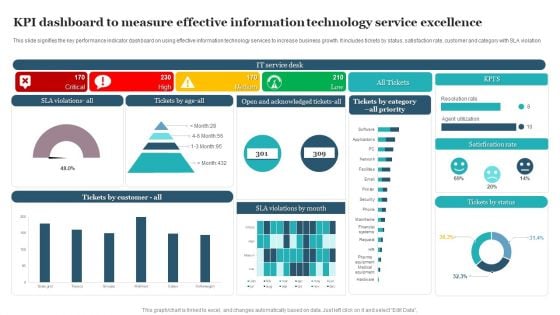
KPI Dashboard To Measure Effective Information Technology Service Excellence Information PDF
This slide signifies the key performance indicator dashboard on using effective information technology services to increase business growth. It includes tickets by status, satisfaction rate, customer and category with SLA violation. Showcasing this set of slides titled KPI Dashboard To Measure Effective Information Technology Service Excellence Information PDF. The topics addressed in these templates are Satisfication Rate, Tickets Status, Service Desk. All the content presented in this PPT design is completely editable. Download it and make adjustments in color, background, font etc. as per your unique business setting.

Driving Business Value With Internet Of Things Dashboard Ppt PowerPoint Presentation Complete Deck
Improve your presentation delivery using this driving business value with internet of things dashboard ppt powerpoint presentation complete deck. Support your business vision and objectives using this well-structured PPT deck. This template offers a great starting point for delivering beautifully designed presentations on the topic of your choice. Comprising twelve slides this professionally designed template is all you need to host discussion and meetings with collaborators. Each slide is self-explanatory and equipped with high-quality graphics that can be adjusted to your needs. Therefore, you will face no difficulty in portraying your desired content using this PPT slideshow. This PowerPoint slideshow contains every important element that you need for a great pitch. It is not only editable but also available for immediate download and utilization. The color, font size, background, shapes everything can be modified to create your unique presentation layout. Therefore, download it now.

Product Management KPI Dashboard Ppt PowerPoint Presentation Complete Deck With Slides
Improve your presentation delivery using this Product Management KPI Dashboard Ppt PowerPoint Presentation Complete Deck With Slides. Support your business vision and objectives using this well-structured PPT deck. This template offers a great starting point for delivering beautifully designed presentations on the topic of your choice. Comprising forteen this professionally designed template is all you need to host discussion and meetings with collaborators. Each slide is self-explanatory and equipped with high-quality graphics that can be adjusted to your needs. Therefore, you will face no difficulty in portraying your desired content using this PPT slideshow. This PowerPoint slideshow contains every important element that you need for a great pitch. It is not only editable but also available for immediate download and utilization. The color, font size, background, shapes everything can be modified to create your unique presentation layout. Therefore, download it now.
Successful Brand Management Customer Tracking Dashboard To Monitor Brand Loyalty Elements PDF
This slide provides information brand loyalty tracking dashboard in order to monitor customer engagement, average revenues, new vs. returning visitors performance, etc. This Successful Brand Management Customer Tracking Dashboard To Monitor Brand Loyalty Elements PDF is perfect for any presentation, be it in front of clients or colleagues. It is a versatile and stylish solution for organizing your meetings. The Successful Brand Management Customer Tracking Dashboard To Monitor Brand Loyalty Elements PDF features a modern design for your presentation meetings. The adjustable and customizable slides provide unlimited possibilities for acing up your presentation. Slidegeeks has done all the homework before launching the product for you. So, dont wait, grab the presentation templates today.
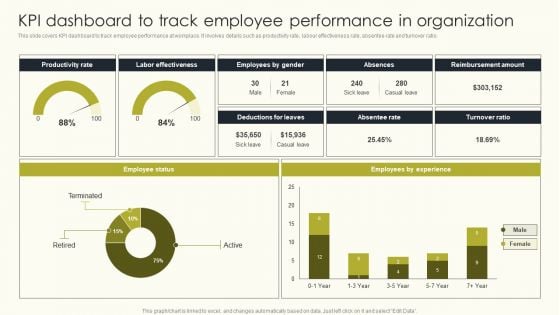
Employee Performance Management To Enhance Organizational Growth KPI Dashboard To Track Employee Topics PDF
The Employee Performance Management To Enhance Organizational Growth KPI Dashboard To Track Employee Topics PDF is a compilation of the most recent design trends as a series of slides. It is suitable for any subject or industry presentation, containing attractive visuals and photo spots for businesses to clearly express their messages. This template contains a variety of slides for the user to input data, such as structures to contrast two elements, bullet points, and slides for written information. Slidegeeks is prepared to create an impression.
Comprehensive Guide On Current Strategies Performance Tracking Dashboard For Food Product
The slide showcases dashboard representing food and beverage business performance tracking tool, which assist to evaluate monthly performance of employees, customer retention etc. Are you searching for a Comprehensive Guide On Current Strategies Performance Tracking Dashboard For Food Product that is uncluttered, straightforward, and original Its easy to edit, and you can change the colors to suit your personal or business branding. For a presentation that expresses how much effort you have put in, this template is ideal With all of its features, including tables, diagrams, statistics, and lists, its perfect for a business plan presentation. Make your ideas more appealing with these professional slides. Download Comprehensive Guide On Current Strategies Performance Tracking Dashboard For Food Product from Slidegeeks today. The slide showcases dashboard representing food and beverage business performance tracking tool, which assist to evaluate monthly performance of employees, customer retention etc.
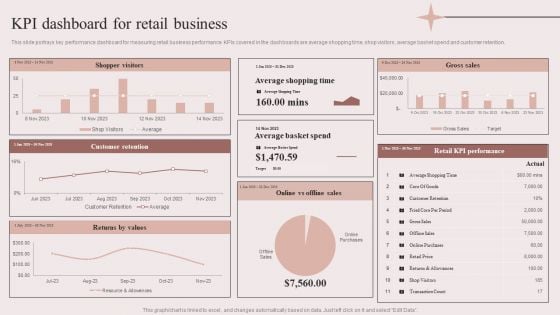
Enhancing Retail Process By Effective Inventory Management KPI Dashboard For Retail Business Inspiration PDF
This slide portrays key performance dashboard for measuring retail business performance. KPIs covered in the dashboards are average shopping time, shop visitors, average basket spend and customer retention. If you are looking for a format to display your unique thoughts, then the professionally designed Enhancing Retail Process By Effective Inventory Management KPI Dashboard For Retail Business Inspiration PDF is the one for you. You can use it as a Google Slides template or a PowerPoint template. Incorporate impressive visuals, symbols, images, and other charts. Modify or reorganize the text boxes as you desire. Experiment with shade schemes and font pairings. Alter, share or cooperate with other people on your work. Download Enhancing Retail Process By Effective Inventory Management KPI Dashboard For Retail Business Inspiration PDF and find out how to give a successful presentation. Present a perfect display to your team and make your presentation unforgettable.
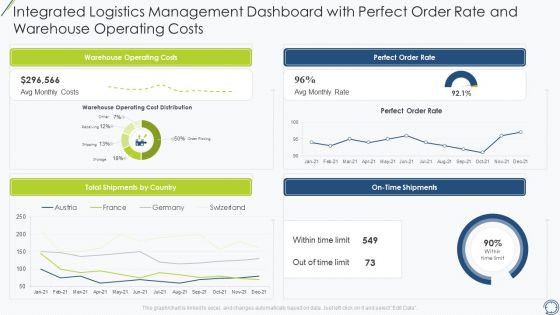
Integrated Logistics Management Dashboard With Perfect Order Rate And Warehouse Operating Costs Information PDF
Deliver and pitch your topic in the best possible manner with this integrated logistics management dashboard with perfect order rate and warehouse operating costs information pdf. Use them to share invaluable insights on perfect order rate, warehouse, costs and impress your audience. This template can be altered and modified as per your expectations. So, grab it now.
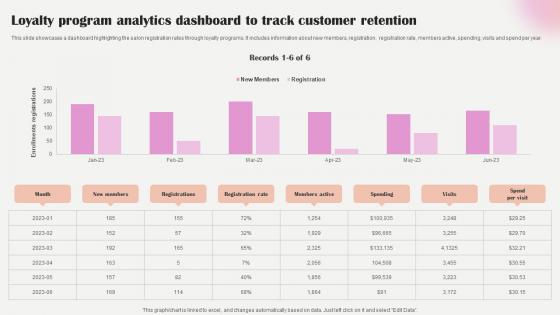
Salon Marketing Plan To Optimize Loyalty Program Analytics Dashboard To Track Strategy SS V
This slide showcases a dashboard highlighting the salon registration rates through loyalty programs. It includes information about new members, registration, registration rate, members active, spending, visits and spend per year. Get a simple yet stunning designed Salon Marketing Plan To Optimize Loyalty Program Analytics Dashboard To Track Strategy SS V. It is the best one to establish the tone in your meetings. It is an excellent way to make your presentations highly effective. So, download this PPT today from Slidegeeks and see the positive impacts. Our easy-to-edit Salon Marketing Plan To Optimize Loyalty Program Analytics Dashboard To Track Strategy SS V can be your go-to option for all upcoming conferences and meetings. So, what are you waiting for Grab this template today. This slide showcases a dashboard highlighting the salon registration rates through loyalty programs. It includes information about new members, registration, registration rate, members active, spending, visits and spend per year.
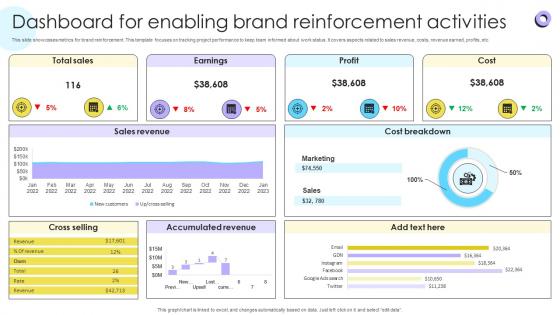
Dashboard For Enabling Brand Reinforcement Encouraging Repetitive Customer Purchase Ppt Slide
This slide showcases metrics for brand reinforcement. This template focuses on tracking project performance to keep team informed about work status. It covers aspects related to sales revenue, costs, revenue earned, profits, etc. From laying roadmaps to briefing everything in detail, our templates are perfect for you. You can set the stage with your presentation slides. All you have to do is download these easy-to-edit and customizable templates. Dashboard For Enabling Brand Reinforcement Encouraging Repetitive Customer Purchase Ppt Slide will help you deliver an outstanding performance that everyone would remember and praise you for. Do download this presentation today. This slide showcases metrics for brand reinforcement. This template focuses on tracking project performance to keep team informed about work status. It covers aspects related to sales revenue, costs, revenue earned, profits, etc.
CRM Pipeline Administration Customer Deal Tracking In Sales Pipeline Dashboard Ppt Inspiration Template PDF
This slide covers information regarding dashboard for tracking various customer deals in sales pipeline. From laying roadmaps to briefing everything in detail, our templates are perfect for you. You can set the stage with your presentation slides. All you have to do is download these easy-to-edit and customizable templates. CRM Pipeline Administration Customer Deal Tracking In Sales Pipeline Dashboard Ppt Inspiration Template PDF will help you deliver an outstanding performance that everyone would remember and praise you for. Do download this presentation today.
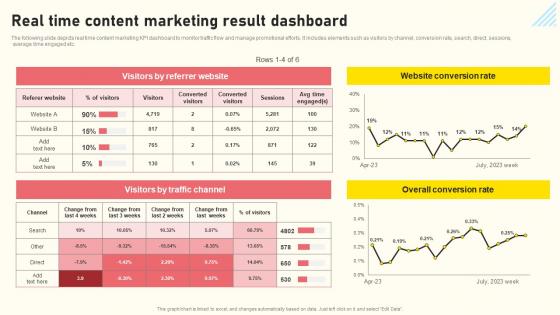
Effective Real Time Marketing Principles Real Time Content Marketing Result Dashboard Mockup Pdf
The following slide depicts real time content marketing KPI dashboard to monitor traffic flow and manage promotional efforts. It includes elements such as visitors by channel, conversion rate, search, direct, sessions, average time engaged etc. From laying roadmaps to briefing everything in detail, our templates are perfect for you. You can set the stage with your presentation slides. All you have to do is download these easy-to-edit and customizable templates. Effective Real Time Marketing Principles Real Time Content Marketing Result Dashboard Mockup Pdf will help you deliver an outstanding performance that everyone would remember and praise you for. Do download this presentation today. The following slide depicts real time content marketing KPI dashboard to monitor traffic flow and manage promotional efforts. It includes elements such as visitors by channel, conversion rate, search, direct, sessions, average time engaged etc.
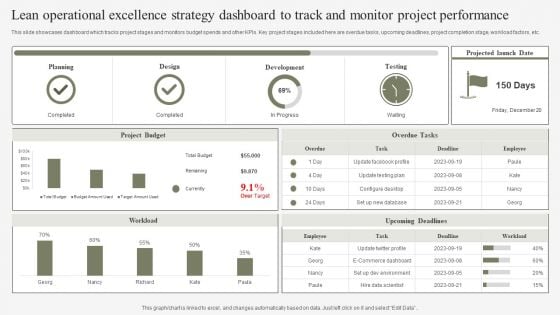
Lean Operational Excellence Strategy Dashboard To Track And Monitor Project Performance Slides PDF
This slide showcases dashboard which tracks project stages and monitors budget spends and other KPIs. Key project stages included here are overdue tasks, upcoming deadlines, project completion stage, workload factors, etc. Pitch your topic with ease and precision using this Lean Operational Excellence Strategy Dashboard To Track And Monitor Project Performance Slides PDF. This layout presents information on Planning, Design, Development. It is also available for immediate download and adjustment. So, changes can be made in the color, design, graphics or any other component to create a unique layout.
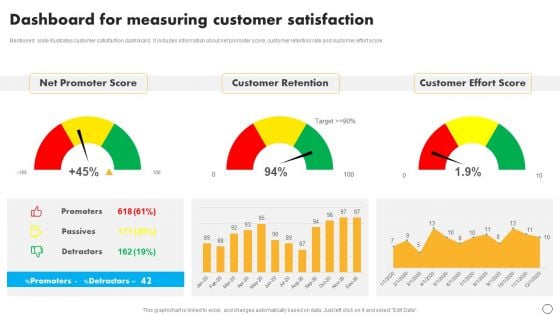
Retail Business Optimization Through Operational Excellence Strategy Dashboard Measuring Customer Template PDF
Mentioned slide illustrates customer satisfaction dashboard. It includes information about net promoter score, customer retention rate and customer effort score. Present like a pro with Retail Business Optimization Through Operational Excellence Strategy Dashboard Measuring Customer Template PDF Create beautiful presentations together with your team, using our easy to use presentation slides. Share your ideas in real time and make changes on the fly by downloading our templates. So whether you are in the office, on the go, or in a remote location, you can stay in sync with your team and present your ideas with confidence. With Slidegeeks presentation got a whole lot easier. Grab these presentations today.

HR Service Excellence Framework Helpdesk Dashboard To Track HR Service Delivery Effectiveness Clipart PDF
This slide provides information regarding helpdesk dashboard to track HR service delivery model effectiveness in terms of monitoring case resolution rate, employee self service effectiveness, knowledge base effectiveness, etc. Find a pre designed and impeccable HR Service Excellence Framework Helpdesk Dashboard To Track HR Service Delivery Effectiveness Clipart PDF. The templates can ace your presentation without additional effort. You can download these easy to edit presentation templates to make your presentation stand out from others. So, what are you waiting for Download the template from Slidegeeks today and give a unique touch to your presentation.


 Continue with Email

 Home
Home


