Data Quality Icon
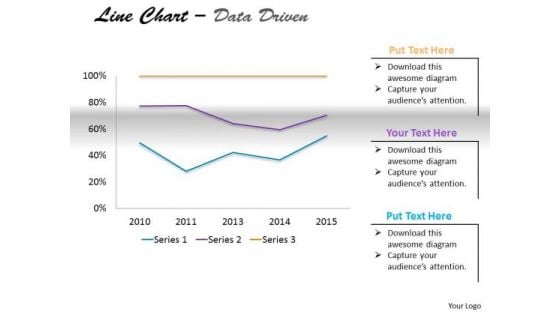
Multivariate Data Analysis Driven Market Line Chart PowerPoint Slides Templates
Delight Them With Our multivariate data analysis driven market line chart powerpoint slides Templates .
Assessment And Workflow Risks And Mitigation Strategies For Data Center Relocation Icons PDF
The following slide provides information about the risks involved in data center relocation process and the strategies that must be implemented in order to mitigate the risks. Major risks are unwanted downtime, data loss, data security and added latency. This modern and well-arranged Assessment And Workflow Risks And Mitigation Strategies For Data Center Relocation Icons PDF provides lots of creative possibilities. It is very simple to customize and edit with the Powerpoint Software. Just drag and drop your pictures into the shapes. All facets of this template can be edited with Powerpoint, no extra software is necessary. Add your own material, put your images in the places assigned for them, adjust the colors, and then you can show your slides to the world, with an animated slide included.

Data Analysis Excel Categorical Statistics Doughnut Chart PowerPoint Templates
Establish Your Dominion With Our data analysis excel categorical statistics doughnut chart Powerpoint Templates. Rule The Stage With Your Thoughts.
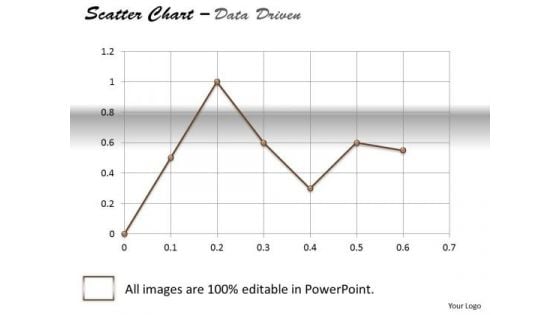
Data Analysis Excel Business Tool Scatter Chart PowerPoint Templates
Dominate Proceedings With Your Ideas. Our data analysis excel business tool scatter chart Powerpoint Templates Will Empower Your Thoughts.
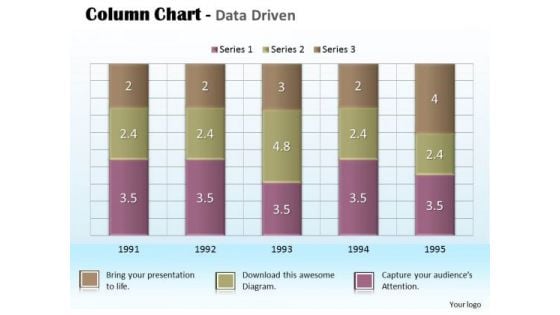
Business Data Analysis Chart For Project PowerPoint Templates
Document Your Views On Our business data analysis chart for project Powerpoint Templates. They Will Create A Strong Impression.
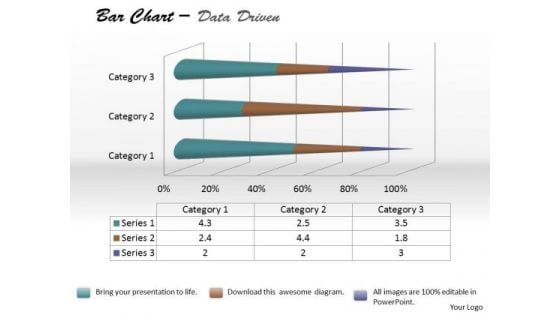
Data Analysis Bar Chart For Foreign Trade PowerPoint Templates
Be The Doer With Our data analysis bar chart for foreign trade Powerpoint Templates. Put Your Thoughts Into Practice.
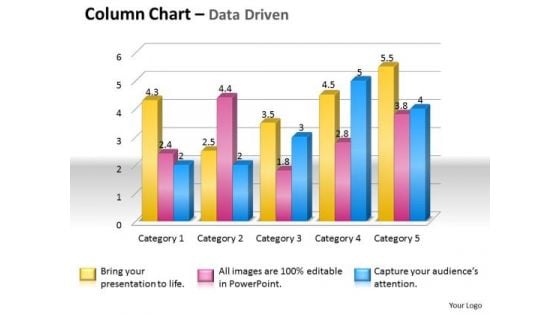
Data Analysis Techniques 3d Grouped Bar Chart PowerPoint Templates
Place The Orders With Your Thoughts. Our data analysis techniques 3d grouped bar chart Powerpoint Templates Know The Drill.
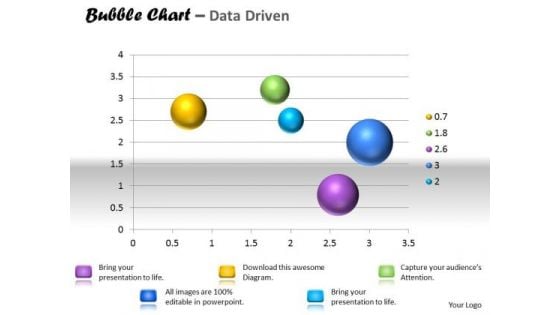
Data Analysis Template Interactive Bubble Chart PowerPoint Templates
Our data analysis template interactive bubble chart Powerpoint Templates Are A Wonder Drug. They Help Cure Almost Any Malaise.
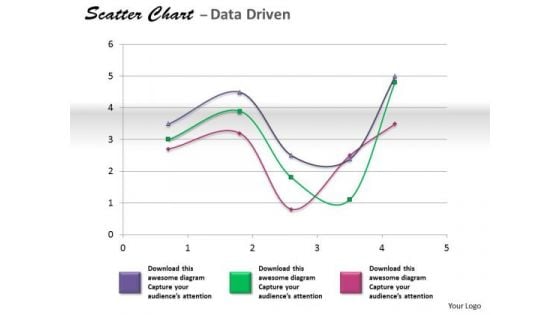
Financial Data Analysis Coordinate With Scatter Chart PowerPoint Templates
Get The Doers Into Action. Activate Them With Our financial data analysis coordinate with scatter chart Powerpoint Templates .
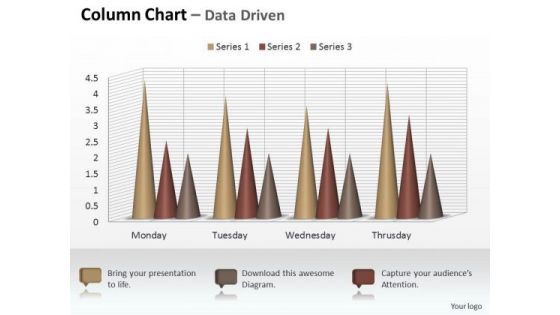
Marketing Data Analysis 3d Sets Of Column Chart PowerPoint Templates
Your Listeners Will Never Doodle. Our marketing data analysis 3d sets of column chart Powerpoint Templates Will Hold Their Concentration.
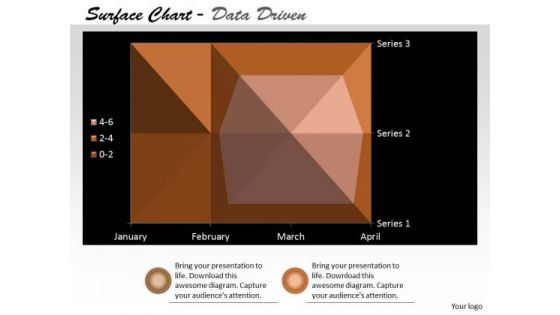
Multivariate Data Analysis Surface Chart Plots Trends PowerPoint Templates
Our multivariate data analysis surface chart plots trends Powerpoint Templates Heighten Concentration. Your Audience Will Be On The Edge.
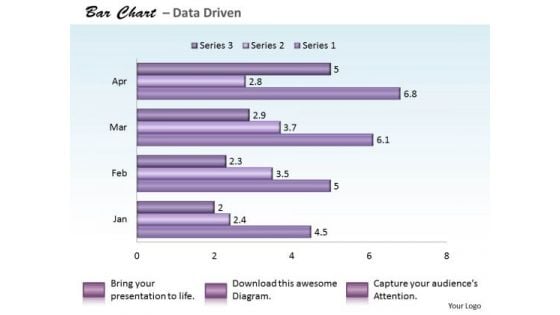
Quantitative Data Analysis Bar Chart For PowerPoint Templates
Reduce The Drag With Our quantitative data analysis bar chart for Powerpoint Templates . Give More Lift To Your Thoughts.

Data Analysis Techniques 3d Effective Display Chart PowerPoint Templates
Dribble Away With Our data analysis techniques 3d effective display chart Powerpoint Templates . Score A Goal With Your Ideas.
Components Of Data Risk Model With Icons Ppt PowerPoint Presentation Styles Design Inspiration PDF
Persuade your audience using this components of data risk model with icons ppt powerpoint presentation styles design inspiration pdf. This PPT design covers four stages, thus making it a great tool to use. It also caters to a variety of topics including organizational model, data discernment, analytics tools and methods, management, controls, and protection. Download this PPT design now to present a convincing pitch that not only emphasizes the topic but also showcases your presentation skills.
Business Intelligence And Big Industry Data Analytics Value Stream Model Icons PDF
This slide illustrates the workflow related to performing the data analytics project along with key responsible owners to accomplish the activities. This is a business intelligence and big industry data analytics value stream model icons pdf template with various stages. Focus and dispense information on four stages using this creative set, that comes with editable features. It contains large content boxes to add your information on topics like business manager, it system management, data miner, data analyst. You can also showcase facts, figures, and other relevant content using this PPT layout. Grab it now.
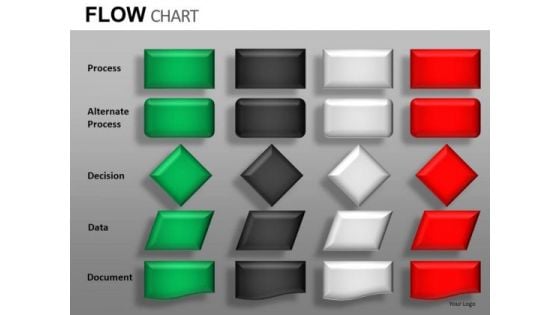
Process Data Document Symbols Flow Chart Poerpoint Slides
Process Data Document Symbols Flow Chart PoerPoint Slides-These high quality powerpoint pre-designed slides and powerpoint templates have been carefully created by our professional team to help you impress your audience. All slides have been created and are 100% editable in powerpoint. Each and every property of any graphic - color, size, orientation, shading, outline etc. can be modified to help you build an effective powerpoint presentation. Any text can be entered at any point in the powerpoint template or slide. Simply DOWNLOAD, TYPE and PRESENT!These PowerPoint Presentation slides can be used for themes relating to--Business, businessman, chain, chart, communication, community, company, concept, connection, contact, corporate, creativity, data, database, diagram, draw, drawing, education, executive, flow, flowchart, global, graphic, group, illustration, internet, isolated, job, manager, meeting, net, network, networking, office, organization, people, person, plan, presentation, relationship, screen, social, structure, success, team, teamwork, web, white, work, writing Our Process Data Document Symbols Flow Chart Poerpoint Slides deliver a blast for a buck. Just a bang is not good enough.
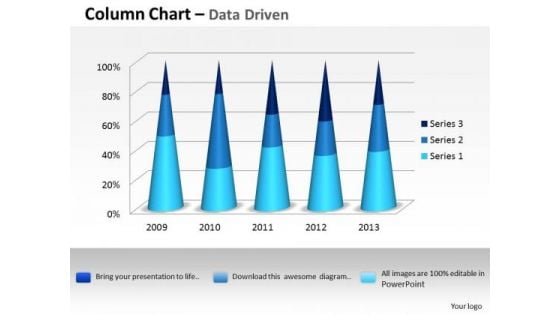
Data Analysis Excel 3d Process Variation Column Chart PowerPoint Templates
Put In A Dollop Of Our data analysis excel 3d process variation column chart Powerpoint Templates. Give Your Thoughts A Distinctive Flavor.
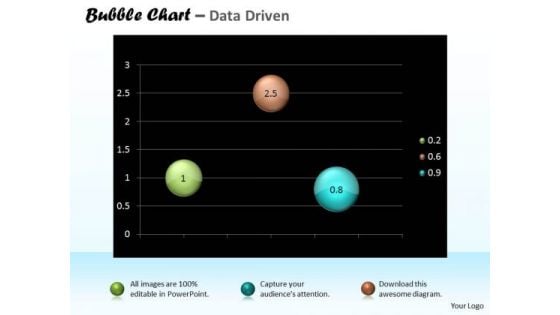
Data Analysis Excel Bubble Chart For Business Tasks PowerPoint Templates
Doll Up Your Thoughts With Our data analysis excel bubble chart for business tasks Powerpoint Templates. They Will Make A Pretty Picture.
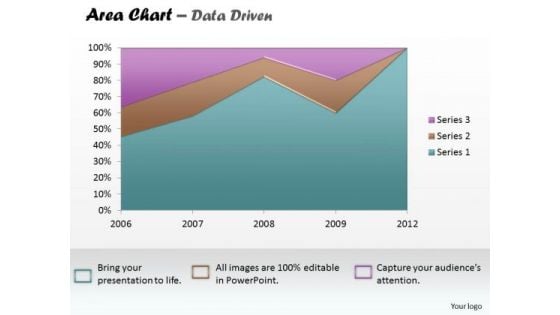
Data Analysis Excel Business Reporting Area Chart PowerPoint Templates
Establish The Dominance Of Your Ideas. Our data analysis excel business reporting area chart Powerpoint Templates Will Put Them On Top.
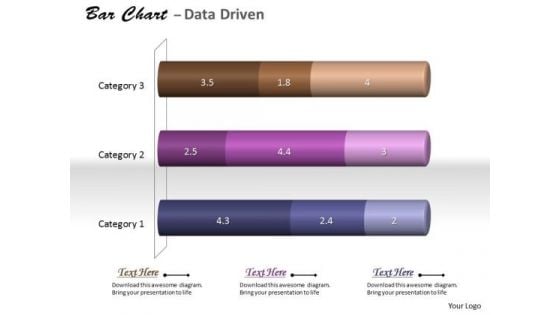
Data Analysis In Excel 3d Classification Of Chart PowerPoint Templates
With Our data analysis in excel 3d classification of chart Powerpoint Templates You Will Be Doubly Sure. They Possess That Stamp Of Authority.
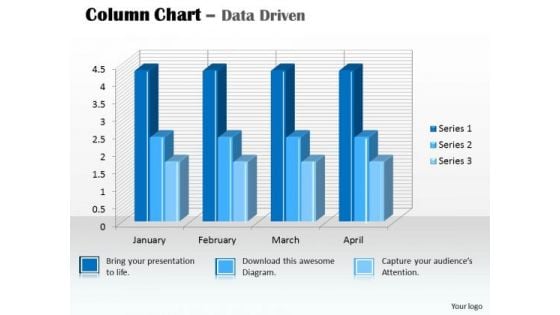
Data Analysis In Excel 3d Column Chart For PowerPoint Templates
Our data analysis in excel 3d column chart for Powerpoint Templates And Your Ideas Make A Great Doubles Pair. Play The Net With Assured Hands.
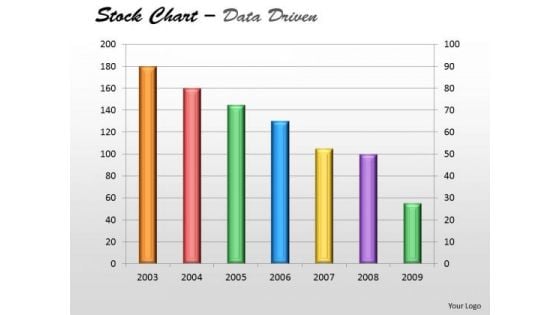
Data Analysis In Excel Of Stock Chart PowerPoint Templates
Plan Your Storyboard With Our data analysis in excel of stock chart Powerpoint Templates . Give An Outline To The Solutions You Have.

Microsoft Excel Data Analysis Bar Chart To Handle PowerPoint Templates
Our microsoft excel data analysis bar chart to handle Powerpoint Templates And Your Ideas Make A Great Doubles Pair. Play The Net With Assured Hands.
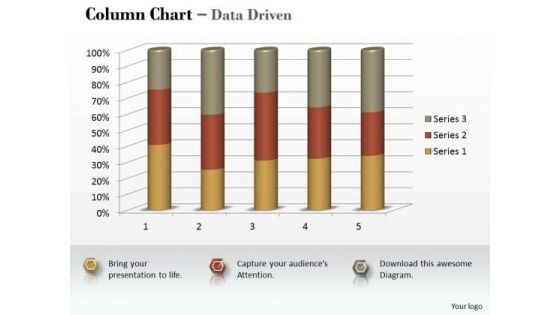
Marketing Data Analysis 3d Statistical Process Column Chart PowerPoint Templates
Be A Donor Of Great Ideas. Display Your Charity On Our marketing data analysis 3d statistical process column chart Powerpoint Templates .
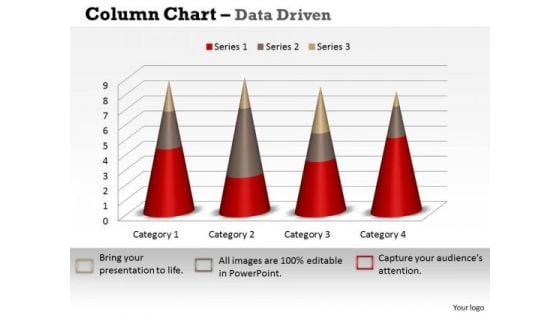
Marketing Data Analysis 3d Statistical Process Control Chart PowerPoint Templates
Open Up Doors That Lead To Success. Our marketing data analysis 3d statistical process control chart Powerpoint Templates Provide The Handles.

Data Analysis Excel Bar Graph To Compare PowerPoint Templates
Get The Domestics Right With Our data analysis excel bar graph to compare Powerpoint Templates. Create The Base For Thoughts To Grow.
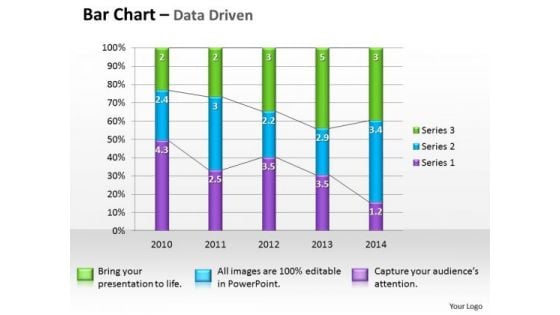
Microsoft Excel Data Analysis Bar Graph PowerPoint Templates
Double The Impact With Our microsoft excel data analysis bar graph Powerpoint Templates . Your Thoughts Will Have An Imposing Effect.

Business Data Analysis Chart For Case Studies PowerPoint Templates
Get Out Of The Dock With Our business data analysis chart for case studies Powerpoint Templates. Your Mind Will Be Set Free.
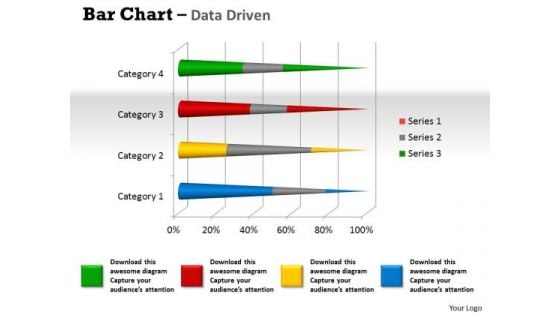
Data Analysis Programs 3d Bar Chart To Dispaly PowerPoint Templates
Lower The Drawbridge With Our data analysis programs 3d bar chart to dispaly Powerpoint Templates . Capture The Minds Of Your Audience.
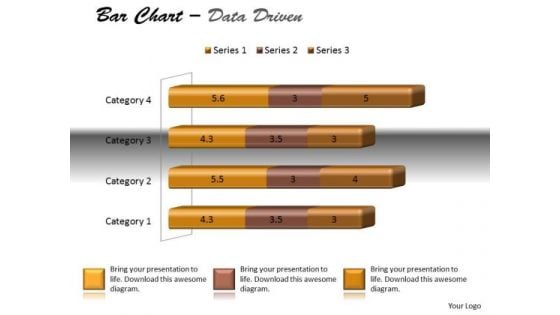
Data Analysis Techniques 3d Bar Chart For Modification PowerPoint Templates
Dreams Generate Thoughts, Thoughts Generate Ideas. Give Them Life With Our data analysis techniques 3d bar chart for modification Powerpoint Templates .
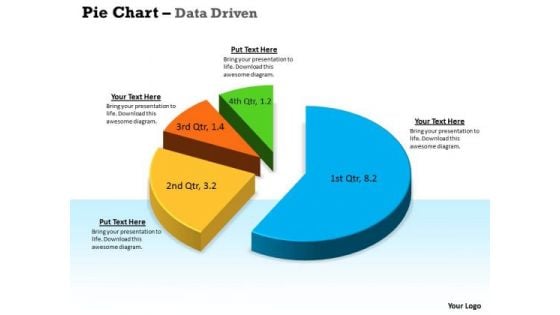
Data Analysis Techniques 3d In Segments Pie Chart PowerPoint Templates
Drink To The Success Of Your Campaign. Our data analysis techniques 3d in segments pie chart Powerpoint Templates Will Raise A Toast.
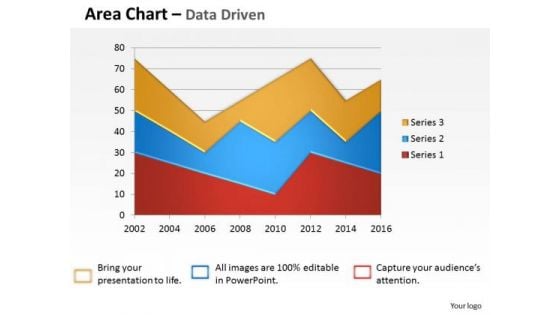
Data Analysis Template Driven Visualization Area Chart PowerPoint Slides Templates
Draw On The Energy Of Our data analysis template driven visualization area chart powerpoint slides Templates . Your Thoughts Will Perk Up.
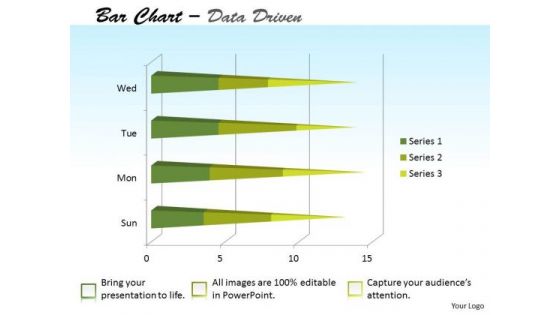
Data Analysis Template Forex Market Bar Chart PowerPoint Templates
Attract A Crowd With Our data analysis template forex market bar chart Powerpoint Templates . They Will Drop It All And Come To Hear You.
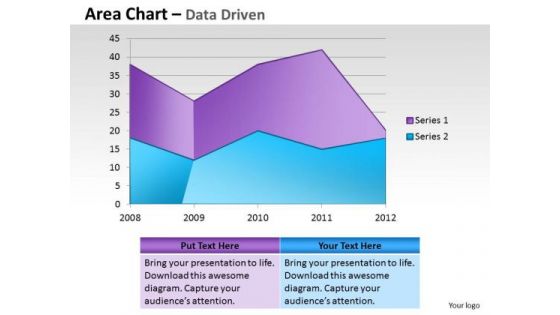
Financial Data Analysis Area Chart For Showing Trends PowerPoint Templates
Document Your Views On Our financial data analysis area chart for showing trends Powerpoint Templates . They Will Create A Strong Impression.
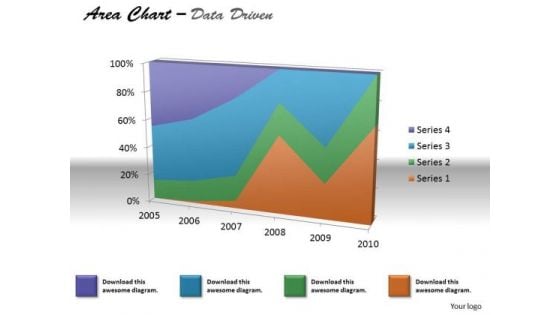
Financial Data Analysis Area Chart For Various Values PowerPoint Templates
Document The Process On Our financial data analysis area chart for various values Powerpoint Templates . Make A Record Of Every Detail.
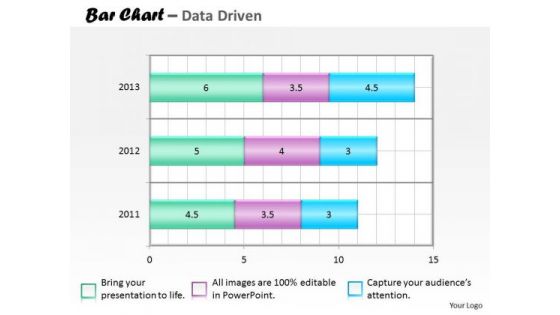
Financial Data Analysis Bar Chart For Collection Of PowerPoint Templates
Our financial data analysis bar chart for collection of Powerpoint Templates Team Are A Dogged Lot. They Keep At It Till They Get It Right.
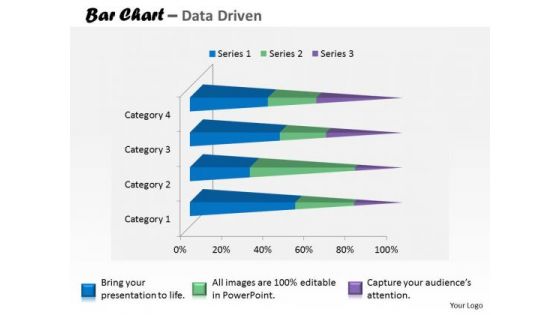
Financial Data Analysis Currency Trading Bar Chart PowerPoint Templates
Put In A Dollop Of Our financial data analysis currency trading bar chart Powerpoint Templates . Give Your Thoughts A Distinctive Flavor.
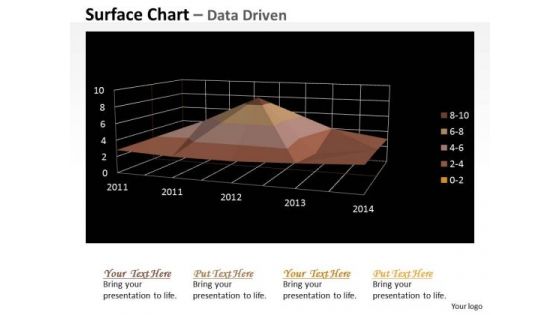
Multivariate Data Analysis Numeric Values Surface Chart PowerPoint Templates
Your Grasp Of Economics Is Well Known. Help Your Audience Comprehend Issues With Our multivariate data analysis numeric values surface chart Powerpoint Templates .
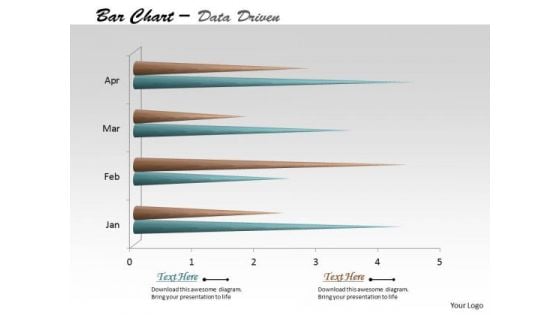
Multivariate Data Analysis Time Based Bar Chart PowerPoint Templates
Edit Your Work With Our multivariate data analysis time based bar chart Powerpoint Templates . They Will Help You Give The Final Form.
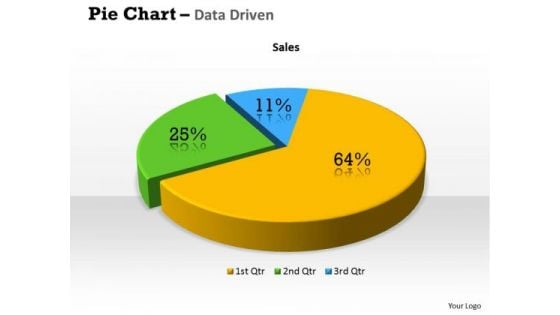
Quantitative Data Analysis 3d Percentage Ratio Pie Chart PowerPoint Templates
Plan Your Storyboard With Our quantitative data analysis 3d percentage ratio pie chart Powerpoint Templates . Give An Outline To The Solutions You Have.
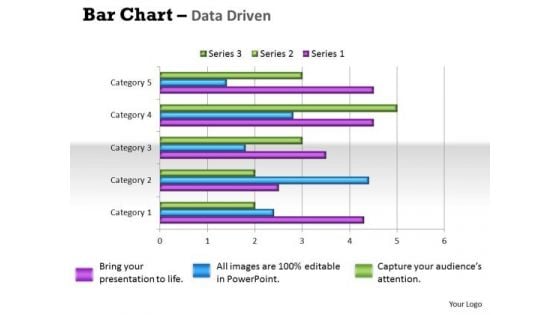
Quantitative Data Analysis Bar Chart For Different Categories PowerPoint Templates
Make Some Dough With Our quantitative data analysis bar chart for different categories Powerpoint Templates . Your Assets Will Rise Significantly.
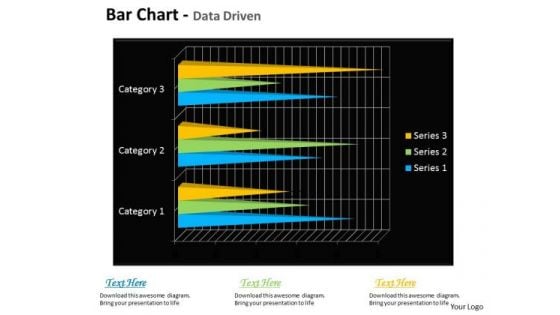
Quantitative Data Analysis Bar Chart For Financial Markets PowerPoint Templates
Draft It Out On Our quantitative data analysis bar chart for financial markets Powerpoint Templates . Give The Final Touches With Your Ideas.
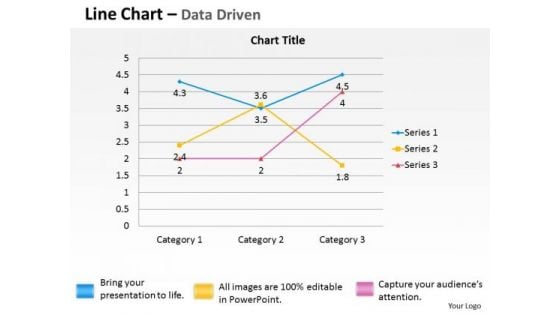
Quantitative Data Analysis Driven Economic Line Chart PowerPoint Slides Templates
Break The Deadlock With Our quantitative data analysis driven economic line chart powerpoint slides Templates . Let The Words Start To Flow.
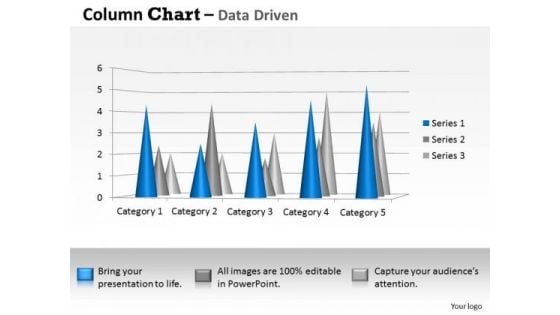
Data Analysis Techniques 3d Distribution Of In Sets PowerPoint Templates
Your Thoughts Will Be The Main Course. Provide The Dressing With Our data analysis techniques 3d distribution of in sets Powerpoint Templates .
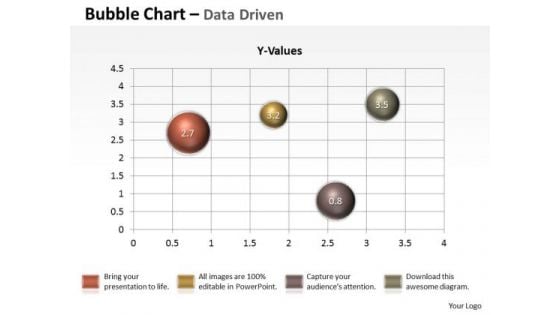
Data Analysis Techniques 3d Graphical Presentation Of PowerPoint Templates
Our data analysis techniques 3d graphical presentation of Powerpoint Templates Will Follow The Drill. They Accomplish The Task Assigned To Them.
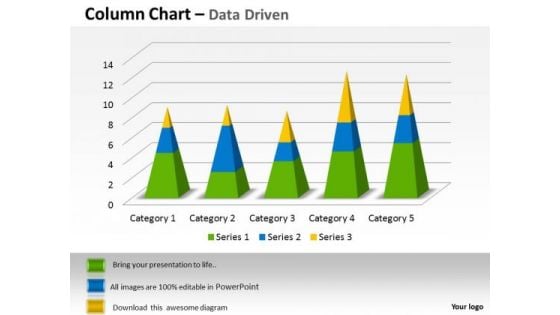
Examples Of Data Analysis Market 3d Categories Sets PowerPoint Templates
Our examples of data analysis market 3d categories sets Powerpoint Templates Give Your Thoughts Their Due. They Project Them With Full Intensity.
Identifying Direct And Indirect Determine Quantifiable Value With Indirect Data Icons PDF
This slide covers provides details about calculating quantifiable value due to indirect data monetization which leads overall improvement of operational processes, increment in sales and cost reduction. Are you in need of a template that can accommodate all of your creative concepts This one is crafted professionally and can be altered to fit any style. Use it with Google Slides or PowerPoint. Include striking photographs, symbols, depictions, and other visuals. Fill, move around, or remove text boxes as desired. Test out color palettes and font mixtures. Edit and save your work, or work with colleagues. Download Identifying Direct And Indirect Determine Quantifiable Value With Indirect Data Icons PDF and observe how to make your presentation outstanding. Give an impeccable presentation to your group and make your presentation unforgettable.
Data Management Best Practices With Icons Ppt PowerPoint Presentation Pictures Guidelines
This is a data management best practices with icons ppt powerpoint presentation pictures guidelines. This is a five stage process. The stages in this process are data flow, data management, big data.
Data Management Steps With Icons Ppt PowerPoint Presentation Infographic Template Deck
This is a data management steps with icons ppt powerpoint presentation infographic template deck. This is a five stage process. The stages in this process are data flow, data management, big data.
Data Process Management With Icons Ppt PowerPoint Presentation Infographic Template Images
This is a data process management with icons ppt powerpoint presentation infographic template images. This is a four stage process. The stages in this process are data flow, data management, big data.
Four Steps Data Process Management With Icons Ppt PowerPoint Presentation Slides Guide
This is a four steps data process management with icons ppt powerpoint presentation slides guide. This is a four stage process. The stages in this process are data flow, data management, big data.
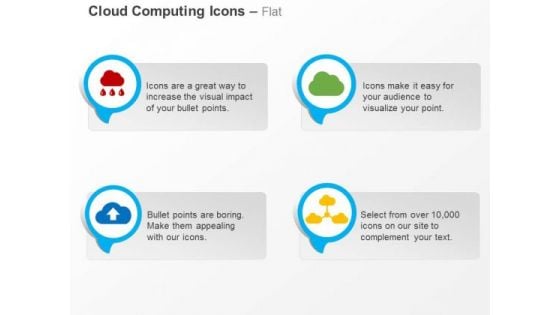
Data Share Upload Cloud Computing Networking Ppt Slides Graphics
red cloud, blue cloud and blue icons with networking graphic has been used to decorate this template. This editable template contains the concept of data share and upload technique on cloud computing. Use these icons for cloud computing related presentations and topics.
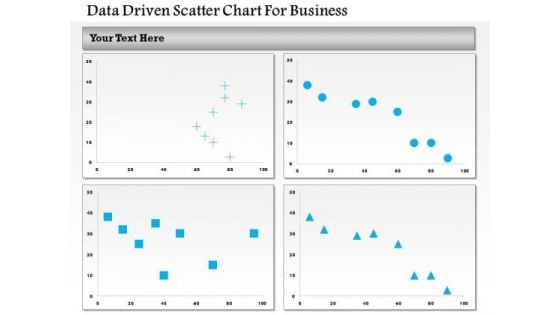
Business Diagram Data Driven Scatter Chart For Business PowerPoint Slide
This business diagram has been designed with four comparative charts. This slide suitable for data representation. You can also use this slide to present business analysis and reports. Use this diagram to present your views in a wonderful manner.
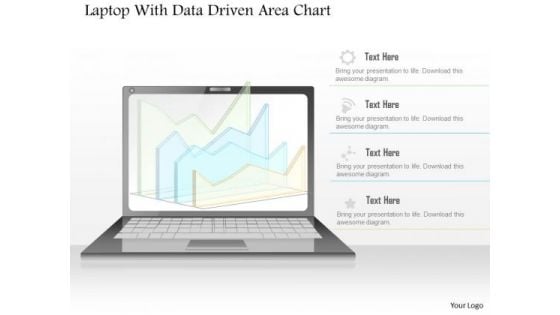
Business Diagram Laptop With Data Driven Area Chart PowerPoint Slide
This diagram has been designed with laptop and data driven area chart. Download this diagram to give your presentations more effective look. It helps in clearly conveying your message to clients and audience.
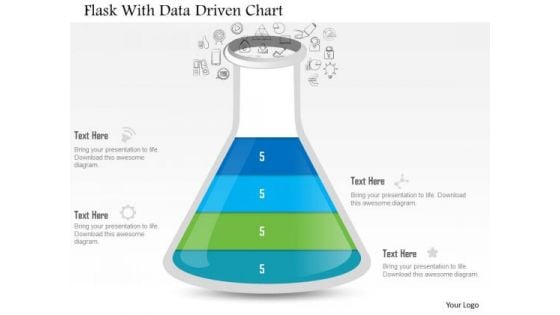
Business Diagram Flask With Data Driven Chart PowerPoint Slide
This data driven diagram has been designed with flask graphics. Download this diagram to give your presentations more effective look. It helps in clearly conveying your message to clients and audience.
Five Steps Of Data Storage With Icons Ppt PowerPoint Presentation Styles Samples
This is a five steps of data storage with icons ppt powerpoint presentation styles samples. This is a five stage process. The stages in this process are data flow, data management, big data.
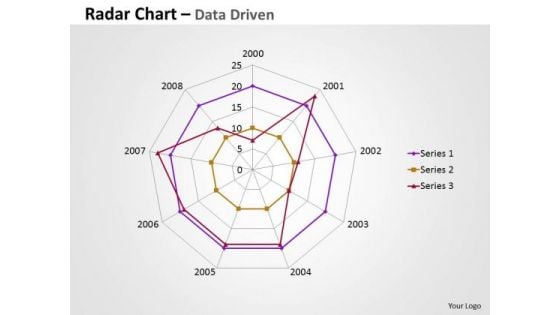
Business Data Analysis Chart Comparing Multiple Entities PowerPoint Templates
Analyze Ailments On Our business data analysis chart comparing multiple entities Powerpoint Templates. Bring Out The Thinking Doctor In You. Dock Your Thoughts With Our Financial Analysis . They Will Launch Them Into Orbit.
Characteristics And Advantages Data Modeling Approaches For Modern Analytics Icons Pdf
This slide explains the characteristics and advantages of a logical data model. It also contains impacts caused by the data models features, such as independent of physical data storage devices. Do you have to make sure that everyone on your team knows about any specific topic I yes, then you should give Characteristics And Advantages Data Modeling Approaches For Modern Analytics Icons Pdf a try. Our experts have put a lot of knowledge and effort into creating this impeccable Characteristics And Advantages Data Modeling Approaches For Modern Analytics Icons Pdf. You can use this template for your upcoming presentations, as the slides are perfect to represent even the tiniest detail. You can download these templates from the Slidegeeks website and these are easy to edit. So grab these today This slide explains the characteristics and advantages of a logical data model. It also contains impacts caused by the data models features, such as independent of physical data storage devices.
Key Features Of Data Management With Icons Ppt PowerPoint Presentation Slides Example Introduction
Presenting this set of slides with name key features of data management with icons ppt powerpoint presentation slides example introduction. This is a five stage process. The stages in this process are big data strategy, data governance strategy, big data technology. This is a completely editable PowerPoint presentation and is available for immediate download. Download now and impress your audience.
Five Stages Of Data Governance With Icons Ppt PowerPoint Presentation Summary Information
Presenting this set of slides with name five stages of data governance with icons ppt powerpoint presentation summary information. This is a five stage process. The stages in this process are big data strategy, data governance strategy, big data technology. This is a completely editable PowerPoint presentation and is available for immediate download. Download now and impress your audience.


 Continue with Email

 Home
Home


