Data Quality Icon
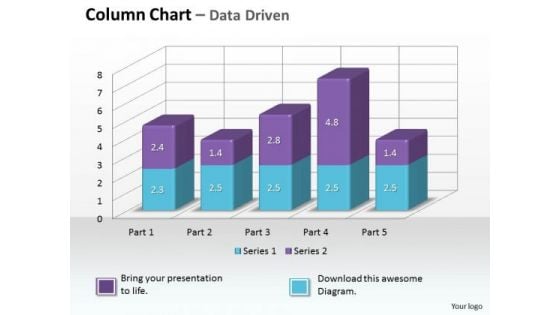
Data Analysis On Excel 3d Chart To Monitor Business Process PowerPoint Templates
Make Some Dough With Our data analysis on excel 3d chart to monitor business process Powerpoint Templates . Your Assets Will Rise Significantly.
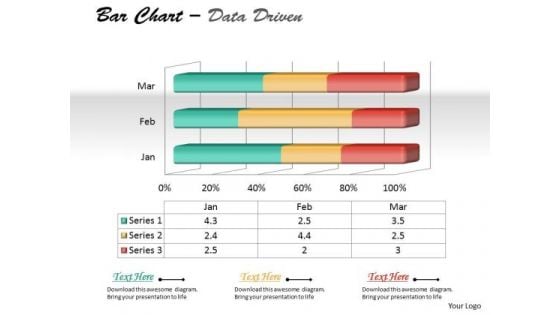
Data Analysis On Excel 3d Chart To Represent Quantitative Differences PowerPoint Templates
Draft It Out On Our data analysis on excel 3d chart to represent quantitative differences Powerpoint Templates . Give The Final Touches With Your Ideas.
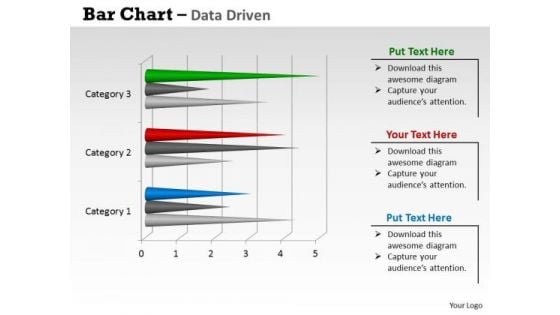
Data Analysis On Excel 3d Chart With Sets Of PowerPoint Templates
Reduce The Drag With Our data analysis on excel 3d chart with sets of Powerpoint Templates . Give More Lift To Your Thoughts.
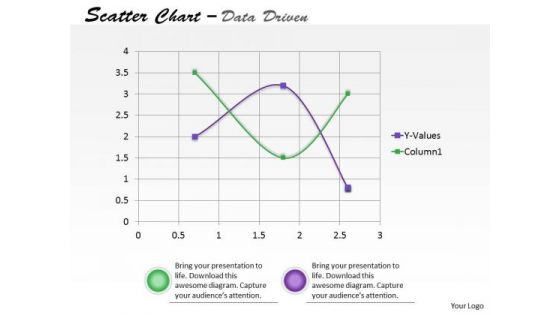
Data Analysis On Excel Driven Scatter Chart To Predict Future Movements PowerPoint Slides Templates
Our data analysis on excel driven scatter chart to predict future movements powerpoint slides Templates Enjoy Drama. They Provide Entertaining Backdrops.
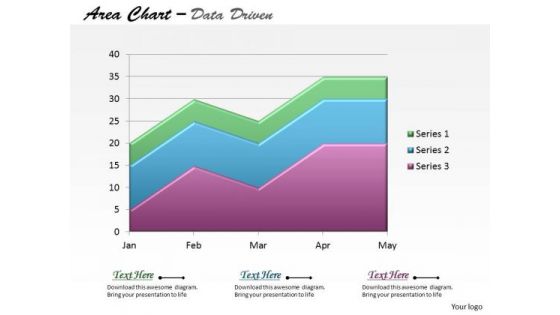
Data Analysis On Excel Driven Stacked Area Chart PowerPoint Slides Templates
Be The Dramatist With Our data analysis on excel driven stacked area chart powerpoint slides Templates . Script Out The Play Of Words.
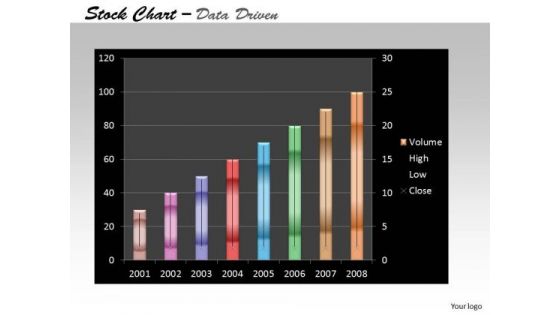
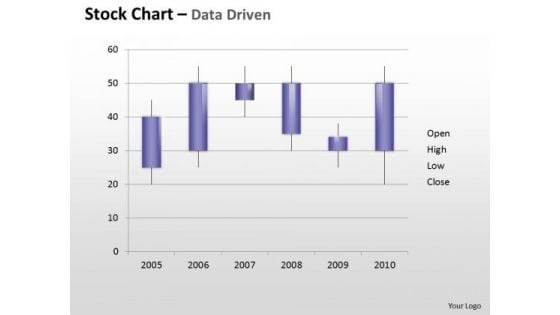
Data Analysis On Excel Driven Stock Chart For Business Growth PowerPoint Slides Templates
Add Some Dramatization To Your Thoughts. Our data analysis on excel driven stock chart for business growth powerpoint slides Templates Make Useful Props.
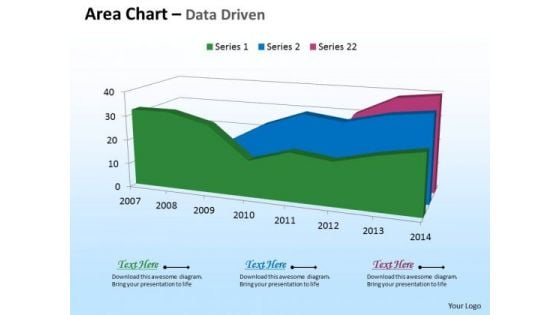
Microsoft Excel Data Analysis 3d Area Chart For Time Based PowerPoint Templates
Deliver The Right Dose With Our microsoft excel data analysis 3d area chart for time based Powerpoint Templates . Your Ideas Will Get The Correct Illumination.
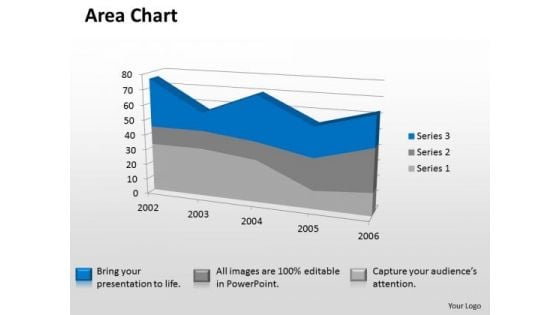
Microsoft Excel Data Analysis 3d Area Chart Showimg Change In Values PowerPoint Templates
Our microsoft excel data analysis 3d area chart showimg change in values Powerpoint Templates Deliver At Your Doorstep. Let Them In For A Wonderful Experience.
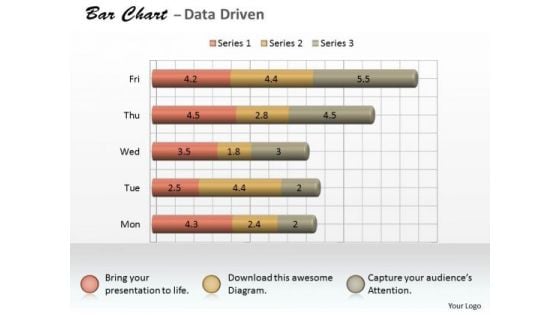
Microsoft Excel Data Analysis 3d Bar Chart As Research Tool PowerPoint Templates
Knock On The Door To Success With Our microsoft excel data analysis 3d bar chart as research tool Powerpoint Templates . Be Assured Of Gaining Entry.
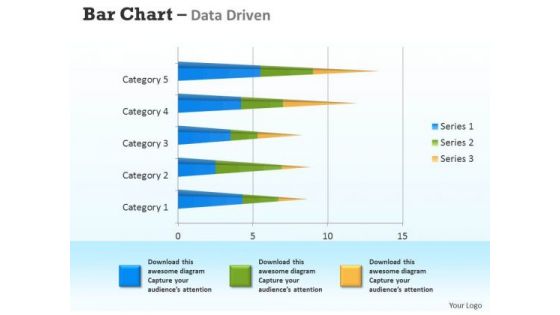
Microsoft Excel Data Analysis 3d Bar Chart For Analyzing Survey PowerPoint Templates
Connect The Dots With Our microsoft excel data analysis 3d bar chart for analyzing survey Powerpoint Templates . Watch The Whole Picture Clearly Emerge.
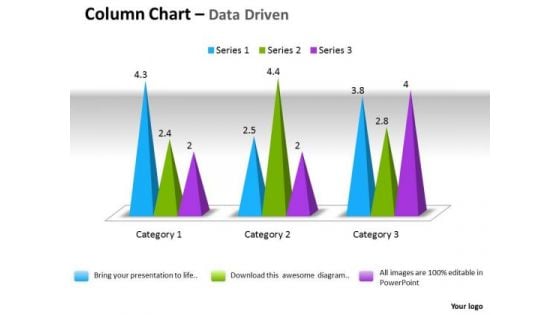
Microsoft Excel Data Analysis 3d Change In Business Process Chart PowerPoint Templates
Double Your Chances With Our microsoft excel data analysis 3d change in business process chart Powerpoint Templates . The Value Of Your Thoughts Will Increase Two-Fold.
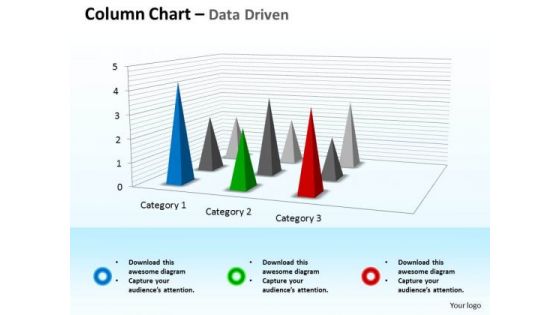
Microsoft Excel Data Analysis 3d Chart For Business Observation PowerPoint Templates
Double Up Our microsoft excel data analysis 3d chart for business observation Powerpoint Templates With Your Thoughts. They Will Make An Awesome Pair.
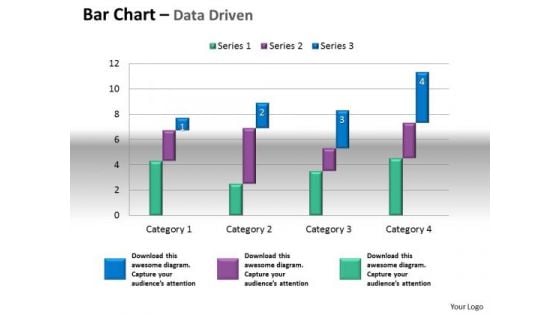
Microsoft Excel Data Analysis Bar Chart To Compare Quantities PowerPoint Templates
Our microsoft excel data analysis bar chart to compare quantities Powerpoint Templates Leave No One In Doubt. Provide A Certainty To Your Views.
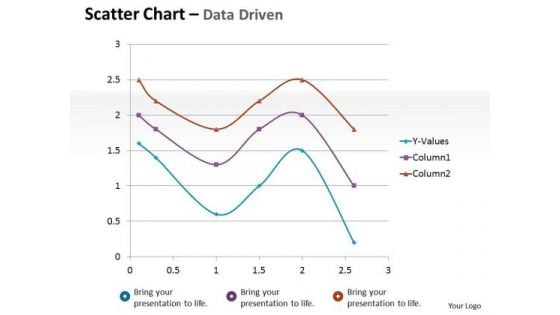
Financial Data Analysis Driven Scatter Chart Mathematical Diagram PowerPoint Slides Templates
Dominate Proceedings With Your Ideas. Our financial data analysis driven scatter chart mathematical diagram powerpoint slides Templates Will Empower Your Thoughts.

Data Analysis On Excel Driven Sets Of Business Information PowerPoint Slides Templates
Break The Deadlock With Our data analysis on excel driven sets of business information powerpoint slides Templates . Let The Words Start To Flow.
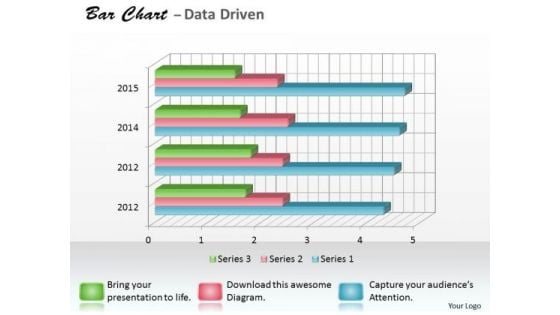
Data Analysis Programs 3d Bar Chart For Research In Statistics PowerPoint Templates
Draw It Out On Our data analysis programs 3d bar chart for research in statistics Powerpoint Templates . Provide Inspiration To Your Colleagues.
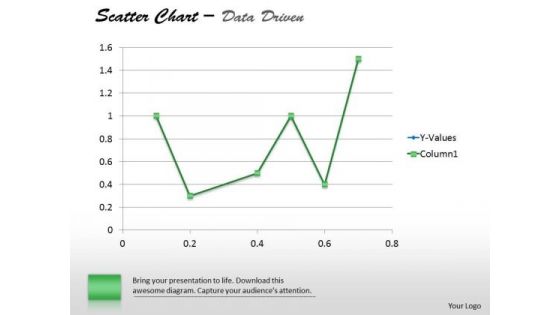
Financial Data Analysis Driven Demonstrate Statistics With Scatter Chart PowerPoint Slides Templates
Establish The Dominance Of Your Ideas. Our financial data analysis driven demonstrate statistics with scatter chart powerpoint slides Templates Will Put Them On Top.
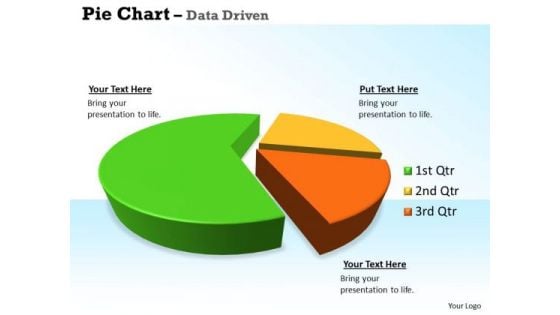
Quantitative Data Analysis 3d Pie Chart For Business Statistics PowerPoint Templates
Our quantitative data analysis 3d pie chart for business statistics Powerpoint Templates Allow You To Do It With Ease. Just Like Picking The Low Hanging Fruit.
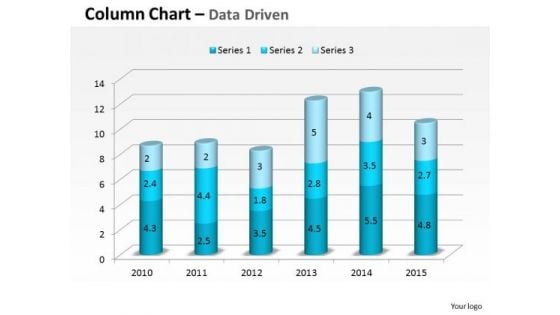
Data Analysis In Excel 3d Compare Yearly Business Performance PowerPoint Templates
Plan For All Contingencies With Our data analysis in excel 3d compare yearly business performance Powerpoint Templates . Douse The Fire Before It Catches.
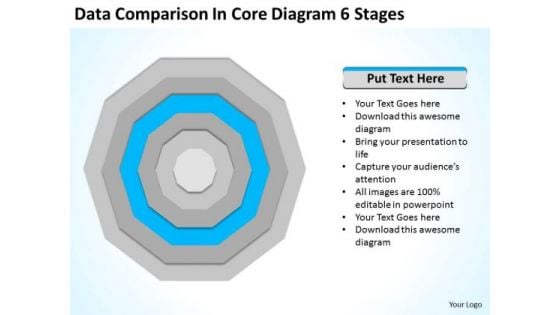
Data Comparison In Core Diagram 6 Stages Ppt Business Plans For PowerPoint Templates
We present our data comparison in core diagram 6 stages ppt business plans for PowerPoint templates.Present our Business PowerPoint Templates because It can Bubble and burst with your ideas. Download and present our Leadership PowerPoint Templates because You have the co-ordinates for your destination of success. Let our PowerPoint Templates and Slides map out your journey. Download and present our Layers PowerPoint Templates because Our PowerPoint Templates and Slides will Activate the energies of your audience. Get their creative juices flowing with your words. Present our Circle Charts PowerPoint Templates because Our PowerPoint Templates and Slides team portray an attitude of elegance. Personify this quality by using them regularly. Download our Shapes PowerPoint Templates because Our PowerPoint Templates and Slides will weave a web of your great ideas. They are gauranteed to attract even the most critical of your colleagues.Use these PowerPoint slides for presentations relating to Diagram, process, business, graphic, design, ideas, model, data, chart, project, schema, corporate, implementation, tag, plan, engineering, concept, vector, success, symbol, stack, circle, guide, work flow, development, shape, team, management, cycle, steps, illustration, system, strategy, objects, phase, professional, organization, implement, background, image, detail, structure, product. The prominent colors used in the PowerPoint template are Blue , Gray, White. Our Data Comparison In Core Diagram 6 Stages Ppt Business Plans For PowerPoint Templates are evidently advantageous. The balance will tilt in your favour.
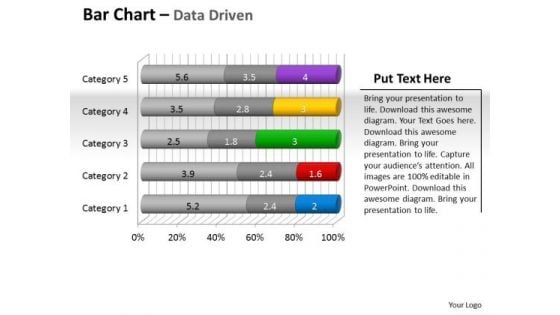
Data Analysis Programs 3d Bar Chart To Put Information PowerPoint Templates
Draw Up Your Agenda On Our data analysis programs 3d bar chart to put information Powerpoint Templates . Coax Your Audience Into Acceptance.
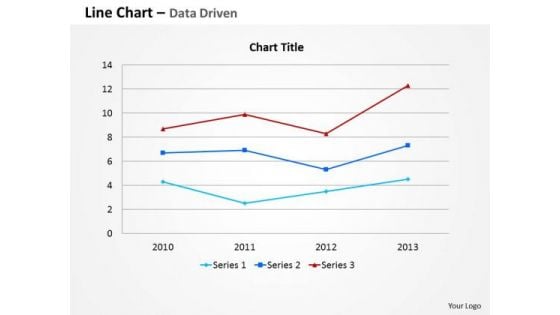
Data Analysis Template Driven Line Chart For Business Information PowerPoint Slides Templates
Your Thoughts Are Dripping With Wisdom. Lace It With Our data analysis template driven line chart for business information powerpoint slides Templates .
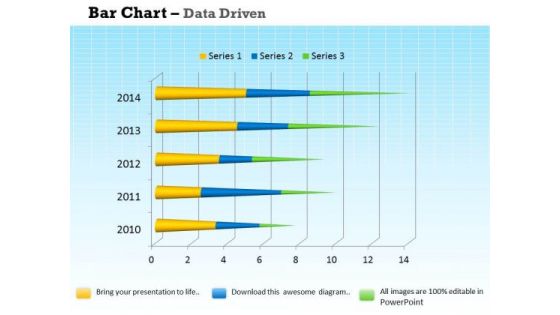
Data Analysis Programs 3d Bar Chart For Market Surveys PowerPoint Templates
Draw On The Experience Of Our data analysis programs 3d bar chart for market surveys Powerpoint Templates . They Imbibe From Past Masters.
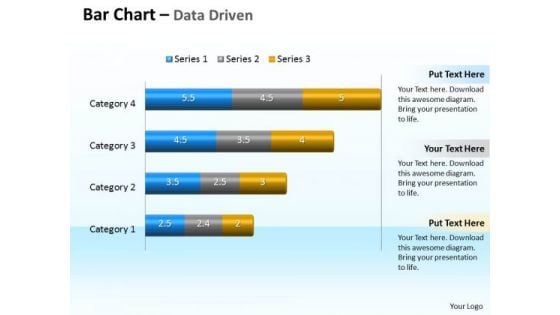
Data Analysis Programs 3d Bar Chart To Compare Categories PowerPoint Templates
Discover Decisive Moments With Our data analysis programs 3d bar chart to compare categories Powerpoint Templates . They Help Make That Crucial Difference.
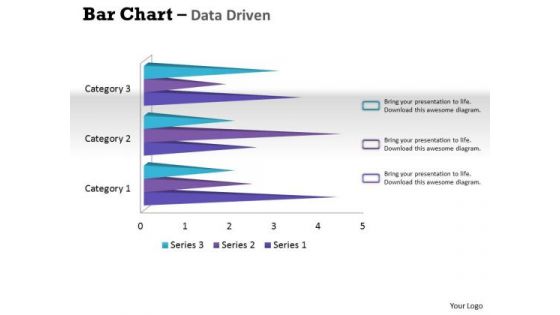
Data Analysis Techniques 3d Bar Chart For Financial Solutions PowerPoint Templates
Make Your Dreams A Reality With Our data analysis techniques 3d bar chart for financial solutions Powerpoint Templates . Your Ideas Will Begin To Take Shape.

Data Analysis Template Driven Express Business Facts Pie Chart PowerPoint Slides Templates
Display Your Drive On Our data analysis template driven express business facts pie chart powerpoint slides Templates . Invigorate The Audience With Your Fervor.
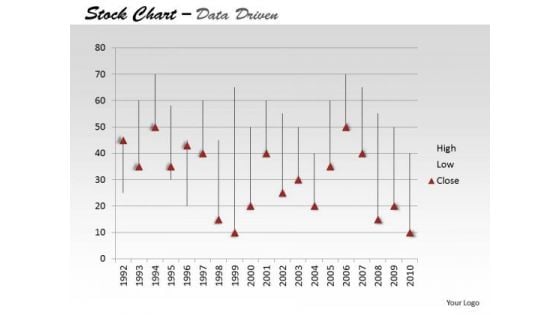
Data Analysis Template Driven Ineract With Stock Chart PowerPoint Slides Templates
Drive Your Passion With Our data analysis template driven ineract with stock chart powerpoint slides Templates . Steer Yourself To Achieve Your Aims.
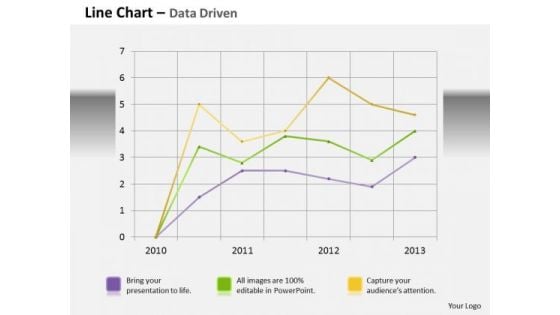
Data Analysis Template Driven Line Chart Business Graph PowerPoint Slides Templates
Bottle Your Thoughts In Our data analysis template driven line chart business graph powerpoint slides Templates . Pass It Around For Your Audience To Sip.
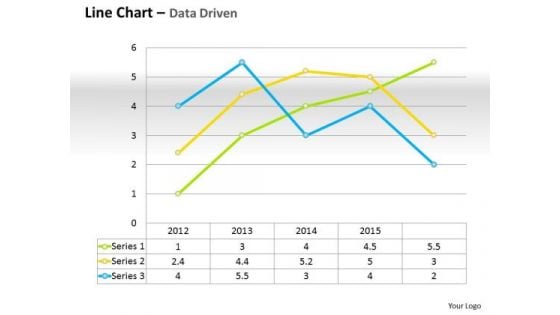
Data Analysis Template Driven Line Chart For Business Performance PowerPoint Slides Templates
Do Not Allow Things To Drift. Ring In Changes With Our data analysis template driven line chart for business performance powerpoint slides Templates .
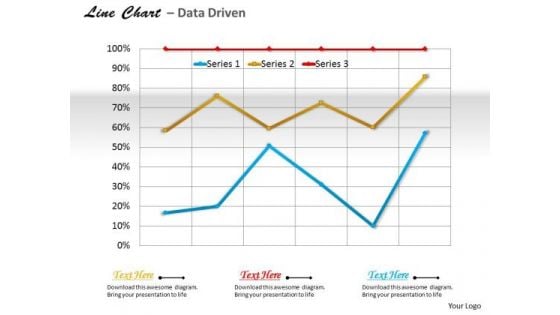
Data Analysis Template Driven Line Chart For Business Trends PowerPoint Slides Templates
Use Our data analysis template driven line chart for business trends powerpoint slides Templates As The Bit. Drill Your Thoughts Into Their Minds.
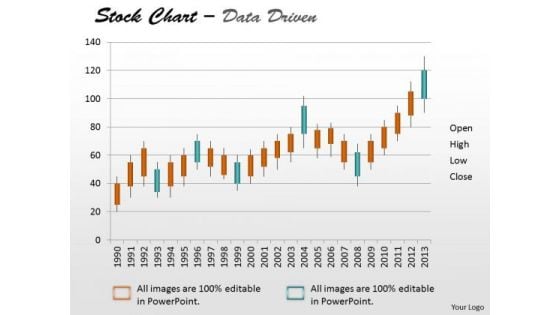
Data Analysis Template Driven Stock Chart For Market Trends PowerPoint Slides Templates
Drive Your Team Along The Road To Success. Take The Wheel With Our data analysis template driven stock chart for market trends powerpoint slides Templates .
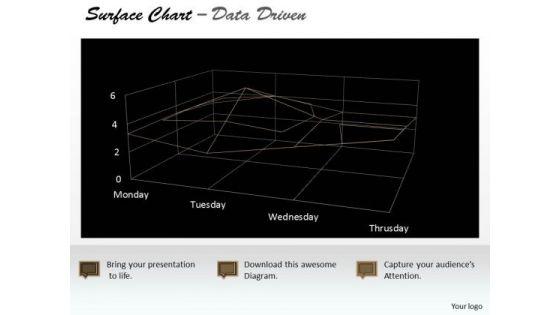
Data Analysis Template Driven Surface Chart Indicating Areas PowerPoint Slides Templates
Highlight Your Drive With Our data analysis template driven surface chart indicating areas powerpoint slides Templates . Prove The Fact That You Have Control.
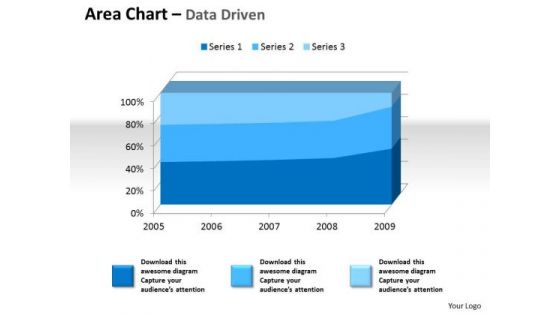
Examples Of Data Analysis Market 3d Area Chart For Quantiative PowerPoint Templates
Drum It Up With Our examples of data analysis market 3d area chart for quantiative Powerpoint Templates . Your Thoughts Will Raise The Tempo.
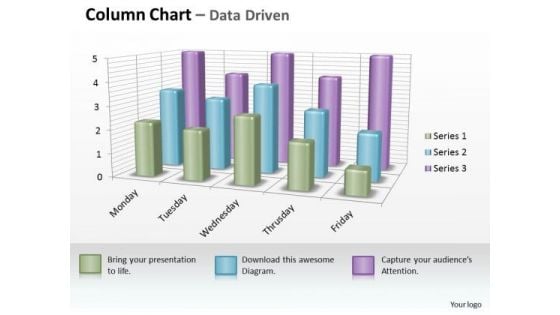
Examples Of Data Analysis Market 3d Business Inspection Procedure Chart PowerPoint Templates
However Dry Your Topic Maybe. Make It Catchy With Our examples of data analysis market 3d business inspection procedure chart Powerpoint Templates .
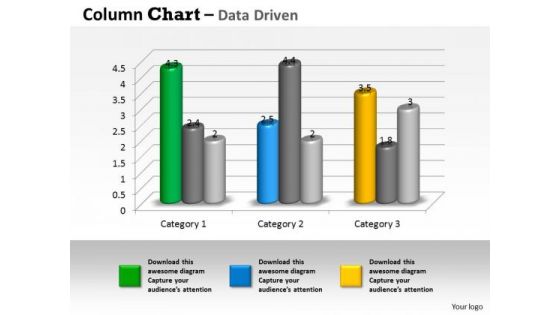
Examples Of Data Analysis Market 3d Business Trend Series Chart PowerPoint Templates
Duct It Through With Our examples of data analysis market 3d business trend series chart Powerpoint Templates . Your Ideas Will Reach Into Their Minds Intact.
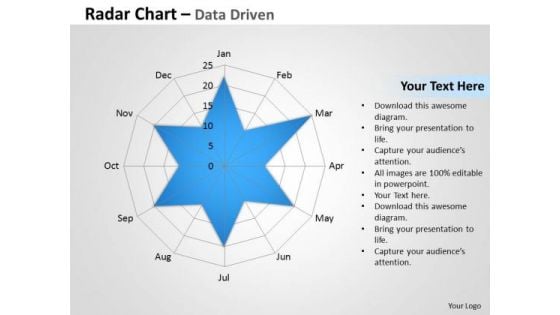
Examples Of Data Analysis Market Driven Radar Chart To Compare PowerPoint Slides Templates
Rely On Our examples of data analysis market driven radar chart to compare powerpoint slides Templates In Any Duel. They Will Drive Home Your Point.
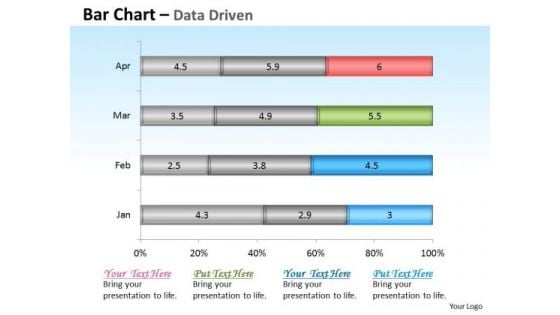
Financial Data Analysis Driven Base Bar Chart Design PowerPoint Slides Templates
Get The Domestics Right With Our financial data analysis driven base bar chart design powerpoint slides Templates . Create The Base For Thoughts To Grow.
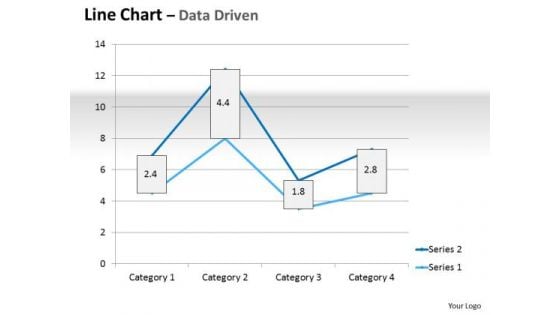
Multivariate Data Analysis Driven Line Chart Market Graph PowerPoint Slides Templates
Plan For All Contingencies With Our multivariate data analysis driven line chart market graph powerpoint slides Templates . Douse The Fire Before It Catches.
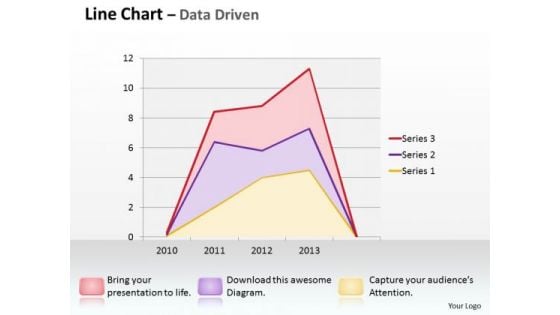
Multivariate Data Analysis Driven Line Chart Shows Revenue Trends PowerPoint Slides Templates
Good Camaraderie Is A Key To Teamwork. Our multivariate data analysis driven line chart shows revenue trends powerpoint slides Templates Can Be A Cementing Force.
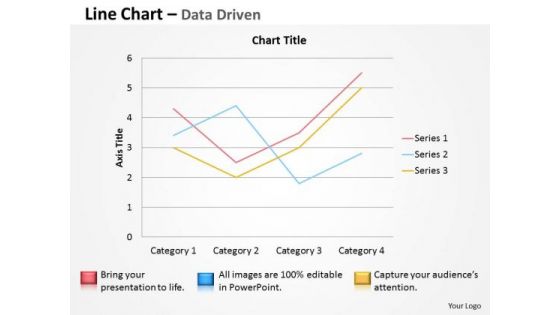
Multivariate Data Analysis Driven Line Chart To Demonstrate PowerPoint Slides Templates
Brace Yourself, Arm Your Thoughts. Prepare For The Hustle With Our multivariate data analysis driven line chart to demonstrate powerpoint slides Templates .
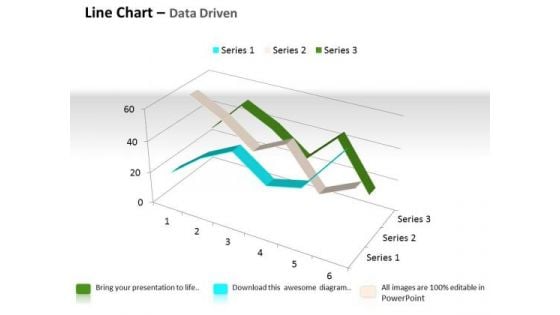
Quantitative Data Analysis 3d Line Chart For Comparison Of PowerPoint Templates
Touch Base With Our quantitative data analysis 3d line chart for comparison of Powerpoint Templates . Review Your Growth With Your Audience.

Quantitative Data Analysis 3d Pie Chart For Business Process PowerPoint Templates
Put Them On The Same Page With Our quantitative data analysis 3d pie chart for business process Powerpoint Templates . Your Team Will Sing From The Same Sheet.
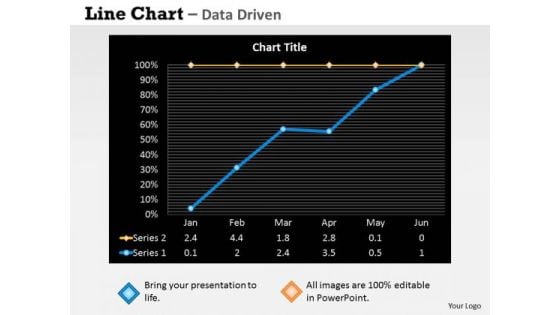
Quantitative Data Analysis Driven Economic Status Line Chart PowerPoint Slides Templates
Be The Dramatist With Our quantitative data analysis driven economic status line chart powerpoint slides Templates . Script Out The Play Of Words.
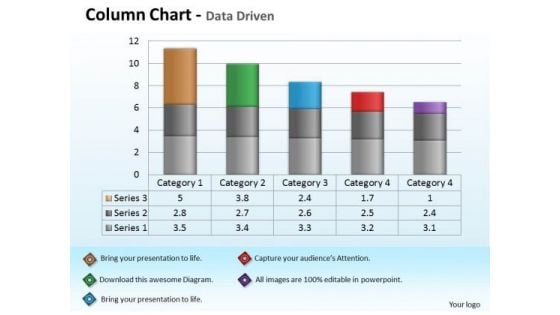
Quantitative Data Analysis Driven Economic With Column Chart PowerPoint Slides Templates
Add Some Dramatization To Your Thoughts. Our quantitative data analysis driven economic with column chart powerpoint slides Templates Make Useful Props.
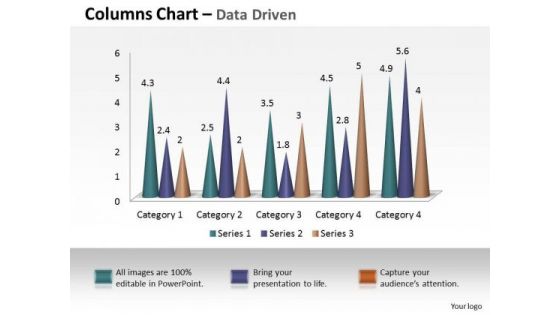
Examples Of Data Analysis Market 3d Business Intelligence And PowerPoint Templates
Our examples of data analysis market 3d business intelligence and Powerpoint Templates Are Dual Purpose. They Help Instruct And Inform At The Same Time.
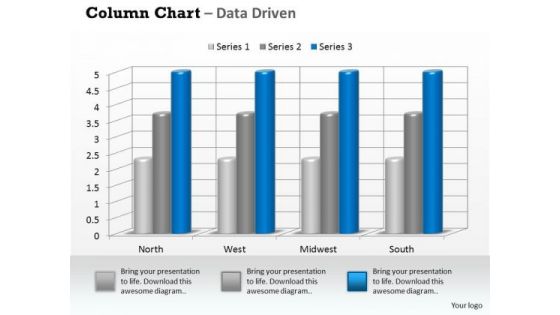
Examples Of Data Analysis Market 3d Business On Regular Intervals PowerPoint Templates
Drum It Out Loud And Clear On Our examples of data analysis market 3d business on regular intervals Powerpoint Templates . Your Words Will Ring In Their Ears.
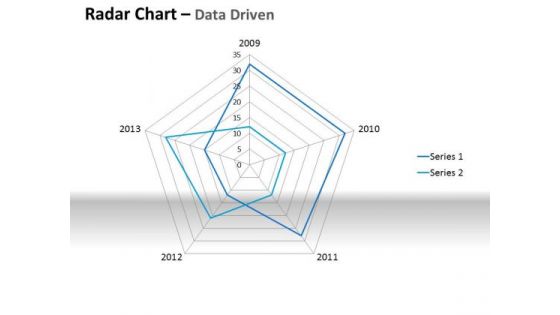
Examples Of Data Analysis Market Driven Plotting The Business Values PowerPoint Slides Templates
Ring The Duck With Our examples of data analysis market driven plotting the business values powerpoint slides Templates . Acquire The Points With Your Ideas.
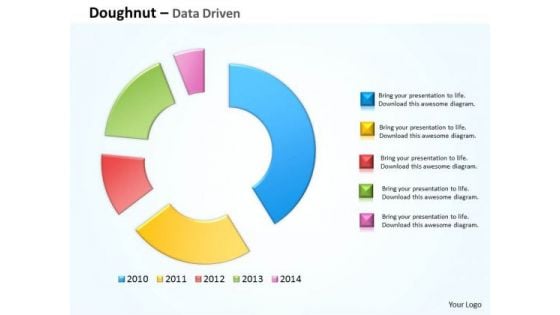
Financial Data Analysis Driven Compare Market Share Of Brand PowerPoint Templates
Doll Up Your Thoughts With Our financial data analysis driven compare market share of brand Powerpoint Templates . They Will Make A Pretty Picture.
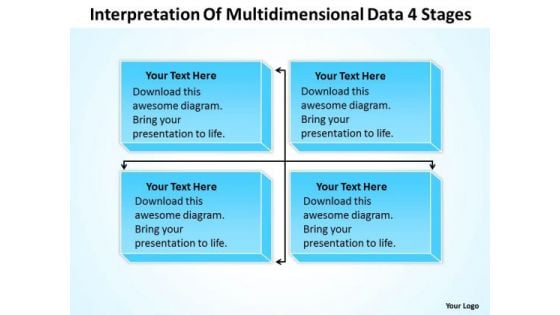
Template For Organizational Chart Of Multidimensional Data 4 Stages PowerPoint Templates
We present our template for organizational chart of multidimensional data 4 stages powerpoint templates.Use our Advertising PowerPoint Templates because You can Rise to the occasion with our PowerPoint Templates and Slides. You will bring your audience on their feet in no time. Present our Leadership PowerPoint Templates because Our PowerPoint Templates and Slides team portray an attitude of elegance. Personify this quality by using them regularly. Download our Arrows PowerPoint Templates because You can Connect the dots. Fan expectations as the whole picture emerges. Download our Org Charts PowerPoint Templates because Our PowerPoint Templates and Slides will let you Clearly mark the path for others to follow. Present our Business PowerPoint Templates because Our PowerPoint Templates and Slides are specially created by a professional team with vast experience. They diligently strive to come up with the right vehicle for your brilliant Ideas. Use these PowerPoint slides for presentations relating to Chart, flow, organization, flowchart, diagram, sitemap, process, box, arrow, graph, business, graphical, data, design, important, rectangle, corporate, plan, president, concept, hierarchy, glossy, teamwork, tier, chain, supervisor, relation, steps, glassy, connection, ladder, administration, group, connect, organize, connectivity, site-map, office, financial, structure, officer, glass. The prominent colors used in the PowerPoint template are Blue, Gray, Black. Be treated as an equal with our Template For Organizational Chart Of Multidimensional Data 4 Stages PowerPoint Templates. Feel the bonhomie of your peers.
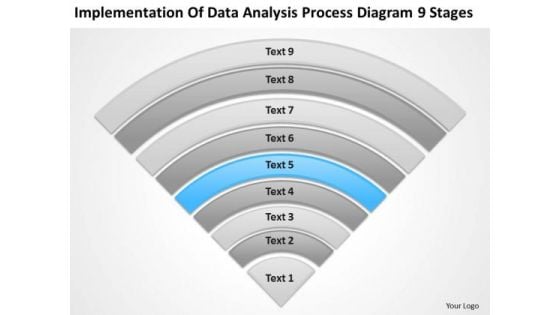
Data Analysis Process Diagram 9 Stages How To Draft Business Plan PowerPoint Templates
We present our data analysis process diagram 9 stages how to draft business plan PowerPoint templates.Download our Process and Flows PowerPoint Templates because They will Put the wind in your sails. Skim smoothly over the choppy waters of the market. Download and present our Shapes PowerPoint Templates because Our PowerPoint Templates and Slides will steer your racing mind. Hit the right buttons and spur on your audience. Download our Marketing PowerPoint Templates because Our PowerPoint Templates and Slides team portray an attitude of elegance. Personify this quality by using them regularly. Present our Triangles PowerPoint Templates because Our PowerPoint Templates and Slides will let you Leave a lasting impression to your audiences. They possess an inherent longstanding recall factor. Use our Business PowerPoint Templates because It is Aesthetically crafted by artistic young minds. Our PowerPoint Templates and Slides are designed to display your dexterity.Use these PowerPoint slides for presentations relating to Saturation, strip, saturated, line, spectrum, pantone, bright, diagram, circle, sampler, guide, element, paint, scale,shape, ten, multicolored, palette, illustration, spectral, guidance, chart, collection, abstraction, selection, choice, visible, variation, painter, contrast, ,gradient, pattern, chooser, analyzer. The prominent colors used in the PowerPoint template are Gray, Black, Blue light. Take the fast train to success. Book a berth with our Data Analysis Process Diagram 9 Stages How To Draft Business Plan PowerPoint Templates.
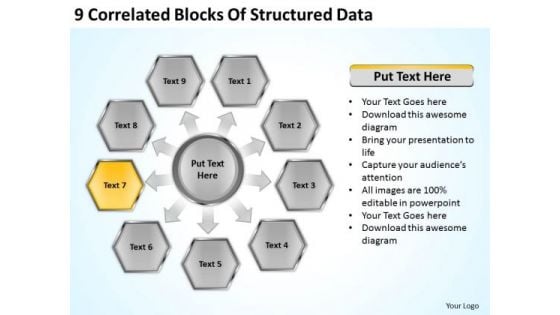
9 Correlated Blocks Of Structured Data Business Financial Planning PowerPoint Templates
We present our 9 correlated blocks of structured data business financial planning PowerPoint templates.Download our Marketing PowerPoint Templates because Our PowerPoint Templates and Slides will fulfill your every need. Use them and effectively satisfy the desires of your audience. Present our Business PowerPoint Templates because Our PowerPoint Templates and Slides team portray an attitude of elegance. Personify this quality by using them regularly. Use our Finance PowerPoint Templates because you can Break through with our PowerPoint Templates and Slides. Bring down the mental barriers of your audience. Use our Process and Flows PowerPoint Templates because Our PowerPoint Templates and Slides will effectively help you save your valuable time. They are readymade to fit into any presentation structure. Present our Arrows PowerPoint Templates because You should Kick up a storm with our PowerPoint Templates and Slides. The heads of your listeners will swirl with your ideas.Use these PowerPoint slides for presentations relating to Diagram, Chart, Business, Background, Vector, Pie, Brown, Abstract, Wheel, Options, Board, Website, Cross, Statistics, Model, Item, Document, Media, Beehives, Red, Hive, Concept, Presentation, Template, Matt, Brochure, Orange, Guide, Description, Multicolor, Marketing, Gray, Development, Title, Management, Honeycomb, Illustration, Six, Catalog, Direction, Plans, Blue, Text, Reports, Financial, Workplace, Navigation, Parts. The prominent colors used in the PowerPoint template are Yellow, Gray, Black. Illustrate the essential elements of the project. Delve into the basic nature with our 9 Correlated Blocks Of Structured Data Business Financial Planning PowerPoint Templates.
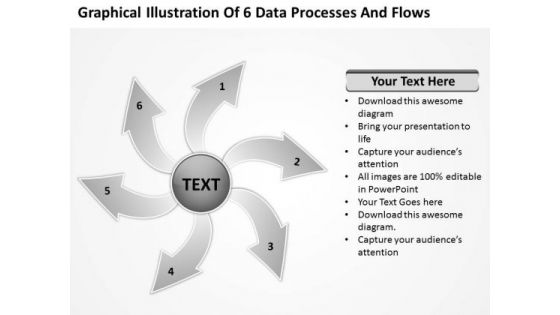
Illustration Of 6 Data Processes And Flows Circular Diagram PowerPoint Slides
We present our illustration of 6 data processes and flows Circular Diagram PowerPoint Slides.Download our Arrows PowerPoint Templates because They will bring a lot to the table. Their alluring flavours will make your audience salivate. Present our Process and Flows PowerPoint Templates because Our PowerPoint Templates and Slides will bullet point your ideas. See them fall into place one by one. Present our Business PowerPoint Templates because your product has established a foothold in the market. Customers are happy with the value it brings to their lives. Present our Shapes PowerPoint Templates because Our PowerPoint Templates and Slides team portray an attitude of elegance. Personify this quality by using them regularly. Present our Circle Charts PowerPoint Templates because you can gain the success to desired levels in one go.Use these PowerPoint slides for presentations relating to Arrows, Background, Blue, Chart, Circle, Circular, Circulation, Color, Connection, Continuity, Cycle, Cyclic, Diagram, Direction, Empty, Flow, Four, Dimensional, Graph, Icon, Presentation, Process, Progress, Reason, Recycle, Recycling, Repetition, Report, Result, Ring, Rotation, Round, Scheme, Section, Step, Symbol, Teamwork. The prominent colors used in the PowerPoint template are Gray, Black, White. Professionals tell us our illustration of 6 data processes and flows Circular Diagram PowerPoint Slides are Stunning. You can be sure our Circle PowerPoint templates and PPT Slides will make the presenter successul in his career/life. Customers tell us our illustration of 6 data processes and flows Circular Diagram PowerPoint Slides are Precious. Professionals tell us our Chart PowerPoint templates and PPT Slides are Gorgeous. People tell us our illustration of 6 data processes and flows Circular Diagram PowerPoint Slides are Playful. People tell us our Circle PowerPoint templates and PPT Slides are One-of-a-kind. Go on a binge with our Illustration Of 6 Data Processes And Flows Circular Diagram PowerPoint Slides. The after effects will always be pleasant.
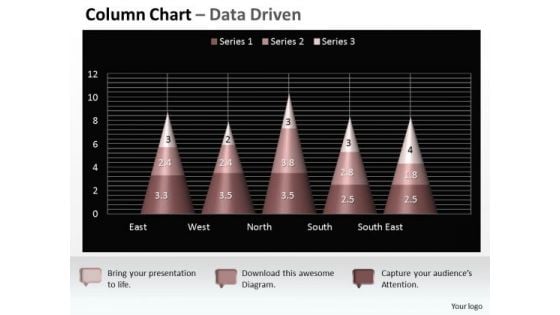
Data Analysis On Excel 3d Chart Shows Interrelated Sets Of PowerPoint Templates
Put Them On The Same Page With Our data analysis on excel 3d chart shows interrelated sets of Powerpoint Templates . Your Team Will Sing From The Same Sheet.
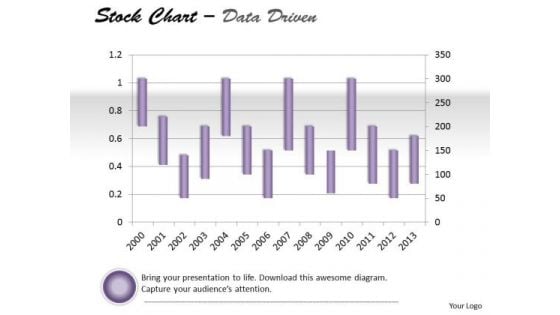
Data Analysis On Excel Driven Stock Chart For Market History PowerPoint Slides Templates
Draw Out The Best In You With Our data analysis on excel driven stock chart for market history powerpoint slides Templates . Let Your Inner Brilliance Come To The Surface.
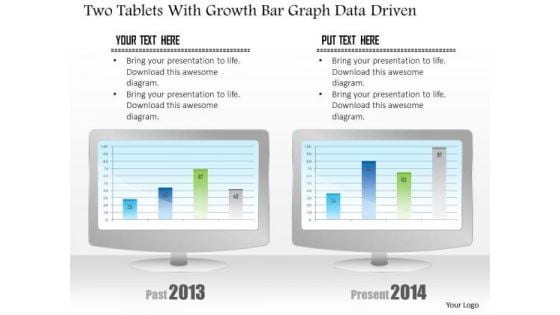
Business Diagram Two Tablets With Growth Bar Graph Data Driven PowerPoint Slide
This business diagram has been designed with comparative charts on tablets. This slide suitable for data representation. You can also use this slide to present business reports and information. Use this diagram to present your views in a wonderful manner.
Business Diagram Flask And Test Tubes For Data Driven PowerPoint Slide
This data driven diagram has been designed with flask and test tubes. Download this diagram to give your presentations more effective look. It helps in clearly conveying your message to clients and audience.
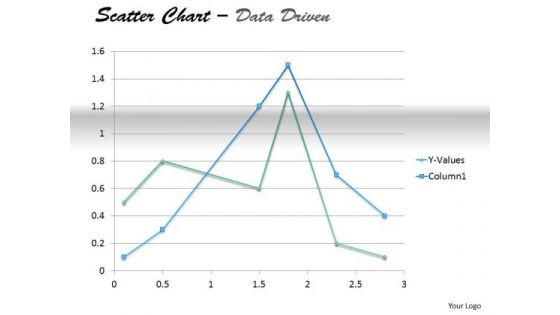
Examples Of Data Analysis Market Driven Present In Scatter Chart PowerPoint Slides Templates
Your Thoughts Will Take To Our examples of data analysis market driven present in scatter chart powerpoint slides Templates Like A Duck To Water. They Develop A Binding Affinity.

Various Stages Data Extraction Process Flow Chart Ppt PowerPoint Presentation Pictures Show PDF
Persuade your audience using this various stages data extraction process flow chart ppt powerpoint presentation pictures show pdf. This PPT design covers five stages, thus making it a great tool to use. It also caters to a variety of topics including interpretation evaluation, data mining, transformation, preprocessing, selection, target data, preprocessed data, transformed data, patterns, knowledge. Download this PPT design now to present a convincing pitch that not only emphasizes the topic but also showcases your presentation skills.
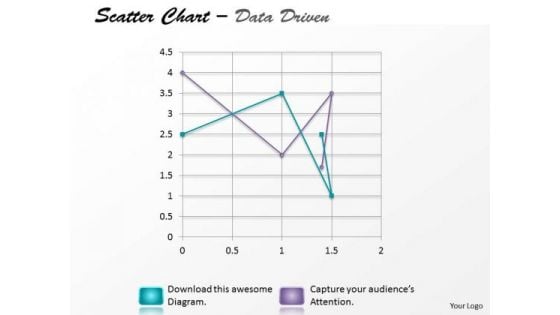
Data Analysis Excel Driven Multiple Series Scatter Chart PowerPoint Slides Templates
Your Listeners Will Never Doodle. Our data analysis excel driven multiple series scatter chart powerpoint slides Templates Will Hold Their Concentration.
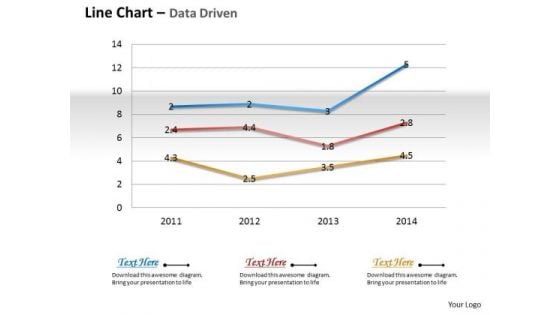
Business Data Analysis Chart Shows Changes Over The Time PowerPoint Templates
Document The Process On Our business data analysis chart shows changes over the time Powerpoint Templates. Make A Record Of Every Detail.
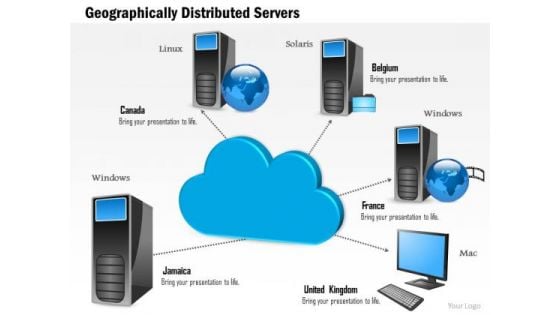
1 Geographically Distributed Servers Across Data Centers Connected To A Centralized Cloud Ppt Slides
This image slide displays geographically distributed server. This image slide has been designed with graphic of could, servers and globe. This image depicts cloud computing. You may change size, color and orientation of any icon to your liking. Use this PowerPoint template, in your presentations to explain concept of cloud computing both at local and global scale. This image slide will help you make professional presentations.
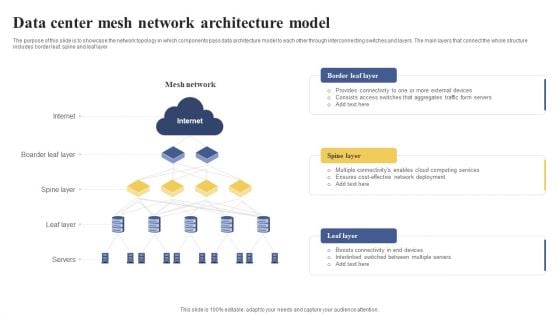
Data Center Mesh Network Architecture Model Ppt Portfolio Background Image PDF
The purpose of this slide is to showcase the network topology in which components pass data architecture model to each other through interconnecting switches and layers. the main layers that connect the whole structure includes border leaf, spine and leaf layer. Presenting Data Center Mesh Network Architecture Model Ppt Portfolio Background Image PDF to dispense important information. This template comprises one stages. It also presents valuable insights into the topics including Border Leaf Layer, Spine Layer, Leaf Layer. This is a completely customizable PowerPoint theme that can be put to use immediately. So, download it and address the topic impactfully.
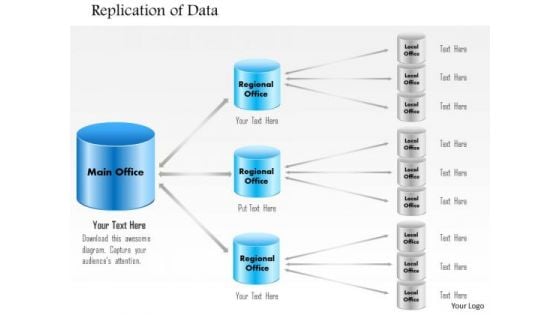
1 Replication Of Data From Main Office To Regional Office To Branch Offices Ppt Slide
This image slide explains the concept database replication in an organization. This image slide has been designed with graphic of database system transfers in main, regional and local office branches. You may change color, size and orientation of any icon to your liking. Use this image slide, in your presentations to express views on backup, storage, networking, communication and technology. Create wonderful presentations using this image slide.
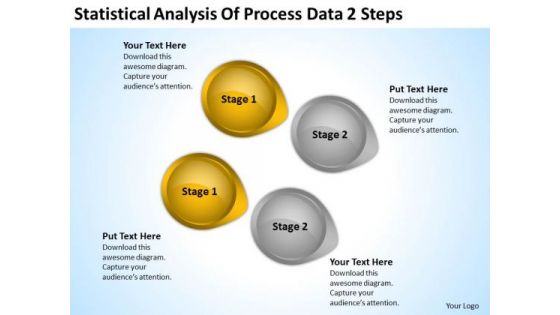
Levels Of Parallel Processing Data 2 Steps Ppt PowerPoint Templates Backgrounds For Slides
We present our levels of parallel processing data 2 steps ppt PowerPoint templates backgrounds for slides.Download and present our Business PowerPoint Templates because Our PowerPoint Templates and Slides will embellish your thoughts. See them provide the desired motivation to your team. Present our Circle Charts PowerPoint Templates because Our PowerPoint Templates and Slides offer you the needful to organise your thoughts. Use them to list out your views in a logical sequence. Download and present our Arrows PowerPoint Templates because Our PowerPoint Templates and Slides provide you with a vast range of viable options. Select the appropriate ones and just fill in your text. Present our Shapes PowerPoint Templates because Our PowerPoint Templates and Slides team portray an attitude of elegance. Personify this quality by using them regularly. Use our Signs PowerPoint Templates because Our PowerPoint Templates and Slides offer you the needful to organise your thoughts. Use them to list out your views in a logical sequence.Use these PowerPoint slides for presentations relating to 3d, abstract, analysis, arrow, background, business, button, chart, circle, circular, color, concept, conservation, cycle, development, diagram, direction, eco, ecology, energy, environment, flow, flowchart, globe, graphic, growing, growth, icon, internet, isolated, object, power, process, protection, recyclable, recycle, recycling, render, resource, saving, sign, solution, sphere, statistic, sustainable, symbol, technology, white. The prominent colors used in the PowerPoint template are Brown, Gray, Black. You can be sure our levels of parallel processing data 2 steps ppt PowerPoint templates backgrounds for slides look good visually. People tell us our analysis PowerPoint templates and PPT Slides are specially created by a professional team with vast experience. They diligently strive to come up with the right vehicle for your brilliant Ideas. You can be sure our levels of parallel processing data 2 steps ppt PowerPoint templates backgrounds for slides will impress their bosses and teams. Use our chart PowerPoint templates and PPT Slides are the best it can get when it comes to presenting. Presenters tell us our levels of parallel processing data 2 steps ppt PowerPoint templates backgrounds for slides look good visually. We assure you our chart PowerPoint templates and PPT Slides are topically designed to provide an attractive backdrop to any subject. Our Levels Of Parallel Processing Data 2 Steps Ppt PowerPoint Templates Backgrounds For Slides put your thoughts in a capsule. Deliver it to them in the correct doses.
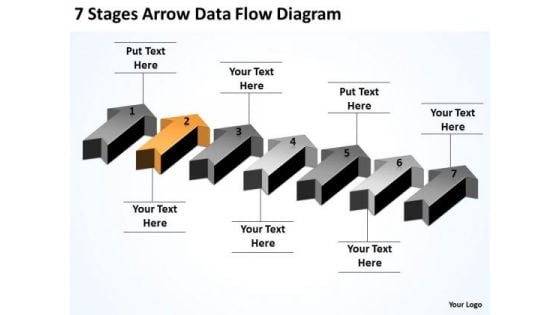
Explain Parallel Processing 7 Stages Arrow Data Flow Diagram PowerPoint Slides
We present our explain parallel processing 7 stages arrow data flow diagram PowerPoint Slides.Download our Business PowerPoint Templates because you can Break through with our PowerPoint Templates and Slides. Bring down the mental barriers of your audience. Use our Arrows PowerPoint Templates because It is Aesthetically crafted by artistic young minds. Our PowerPoint Templates and Slides are designed to display your dexterity. Use our Shapes PowerPoint Templates because They will Put your wonderful verbal artistry on display. Our PowerPoint Templates and Slides will provide you the necessary glam and glitter. Download and present our Success PowerPoint Templates because It can Conjure up grand ideas with our magical PowerPoint Templates and Slides. Leave everyone awestruck by the end of your presentation. Use our Signs PowerPoint Templates because Our PowerPoint Templates and Slides team portray an attitude of elegance. Personify this quality by using them regularly.Use these PowerPoint slides for presentations relating to 3d, achievement, aim, arrows, business, career, chart, competition,development, direction, education, financial, forecast, forward, glossy, graph,group, growth, higher, icon, increase, investment, leader, leadership, moving,onwards, outlook, path, plan, prediction, price, profit, progress, property, race,sales, series, success, target, team, teamwork, turn, up, upwards, vector, win,winner. The prominent colors used in the PowerPoint template are Orange, Gray, Black. We assure you our explain parallel processing 7 stages arrow data flow diagram PowerPoint Slides will get their audience's attention. PowerPoint presentation experts tell us our arrows PowerPoint templates and PPT Slides are second to none. The feedback we get is that our explain parallel processing 7 stages arrow data flow diagram PowerPoint Slides are specially created by a professional team with vast experience. They diligently strive to come up with the right vehicle for your brilliant Ideas. We assure you our business PowerPoint templates and PPT Slides will help them to explain complicated concepts. PowerPoint presentation experts tell us our explain parallel processing 7 stages arrow data flow diagram PowerPoint Slides will generate and maintain the level of interest you desire. They will create the impression you want to imprint on your audience. We assure you our business PowerPoint templates and PPT Slides are topically designed to provide an attractive backdrop to any subject. Get extraordinary with our Explain Parallel Processing 7 Stages Arrow Data Flow Diagram PowerPoint Slides. Your thoughts will achieve well above the average results.

Business Diagram Four Pie Chart For Data Driven Result Analysis Of Business PowerPoint Slide
This business diagram displays graphic of pie charts in shape of flasks. This business slide is suitable to present and compare business data. Use this diagram to build professional presentations for your viewers.

Business Diagram Three Heads With Pie For Data Driven Technology PowerPoint Slide
This business diagram displays three human faces with pie charts. This Power Point template has been designed to compare and present business data. You may use this diagram to impart professional appearance to your presentations.
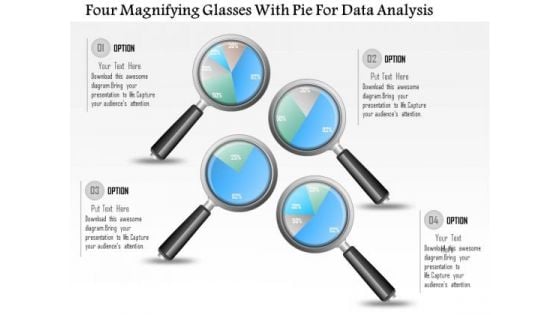
Business Diagram Four Magnifying Glasses With Pie For Data Analysis PowerPoint Slide
This business diagram displays graphic of pie charts in shape of magnifying glasses This business slide is suitable to present and compare business data. Use this diagram to build professional presentations for your viewers.

Business Diagram Data Driven Bar Graph And Pie Chart For Analysis PowerPoint Slide
This PowerPoint template displays technology gadgets with various business charts. Use this diagram slide, in your presentations to make business reports for statistical analysis. You may use this diagram to impart professional appearance to your presentations.
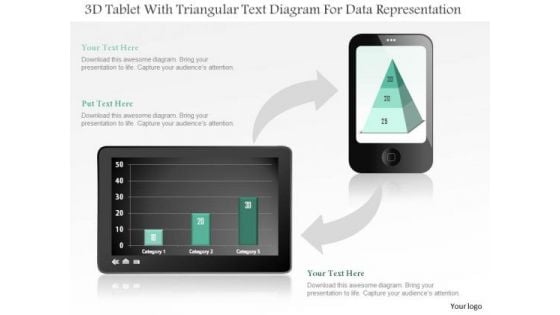
Business Diagram 3d Tablet With Triangular Text Diagram For Data Representation PowerPoint Slide
This business diagram displays bar graph on tablet and pyramid chart on mobile phone. Use this diagram, to make reports for interactive business presentations. Create professional presentations using this diagram.

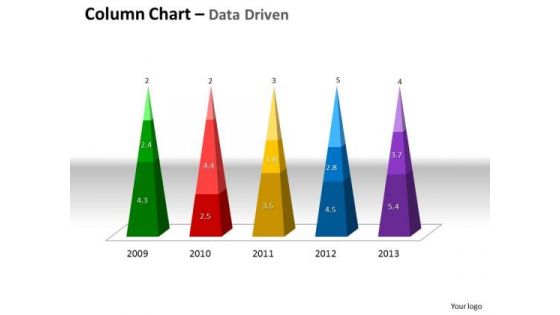
Data Analysis In Excel 3d Column Chart To Represent Information PowerPoint Templates
Rake In The Dough With
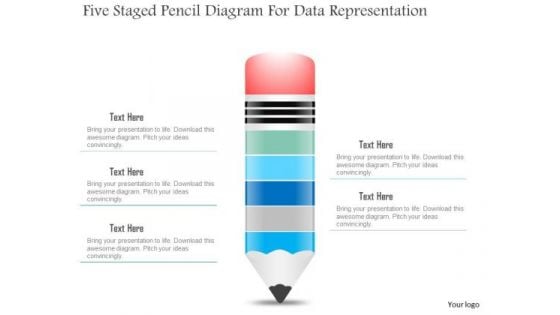
Business Diagram Five Staged Pencil Diagram For Data Representation PowerPoint Slide
This business slide displays five staged pencil diagram. It contains pencil graphic divided into five parts. This diagram slide depicts processes, stages, steps, points, options and education information display. Use this diagram, in your presentations to express your views innovatively.
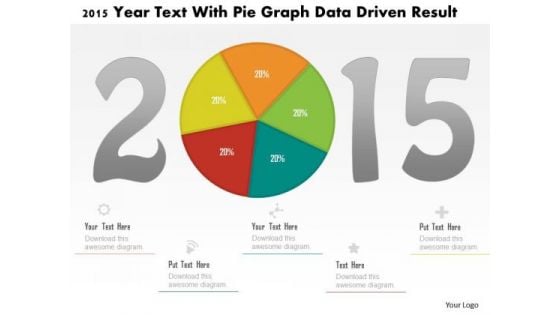
Business Diagram 2015 Year Text With Pie Graph Data Driven Result PowerPoint Slide
This business diagram displays 2015 year numbers with pie chart. This diagram is suitable to display business strategy for year 2015. Download this professional slide to present information in an attractive manner
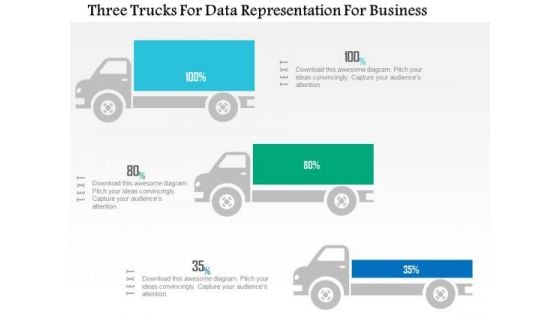
Business Diagram Three Trucks For Data Representation For Business PowerPoint Slide
This business diagram displays three trucks graphic. This diagram contains trucks for percentage value growth. Use this diagram to display business growth over a period of time.
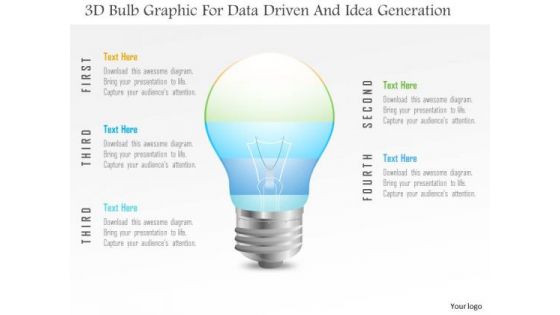
Business Diagram 3d Bulb Graphic For Data Driven And Idea Generation PowerPoint Slide
This Power Point template has been designed with 3d bulb graphic. Use this slide to represent technology idea and strategy concepts. Download this diagram for your business presentations and get exclusive comments on your efforts.
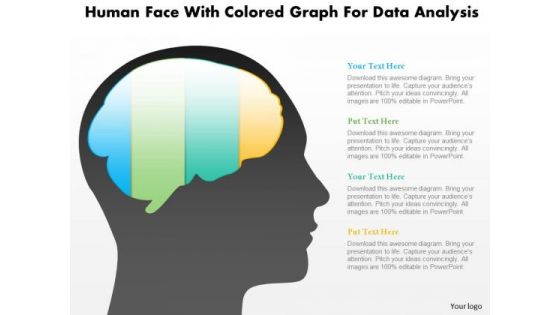
Business Diagram Human Face With Colored Graph For Data Analysis PowerPoint Slide
This diagram displays human face graphic with colored graph. This diagram can be used to represent strategy, planning, thinking of business plan. Display business options in your presentations by using this creative diagram.
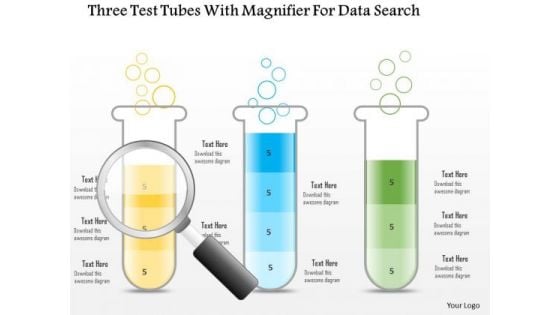
Business Diagram Three Test Tubes With Magnifier For Data Search PowerPoint Slide
This business diagram displays three test tubes with magnifying glass. This diagram is suitable to depict flow of business activities or steps. Download this professional slide to present information in an attractive manner.
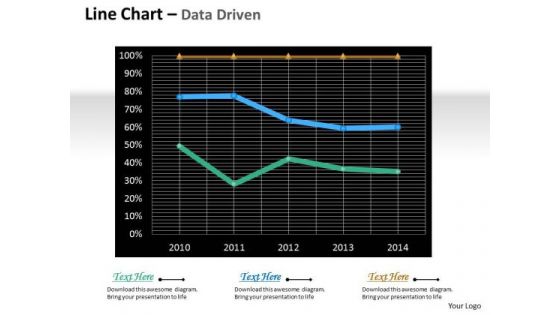
Multivariate Data Analysis Driven Line Chart For Market Survey PowerPoint Slides Templates
Rake In The Dough With
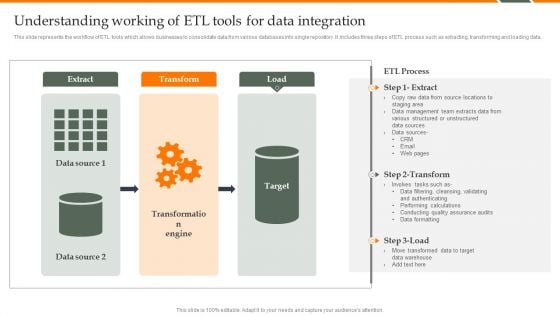
Human Resource Analytics Understanding Working Of ETL Tools For Data Integration Microsoft PDF
This slide represents the workflow of ETL tools which allows businesses to consolidate data from various databases into single repository. It includes three steps of ETL process such as extracting, transforming and loading data. Do you know about Slidesgeeks Human Resource Analytics Understanding Working Of ETL Tools For Data Integration Microsoft PDF These are perfect for delivering any kind od presentation. Using it, create PowerPoint presentations that communicate your ideas and engage audiences. Save time and effort by using our pre-designed presentation templates that are perfect for a wide range of topic. Our vast selection of designs covers a range of styles, from creative to business, and are all highly customizable and easy to edit. Download as a PowerPoint template or use them as Google Slides themes.
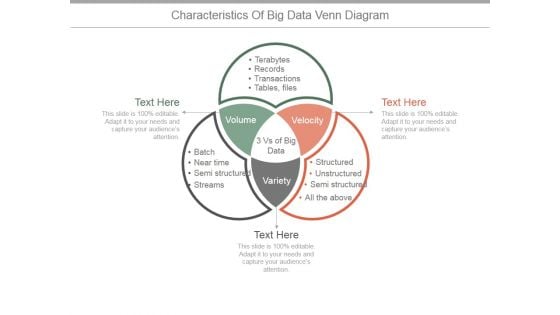
Characteristics Of Big Data Venn Diagram Ppt PowerPoint Presentation Example 2015
This is a characteristics of big data venn diagram ppt powerpoint presentation example 2015. This is a three stage process. The stages in this process are volume, velocity, variety, tables, files, transactions, records, terabytes.
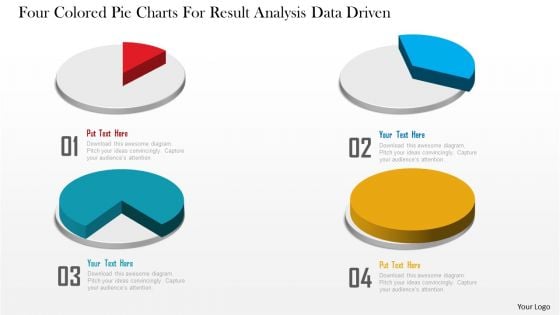
Business Diagram Four Colored Pie Charts For Result Analysis Data Driven PowerPoint Slide
This business diagram displays graphic of pie charts. This business slide is suitable to present and compare business data. Use this diagram to build professional presentations for your viewers.
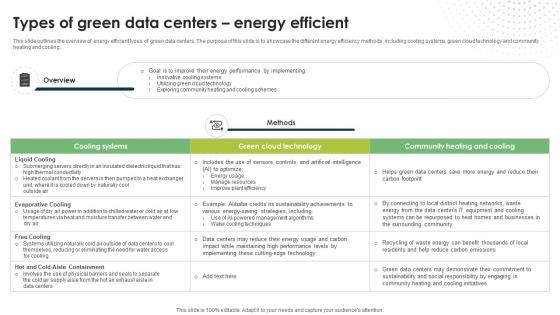
Types Of Green Data Centers Energy Efficient Eco Friendly Computing IT
This slide outlines the overview of energy efficient types of green data centers. The purpose of this slide is to showcase the different energy efficiency methods, including cooling systems, green cloud technology and community heating and cooling.If you are looking for a format to display your unique thoughts, then the professionally designed Types Of Green Data Centers Energy Efficient Eco Friendly Computing IT is the one for you. You can use it as a Google Slides template or a PowerPoint template. Incorporate impressive visuals, symbols, images, and other charts. Modify or reorganize the text boxes as you desire. Experiment with shade schemes and font pairings. Alter, share or cooperate with other people on your work. Download Types Of Green Data Centers Energy Efficient Eco Friendly Computing IT and find out how to give a successful presentation. Present a perfect display to your team and make your presentation unforgettable. This slide outlines the overview of energy efficient types of green data centers. The purpose of this slide is to showcase the different energy efficiency methods, including cooling systems, green cloud technology and community heating and cooling.
Magnifying Ppt PowerPoint Presentation Icon Layout Ideas
This is a magnifying ppt powerpoint presentation icon layout ideas. This is a five stage process. The stages in this process are magnifying, business, marketing, icons, process.
Magnifying Glass Ppt PowerPoint Presentation Icon Topics
This is a magnifying glass ppt powerpoint presentation icon topics. This is a three stage process. The stages in this process are magnifying glass, technology, business, marketing, icons.
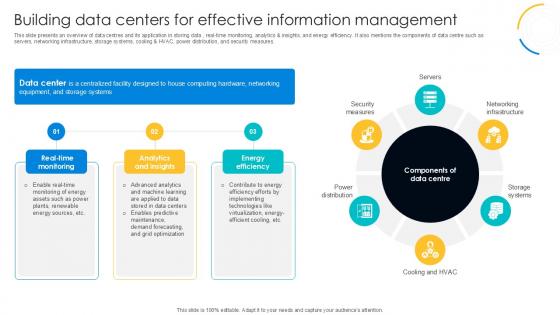
Building Data Centers For Effective Digital Transformation Journey PPT Slide DT SS V
This slide presents an overview of data centres and its application in storing data , real-time monitoring, analytics and insights, and energy efficiency. It also mentions the components of data centre such as servers, networking infrastructure, storage systems, cooling and HVAC, power distribution, and security measures. If you are looking for a format to display your unique thoughts, then the professionally designed Building Data Centers For Effective Digital Transformation Journey PPT Slide DT SS V is the one for you. You can use it as a Google Slides template or a PowerPoint template. Incorporate impressive visuals, symbols, images, and other charts. Modify or reorganize the text boxes as you desire. Experiment with shade schemes and font pairings. Alter, share or cooperate with other people on your work. Download Building Data Centers For Effective Digital Transformation Journey PPT Slide DT SS V and find out how to give a successful presentation. Present a perfect display to your team and make your presentation unforgettable. This slide presents an overview of data centres and its application in storing data , real-time monitoring, analytics and insights, and energy efficiency. It also mentions the components of data centre such as servers, networking infrastructure, storage systems, cooling and HVAC, power distribution, and security measures.
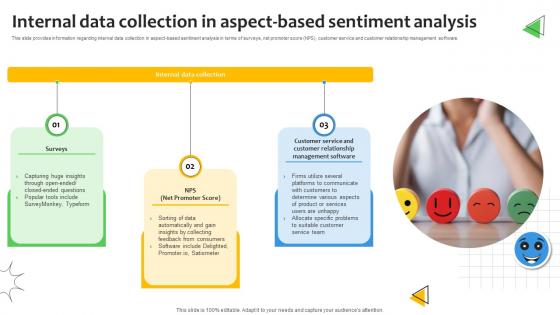
Internal Data Collection In Aspect Based Sentiment Analysis Demystified Understanding AI SS V
This slide provides information regarding internal data collection in aspect-based sentiment analysis in terms of surveys, net promoter score NPS, customer service and customer relationship management software. Presenting this PowerPoint presentation, titled Icons Slide Sentiment Analysis Demystified Understanding Textual Emotions And Opinions AI SS V, with topics curated by our researchers after extensive research. This editable presentation is available for immediate download and provides attractive features when used. Download now and captivate your audience. Presenting this Icons Slide Sentiment Analysis Demystified Understanding Textual Emotions And Opinions AI SS V. Our researchers have carefully researched and created these slides with all aspects taken into consideration. This is a completely customizable Icons Slide Sentiment Analysis Demystified Understanding Textual Emotions And Opinions AI SS V that is available for immediate downloading. Download now and make an impact on your audience. Highlight the attractive features available with our PPTs. This slide provides information regarding internal data collection in aspect-based sentiment analysis in terms of surveys, net promoter score NPS, customer service and customer relationship management software.
Magnifying Glass Ppt PowerPoint Presentation Icon Inspiration
This is a magnifying glass ppt powerpoint presentation icon inspiration. This is a six stage process. The stages in this process are magnifying glass, technology, business, marketing, process.
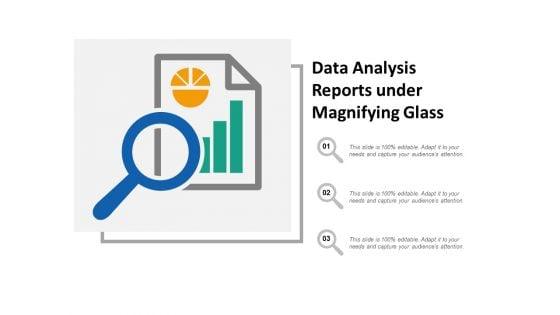
Data Analysis Reports Under Magnifying Glass Ppt Powerpoint Presentation Summary Slideshow
This is a data analysis reports under magnifying glass ppt powerpoint presentation summary slideshow. This is a three stage process. The stages in this process are data visualization icon, data management icon.
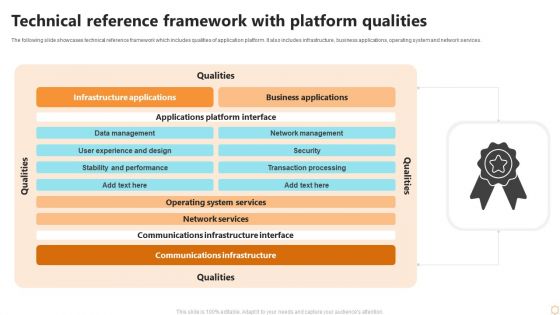
Technical Reference Framework With Platform Qualities Ppt Guidelines PDF
The following slide showcases technical reference framework which includes qualities of application platform. It also includes infrastructure, business applications, operating system and network services. Showcasing this set of slides titled Technical Reference Framework With Platform Qualities Ppt Guidelines PDF. The topics addressed in these templates are Qualities, Business Applications, Infrastructure Applications. All the content presented in this PPT design is completely editable. Download it and make adjustments in color, background, font etc. as per your unique business setting.
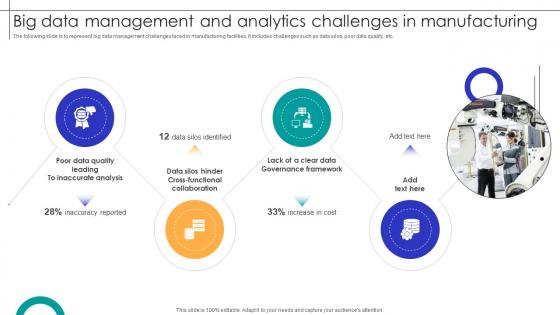
Big Data Management And Analytics Challenges In Manufacturing Streamlining Production Ppt Example
The following slide is to represent big data management challenges faced in manufacturing facilities. It includes challenges such as data silos, poor data quality, etc. Whether you have daily or monthly meetings, a brilliant presentation is necessary. Big Data Management And Analytics Challenges In Manufacturing Streamlining Production Ppt Example can be your best option for delivering a presentation. Represent everything in detail using Big Data Management And Analytics Challenges In Manufacturing Streamlining Production Ppt Example and make yourself stand out in meetings. The template is versatile and follows a structure that will cater to your requirements. All the templates prepared by Slidegeeks are easy to download and edit. Our research experts have taken care of the corporate themes as well. So, give it a try and see the results. The following slide is to represent big data management challenges faced in manufacturing facilities. It includes challenges such as data silos, poor data quality, etc.
Personal Data Visualization On Computer Screen Ppt Powerpoint Presentation Infographics Vector
This is a personal data visualization on computer screen ppt powerpoint presentation infographics vector. This is a three stage process. The stages in this process are data visualization icon, data management icon.
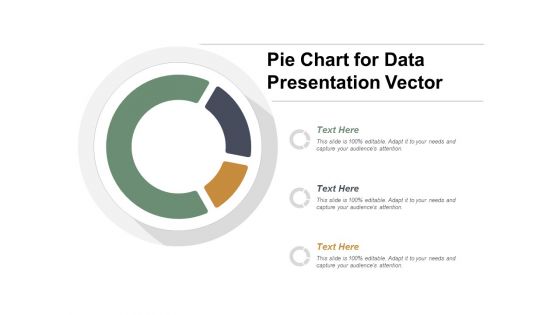
Pie Chart For Data Presentation Vector Ppt Powerpoint Presentation Summary Display
This is a pie chart for data presentation vector ppt powerpoint presentation summary display. This is a three stage process. The stages in this process are data visualization icon, data management icon.
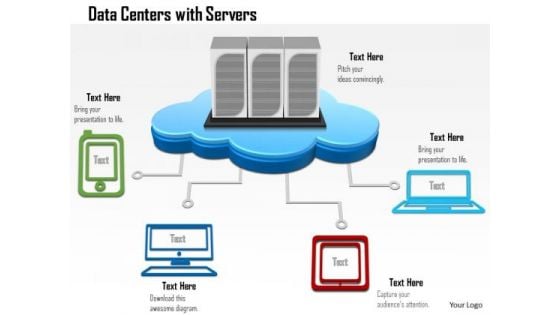
1 Data Center With Servers As A Cloud Connected To Devices Mobile Tables Desktop Ppt Slides
This Powerpoint image slide contains the graphic of cloud server with multiple device connections. This PPT slide explain the concept of data transfer and sharing. This data sharing and transfer is done in between cloud server and devices. We have used mobile, laptops and desktops to show the data sharing and transfer technology.
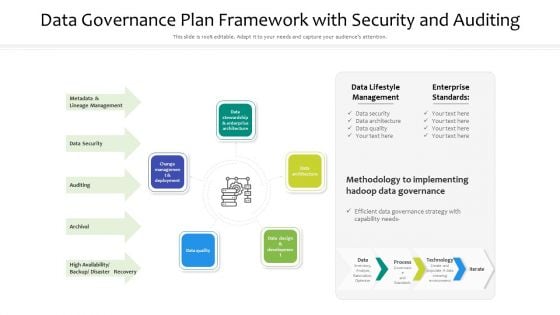
Data Governance Plan Framework With Security And Auditing Ppt PowerPoint Presentation File Template PDF
Presenting data governance plan framework with security and auditing ppt powerpoint presentation file template pdf to dispense important information. This template comprises five stages. It also presents valuable insights into the topics including data architecture, data quality, change management and deployment. This is a completely customizable PowerPoint theme that can be put to use immediately. So, download it and address the topic impactfully.
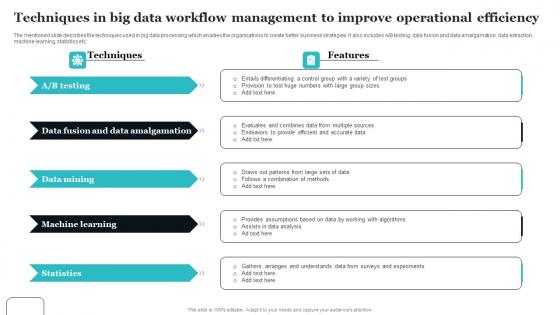
Techniques In Big Data Workflow Management To Improve Operational Efficiency Diagrams Pdf
The mentioned slide describes the techniques used in big data processing which enables the organizations to create better business strategies. It also includes A or B testing, data fusion and data amalgamation, data extraction, machine learning, statistics etc. Pitch your topic with ease and precision using this Techniques In Big Data Workflow Management To Improve Operational Efficiency Diagrams Pdf This layout presents information on Data Fusion, Data Amalgamation, Machine Learning It is also available for immediate download and adjustment. So, changes can be made in the color, design, graphics or any other component to create a unique layout. The mentioned slide describes the techniques used in big data processing which enables the organizations to create better business strategies. It also includes A or B testing, data fusion and data amalgamation, data extraction, machine learning, statistics etc.

Utilizing Agile Methodology In Data Transformation Project IT What Will Be The Project Themes PDF
This slide displays organizations data conversion project structure which is categorized into three stages namely data, documents and coding. Deliver an awe inspiring pitch with this creative utilizing agile methodology in data transformation project it what will be the project themes pdf bundle. Topics like data quality, optimization, data report, project documents can be discussed with this completely editable template. It is available for immediate download depending on the needs and requirements of the user.
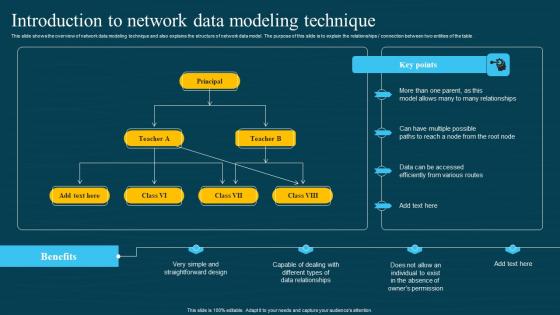
Database Modeling Structures Introduction To Network Data Modeling Technique Brochure Pdf
This slide shows the overview of network data modeling technique and also explains the structure of network data model. The purpose of this slide is to explain the relationships or connection between two entities of the table. Here you can discover an assortment of the finest PowerPoint and Google Slides templates. With these templates, you can create presentations for a variety of purposes while simultaneously providing your audience with an eye-catching visual experience. Download Database Modeling Structures Introduction To Network Data Modeling Technique Brochure Pdf to deliver an impeccable presentation. These templates will make your job of preparing presentations much quicker, yet still, maintain a high level of quality. Slidegeeks has experienced researchers who prepare these templates and write high-quality content for you. Later on, you can personalize the content by editing the Database Modeling Structures Introduction To Network Data Modeling Technique Brochure Pdf. This slide shows the overview of network data modeling technique and also explains the structure of network data model. The purpose of this slide is to explain the relationships or connection between two entities of the table.
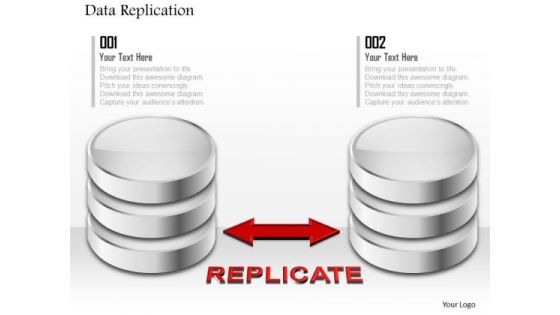
1 Data Replication From Primary To Secondary Storage Media Representing Hard Drives Ppt Slides
This Powerpoint image has been designed to display the concept of data replication. We have defined specific replication over networks. To display this data replication we have used graphic of two different databases. In this PPT slide we have displayed primary to secondary data replication in between databases. Use this PPT slide in your network technology and data replication related presentations.

Data Breach Prevention Recognition Ppt PowerPoint Presentation Complete Deck With Slides
This complete deck acts as a great communication tool. It helps you in conveying your business message with personalized sets of graphics, icons etc. Comprising a set of fifty slides, this complete deck can help you persuade your audience. It also induces strategic thinking as it has been thoroughly researched and put together by our experts. Not only is it easily downloadable but also editable. The color, graphics, theme any component can be altered to fit your individual needs. So grab it now.

Data Governance Steps Review Tools Setup Ppt PowerPoint Presentation Visual Aids Diagrams
This is a data governance steps review tools setup ppt powerpoint presentation visual aids diagrams. This is a five stage process. The stages in this process are data analysis, data review, data evaluation.
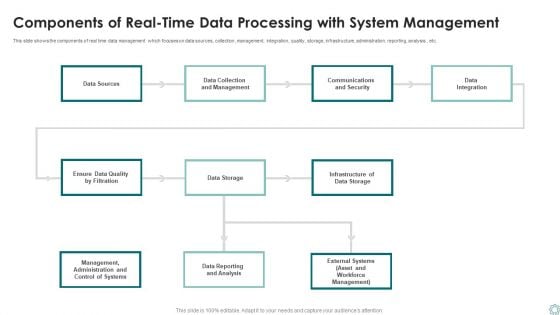
Components Of Real Time Data Processing With System Management Ppt Infographic Template Diagrams PDF
This slide shows the components of real time data management which focuses on data sources, collection, management, integration, quality, storage, infrastructure, administration, reporting, analysis, etc. Presenting Components Of Real Time Data Processing With System Management Ppt Infographic Template Diagrams PDF to dispense important information. This template comprises one stages. It also presents valuable insights into the topics including Data Storage, Data Sources, Data Integration. This is a completely customizable PowerPoint theme that can be put to use immediately. So, download it and address the topic impactfully.
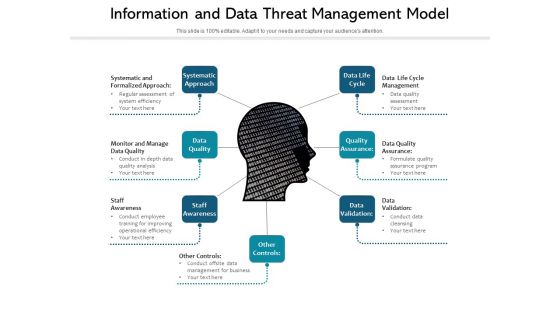
Information And Data Threat Management Model Ppt PowerPoint Presentation File Aids PDF
Presenting information and data threat management model ppt powerpoint presentation file aids pdf to dispense important information. This template comprises seven stages. It also presents valuable insights into the topics including systematic approach, data quality, staff awareness. This is a completely customizable PowerPoint theme that can be put to use immediately. So, download it and address the topic impactfully.
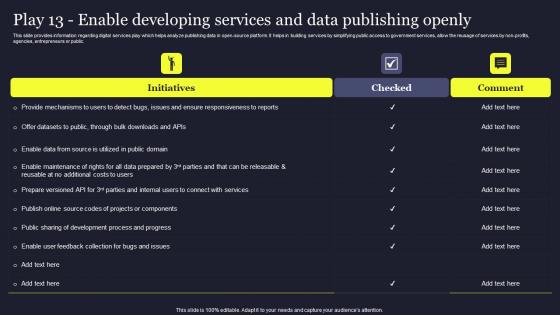
Play 13 Enable Developing Services And Data Publishing Laybook For Managing Us Introduction Pdf
This slide provides information regarding digital services play which helps analyze publishing data in open-source platform. It helps in building services by simplifying public access to government services, allow the reusage of services by non-profits, agencies, entrepreneurs or public. Are you searching for a Play 13 Enable Developing Services And Data Publishing Laybook For Managing Us Introduction Pdf that is uncluttered, straightforward, and original Its easy to edit, and you can change the colors to suit your personal or business branding. For a presentation that expresses how much effort you have put in, this template is ideal. With all of its features, including tables, diagrams, statistics, and lists, its perfect for a business plan presentation. Make your ideas more appealing with these professional slides. Download Play 13 Enable Developing Services And Data Publishing Laybook For Managing Us Introduction Pdf from Slidegeeks today. This slide provides information regarding digital services play which helps analyze publishing data in opensource platform. It helps in building services by simplifying public access to government services, allow the reusage of services by nonprofits, agencies, entrepreneurs or public.
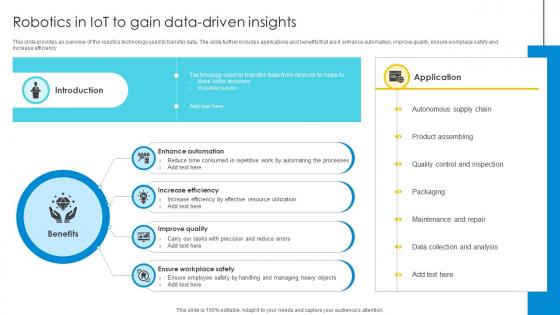
Robotics In IoT To Gain Data Driven Insights Optimizing Inventory Management IoT SS V
This slide provides an overview of the robotics technology used to transfer data. The slide further includes applications and benefits that are it enhance automation, improve quality, ensure workplace safety and increase efficiency. Are you searching for a Robotics In IoT To Gain Data Driven Insights Optimizing Inventory Management IoT SS V that is uncluttered, straightforward, and original Its easy to edit, and you can change the colors to suit your personal or business branding. For a presentation that expresses how much effort you have put in, this template is ideal With all of its features, including tables, diagrams, statistics, and lists, its perfect for a business plan presentation. Make your ideas more appealing with these professional slides. Download Robotics In IoT To Gain Data Driven Insights Optimizing Inventory Management IoT SS V from Slidegeeks today. This slide provides an overview of the robotics technology used to transfer data. The slide further includes applications and benefits that are it enhance automation, improve quality, ensure workplace safety and increase efficiency.
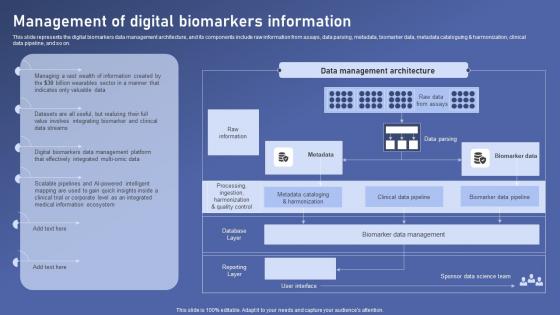
Management Digital Biomarkers Biomedical Data Science And Health Informatics Themes Pdf
This slide represents the digital biomarkers data management architecture, and its components include raw information from assays, data parsing, metadata, biomarker data, metadata cataloguing and harmonization, clinical data pipeline, and so on. Do you know about Slidesgeeks Management Digital Biomarkers Biomedical Data Science And Health Informatics Themes Pdf These are perfect for delivering any kind od presentation. Using it, create PowerPoint presentations that communicate your ideas and engage audiences. Save time and effort by using our pre designed presentation templates that are perfect for a wide range of topic. Our vast selection of designs covers a range of styles, from creative to business, and are all highly customizable and easy to edit. Download as a PowerPoint template or use them as Google Slides themes. This slide represents the digital biomarkers data management architecture, and its components include raw information from assays, data parsing, metadata, biomarker data, metadata cataloguing and harmonization, clinical data pipeline, and so on.
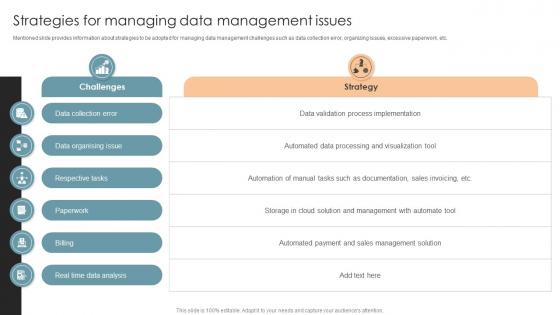
Strategies For Managing Data Management Issues Office Process Optimization To Increase Cost Efficiency
Mentioned slide provides information about strategies to be adopted for managing data management challenges such as data collection error, organizing issues, excessive paperwork, etc.Are you searching for a Strategies For Managing Data Management Issues Office Process Optimization To Increase Cost Efficiency that is uncluttered, straightforward, and original Its easy to edit, and you can change the colors to suit your personal or business branding. For a presentation that expresses how much effort you have put in, this template is ideal With all of its features, including tables, diagrams, statistics, and lists, its perfect for a business plan presentation. Make your ideas more appealing with these professional slides. Download Strategies For Managing Data Management Issues Office Process Optimization To Increase Cost Efficiency from Slidegeeks today. Mentioned slide provides information about strategies to be adopted for managing data management challenges such as data collection error, organizing issues, excessive paperwork, etc.

Deck Presentation Solutions for Enhanced Data Reach and Visibility PPT Sample
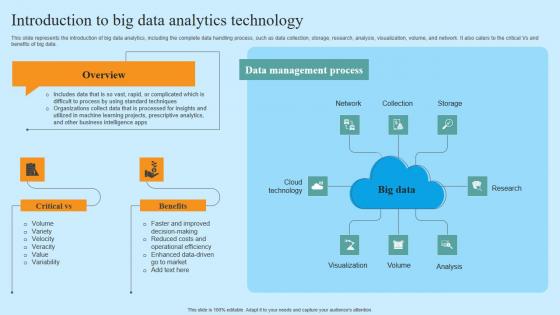
Introduction To Big Data Analytics Technology Hyper Automation Solutions Designs Pdf
This slide represents the introduction of big data analytics, including the complete data handling process, such as data collection, storage, research, analysis, visualization, volume, and network. It also caters to the critical Vs and benefits of big data. Retrieve professionally designed Introduction To Big Data Analytics Technology Hyper Automation Solutions Designs Pdf to effectively convey your message and captivate your listeners. Save time by selecting pre-made slideshows that are appropriate for various topics, from business to educational purposes. These themes come in many different styles, from creative to corporate, and all of them are easily adjustable and can be edited quickly. Access them as PowerPoint templates or as Google Slides themes. You do not have to go on a hunt for the perfect presentation because Slidegeeks got you covered from everywhere. This slide represents the introduction of big data analytics, including the complete data handling process, such as data collection, storage, research, analysis, visualization, volume, and network. It also caters to the critical Vs and benefits of big data.
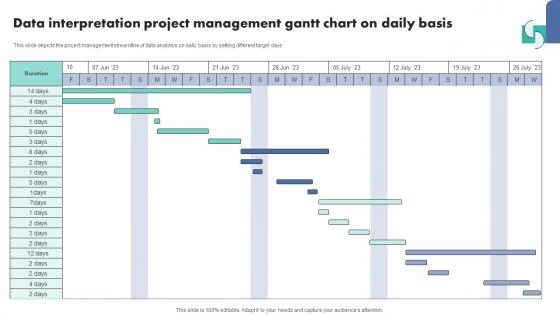
Data Interpretation Project Management Gantt Chart On Daily Basis Template Pdf
Showcasing this set of slides titled Data Interpretation Project Management Gantt Chart On Daily Basis Template Pdf The topics addressed in these templates are Data Interpretation Icon, Measure Business Growth All the content presented in this PPT design is completely editable. Download it and make adjustments in color, background, font etc. as per your unique business setting. Our Data Interpretation Project Management Gantt Chart On Daily Basis Template Pdf are topically designed to provide an attractive backdrop to any subject. Use them to look like a presentation pro.

Current Scenario Analysis Of Big Data Revolutionizing Production IoT Ppt Slide
The following slide showcases current scenario analysis of big data management to assess scope of improvement. It includes KPIs such as data accuracy, downtime reduction, etc. Whether you have daily or monthly meetings, a brilliant presentation is necessary. Current Scenario Analysis Of Big Data Revolutionizing Production IoT Ppt Slide can be your best option for delivering a presentation. Represent everything in detail using Current Scenario Analysis Of Big Data Revolutionizing Production IoT Ppt Slide and make yourself stand out in meetings. The template is versatile and follows a structure that will cater to your requirements. All the templates prepared by Slidegeeks are easy to download and edit. Our research experts have taken care of the corporate themes as well. So, give it a try and see the results. The following slide showcases current scenario analysis of big data management to assess scope of improvement. It includes KPIs such as data accuracy, downtime reduction, etc.
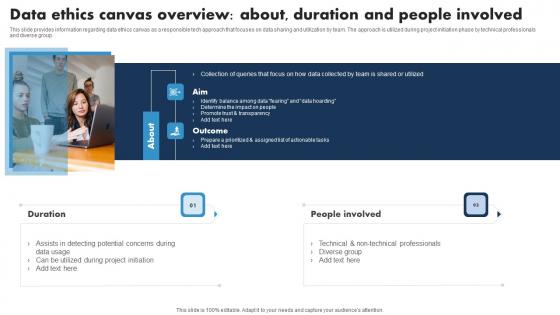
Data Ethics Canvas Overview About Duration Responsible Tech Guide To Manage Brochure Pdf
This slide provides information regarding data ethics canvas as a responsible tech approach that focuses on data sharing and utilization by team. The approach is utilized during project initiation phase by technical professionals and diverse group. Present like a pro with Data Ethics Canvas Overview About Duration Responsible Tech Guide To Manage Brochure Pdf Create beautiful presentations together with your team, using our easy-to-use presentation slides. Share your ideas in real-time and make changes on the fly by downloading our templates. So whether you are in the office, on the go, or in a remote location, you can stay in sync with your team and present your ideas with confidence. With Slidegeeks presentation got a whole lot easier. Grab these presentations today. This slide provides information regarding data ethics canvas as a responsible tech approach that focuses on data sharing and utilization by team. The approach is utilized during project initiation phase by technical professionals and diverse group.
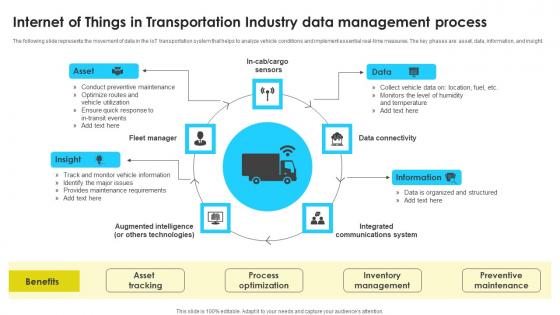
Internet Of Things In Transportation Industry Data Management Process Information Pdf
The following slide represents the movement of data in the IoT transportation system that helps to analyze vehicle conditions and implement essential real-time measures. The key phases are asset, data, information, and insight. Pitch your topic with ease and precision using this Internet Of Things In Transportation Industry Data Management Process Information Pdf This layout presents information on Fleet Manager, Augmented Intelligence, Data Connectivity It is also available for immediate download and adjustment. So, changes can be made in the color, design, graphics or any other component to create a unique layout. The following slide represents the movement of data in the IoT transportation system that helps to analyze vehicle conditions and implement essential real-time measures. The key phases are asset, data, information, and insight.

Companys Data Safety Recognition Ppt PowerPoint Presentation Complete Deck With Slides
This complete deck acts as a great communication tool. It helps you in conveying your business message with personalized sets of graphics, icons etc. Comprising a set of fifty one slides, this complete deck can help you persuade your audience. It also induces strategic thinking as it has been thoroughly researched and put together by our experts. Not only is it easily downloadable but also editable. The color, graphics, theme any component can be altered to fit your individual needs. So grab it now.
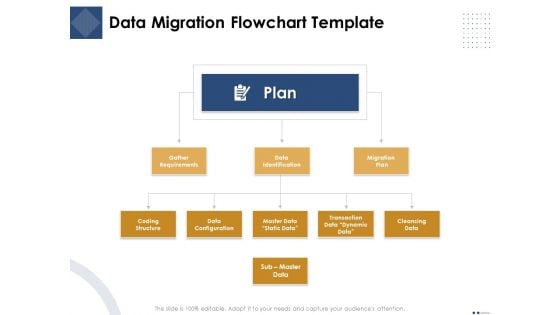
Introducing And Implementing Approaches Within The Business Data Migration Flowchart Template Graphics PDF
Presenting this set of slides with name introducing and implementing approaches within the business data migration flowchart template graphics pdf. This is a three stage process. The stages in this process are plan, gather requirements, data identification, migration, plan, coding structure, data configuration, master data static data, transaction data dynamic data, cleansing data, sub master data. This is a completely editable PowerPoint presentation and is available for immediate download. Download now and impress your audience.
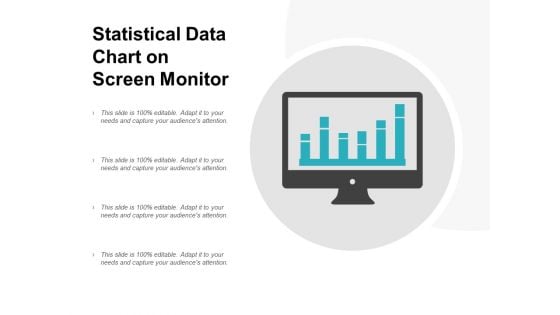
Statistical Data Chart On Screen Monitor Ppt PowerPoint Presentation Outline Summary
Presenting this set of slides with name statistical data chart on screen monitor ppt powerpoint presentation outline summary. This is a one stage process. The stages in this process are data icon, status icon, status symbol icon. This is a completely editable PowerPoint presentation and is available for immediate download. Download now and impress your audience.
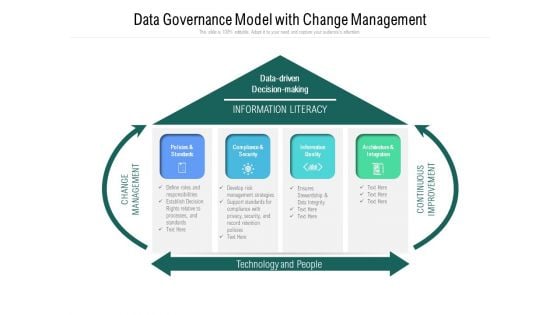
Data Governance Model With Change Management Ppt PowerPoint Presentation Gallery Styles PDF
Presenting data governance model with change management ppt powerpoint presentation gallery styles pdf to dispense important information. This template comprises four stages. It also presents valuable insights into the topics including policies and standards, compliance and security, information quality. This is a completely customizable PowerPoint theme that can be put to use immediately. So, download it and address the topic impactfully.
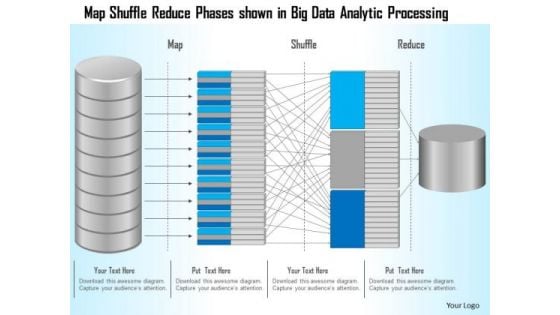
Business Diagram Map Shuffle Reduce Phases Shown In Big Data Analytic Processing Ppt Slide
This technology slide has been designed with graphic of map and data text. This diagram helps to depict concept of data analysis and processing. Use this diagram slide for computer technology related presentations.
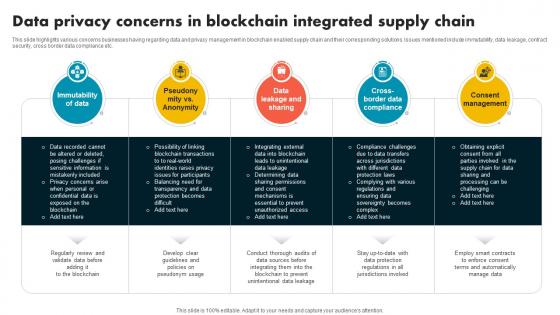
Data Privacy Concerns In Blockchain Integrated Supply Chain Evolution Harnessing The Power BCT SS V
This slide highlights various concerns businesses having regarding data and privacy management in blockchain enabled supply chain and their corresponding solutions. Issues mentioned include immutability, data leakage, contract security, cross border data compliance etc. Are you searching for a Data Privacy Concerns In Blockchain Integrated Supply Chain Evolution Harnessing The Power BCT SS V that is uncluttered, straightforward, and original Its easy to edit, and you can change the colors to suit your personal or business branding. For a presentation that expresses how much effort you have put in, this template is ideal With all of its features, including tables, diagrams, statistics, and lists, its perfect for a business plan presentation. Make your ideas more appealing with these professional slides. Download Data Privacy Concerns In Blockchain Integrated Supply Chain Evolution Harnessing The Power BCT SS V from Slidegeeks today. This slide highlights various concerns businesses having regarding data and privacy management in blockchain enabled supply chain and their corresponding solutions. Issues mentioned include immutability, data leakage, contract security, cross border data compliance etc.

 Home
Home