Data Relationships

Apples Proficiency In Optimizing Brand Influence Table Of Contents Diagrams Pdf
The Apples Proficiency In Optimizing Brand Influence Table Of Contents Diagrams Pdf is a compilation of the most recent design trends as a series of slides. It is suitable for any subject or industry presentation, containing attractive visuals and photo spots for businesses to clearly express their messages. This template contains a variety of slides for the user to input data, such as structures to contrast two elements, bullet points, and slides for written information. Slidegeeks is prepared to create an impression. Our Apples Proficiency In Optimizing Brand Influence Table Of Contents Diagrams Pdf are topically designed to provide an attractive backdrop to any subject. Use them to look like a presentation pro.
Arrows Merging In Box Vector Icon Ppt PowerPoint Presentation Show Good PDF
Presenting arrows merging in box vector icon ppt powerpoint presentation show good pdf. to dispense important information. This template comprises four stages. It also presents valuable insights into the topics including arrows merging in box vector icon. This is a completely customizable PowerPoint theme that can be put to use immediately. So, download it and address the topic impactfully.
Two Arrows Merging Vector Icon Ppt PowerPoint Presentation Portfolio Infographic Template PDF
Pitch your topic with ease and precision using this two arrows merging vector icon ppt powerpoint presentation portfolio infographic template pdf. This layout presents information on two arrows merging vector icon. It is also available for immediate download and adjustment. So, changes can be made in the color, design, graphics or any other component to create a unique layout.
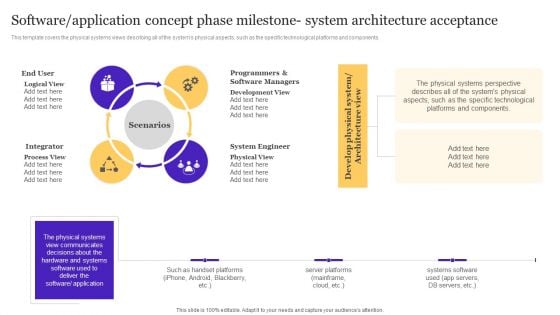
Software Application Concept Phase Milestone System Architecture Acceptance Diagrams PDF
This template covers the physical systems views describing all of the systems physical aspects, such as the specific technological platforms and components.The Software Application Concept Phase Milestone System Architecture Acceptance Diagrams PDF is a compilation of the most recent design trends as a series of slides. It is suitable for any subject or industry presentation, containing attractive visuals and photo spots for businesses to clearly express their messages. This template contains a variety of slides for the user to input data, such as structures to contrast two elements, bullet points, and slides for written information. Slidegeeks is prepared to create an impression.

Synthetic Voices- Text To Speech Technology Infographics PDF
This slide represents details related to different types of content generated with use of Artificial intelligence technology. It includes details related to synthetic voices which is one of the types of synthetic media. Crafting an eye-catching presentation has never been more straightforward. Let your presentation shine with this tasteful yet straightforward Synthetic Voices- Text To Speech Technology Infographics PDF template. It offers a minimalistic and classy look that is great for making a statement. The colors have been employed intelligently to add a bit of playfulness while still remaining professional. Construct the ideal Synthetic Voices- Text To Speech Technology Infographics PDF that effortlessly grabs the attention of your audience Begin now and be certain to wow your customers
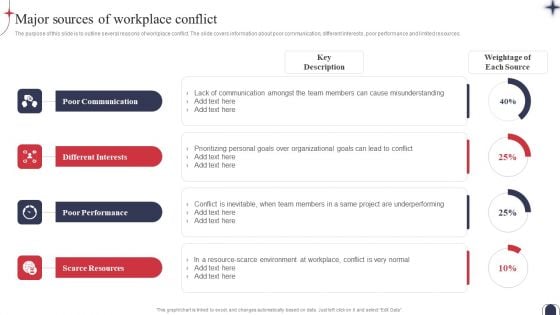
Workplace Conflict Resolution Major Sources Of Workplace Conflict Diagrams PDF
The purpose of this slide is to outline several reasons of workplace conflict. The slide covers information about poor communication, different interests, poor performance and limited resources. The Workplace Conflict Resolution Major Sources Of Workplace Conflict Diagrams PDF is a compilation of the most recent design trends as a series of slides. It is suitable for any subject or industry presentation, containing attractive visuals and photo spots for businesses to clearly express their messages. This template contains a variety of slides for the user to input data, such as structures to contrast two elements, bullet points, and slides for written information. Slidegeeks is prepared to create an impression.

Challenges Overcome By Digital Twin Technology Ppt PowerPoint Presentation File Diagrams PDF
This slide describes the challenges overcome by digital twin technology such as fatigue testing, detecting issues and solutions digitally, increased efficiency in racing cars, and so on. The Challenges Overcome By Digital Twin Technology Ppt PowerPoint Presentation File Diagrams PDF is a compilation of the most recent design trends as a series of slides. It is suitable for any subject or industry presentation, containing attractive visuals and photo spots for businesses to clearly express their messages. This template contains a variety of slides for the user to input data, such as structures to contrast two elements, bullet points, and slides for written information. Slidegeeks is prepared to create an impression.
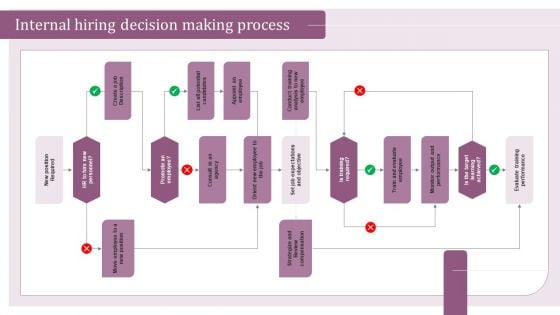
Internal Hiring Handbook Internal Hiring Decision Making Process Diagrams PDF
The Internal Hiring Handbook Internal Hiring Handbook Internal Hiring Decision Making Process Diagrams PDF is a compilation of the most recent design trends as a series of slides. It is suitable for any subject or industry presentation, containing attractive visuals and photo spots for businesses to clearly express their messages. This template contains a variety of slides for the user to input data, such as structures to contrast two elements, bullet points, and slides for written information. Slidegeeks is prepared to create an impression.
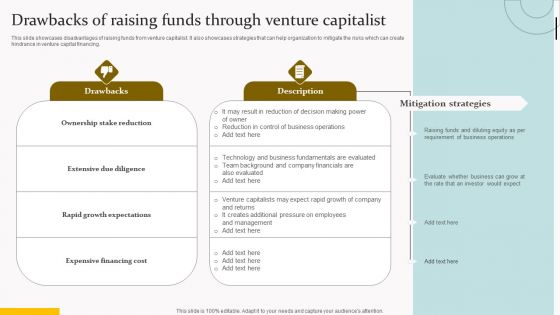
Drawbacks Of Raising Funds Through Venture Capitalist Diagrams PDF
This slide showcases disadvantages of raising funds from venture capitalist. It also showcases strategies that can help organization to mitigate the risks which can create hindrance in venture capital financing. The Drawbacks Of Raising Funds Through Venture Capitalist Diagrams PDF is a compilation of the most recent design trends as a series of slides. It is suitable for any subject or industry presentation, containing attractive visuals and photo spots for businesses to clearly express their messages. This template contains a variety of slides for the user to input data, such as structures to contrast two elements, bullet points, and slides for written information. Slidegeeks is prepared to create an impression.
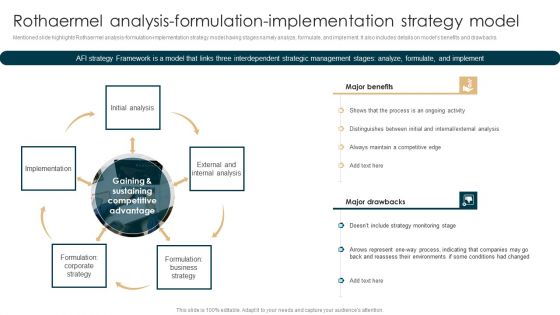
Tactical Planning Guide For Supervisors Rothaermel Analysis Formulation Pictures PDF
Mentioned slide highlights Rothaermel analysis formulation implementation strategy model having stages namely analyze, formulate, and implement. It also includes details on models benefits and drawbacks. The Tactical Planning Guide For Supervisors Rothaermel Analysis Formulation Pictures PDF is a compilation of the most recent design trends as a series of slides. It is suitable for any subject or industry presentation, containing attractive visuals and photo spots for businesses to clearly express their messages. This template contains a variety of slides for the user to input data, such as structures to contrast two elements, bullet points, and slides for written information. Slidegeeks is prepared to create an impression.

Addressing Market Trends Of Global Convention Industry Themes PDF
This slide provides information regarding market trends of global convention industry during COVID - 19. Additionally, it shows the stats related to market size post pandemie and total loss of the industry during pandemic time Presenting addressing market trends of global convention industry themes pdf to provide visual cues and insights. Share and navigate important information on six stages that need your due attention. This template can be used to pitch topics like redesigning of event models, application of big data, integration of trade shows. In addtion, this PPT design contains high resolution images, graphics, etc, that are easily editable and available for immediate download.
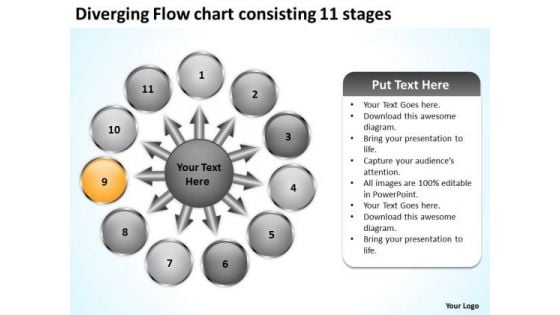
Diverging Flow Chart Consisting 11 Stages Business Target Network PowerPoint Slides
We present our diverging flow chart consisting 11 stages business Target Network PowerPoint Slides.Present our Business PowerPoint Templates because you have secured a name for yourself in the domestic market. Now the time is right to spread your reach to other countries. Present our Circle Charts PowerPoint Templates because they have fired the dreams of many fertile minds. Download and present our Arrows PowerPoint Templates because you have a good idea of the roadmap to your desired destination. Download and present our Shapes PowerPoint Templates because it helps you to get your team in the desired sequence into the bracket. Use our Flow charts PowerPoint Templates because Our PowerPoint Templates and Slides provide you with a vast range of viable options. Select the appropriate ones and just fill in your text. Use these PowerPoint slides for presentations relating to Arrows, blank, business, central, centralized, chart, circle, circular, circulation concept, conceptual, converging, design, diagram, empty, executive, icon, idea illustration, management, map, mapping, moa, model, numbers, organization outwards, pointing, procedure, process, radial, radiating, relationship, resource sequence, sequential, seven, square, strategy, template. The prominent colors used in the PowerPoint template are Yellow, Gray, White. Presenters tell us our diverging flow chart consisting 11 stages business Target Network PowerPoint Slides are Efficient. Presenters tell us our central PowerPoint templates and PPT Slides are Fantastic. PowerPoint presentation experts tell us our diverging flow chart consisting 11 stages business Target Network PowerPoint Slides are Fantastic. We assure you our centralized PowerPoint templates and PPT Slides are Reminiscent. Customers tell us our diverging flow chart consisting 11 stages business Target Network PowerPoint Slides are Excellent. People tell us our centralized PowerPoint templates and PPT Slides are Stylish. Our Diverging Flow Chart Consisting 11 Stages Business Target Network PowerPoint Slides help figure it out. Address the core aspects and dig up answers.
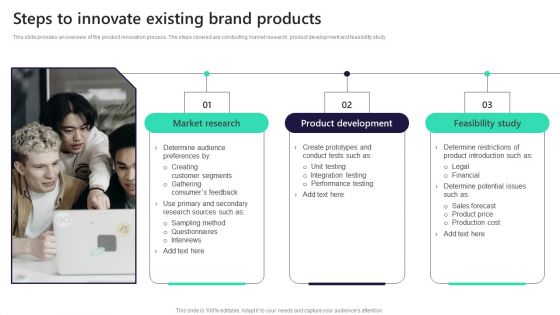
Leveraging Market Penetration For Increased Awareness Steps To Innovate Existing Brand Diagrams PDF
This slide provides an overview of the product innovation process. The steps covered are conducting market research, product development and feasibility study. The Leveraging Market Penetration For Increased Awareness Steps To Innovate Existing Brand Diagrams PDF is a compilation of the most recent design trends as a series of slides. It is suitable for any subject or industry presentation, containing attractive visuals and photo spots for businesses to clearly express their messages. This template contains a variety of slides for the user to input data, such as structures to contrast two elements, bullet points, and slides for written information. Slidegeeks is prepared to create an impression.
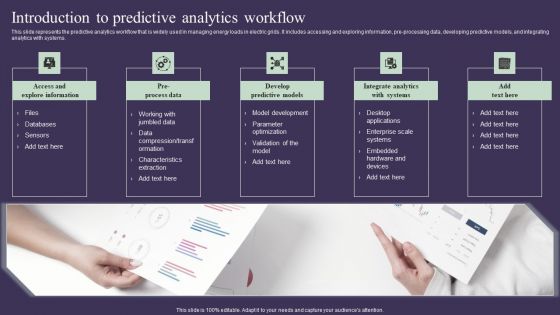
Projection Model Introduction To Predictive Analytics Workflow Microsoft PDF
This slide represents the predictive analytics workflow that is widely used in managing energy loads in electric grids. It includes accessing and exploring information, pre-processing data, developing predictive models, and integrating analytics with systems. Formulating a presentation can take up a lot of effort and time, so the content and message should always be the primary focus. The visuals of the PowerPoint can enhance the presenters message, so our Projection Model Introduction To Predictive Analytics Workflow Microsoft PDF was created to help save time. Instead of worrying about the design, the presenter can concentrate on the message while our designers work on creating the ideal templates for whatever situation is needed. Slidegeeks has experts for everything from amazing designs to valuable content, we have put everything into Projection Model Introduction To Predictive Analytics Workflow Microsoft PDF.

Continuous Strategies For Regular Improvement For Software Testing Process Diagrams PDF
The mentioned slide represents strategy for software testing process as it comprises the part of software development cycle. It also includes framing plans and stating strategies, identifying of test data, structuring analysis, automatic testing etc. Presenting Continuous Strategies For Regular Improvement For Software Testing Process Diagrams PDF to dispense important information. This template comprises six stages. It also presents valuable insights into the topics including Structure Analysis, Automatic Testing, Strong Communication Between Teams. This is a completely customizable PowerPoint theme that can be put to use immediately. So, download it and address the topic impactfully.
Latest Trends For Mobile Smart Phone Security Icons PDF
This slide shows current trends for securing mobile phone against potential cyber attacks and loss of sensitive data. It include trends such as rise in security automation, increasing threat modelling and SAST-DAST integration etc qPresenting Latest Trends For Mobile Smart Phone Security Icons PDF to dispense important information. This template comprises four stages. It also presents valuable insights into the topics including Increasing Security, SAST DAST Integration, Increasing Threat Modelling. This is a completely customizable PowerPoint theme that can be put to use immediately. So, download it and address the topic impactfully.
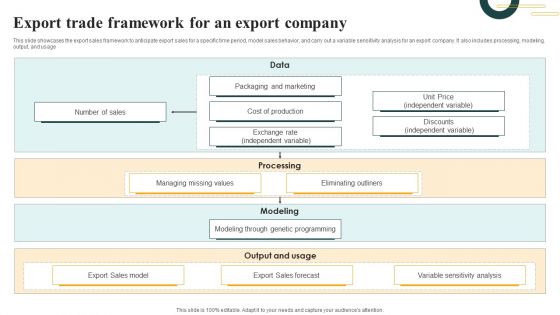
Export Trade Framework For An Export Company Microsoft PDF
This slide showcases the export sales framework to anticipate export sales for a specific time period, model sales behavior, and carry out a variable sensitivity analysis for an export company. It also includes processing, modeling, output, and usage. Showcasing this set of slides titled Export Trade Framework For An Export Company Microsoft PDF. The topics addressed in these templates are Data, Packaging Marketing, Cost Production. All the content presented in this PPT design is completely editable. Download it and make adjustments in color, background, font etc. as per your unique business setting.
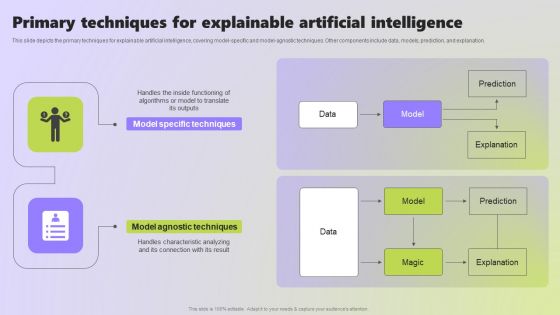
Use Cases Of Explainable AI In Various Sectors Primary Techniques For Explainable Diagrams PDF
This slide depicts the primary techniques for explainable artificial intelligence, covering model-specific and model-agnostic techniques. Other components include data, models, prediction, and explanation. If your project calls for a presentation, then Slidegeeks is your go-to partner because we have professionally designed, easy-to-edit templates that are perfect for any presentation. After downloading, you can easily edit Use Cases Of Explainable AI In Various Sectors Primary Techniques For Explainable Diagrams PDF and make the changes accordingly. You can rearrange slides or fill them with different images. Check out all the handy templates
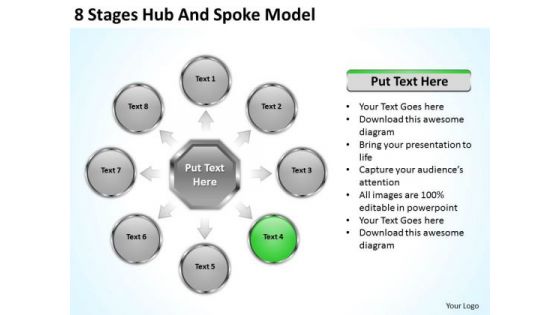
8 Stages Hub And Spoke Model How To Structure Business Plan PowerPoint Slides
We present our 8 stages hub and spoke model how to structure business plan PowerPoint Slides.Download and present our Circle Charts PowerPoint Templates because You can Stir your ideas in the cauldron of our PowerPoint Templates and Slides. Cast a magic spell on your audience. Use our Business PowerPoint Templates because you should Whip up a frenzy with our PowerPoint Templates and Slides. They will fuel the excitement of your team. Download and present our Arrows PowerPoint Templates because Our PowerPoint Templates and Slides will let you Illuminate the road ahead to Pinpoint the important landmarks along the way. Download and present our Process and Flows PowerPoint Templates because Our PowerPoint Templates and Slides are innately eco-friendly. Their high recall value negate the need for paper handouts. Use our Shapes PowerPoint Templates because Our PowerPoint Templates and Slides will let you Clearly mark the path for others to follow.Use these PowerPoint slides for presentations relating to Diagram, flowchart, flow, arrow, process, connection, chart, connect, connectivity, corporate, business, plan, president, concept, teamwork, graphical, data, important, supervisor, relation, graph, box, steps, glassy, administration, design, group, color, highlight, organization,organize, global, manager, office, financial, ceo, structure, officer. The prominent colors used in the PowerPoint template are Green, Gray, Black. Create plans with our 8 Stages Hub And Spoke Model How To Structure Business Plan PowerPoint Slides. Download without worries with our money back guaranteee.

4 Diverging Steps Of A Logical Sequence Arrows Cycle Chart PowerPoint Templates
We present our 4 diverging steps of a logical sequence arrows Cycle Chart PowerPoint templates.Download our Business PowerPoint Templates because the majestic tiger lord of all it surveys.It exudes power even when it is in repose. Use our Shapes PowerPoint Templates because Our PowerPoint Templates and Slides will let you Clearly mark the path for others to follow. Use our Flow Charts PowerPoint Templates because this diagram depicts the essence of this chain reaction like sequence of events. Use our Arrows PowerPoint Templates because you can spread the fruits of your efforts and elaborate your ideas on the prevention, diagnosis, control and cure of prevalent diseases. Present our Process and Flows PowerPoint Templates because all elements of the venture are equally critical.Use these PowerPoint slides for presentations relating to Arrow, Brochure, Business, Chart, Circle, Cyclic, Data, Diagram, Financial, Goal, Graph, Illustration, Info, Information, Investment, Manage, Marketing, Model, Option, Part, Pie, Presentation, Process, Result, Sphere, Statistics, Stock, Strategy, Template, Wheel. The prominent colors used in the PowerPoint template are Blue, Gray, White. People tell us our 4 diverging steps of a logical sequence arrows Cycle Chart PowerPoint templates provide you with a vast range of viable options. Select the appropriate ones and just fill in your text. Customers tell us our Financial PowerPoint templates and PPT Slides are designed to make your presentations professional. People tell us our 4 diverging steps of a logical sequence arrows Cycle Chart PowerPoint templates are Dynamic. Professionals tell us our Business PowerPoint templates and PPT Slides are Pleasant. Customers tell us our 4 diverging steps of a logical sequence arrows Cycle Chart PowerPoint templates are Excellent. Use our Cyclic PowerPoint templates and PPT Slides are Appealing. However faint their hopes may be. Buck them up with our 4 Diverging Steps Of A Logical Sequence Arrows Cycle Chart PowerPoint Templates.

7 Stages Diverging Arrows Schematic Diagram Charts And Networks PowerPoint Slide
We present our 7 stages diverging arrows schematic diagram Charts and Networks PowerPoint Slide.Download our Marketing PowerPoint Templates because you can Be the cynosure of all eyes with our template depicting . Use our Shapes PowerPoint Templates because you know your business and have a vision for it. Present our Arrows PowerPoint Templates because you have the process in your head, our template design showing will illuminate your thoughts. Use our Business PowerPoint Templates because profit levels have been steady over the recent past. Spread your heightened excitement to others in the room. Use our Process and Flows PowerPoint Templates because this diagram depicts the essence of this chain reaction like sequence of events.Use these PowerPoint slides for presentations relating to Arrows, Business, Chart, Cyclic, Data, Diagram, Financial, Goal, Graph, Illustration, Info, Information, Marketing, Model, Option, Part, Pie, Presentation, Process, Result, Sphere, Statistics. The prominent colors used in the PowerPoint template are Green, Gray, Black. The feedback we get is that our 7 stages diverging arrows schematic diagram Charts and Networks PowerPoint Slide are Handsome. People tell us our Diagram PowerPoint templates and PPT Slides will help you be quick off the draw. Just enter your specific text and see your points hit home. Presenters tell us our 7 stages diverging arrows schematic diagram Charts and Networks PowerPoint Slide are Precious. Use our Diagram PowerPoint templates and PPT Slides are Beautiful. Use our 7 stages diverging arrows schematic diagram Charts and Networks PowerPoint Slide are Nifty. Use our Diagram PowerPoint templates and PPT Slides are Exuberant. Our 7 Stages Diverging Arrows Schematic Diagram Charts And Networks PowerPoint Slide are faithful servants. They will put in all possible effort for you.
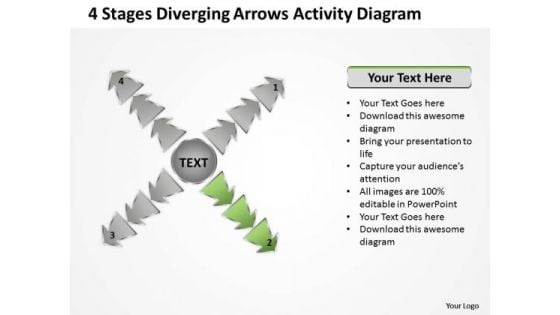
4 Stages Diverging Arrows Activity Diagram Ppt Cycle Chart PowerPoint Templates
We present our 4 stages diverging arrows activity diagram ppt Cycle Chart PowerPoint templates.Present our Process and Flows PowerPoint Templates because in our day to day pursuits we tend to overlook the fundamentals. Download our Business PowerPoint Templates because this template helps you to grab the attention of your listeners. Download our Arrows PowerPoint Templates because you have to coordinate and motivate your team. Download and present our Flow Charts PowerPoint Templates because you can Educate your team with the attention to be paid. Download and present our Success PowerPoint Templates because this is the unerring accuracy in reaching the target. the effortless ability to launch into flight.Use these PowerPoint slides for presentations relating to Business, Chart, Circle, Cyclic, Data, Diagram, Financial, Goal, Graph, Illustration, Info, Information, Marketing, Model, Option, Part, Pie, Presentation, Process, Result, Sphere, Statistics. The prominent colors used in the PowerPoint template are Green, Gray, White. People tell us our 4 stages diverging arrows activity diagram ppt Cycle Chart PowerPoint templates are Youthful. Customers tell us our Circle PowerPoint templates and PPT Slides will help you be quick off the draw. Just enter your specific text and see your points hit home. People tell us our 4 stages diverging arrows activity diagram ppt Cycle Chart PowerPoint templates are Nostalgic. Professionals tell us our Graph PowerPoint templates and PPT Slides are Pleasant. Customers tell us our 4 stages diverging arrows activity diagram ppt Cycle Chart PowerPoint templates are Whimsical. Use our Graph PowerPoint templates and PPT Slides are Quaint. Knit a great story with our 4 Stages Diverging Arrows Activity Diagram Ppt Cycle Chart PowerPoint Templates. Make sure your presentation gets the attention it deserves.
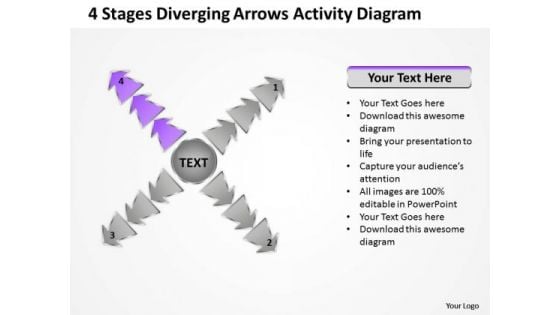
4 Stages Diverging Arrows Activity Diagram Circular Flow Process PowerPoint Slide
We present our 4 stages diverging arrows activity diagram Circular Flow Process PowerPoint Slide.Download our Flow Charts PowerPoint Templates because your group can behave steady in the top bracket. Present our Business PowerPoint Templates because analyse your plans with equal sincerity. Download our Process and Flows PowerPoint Templates because you have the right arrows in your quiver. Present our Success PowerPoint Templates because you have come up with a brilliant breakthrough idea. you can also visualise the interest it will generate. Present our Arrows PowerPoint Templates because you can illustrate your ideas and imprint them in the minds of your team with this template.Use these PowerPoint slides for presentations relating to Business, Chart, Circle, Cyclic, Data, Diagram, Financial, Goal, Graph, Illustration, Info, Information, Marketing, Model, Option, Part, Pie, Presentation, Process, Result, Sphere, Statistics. The prominent colors used in the PowerPoint template are Purple, White, Gray. People tell us our 4 stages diverging arrows activity diagram Circular Flow Process PowerPoint Slide are Attractive. Customers tell us our Goal PowerPoint templates and PPT Slides will make the presenter successul in his career/life. People tell us our 4 stages diverging arrows activity diagram Circular Flow Process PowerPoint Slide are Amazing. Professionals tell us our Goal PowerPoint templates and PPT Slides are Endearing. Customers tell us our 4 stages diverging arrows activity diagram Circular Flow Process PowerPoint Slide are Elevated. Use our Cyclic PowerPoint templates and PPT Slides are Majestic. Enhance your chances of asset creation. Diversify your base with our 4 Stages Diverging Arrows Activity Diagram Circular Flow Process PowerPoint Slide.
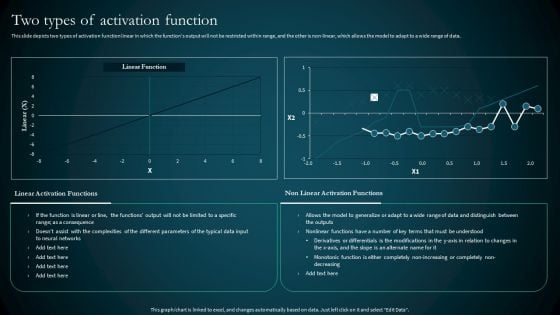
Artificial Reural Network Ann Computational Model Two Types Of Activation Function Slides PDF
This slide depicts two types of activation function linear in which the functions output will not be restricted within range, and the other is non linear, which allows the model to adapt to a wide range of data. Retrieve professionally designed Artificial Reural Network Ann Computational Model Two Types Of Activation Function Slides PDF to effectively convey your message and captivate your listeners. Save time by selecting pre made slideshows that are appropriate for various topics, from business to educational purposes. These themes come in many different styles, from creative to corporate, and all of them are easily adjustable and can be edited quickly. Access them as PowerPoint templates or as Google Slides themes. You do not have to go on a hunt for the perfect presentation because Slidegeeks got you covered from everywhere.
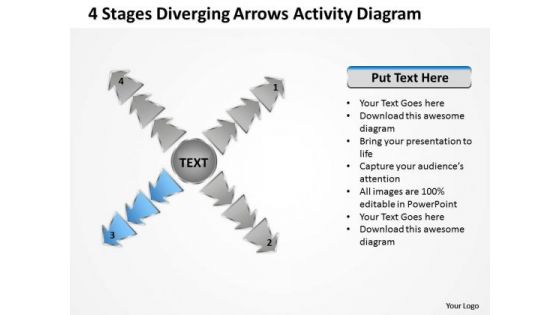
4 Stages Diverging Arrows Activity Diagram Ppt Circular Flow Process PowerPoint Slides
We present our 4 stages diverging arrows activity diagram ppt Circular Flow Process PowerPoint Slides.Use our Process and Flows PowerPoint Templates because our template will help pinpoint their viability. Download our Business PowerPoint Templates because it helps you to project your enthusiasm and single mindedness to your colleagues. Download and present our Arrows PowerPoint Templates because you should explain the process by which you intend to right it. Use our Flow Charts PowerPoint Templates because you should go for Gold and not just silver. Present our Success PowerPoint Templates because the choices you make today will determine the future growth of your enterprise.Use these PowerPoint slides for presentations relating to Business, Chart, Circle, Cyclic, Data, Diagram, Financial, Goal, Graph, Illustration, Info, Information, Marketing, Model, Option, Part, Pie, Presentation, Process, Result, Sphere, Statistics. The prominent colors used in the PowerPoint template are Blue light, Gray, White. People tell us our 4 stages diverging arrows activity diagram ppt Circular Flow Process PowerPoint Slides are Handsome. Customers tell us our Circle PowerPoint templates and PPT Slides are Fantastic. People tell us our 4 stages diverging arrows activity diagram ppt Circular Flow Process PowerPoint Slides are Fashionable. Professionals tell us our Circle PowerPoint templates and PPT Slides are Detailed. Customers tell us our 4 stages diverging arrows activity diagram ppt Circular Flow Process PowerPoint Slides are Versatile. Use our Goal PowerPoint templates and PPT Slides are aesthetically designed to attract attention. We guarantee that they will grab all the eyeballs you need. Our 4 Stages Diverging Arrows Activity Diagram Ppt Circular Flow Process PowerPoint Slides encourage an ethical approach. Exhort your team to stay above board.
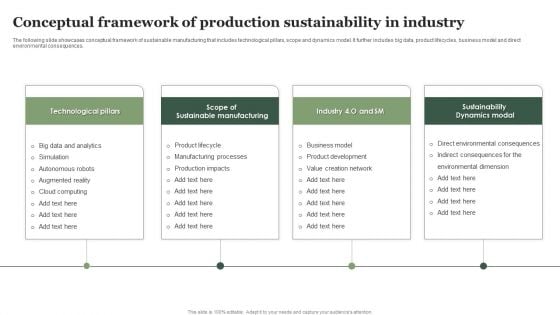
Conceptual Framework Of Production Sustainability In Industry Ppt Professional Graphics Design PDF
The following slide showcases conceptual framework of sustainable manufacturing that includes technological pillars, scope and dynamics model. It further includes big data, product lifecycles, business model and direct environmental consequences. Persuade your audience using this Conceptual Framework Of Production Sustainability In Industry Ppt Professional Graphics Design PDF. This PPT design covers four stages, thus making it a great tool to use. It also caters to a variety of topics including Technological Pillars, Sustainability, Dynamics Modal, Product Lifecycle. Download this PPT design now to present a convincing pitch that not only emphasizes the topic but also showcases your presentation skills.
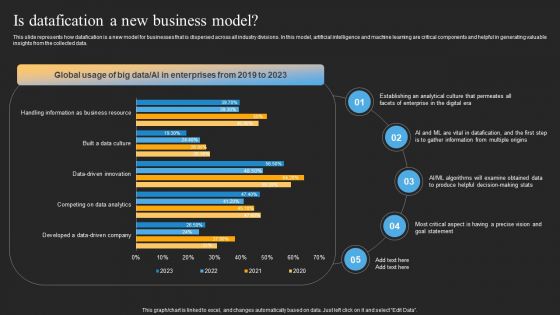
Datafy Is Datafication A New Business Model Rules PDF
This slide represents how datafication is a new model for businesses that is dispersed across all industry divisions. In this model, artificial intelligence and machine learning are critical components and helpful in generating valuable insights from the collected data. Coming up with a presentation necessitates that the majority of the effort goes into the content and the message you intend to convey. The visuals of a PowerPoint presentation can only be effective if it supplements and supports the story that is being told. Keeping this in mind our experts created Datafy Is Datafication A New Business Model Rules PDF to reduce the time that goes into designing the presentation. This way, you can concentrate on the message while our designers take care of providing you with the right template for the situation.
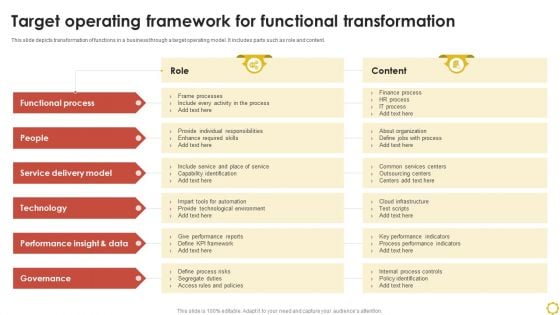
Target Operating Framework For Functional Transformation Ppt Infographics Example Topics PDF
This slide depicts transformation of functions in a business through a target operating model. It includes parts such as role and content. Pitch your topic with ease and precision using this Target Operating Framework For Functional Transformation Ppt Infographics Example Topics PDF. This layout presents information on Functional Process, Service Delivery Model, Performance, Insight And Data. It is also available for immediate download and adjustment. So, changes can be made in the color, design, graphics or any other component to create a unique layout.
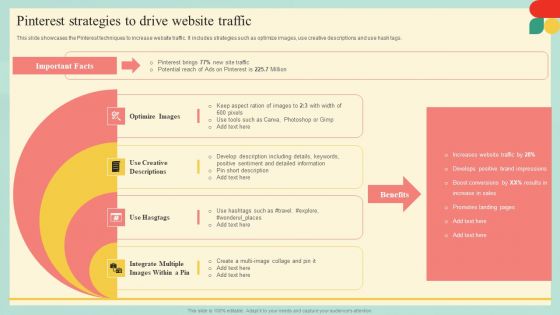
Guide Developing Strategies Improve Travel Tourism Marketing Pinterest Strategies To Drive Diagrams PDF
This slide showcases the Pinterest techniques to increase website traffic. It includes strategies such as optimize images, use creative descriptions and use hash tags. The Guide Developing Strategies Improve Travel Tourism Marketing Pinterest Strategies To Drive Diagrams PDF is a compilation of the most recent design trends as a series of slides. It is suitable for any subject or industry presentation, containing attractive visuals and photo spots for businesses to clearly express their messages. This template contains a variety of slides for the user to input data, such as structures to contrast two elements, bullet points, and slides for written information. Slidegeeks is prepared to create an impression.
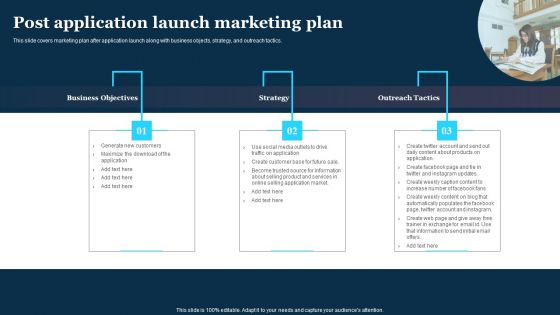
Play Store Launch Techniques For Shopping Apps Post Application Launch Marketing Plan Diagrams PDF
This slide covers marketing plan after application launch along with business objects, strategy, and outreach tactics. The Play Store Launch Techniques For Shopping Apps Post Application Launch Marketing Plan Diagrams PDF is a compilation of the most recent design trends as a series of slides. It is suitable for any subject or industry presentation, containing attractive visuals and photo spots for businesses to clearly express their messages. This template contains a variety of slides for the user to input data, such as structures to contrast two elements, bullet points, and slides for written information. Slidegeeks is prepared to create an impression.
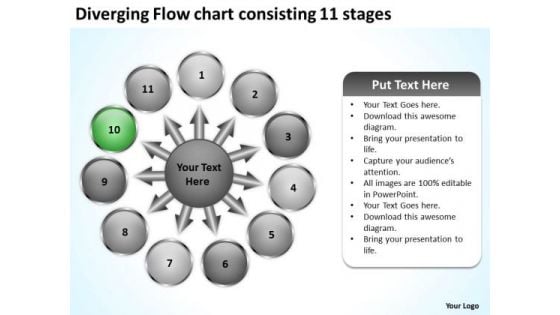
Diverging Flow Chart Consisting 11 Stages Ppt Circular Arrow Diagram PowerPoint Templates
We present our diverging flow chart consisting 11 stages ppt Circular Arrow Diagram PowerPoint templates.Use our Business PowerPoint Templates because you can see clearly through to the bigger bowl ahead. Time your jump to perfection and hit the nail on the head. Download and present our Circle Charts PowerPoint Templates because there are so many different pieces to the puzzle. Present our Arrows PowerPoint Templates because you have the process in your head, our template design showing will illuminate your thoughts. Download our Shapes PowerPoint Templates because you have the people in place, selected the team leaders and all are raring to go. Download our Flow charts PowerPoint Templates because you can Educate your team with the attention to be paid.Use these PowerPoint slides for presentations relating to Arrows, blank, business, central, centralized, chart, circle, circular, circulation concept, conceptual, converging, design, diagram, empty, executive, icon, idea illustration, management, map, mapping, moa, model, numbers, organization outwards, pointing, procedure, process, radial, radiating, relationship, resource sequence, sequential, seven, square, strategy, template. The prominent colors used in the PowerPoint template are Green, Gray, White. Presenters tell us our diverging flow chart consisting 11 stages ppt Circular Arrow Diagram PowerPoint templates are Striking. Presenters tell us our central PowerPoint templates and PPT Slides provide you with a vast range of viable options. Select the appropriate ones and just fill in your text. PowerPoint presentation experts tell us our diverging flow chart consisting 11 stages ppt Circular Arrow Diagram PowerPoint templates are Cheerful. We assure you our centralized PowerPoint templates and PPT Slides are Multicolored. Customers tell us our diverging flow chart consisting 11 stages ppt Circular Arrow Diagram PowerPoint templates are effectively colour coded to prioritise your plans They automatically highlight the sequence of events you desire. People tell us our circle PowerPoint templates and PPT Slides are Quaint. Make a huge difference with our Diverging Flow Chart Consisting 11 Stages Ppt Circular Arrow Diagram PowerPoint Templates. Create the work culture you desire.
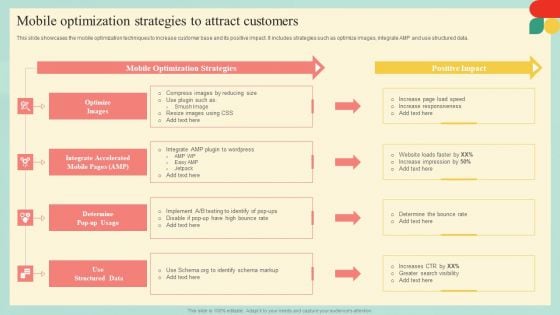
Guide Developing Strategies Improve Travel Tourism Marketing Mobile Optimization Strategies Diagrams PDF
This slide showcases the mobile optimization techniques to increase customer base and its positive impact. It includes strategies such as optimize images, integrate AMP and use structured data. The best PPT templates are a great way to save time, energy, and resources. Slidegeeks have 100 percent editable powerpoint slides making them incredibly versatile. With these quality presentation templates, you can create a captivating and memorable presentation by combining visually appealing slides and effectively communicating your message. Download Guide Developing Strategies Improve Travel Tourism Marketing Mobile Optimization Strategies Diagrams PDF from Slidegeeks and deliver a wonderful presentation.
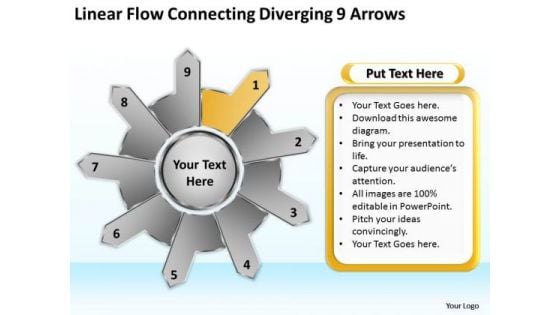
Linear Flow Connecting Diverging 9 Arrows Ppt Gear Process PowerPoint Templates
We present our linear flow connecting diverging 9 arrows ppt Gear Process PowerPoint templates.Download our Flow charts PowerPoint Templates because we provide the means to project your views. Present our Ring Charts PowerPoint Templates because brilliant ideas popping up all over the place. Use our Arrows PowerPoint Templates because it depicts Rolling along while gathering profits along the way is the aim. Download and present our Success PowerPoint Templates because your quest has taken you well onto the path of success. Download and present our Business PowerPoint Templates because watch the excitement levels rise as they realise their worth.Use these PowerPoint slides for presentations relating to Abstract, arrow, brochure, business,button, chart, circle, company, cyclic,data, demonstration, diagram,economic, financial, glossy, goal, graph,illustration, info, information, investment,manage, marketing, model, navigation,option, part, pie, presentation, process. The prominent colors used in the PowerPoint template are Yellow, Black, White. People tell us our linear flow connecting diverging 9 arrows ppt Gear Process PowerPoint templates are Cheerful. Customers tell us our cyclic PowerPoint templates and PPT Slides are Efficient. Professionals tell us our linear flow connecting diverging 9 arrows ppt Gear Process PowerPoint templates are Precious. Presenters tell us our chart PowerPoint templates and PPT Slides will make the presenter successul in his career/life. Use our linear flow connecting diverging 9 arrows ppt Gear Process PowerPoint templates provide you with a vast range of viable options. Select the appropriate ones and just fill in your text. Presenters tell us our company PowerPoint templates and PPT Slides are Functional. See your audience react before your very eyes. Our Linear Flow Connecting Diverging 9 Arrows Ppt Gear Process PowerPoint Templates extract positive delight.
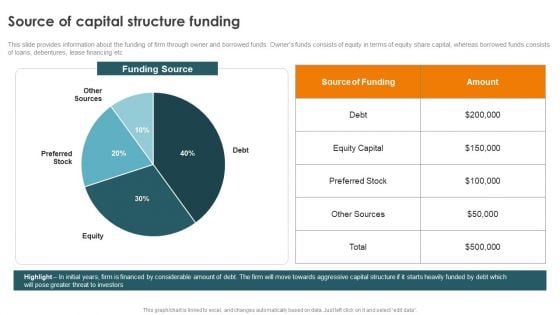
Profitability Modelling Framework Source Of Capital Structure Funding Themes PDF
This slide provides information about the funding of firm through owner and borrowed funds. Owners funds consists of equity in terms of equity share capital, whereas borrowed funds consists of loans, debentures, lease financing etc. The Profitability Modelling Framework Source Of Capital Structure Funding Themes PDF is a compilation of the most recent design trends as a series of slides. It is suitable for any subject or industry presentation, containing attractive visuals and photo spots for businesses to clearly express their messages. This template contains a variety of slides for the user to input data, such as structures to contrast two elements, bullet points, and slides for written information. Slidegeeks is prepared to create an impression.

Confidential Computing System Technology Trust Boundary Across Azure Confidential Portrait PDF
This slide outlines the trust boundary architecture of Azure confidential computing services. The purpose of this slide is to demonstrate the trust boundary level and main activities such as sensitive data, sensitive application code, and sensitive application logs. Make sure to capture your audiences attention in your business displays with our gratis customizable Confidential Computing System Technology Trust Boundary Across Azure Confidential Portrait PDF. These are great for business strategies, office conferences, capital raising or task suggestions. If you desire to acquire more customers for your tech business and ensure they stay satisfied, create your own sales presentation with these plain slides.
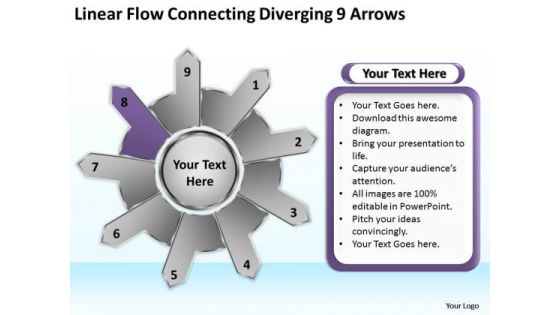
Linear Flow Connecting Diverging 9 Arrows Ppt Cycle Diagram PowerPoint Slides
We present our linear flow connecting diverging 9 arrows ppt Cycle Diagram PowerPoint Slides.Present our Ring Charts PowerPoint Templates because you are going along well but your foresight shows that it may need a slight change in plans or direction. Download and present our Arrows PowerPoint Templates because you can Take your team along by explaining your plans. Download our Success PowerPoint Templates because you have come up with a brilliant breakthrough idea. you can also visualise the interest it will generate. Use our Business PowerPoint Templates because our template will help pinpoint their viability. Download and present our Flow charts PowerPoint Templates because with the help of our Slides you can Illustrate how each element flows seamlessly onto the next stage.Use these PowerPoint slides for presentations relating to Abstract, arrow, brochure, business,button, chart, circle, company, cyclic,data, demonstration, diagram,economic, financial, glossy, goal, graph,illustration, info, information, investment,manage, marketing, model, navigation,option, part, pie, presentation, process,result, section, segmented, sharing,sphere. The prominent colors used in the PowerPoint template are Purple, Black, Gray. People tell us our linear flow connecting diverging 9 arrows ppt Cycle Diagram PowerPoint Slides are Vintage. Customers tell us our company PowerPoint templates and PPT Slides are Zippy. Professionals tell us our linear flow connecting diverging 9 arrows ppt Cycle Diagram PowerPoint Slides are Stunning. Presenters tell us our circle PowerPoint templates and PPT Slides are Ultra. Use our linear flow connecting diverging 9 arrows ppt Cycle Diagram PowerPoint Slides are No-nonsense. Presenters tell us our chart PowerPoint templates and PPT Slides are Perfect. Build on your charisma with our Linear Flow Connecting Diverging 9 Arrows Ppt Cycle Diagram PowerPoint Slides. Create a definite aura around you.
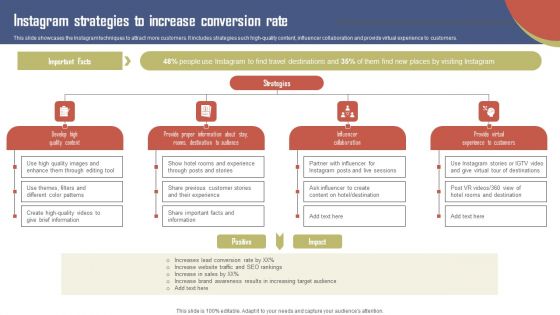
Instagram Strategies To Increase Conversion Rate Effective Travel Marketing Guide For Improving Diagrams PDF
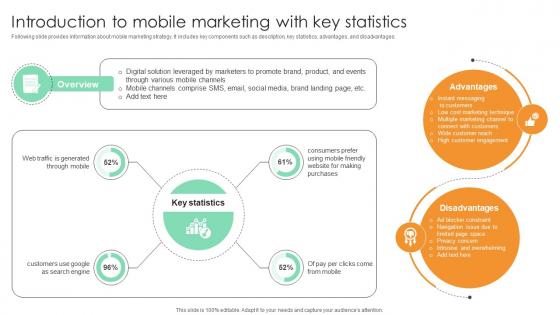
Introduction To Mobile Marketing With Key Statistics Comprehensive Guide For Marketing Technology
Following slide provides information about mobile marketing strategy. It includes key components such as description, key statistics, advantages, and disadvantages.Create an editable Introduction To Mobile Marketing With Key Statistics Comprehensive Guide For Marketing Technology that communicates your idea and engages your audience. Whether you are presenting a business or an educational presentation, pre-designed presentation templates help save time. v is highly customizable and very easy to edit, covering many different styles from creative to business presentations. Slidegeeks has creative team members who have crafted amazing templates. So, go and get them without any delay. Following slide provides information about mobile marketing strategy. It includes key components such as description, key statistics, advantages, and disadvantages.
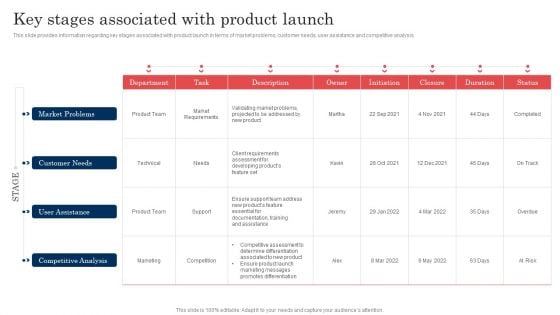
Commodity Launch Administration Playbook Key Stages Associated With Product Diagrams PDF
This slide provides information regarding key stages associated with product marketing launch plan in terms of reference and planning, positioning and messaging, PR and web. The Commodity Launch Administration Playbook Key Stages Associated With Product Diagrams PDF is a compilation of the most recent design trends as a series of slides. It is suitable for any subject or industry presentation, containing attractive visuals and photo spots for businesses to clearly express their messages. This template contains a variety of slides for the user to input data, such as structures to contrast two elements, bullet points, and slides for written information. Slidegeeks is prepared to create an impression.
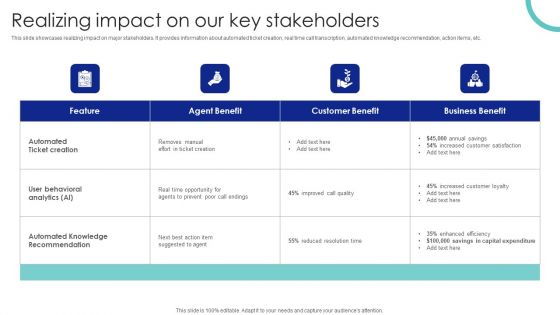
Realizing Impact On Our Key Stakeholders Ppt PowerPoint Presentation Diagram Images PDF
This slide showcases realizing impact on major stakeholders. It provides information about automated ticket creation, real time call transcription, automated knowledge recommendation, action items, etc. The Realizing Impact On Our Key Stakeholders Ppt PowerPoint Presentation Diagram Images PDF is a compilation of the most recent design trends as a series of slides. It is suitable for any subject or industry presentation, containing attractive visuals and photo spots for businesses to clearly express their messages. This template contains a variety of slides for the user to input data, such as structures to contrast two elements, bullet points, and slides for written information. Slidegeeks is prepared to create an impression.
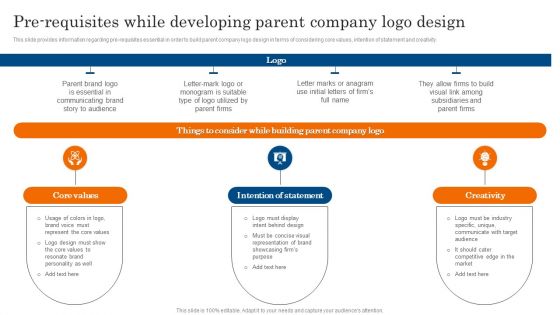
Pre Requisites While Developing Parent Company Logo Design Ppt PowerPoint Presentation Diagram Graph Charts PDF
This slide provides information regarding pre requisites essential in order to build parent company logo design in terms of considering core values, intention of statement and creativity. The Pre Requisites While Developing Parent Company Logo Design Ppt PowerPoint Presentation Diagram Graph Charts PDF is a compilation of the most recent design trends as a series of slides. It is suitable for any subject or industry presentation, containing attractive visuals and photo spots for businesses to clearly express their messages. This template contains a variety of slides for the user to input data, such as structures to contrast two elements, bullet points, and slides for written information. Slidegeeks is prepared to create an impression.
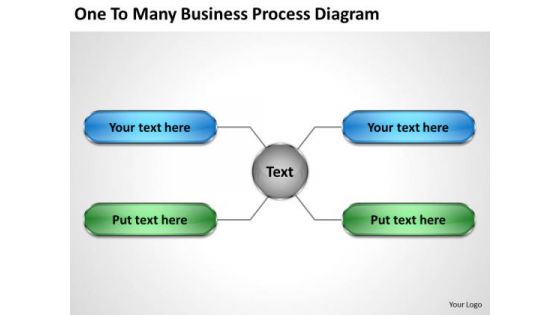
Business Entity Diagram PowerPoint Templates Download Process Slides
We present our business entity diagram powerpoint templates download process Slides.Present our Arrows PowerPoint Templates because Our PowerPoint Templates and Slides are the chords of your song. String them along and provide the lilt to your views. Download our Network Diagrams PowerPoint Templates because You canTake a leap off the starting blocks with our PowerPoint Templates and Slides. They will put you ahead of the competition in quick time. Use our Marketing PowerPoint Templates because These PowerPoint Templates and Slides will give the updraft to your ideas. See them soar to great heights with ease. Present our Business PowerPoint Templates because You can Raise a toast with our PowerPoint Templates and Slides. Spread good cheer amongst your audience. Use our Shapes PowerPoint Templates because Our PowerPoint Templates and Slides will Activate the energies of your audience. Get their creative juices flowing with your words.Use these PowerPoint slides for presentations relating to Arrow, Blue, Box, Brochure, Business, Button, Catalog, Chart, Circle, Company, Cross, Data, Design, Diagram, Direction, Document, Financial, Glossy, Goals, Graph, Green, Junction, Management, Market, Marketing, Model, Multicolored, Multiple, Navigation, Network, Options, Orange, Pie, Plan, Presentation, Process, Purple, Red, Results, Shiny, Six, Sphere, Statistics, Stock, Structure, Template, Vector. The prominent colors used in the PowerPoint template are Blue, Green, Black. Give your thoughts an artistic backing. Add on the craftsmanship of our Business Entity Diagram PowerPoint Templates Download Process Slides.
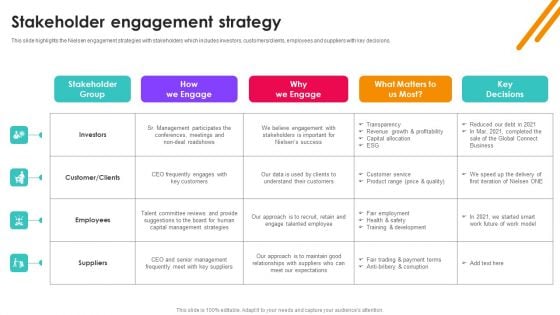
Nielsen Business Profile Stakeholder Engagement Strategy Ppt PowerPoint Presentation Diagram Graph Charts PDF
This slide highlights the Nielsen engagement strategies with stakeholders which includes investors, customers or clients, employees and suppliers with key decisions. The Nielsen Business Profile Stakeholder Engagement Strategy Ppt PowerPoint Presentation Diagram Graph Charts PDF is a compilation of the most recent design trends as a series of slides. It is suitable for any subject or industry presentation, containing attractive visuals and photo spots for businesses to clearly express their messages. This template contains a variety of slides for the user to input data, such as structures to contrast two elements, bullet points, and slides for written information. Slidegeeks is prepared to create an impression.
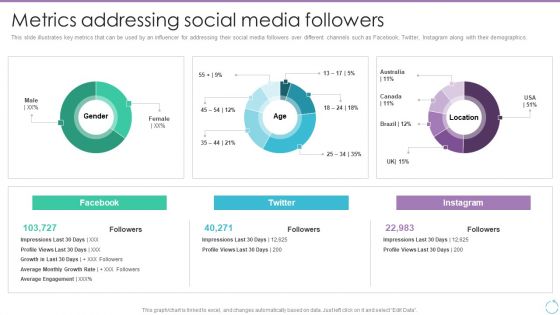
Personal Branding Plan For Executives Metrics Addressing Social Media Followers Diagrams PDF
This slide illustrates key metrics that can be used by an influencer for addressing their social media followers over different channels such as Facebook, Twitter, Instagram along with their demographics. The Personal Branding Plan For Executives Metrics Addressing Social Media Followers Diagrams PDF is a compilation of the most recent design trends as a series of slides. It is suitable for any subject or industry presentation, containing attractive visuals and photo spots for businesses to clearly express their messages. This template contains a variety of slides for the user to input data, such as structures to contrast two elements, bullet points, and slides for written information. Slidegeeks is prepared to create an impression.
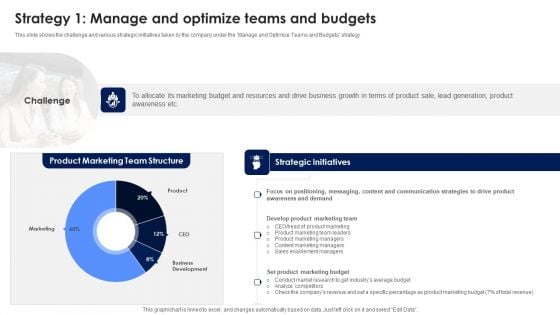
Strategy 1 Manage And Optimize Teams And Budgets Ppt PowerPoint Presentation Diagram Lists PDF
This slide shows the challenge and various strategic initiatives taken by the company under the Manage and Optimize Teams and Budgets strategy The Strategy 1 Manage And Optimize Teams And Budgets Ppt PowerPoint Presentation Diagram Lists PDF is a compilation of the most recent design trends as a series of slides. It is suitable for any subject or industry presentation, containing attractive visuals and photo spots for businesses to clearly express their messages. This template contains a variety of slides for the user to input data, such as structures to contrast two elements, bullet points, and slides for written information. Slidegeeks is prepared to create an impression.
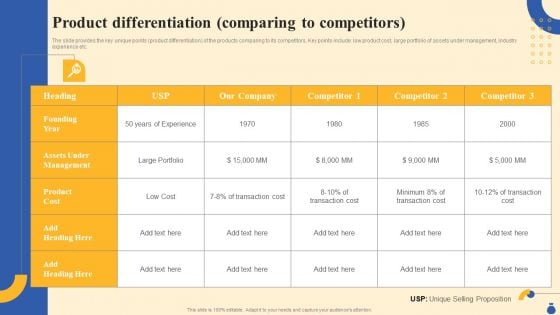
Equity Funding And Debt Financing Pitchbook Product Differentiation Comparing Diagrams PDF
The slide provides the key unique points product differentiation of the products comparing to its competitors. Key points include low product cost, large portfolio of assets under management, industry experience etc. The Equity Funding And Debt Financing Pitchbook Product Differentiation Comparing Diagrams PDF is a compilation of the most recent design trends as a series of slides. It is suitable for any subject or industry presentation, containing attractive visuals and photo spots for businesses to clearly express their messages. This template contains a variety of slides for the user to input data, such as structures to contrast two elements, bullet points, and slides for written information. Slidegeeks is prepared to create an impression.

Enhancing CX Strategy Omnichannel Strategy For Creating Seamless Customer Experience Diagrams PDF
Mentioned slide tabulates the key omnichannel strategies for improving customer service. It defines the action plan and predicted outcome achieved while implementing the same. The Enhancing CX Strategy Omnichannel Strategy For Creating Seamless Customer Experience Diagrams PDF is a compilation of the most recent design trends as a series of slides. It is suitable for any subject or industry presentation, containing attractive visuals and photo spots for businesses to clearly express their messages. This template contains a variety of slides for the user to input data, such as structures to contrast two elements, bullet points, and slides for written information. Slidegeeks is prepared to create an impression.

Digital Marketing Plan For Restaurant Business Hosting Events In Restaurant For Awareness Diagrams PDF
This slide showcases different events that can be hosted by restaurant for local audience awareness. Its key elements are food offers, celebrating occasions and inviting live band.The Digital Marketing Plan For Restaurant Business Hosting Events In Restaurant For Awareness Diagrams PDF is a compilation of the most recent design trends as a series of slides. It is suitable for any subject or industry presentation, containing attractive visuals and photo spots for businesses to clearly express their messages. This template contains a variety of slides for the user to input data, such as structures to contrast two elements, bullet points, and slides for written information. Slidegeeks is prepared to create an impression.
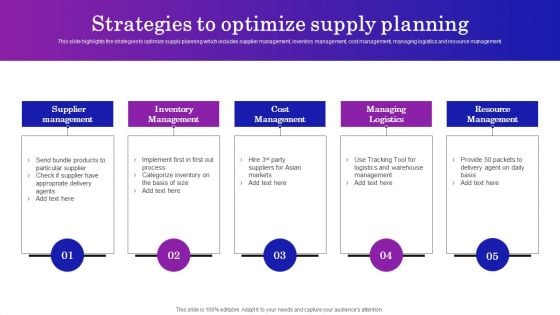
Supply Chain Planning To Enhance Logistics Process Strategies To Optimize Supply Planning Diagrams PDF
This slide highlights the strategies to optimize supply planning which includes supplier management, inventory management, cost management, managing logistics and resource management. The Supply Chain Planning To Enhance Logistics Process Strategies To Optimize Supply Planning Diagrams PDF is a compilation of the most recent design trends as a series of slides. It is suitable for any subject or industry presentation, containing attractive visuals and photo spots for businesses to clearly express their messages. This template contains a variety of slides for the user to input data, such as structures to contrast two elements, bullet points, and slides for written information. Slidegeeks is prepared to create an impression.
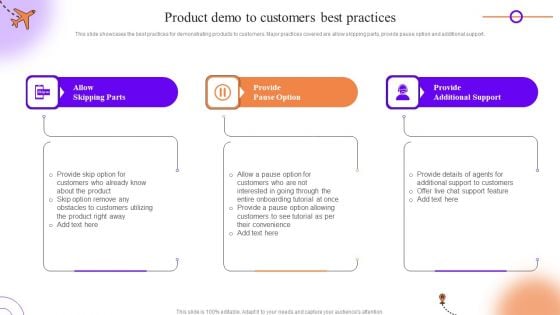
Client Onboarding Journey Impact On Business Product Demo To Customers Best Practices Diagrams PDF
This slide showcases the best practices for demonstrating products to customers. Major practices covered are allow skipping parts, provide pause option and additional support. The Client Onboarding Journey Impact On Business Product Demo To Customers Best Practices Diagrams PDF is a compilation of the most recent design trends as a series of slides. It is suitable for any subject or industry presentation, containing attractive visuals and photo spots for businesses to clearly express their messages. This template contains a variety of slides for the user to input data, such as structures to contrast two elements, bullet points, and slides for written information. Slidegeeks is prepared to create an impression.
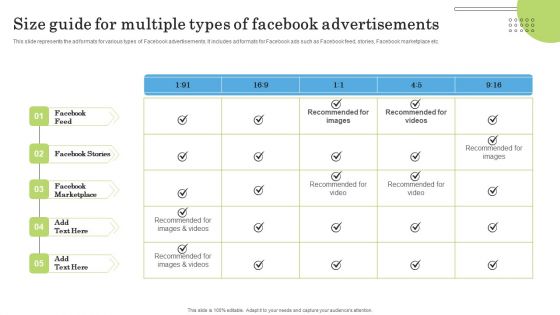
Size Guide For Multiple Types Of Facebook Advertisements Ppt PowerPoint Presentation File Diagrams PDF
This slide represents the ad formats for various types of Facebook advertisements. It includes ad formats for Facebook ads such as Facebook feed, stories, Facebook marketplace etc. The Size Guide For Multiple Types Of Facebook Advertisements Ppt PowerPoint Presentation File Diagrams PDF is a compilation of the most recent design trends as a series of slides. It is suitable for any subject or industry presentation, containing attractive visuals and photo spots for businesses to clearly express their messages. This template contains a variety of slides for the user to input data, such as structures to contrast two elements, bullet points, and slides for written information. Slidegeeks is prepared to create an impression.
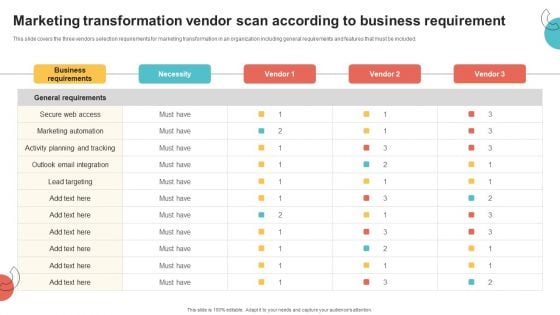
Digital Marketing Toolkit Marketing Transformation Vendor Scan According To Business Requirement Diagrams PDF
This slide covers the three vendors selection requirements for marketing transformation in an organization including general requirements and features that must be included. The Digital Marketing Toolkit Marketing Transformation Vendor Scan According To Business Requirement Diagrams PDF is a compilation of the most recent design trends as a series of slides. It is suitable for any subject or industry presentation, containing attractive visuals and photo spots for businesses to clearly express their messages. This template contains a variety of slides for the user to input data, such as structures to contrast two elements, bullet points, and slides for written information. Slidegeeks is prepared to create an impression.
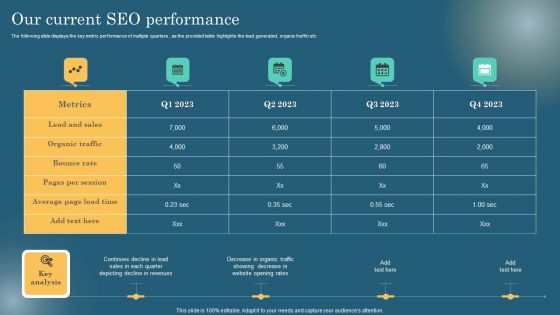
Our Current SEO Performance Maximizing Online Visibility Using Off Site SEO Techniques Diagrams PDF
The following slide displays the key metric performance of multiple quarters , as the provided table highlights the lead generated, organic traffic etc. The Our Current SEO Performance Maximizing Online Visibility Using Off Site SEO Techniques Diagrams PDF is a compilation of the most recent design trends as a series of slides. It is suitable for any subject or industry presentation, containing attractive visuals and photo spots for businesses to clearly express their messages. This template contains a variety of slides for the user to input data, such as structures to contrast two elements, bullet points, and slides for written information. Slidegeeks is prepared to create an impression.
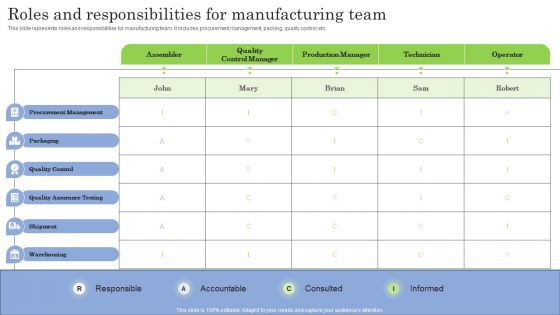
Roles And Responsibilities For Manufacturing Team Ppt PowerPoint Presentation Diagram Images PDF
This slide represents roles and responsibilities for manufacturing team. It includes procurement management, packing, quality control etc. The Roles And Responsibilities For Manufacturing Team Ppt PowerPoint Presentation Diagram Images PDF is a compilation of the most recent design trends as a series of slides. It is suitable for any subject or industry presentation, containing attractive visuals and photo spots for businesses to clearly express their messages. This template contains a variety of slides for the user to input data, such as structures to contrast two elements, bullet points, and slides for written information. Slidegeeks is prepared to create an impression.
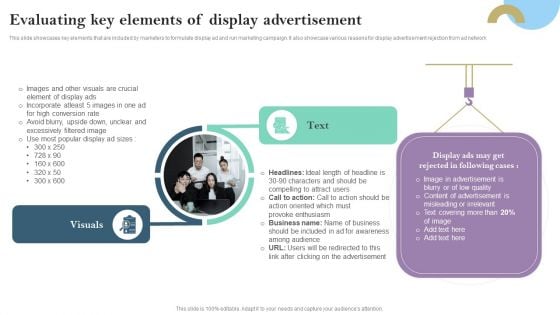
Evaluating Key Elements Of Display Advertisement Ppt PowerPoint Presentation Diagram Lists PDF
This slide showcases key elements that are included by marketers to formulate display ad and run marketing campaign. It also showcase various reasons for display advertisement rejection from ad network The Evaluating Key Elements Of Display Advertisement Ppt PowerPoint Presentation Diagram Lists PDF is a compilation of the most recent design trends as a series of slides. It is suitable for any subject or industry presentation, containing attractive visuals and photo spots for businesses to clearly express their messages. This template contains a variety of slides for the user to input data, such as structures to contrast two elements, bullet points, and slides for written information. Slidegeeks is prepared to create an impression.
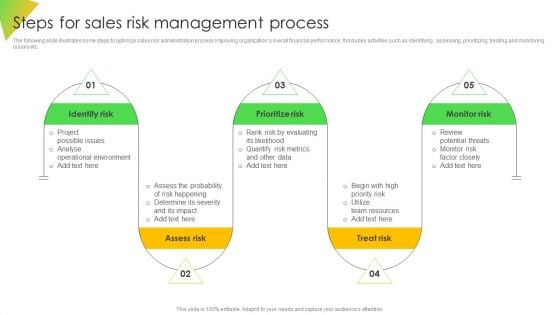
Steps For Sales Risk Management Process Ppt Diagram Graph Charts PDF
The following slide illustrates some steps to optimize sales risk administration process improving organizations overall financial performance. It includes activities such as identifying , assessing, prioritizing, treating and monitoring issues etc. The Steps For Sales Risk Management Process Ppt Diagram Graph Charts PDF is a compilation of the most recent design trends as a series of slides. It is suitable for any subject or industry presentation, containing attractive visuals and photo spots for businesses to clearly express their messages. This template contains a variety of slides for the user to input data, such as structures to contrast two elements, bullet points, and slides for written information. Slidegeeks is prepared to create an impression.
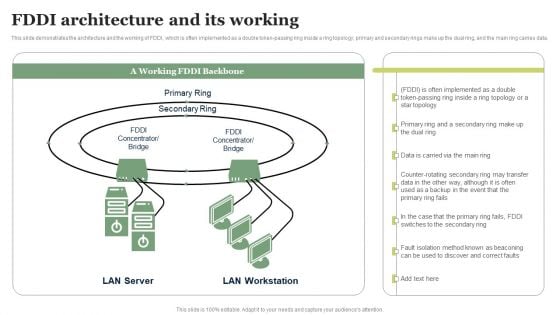
FDDI Architecture And Its Working Ppt PowerPoint Presentation Diagram Graph Charts PDF
This slide demonstrates the architecture and the working of FDDI, which is often implemented as a double token-passing ring inside a ring topology primary and secondary rings make up the dual ring, and the main ring carries data. Here you can discover an assortment of the finest PowerPoint and Google Slides templates. With these templates, you can create presentations for a variety of purposes while simultaneously providing your audience with an eye catching visual experience. Download FDDI Architecture And Its Working Ppt PowerPoint Presentation Diagram Graph Charts PDF to deliver an impeccable presentation. These templates will make your job of preparing presentations much quicker, yet still, maintain a high level of quality. Slidegeeks has experienced researchers who prepare these templates and write high quality content for you. Later on, you can personalize the content by editing the FDDI Architecture And Its Working Ppt PowerPoint Presentation Diagram Graph Charts PDF.

Online PR Techniques To Boost Brands Online Visibility Key Statistics Related To Public Relations Elements PDF
This slide shows statistics which can be used considered by organizations while developing a PR marketing campaign or plan. It includes stats related to PR firms, PR market revenue, PR agencies annual spend etc. The Online PR Techniques To Boost Brands Online Visibility Key Statistics Related To Public Relations Elements PDF is a compilation of the most recent design trends as a series of slides. It is suitable for any subject or industry presentation, containing attractive visuals and photo spots for businesses to clearly express their messages. This template contains a variety of slides for the user to input data, such as structures to contrast two elements, bullet points, and slides for written information. Slidegeeks is prepared to create an impression.

Survey Results Related To Social Media Recruitment Enhancing Social Media Recruitment Process Professional PDF
This slide focuses on survey results related to social media recruitment which shows importance of social media to recruitment strategy and how many remain companies remain active across different social media platforms.The Survey Results Related To Social Media Recruitment Enhancing Social Media Recruitment Process Professional PDF is a compilation of the most recent design trends as a series of slides. It is suitable for any subject or industry presentation, containing attractive visuals and photo spots for businesses to clearly express their messages. This template contains a variety of slides for the user to input data, such as structures to contrast two elements, bullet points, and slides for written information. Slidegeeks is prepared to create an impression.
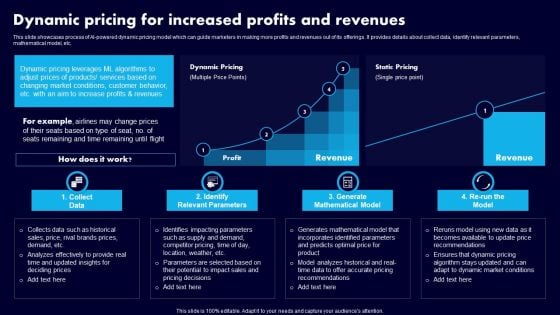
Dynamic Pricing For Increased Profits And Revenues Ppt Portfolio Picture PDF
This slide showcases process of AI-powered dynamic pricing model which can guide marketers in making more profits and revenues out of its offerings. It provides details about collect data, identify relevant parameters, mathematical model, etc. Want to ace your presentation in front of a live audience Our Dynamic Pricing For Increased Profits And Revenues Ppt Portfolio Picture PDF can help you do that by engaging all the users towards you.. Slidegeeks experts have put their efforts and expertise into creating these impeccable powerpoint presentations so that you can communicate your ideas clearly. Moreover, all the templates are customizable, and easy-to-edit and downloadable. Use these for both personal and commercial use.


 Continue with Email

 Home
Home


