Data Science Strategy
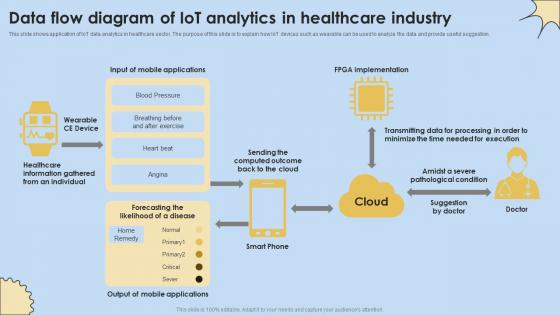
Data Flow Diagram Of IoT Analytics In Healthcare Industry Internet Of Things Analysis Clipart Pdf
This slide shows application of IoT data analytics in healthcare sector. The purpose of this slide is to explain how IoT devices such as wearable can be used to analyze the data and provide useful suggestion. If you are looking for a format to display your unique thoughts, then the professionally designed Data Flow Diagram Of IoT Analytics In Healthcare Industry Internet Of Things Analysis Clipart Pdf is the one for you. You can use it as a Google Slides template or a PowerPoint template. Incorporate impressive visuals, symbols, images, and other charts. Modify or reorganize the text boxes as you desire. Experiment with shade schemes and font pairings. Alter, share or cooperate with other people on your work. Download Data Flow Diagram Of IoT Analytics In Healthcare Industry Internet Of Things Analysis Clipart Pdf and find out how to give a successful presentation. Present a perfect display to your team and make your presentation unforgettable. This slide shows application of IoT data analytics in healthcare sector. The purpose of this slide is to explain how IoT devices such as wearable can be used to analyze the data and provide useful suggestion.
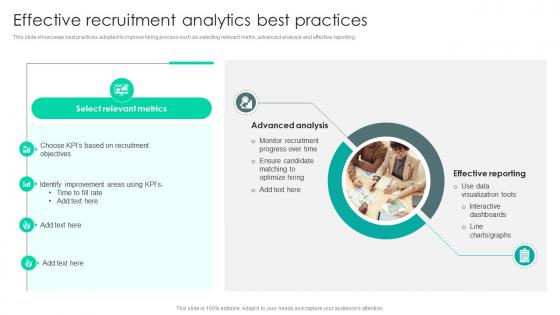
Strategic Staffing Using Data Effective Recruitment Analytics Best Practices CRP DK SS V
This slide showcases best practices adopted to improve hiring process such as selecting relevant metric, advanced analysis and effective reporting. Formulating a presentation can take up a lot of effort and time, so the content and message should always be the primary focus. The visuals of the PowerPoint can enhance the presenters message, so our Strategic Staffing Using Data Effective Recruitment Analytics Best Practices CRP DK SS V was created to help save time. Instead of worrying about the design, the presenter can concentrate on the message while our designers work on creating the ideal templates for whatever situation is needed. Slidegeeks has experts for everything from amazing designs to valuable content, we have put everything into Strategic Staffing Using Data Effective Recruitment Analytics Best Practices CRP DK SS V. This slide showcases best practices adopted to improve hiring process such as selecting relevant metric, advanced analysis and effective reporting.
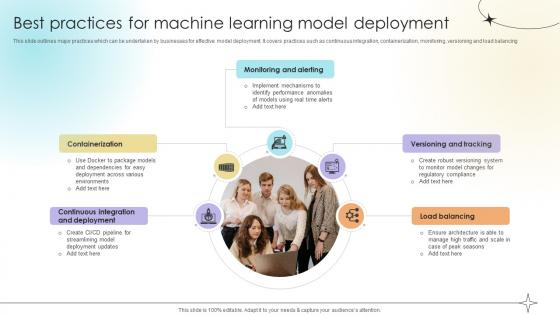
Best Practices For Machine Learning Model Deployment Data Analytics SS V
This slide outlines major practices which can be undertaken by businesses for effective model deployment. It covers practices such as continuous integration, containerization, monitoring, versioning and load balancing.This Best Practices For Machine Learning Model Deployment Data Analytics SS V is perfect for any presentation, be it in front of clients or colleagues. It is a versatile and stylish solution for organizing your meetings. The Best Practices For Machine Learning Model Deployment Data Analytics SS V features a modern design for your presentation meetings. The adjustable and customizable slides provide unlimited possibilities for acing up your presentation. Slidegeeks has done all the homework before launching the product for you. So, do not wait, grab the presentation templates today This slide outlines major practices which can be undertaken by businesses for effective model deployment. It covers practices such as continuous integration, containerization, monitoring, versioning and load balancing.
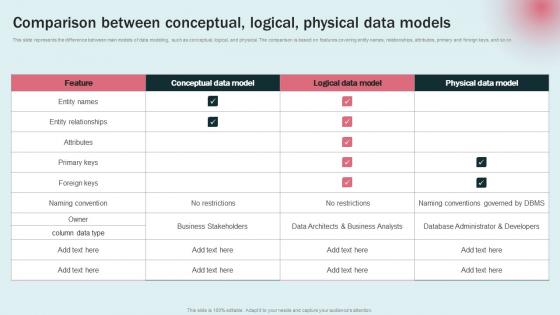
Comparison Between Conceptual Data Modeling Approaches For Modern Analytics Professional Pdf
This slide represents the difference between main models of data modeling, such as conceptual, logical, and physical. The comparison is based on features covering entity names, relationships, attributes, primary and foreign keys, and so on. From laying roadmaps to briefing everything in detail, our templates are perfect for you. You can set the stage with your presentation slides. All you have to do is download these easy to edit and customizable templates. Comparison Between Conceptual Data Modeling Approaches For Modern Analytics Professional Pdf will help you deliver an outstanding performance that everyone would remember and praise you for. Do download this presentation today. This slide represents the difference between main models of data modeling, such as conceptual, logical, and physical. The comparison is based on features covering entity names, relationships, attributes, primary and foreign keys, and so on.

Government And Public Sector Industry Data Analytics Company Outline Clipart PDF
The following slide highlights the research services offered by Kantar company to the government and public sector industry. It also shows the clients and impact of solutions provided. Make sure to capture your audiences attention in your business displays with our gratis customizable Government And Public Sector Industry Data Analytics Company Outline Clipart PDF These are great for business strategies, office conferences, capital raising or task suggestions. If you desire to acquire more customers for your tech business and ensure they stay satisfied, create your own sales presentation with these plain slides. The following slide highlights the research services offered by Kantar company to the government and public sector industry. It also shows the clients and impact of solutions provided

Integration Of Big Data Text And Predictive Analytics PPT Example SS
This slide outlines the integrated architecture of big data, text analytics, and predictive analytics, including elements deployment, modeling, statistics, etc. Welcome to our selection of the Integration Of Big Data Text And Predictive Analytics PPT Example SS. These are designed to help you showcase your creativity and bring your sphere to life. Planning and Innovation are essential for any business that is just starting out. This collection contains the designs that you need for your everyday presentations. All of our PowerPoints are 100Percent editable, so you can customize them to suit your needs. This multi-purpose template can be used in various situations. Grab these presentation templates today. This slide outlines the integrated architecture of big data, text analytics, and predictive analytics, including elements deployment, modeling, statistics, etc.
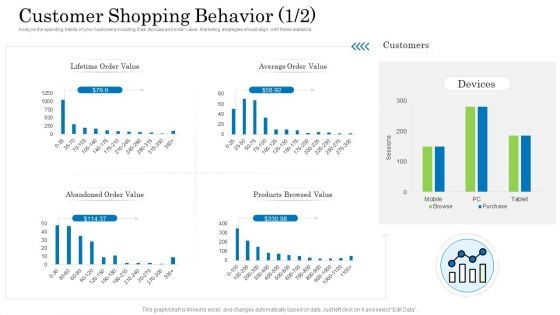
Customer Behavioral Data And Analytics Customer Shopping Behavior Average Formats PDF
Analyze the spending habits of your customers including their devices and order value. Marketing strategies should align with these statistics. Deliver and pitch your topic in the best possible manner with this customer behavioral data and analytics customer shopping behavior average formats pdf. Use them to share invaluable insights on lifetime order value, average order value, abandoned order value, products browsed value and impress your audience. This template can be altered and modified as per your expectations. So, grab it now.
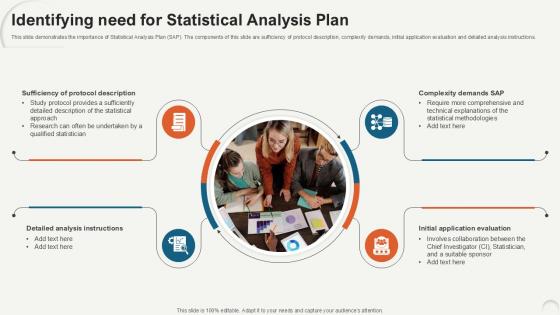
Identifying Need For Statistical Data Analytics For Informed Decision Ppt PowerPoint
This slide demonstrates the importance of Statistical Analysis Plan SAP. The components of this slide are sufficiency of protocol description, complexity demands, initial application evaluation and detailed analysis instructions. Coming up with a presentation necessitates that the majority of the effort goes into the content and the message you intend to convey. The visuals of a PowerPoint presentation can only be effective if it supplements and supports the story that is being told. Keeping this in mind our experts created Identifying Need For Statistical Data Analytics For Informed Decision Ppt PowerPoint to reduce the time that goes into designing the presentation. This way, you can concentrate on the message while our designers take care of providing you with the right template for the situation. This slide demonstrates the importance of Statistical Analysis Plan SAP. The components of this slide are sufficiency of protocol description, complexity demands, initial application evaluation and detailed analysis instructions.
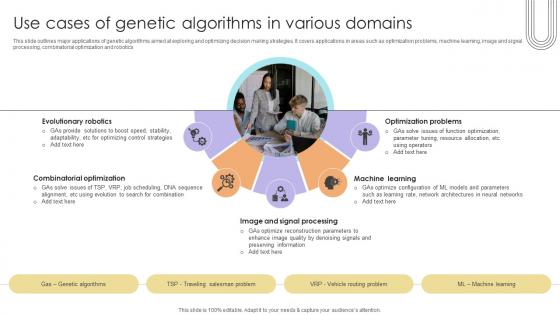
Use Cases Of Genetic Algorithms In Various Domains Data Analytics SS V
This slide outlines major applications of genetic algorithms aimed at exploring and optimizing decision making strategies. It covers applications in areas such as optimization problems, machine learning, image and signal processing, combinatorial optimization and robotics.Are you searching for a Use Cases Of Genetic Algorithms In Various Domains Data Analytics SS V that is uncluttered, straightforward, and original Its easy to edit, and you can change the colors to suit your personal or business branding. For a presentation that expresses how much effort you have put in, this template is ideal With all of its features, including tables, diagrams, statistics, and lists, its perfect for a business plan presentation. Make your ideas more appealing with these professional slides. Download Use Cases Of Genetic Algorithms In Various Domains Data Analytics SS V from Slidegeeks today. This slide outlines major applications of genetic algorithms aimed at exploring and optimizing decision making strategies. It covers applications in areas such as optimization problems, machine learning, image and signal processing, combinatorial optimization and robotics.
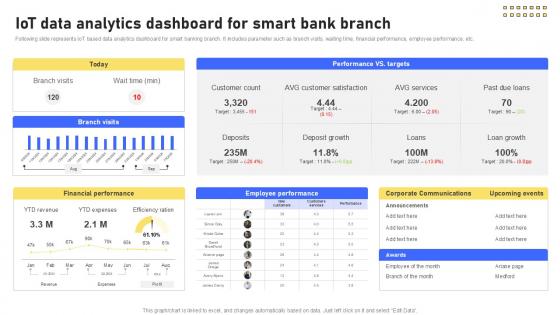
IoT Data Analytics Dashboard For Banking Future With IoT Ppt Powerpoint IoT SS V
Following slide represents IoT based data analytics dashboard for smart banking branch. It includes parameter such as branch visits, waiting time, financial performance, employee performance, etc. Slidegeeks is here to make your presentations a breeze with IoT Data Analytics Dashboard For Banking Future With IoT Ppt Powerpoint IoT SS V With our easy-to-use and customizable templates, you can focus on delivering your ideas rather than worrying about formatting. With a variety of designs to choose from, you are sure to find one that suits your needs. And with animations and unique photos, illustrations, and fonts, you can make your presentation pop. So whether you are giving a sales pitch or presenting to the board, make sure to check out Slidegeeks first Following slide represents IoT based data analytics dashboard for smart banking branch. It includes parameter such as branch visits, waiting time, financial performance, employee performance, etc.
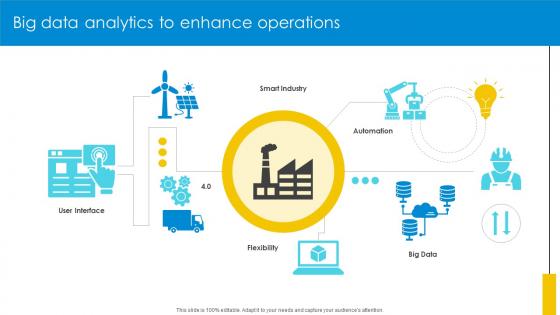
Big Data Analytics To Enhance Operations Optimizing Inventory Management IoT SS V
If your project calls for a presentation, then Slidegeeks is your go-to partner because we have professionally designed, easy-to-edit templates that are perfect for any presentation. After downloading, you can easily edit Big Data Analytics To Enhance Operations Optimizing Inventory Management IoT SS V and make the changes accordingly. You can rearrange slides or fill them with different images. Check out all the handy templates Our Big Data Analytics To Enhance Operations Optimizing Inventory Management IoT SS V are topically designed to provide an attractive backdrop to any subject. Use them to look like a presentation pro.
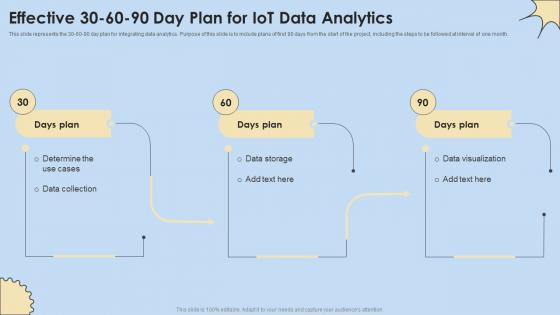
Effective 30 60 90 Day Plan For IoT Data Analytics Internet Of Things Analysis Summary Pdf
This slide represents the 30-60-90 day plan for integrating data analytics. Purpose of this slide is to include plans of first 90 days from the start of the project, including the steps to be followed at interval of one month. Crafting an eye-catching presentation has never been more straightforward. Let your presentation shine with this tasteful yet straightforward Effective 30 60 90 Day Plan For IoT Data Analytics Internet Of Things Analysis Summary Pdf template. It offers a minimalistic and classy look that is great for making a statement. The colors have been employed intelligently to add a bit of playfulness while still remaining professional. Construct the ideal Effective 30 60 90 Day Plan For IoT Data Analytics Internet Of Things Analysis Summary Pdf that effortlessly grabs the attention of your audience. Begin now and be certain to wow your customers. This slide represents the 30-60-90 day plan for integrating data analytics. Purpose of this slide is to include plans of first 90 days from the start of the project, including the steps to be followed at interval of one month.
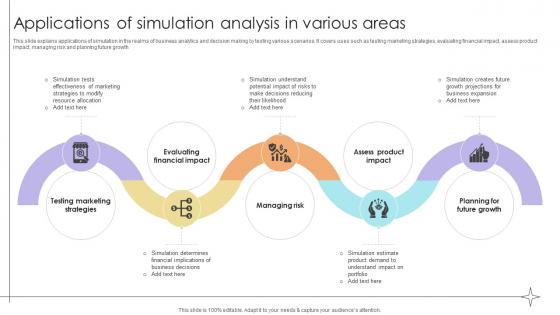
Applications Of Simulation Analysis In Various Areas Data Analytics SS V
This slide explains applications of simulation in the realms of business analytics and decision making by testing various scenarios. It covers uses such as testing marketing strategies, evaluating financial impact, assess product impact, managing risk and planning future growth.Whether you have daily or monthly meetings, a brilliant presentation is necessary. Applications Of Simulation Analysis In Various Areas Data Analytics SS V can be your best option for delivering a presentation. Represent everything in detail using Applications Of Simulation Analysis In Various Areas Data Analytics SS V and make yourself stand out in meetings. The template is versatile and follows a structure that will cater to your requirements. All the templates prepared by Slidegeeks are easy to download and edit. Our research experts have taken care of the corporate themes as well. So, give it a try and see the results. This slide explains applications of simulation in the realms of business analytics and decision making by testing various scenarios. It covers uses such as testing marketing strategies, evaluating financial impact, assess product impact, managing risk and planning future growth.
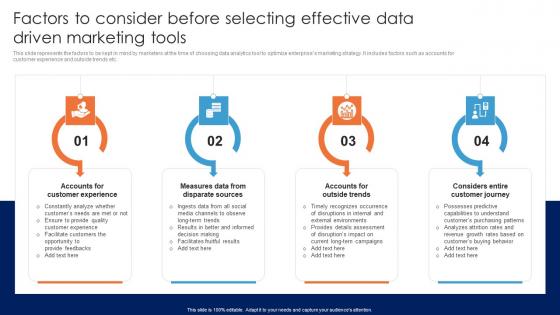
Factors To Consider Before Selecting Effective Guide For Data Driven Advertising Microsoft Pdf
This slide represents the factors to be kept in mind by marketers at the time of choosing data analytics tool to optimize enterprises marketing strategy. It includes factors such as accounts for customer experience and outside trends etc.Boost your pitch with our creative Factors To Consider Before Selecting Effective Guide For Data Driven Advertising Microsoft Pdf. Deliver an awe-inspiring pitch that will mesmerize everyone. Using these presentation templates you will surely catch everyones attention. You can browse the ppts collection on our website. We have researchers who are experts at creating the right content for the templates. So you do not have to invest time in any additional work. Just grab the template now and use them. This slide represents the factors to be kept in mind by marketers at the time of choosing data analytics tool to optimize enterprises marketing strategy. It includes factors such as accounts for customer experience and outside trends etc.
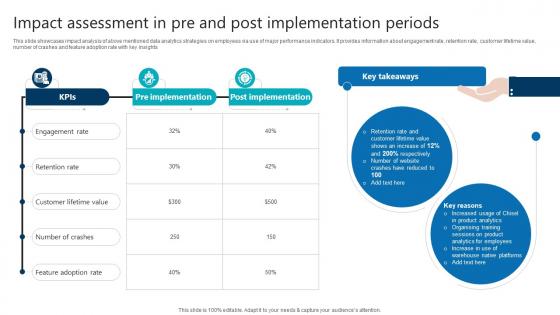
Impact Assessment In Pre And Post Implementation Periods Product Analytics Implementation Data Analytics V
This slide showcases impact analysis of above mentioned data analytics strategies on employees via use of major performance indicators. It provides information about engagement rate, retention rate, customer lifetime value, number of crashes and feature adoption rate with key insights Explore a selection of the finest Impact Assessment In Pre And Post Implementation Periods Product Analytics Implementation Data Analytics V here. With a plethora of professionally designed and pre-made slide templates, you can quickly and easily find the right one for your upcoming presentation. You can use our Impact Assessment In Pre And Post Implementation Periods Product Analytics Implementation Data Analytics V to effectively convey your message to a wider audience. Slidegeeks has done a lot of research before preparing these presentation templates. The content can be personalized and the slides are highly editable. Grab templates today from Slidegeeks. This slide showcases impact analysis of above mentioned data analytics strategies on employees via use of major performance indicators. It provides information about engagement rate, retention rate, customer lifetime value, number of crashes and feature adoption rate with key insights
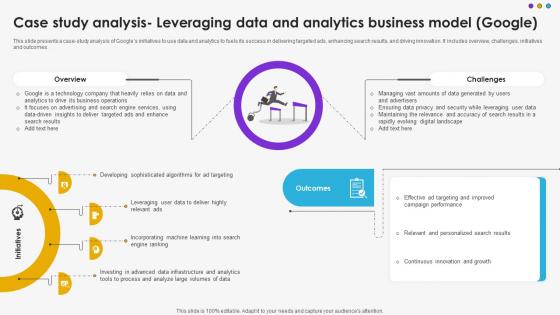
Case Study Analysis Leveraging Data And Analytics Business Model Google DT SS V
This slide presents a case-study analysis of Googles initiatives to use data and analytics to fuels its success in delivering targeted ads, enhancing search results, and driving innovation. It includes overview, challenges, initiatives and outcomes.Find highly impressive Case Study Analysis Leveraging Data And Analytics Business Model Google DT SS V on Slidegeeks to deliver a meaningful presentation. You can save an ample amount of time using these presentation templates. No need to worry to prepare everything from scratch because Slidegeeks experts have already done a huge research and work for you. You need to download Case Study Analysis Leveraging Data And Analytics Business Model Google DT SS V for your upcoming presentation. All the presentation templates are 100 percent editable and you can change the color and personalize the content accordingly. Download now This slide presents a case-study analysis of Googles initiatives to use data and analytics to fuels its success in delivering targeted ads, enhancing search results, and driving innovation. It includes overview, challenges, initiatives and outcomes.
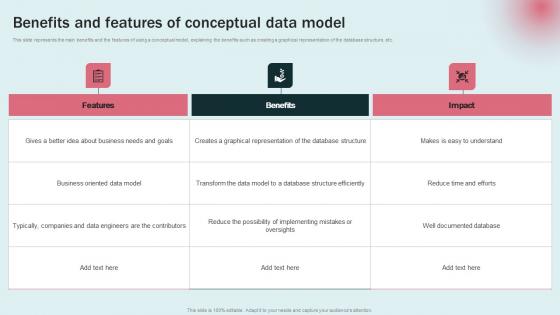
Benefits And Features Conceptual Data Modeling Approaches For Modern Analytics Sample Pdf
This slide represents the main benefits and the features of using a conceptual model, explaining the benefits such as creating a graphical representation of the database structure, etc. Create an editable Benefits And Features Conceptual Data Modeling Approaches For Modern Analytics Sample Pdf that communicates your idea and engages your audience. Whether you are presenting a business or an educational presentation, pre designed presentation templates help save time. Benefits And Features Conceptual Data Modeling Approaches For Modern Analytics Sample Pdf is highly customizable and very easy to edit, covering many different styles from creative to business presentations. Slidegeeks has creative team members who have crafted amazing templates. So, go and get them without any delay. This slide represents the main benefits and the features of using a conceptual model, explaining the benefits such as creating a graphical representation of the database structure, etc.
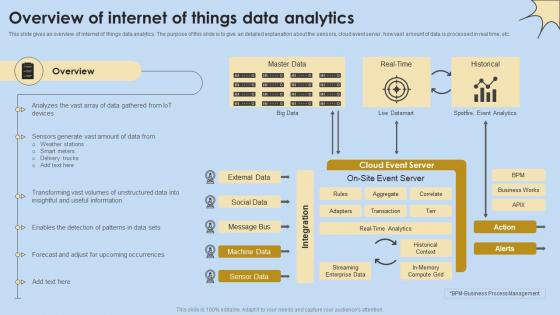
Overview Of Internet Of Things Data Analytics Internet Of Things Analysis Clipart Pdf
This slide gives an overview of internet of things data analytics. The purpose of this slide is to give an detailed explanation about the sensors, cloud event server, how vast amount of data is processed in real time, etc. Retrieve professionally designed Overview Of Internet Of Things Data Analytics Internet Of Things Analysis Clipart Pdf to effectively convey your message and captivate your listeners. Save time by selecting pre-made slideshows that are appropriate for various topics, from business to educational purposes. These themes come in many different styles, from creative to corporate, and all of them are easily adjustable and can be edited quickly. Access them as PowerPoint templates or as Google Slides themes. You do not have to go on a hunt for the perfect presentation because Slidegeeks got you covered from everywhere. This slide gives an overview of internet of things data analytics. The purpose of this slide is to give an detailed explanation about the sensors, cloud event server, how vast amount of data is processed in real time, etc.
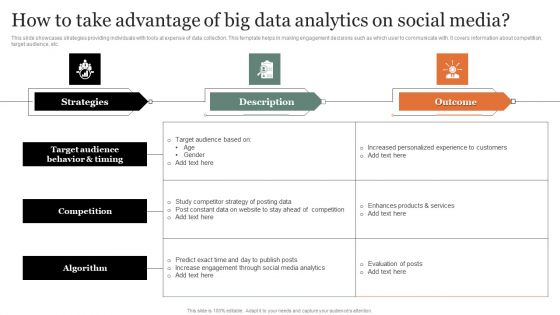
How To Take Advantage Of Big Data Analytics On Social Media Infographics PDF
This slide showcases strategies providing individuals with tools at expense of data collection. This template helps in making engagement decisions such as which user to communicate with. It covers information about competition, target audience, etc. Pitch your topic with ease and precision using this How To Take Advantage Of Big Data Analytics On Social Media Infographics PDF Graphics. This layout presents information on Target Audience Behavior, Competition, Algorithm. It is also available for immediate download and adjustment. So, changes can be made in the color, design, graphics or any other component to create a unique layout.
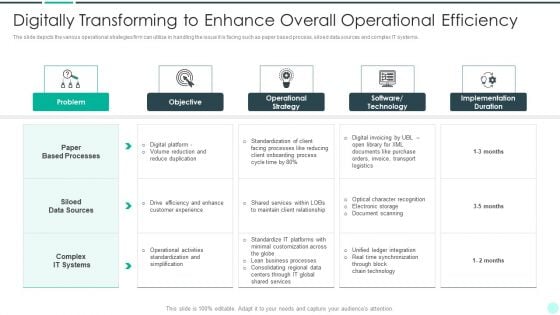
Executing Advance Data Analytics At Workspace Digitally Transforming To Enhance Demonstration PDF
The slide depicts the various operational strategies firm can utilize in handling the issue it is facing such as paper based process, siloed data sources and complex IT systems. Presenting executing advance data analytics at workspace digitally transforming to enhance demonstration pdf to provide visual cues and insights. Share and navigate important information on six stages that need your due attention. This template can be used to pitch topics like digitally transforming to enhance overall operational efficiency. In addtion, this PPT design contains high resolution images, graphics, etc, that are easily editable and available for immediate download.
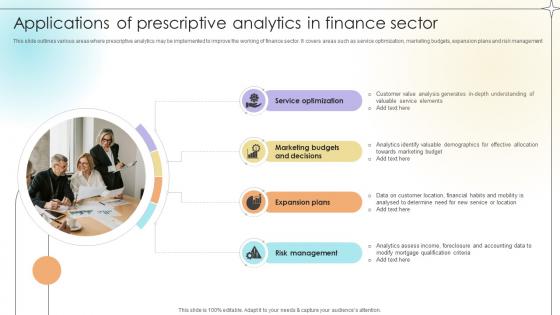
Applications Of Prescriptive Analytics In Finance Sector Data Analytics SS V
This slide outlines various areas where prescriptive analytics may be implemented to improve the working of finance sector. It covers areas such as service optimization, marketing budgets, expansion plans and risk management.Present like a pro with Applications Of Prescriptive Analytics In Finance Sector Data Analytics SS V. Create beautiful presentations together with your team, using our easy-to-use presentation slides. Share your ideas in real-time and make changes on the fly by downloading our templates. So whether you are in the office, on the go, or in a remote location, you can stay in sync with your team and present your ideas with confidence. With Slidegeeks presentation got a whole lot easier. Grab these presentations today. This slide outlines various areas where prescriptive analytics may be implemented to improve the working of finance sector. It covers areas such as service optimization, marketing budgets, expansion plans and risk management.
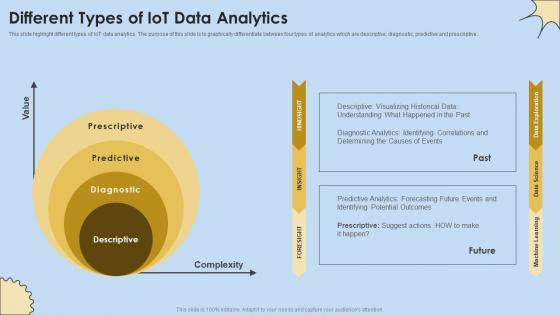
Different Types Of IoT Data Analytics Internet Of Things Analysis Mockup Pdf
This slide highlight different types of IoT data analytics. The purpose of this slide is to graphically differentiate between four types of analytics which are descriptive, diagnostic, predictive and prescriptive. Are you in need of a template that can accommodate all of your creative concepts This one is crafted professionally and can be altered to fit any style. Use it with Google Slides or PowerPoint. Include striking photographs, symbols, depictions, and other visuals. Fill, move around, or remove text boxes as desired. Test out color palettes and font mixtures. Edit and save your work, or work with colleagues. Download Different Types Of IoT Data Analytics Internet Of Things Analysis Mockup Pdf and observe how to make your presentation outstanding. Give an impeccable presentation to your group and make your presentation unforgettable. This slide highlight different types of IoT data analytics. The purpose of this slide is to graphically differentiate between four types of analytics which are descriptive, diagnostic, predictive and prescriptive.
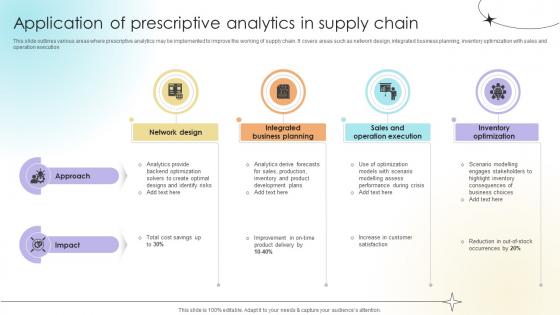
Application Of Prescriptive Analytics In Supply Chain Data Analytics SS V
This slide outlines various areas where prescriptive analytics may be implemented to improve the working of supply chain. It covers areas such as network design, integrated business planning, inventory optimization with sales and operation execution There are so many reasons you need a Application Of Prescriptive Analytics In Supply Chain Data Analytics SS V. The first reason is you can not spend time making everything from scratch, Thus, Slidegeeks has made presentation templates for you too. You can easily download these templates from our website easily. This slide outlines various areas where prescriptive analytics may be implemented to improve the working of supply chain. It covers areas such as network design, integrated business planning, inventory optimization with sales and operation execution
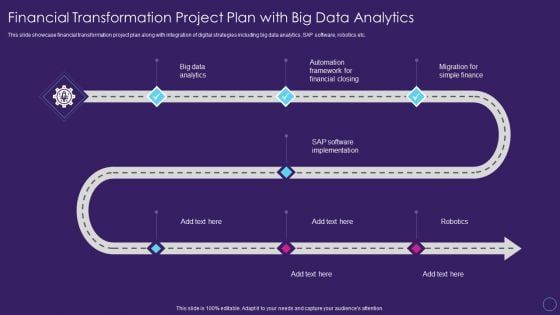
Financial Transformation Project Plan With Big Data Digital Transformation Toolkit Accounting Finance Mockup PDF
This slide showcase financial transformation project plan along with integration of digital strategies including big data analytics, SAP software, robotics etc. Presenting financial transformation project plan with big data digital transformation toolkit accounting finance mockup pdf to provide visual cues and insights. Share and navigate important information on seven stages that need your due attention. This template can be used to pitch topics like financial transformation project plan with big data analytics. In addtion, this PPT design contains high resolution images, graphics, etc, that are easily editable and available for immediate download.

Deck Presentation Solutions for Enhanced Data Reach and Visibility PPT Sample
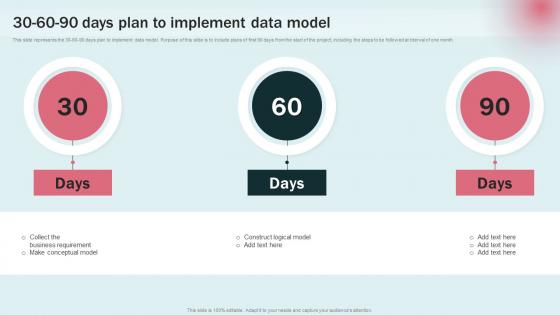
30 60 90 Days Plan To Implement Data Modeling Approaches For Modern Analytics Guidelines Pdf
This slide represents the 30 60 90 days plan to implement data model. Purpose of this slide is to include plans of first 90 days from the start of the project, including the steps to be followed at interval of one month. Find a pre designed and impeccable 30 60 90 Days Plan To Implement Data Modeling Approaches For Modern Analytics Guidelines Pdf. The templates can ace your presentation without additional effort. You can download these easy to edit presentation templates to make your presentation stand out from others. So, what are you waiting for Download the template from Slidegeeks today and give a unique touch to your presentation. This slide represents the 30 60 90 days plan to implement data model. Purpose of this slide is to include plans of first 90 days from the start of the project, including the steps to be followed at interval of one month.

Statistical Tools For Evidence Insurance Policy Cancellation Reduction Using Data Analytics
This slide represents the concise overview of the problem, the proposed solution, and the achieved result for using data analytics for insurance policy cancellation reduction. The outcomes are minimized consumer loss to rival businesses, identified high risk consumers, etc. The best PPT templates are a great way to save time, energy, and resources. Slidegeeks have 100 percent editable powerpoint slides making them incredibly versatile. With these quality presentation templates, you can create a captivating and memorable presentation by combining visually appealing slides and effectively communicating your message. Download Statistical Tools For Evidence Insurance Policy Cancellation Reduction Using Data Analytics from Slidegeeks and deliver a wonderful presentation. This slide represents the concise overview of the problem, the proposed solution, and the achieved result for using data analytics for insurance policy cancellation reduction. The outcomes are minimized consumer loss to rival businesses, identified high risk consumers, etc.
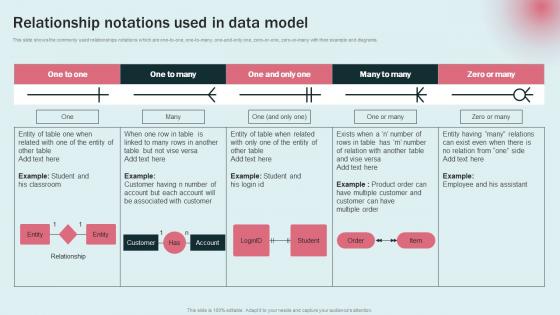
Relationship Notations Used Data Modeling Approaches For Modern Analytics Pictures Pdf
This slide shows the commonly used relationships notations which are one to one, one to many, one and only one, zero or one, zero or many with their example and diagrams. The Relationship Notations Used Data Modeling Approaches For Modern Analytics Pictures Pdf is a compilation of the most recent design trends as a series of slides. It is suitable for any subject or industry presentation, containing attractive visuals and photo spots for businesses to clearly express their messages. This template contains a variety of slides for the user to input data, such as structures to contrast two elements, bullet points, and slides for written information. Slidegeeks is prepared to create an impression. This slide shows the commonly used relationships notations which are one to one, one to many, one and only one, zero or one, zero or many with their example and diagrams.
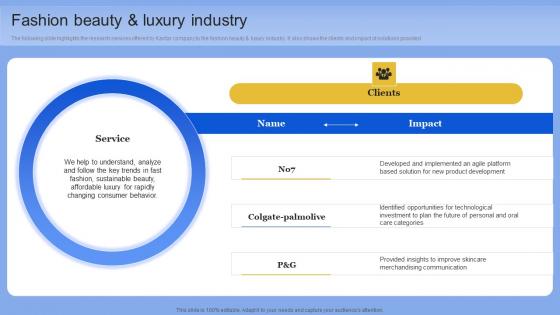
Fashion Beauty And Luxury Industry Data Analytics Company Outline Graphics PDF
The following slide highlights the research services offered by Kantar company to the fashion beauty and luxury industry. It also shows the clients and impact of solutions provided. Find highly impressive Fashion Beauty And Luxury Industry Data Analytics Company Outline Graphics PDF on Slidegeeks to deliver a meaningful presentation. You can save an ample amount of time using these presentation templates. No need to worry to prepare everything from scratch because Slidegeeks experts have already done a huge research and work for you. You need to download Fashion Beauty And Luxury Industry Data Analytics Company Outline Graphics PDF for your upcoming presentation. All the presentation templates are 100 percent editable and you can change the color and personalize the content accordingly. Download now The following slide highlights the research services offered by Kantar company to the fashion beauty and luxury industry. It also shows the clients and impact of solutions provided
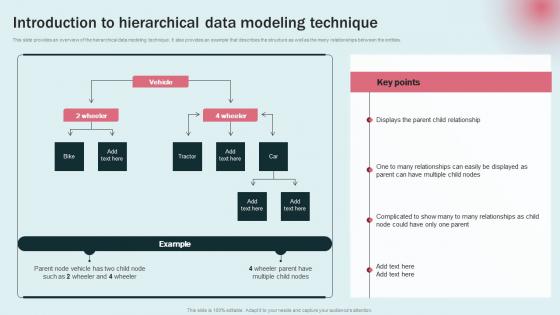
Introduction To Hierarchical Data Modeling Approaches For Modern Analytics Portrait Pdf
This slide provides an overview of the hierarchical data modeling technique. It also provides an example that describes the structure as well as the many relationships between the entities. Formulating a presentation can take up a lot of effort and time, so the content and message should always be the primary focus. The visuals of the PowerPoint can enhance the presenters message, so our Introduction To Hierarchical Data Modeling Approaches For Modern Analytics Portrait Pdf was created to help save time. Instead of worrying about the design, the presenter can concentrate on the message while our designers work on creating the ideal templates for whatever situation is needed. Slidegeeks has experts for everything from amazing designs to valuable content, we have put everything into Introduction To Hierarchical Data Modeling Approaches For Modern Analytics Portrait Pdf This slide provides an overview of the hierarchical data modeling technique. It also provides an example that describes the structure as well as the many relationships between the entities.
Magnifying Glass Big Data Analysis Ppt PowerPoint Presentation Layouts Designs Download
Presenting this set of slides with name magnifying glass big data analysis ppt powerpoint presentation layouts designs download. This is a four stage process. The stages in this process are magnifying glass, research, marketing, strategy, business. This is a completely editable PowerPoint presentation and is available for immediate download. Download now and impress your audience.
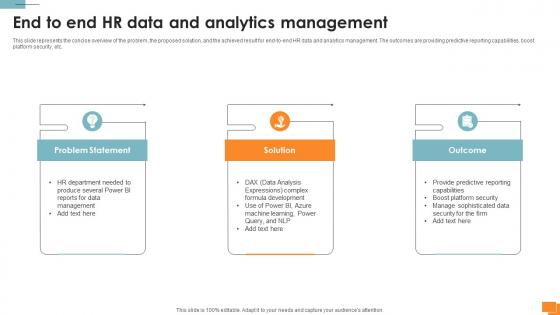
Statistical Tools For Evidence End To End HR Data And Analytics Management
This slide represents the concise overview of the problem, the proposed solution, and the achieved result for end-to-end HR data and analytics management. The outcomes are providing predictive reporting capabilities, boost platform security, etc. Coming up with a presentation necessitates that the majority of the effort goes into the content and the message you intend to convey. The visuals of a PowerPoint presentation can only be effective if it supplements and supports the story that is being told. Keeping this in mind our experts created Statistical Tools For Evidence End To End HR Data And Analytics Management to reduce the time that goes into designing the presentation. This way, you can concentrate on the message while our designers take care of providing you with the right template for the situation. This slide represents the concise overview of the problem, the proposed solution, and the achieved result for end-to-end HR data and analytics management. The outcomes are providing predictive reporting capabilities, boost platform security, etc.
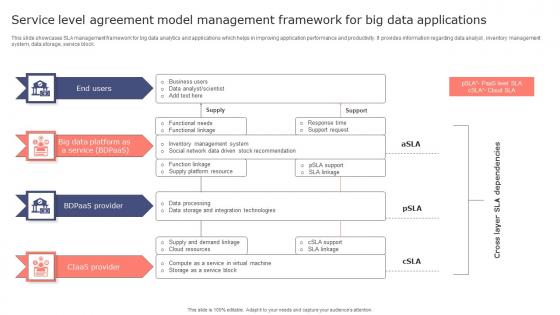
Service Level Agreement Model Management Framework For Big Data Applications Professional Pdf
This slide showcases SLA management framework for big data analytics and applications which helps in improving application performance and productivity. It provides information regarding data analyst , inventory management system, data storage, service block. Showcasing this set of slides titled Service Level Agreement Model Management Framework For Big Data Applications Professional Pdf. The topics addressed in these templates are End Users, Ciaas Provider, Bdpaas Provider. All the content presented in this PPT design is completely editable. Download it and make adjustments in color, background, font etc. as per your unique business setting. This slide showcases SLA management framework for big data analytics and applications which helps in improving application performance and productivity. It provides information regarding data analyst , inventory management system, data storage, service block.
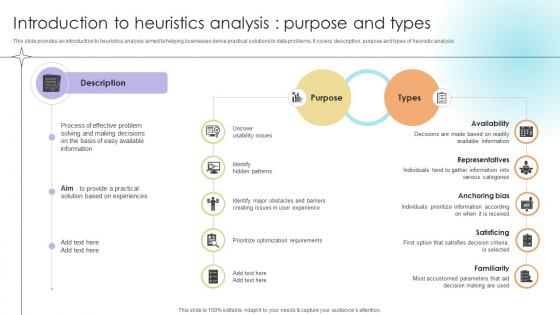
Introduction To Heuristics Analysis Purpose And Types Data Analytics SS V
This slide provides an introduction to heuristics analysis aimed ta helping businesses derive practical solutions to data problems. It covers description, purpose and types of heuristic analysis.There are so many reasons you need a Introduction To Heuristics Analysis Purpose And Types Data Analytics SS V. The first reason is you can not spend time making everything from scratch, Thus, Slidegeeks has made presentation templates for you too. You can easily download these templates from our website easily. This slide provides an introduction to heuristics analysis aimed ta helping businesses derive practical solutions to data problems. It covers description, purpose and types of heuristic analysis.

Statistical Analysis Software Features Data Analytics For Informed Decision Ppt Presentation
The purpose of this slide is to outline the different software used to perform statistical analysis. This slide represents the primary features and benefits of various statistical software available in the market. This Statistical Analysis Software Features Data Analytics For Informed Decision Ppt Presentation from Slidegeeks makes it easy to present information on your topic with precision. It provides customization options, so you can make changes to the colors, design, graphics, or any other component to create a unique layout. It is also available for immediate download, so you can begin using it right away. Slidegeeks has done good research to ensure that you have everything you need to make your presentation stand out. Make a name out there for a brilliant performance. The purpose of this slide is to outline the different software used to perform statistical analysis. This slide represents the primary features and benefits of various statistical software available in the market.

Introduction To Machine Learning Description And Features Data Analytics SS V
This slide provides an introduction to machine learning aimed ta helping businesses derive patterns and connections in the data. It covers description and features of machine learning.Do you have to make sure that everyone on your team knows about any specific topic I yes, then you should give Introduction To Machine Learning Description And Features Data Analytics SS V a try. Our experts have put a lot of knowledge and effort into creating this impeccable Introduction To Machine Learning Description And Features Data Analytics SS V. You can use this template for your upcoming presentations, as the slides are perfect to represent even the tiniest detail. You can download these templates from the Slidegeeks website and these are easy to edit. So grab these today This slide provides an introduction to machine learning aimed ta helping businesses derive patterns and connections in the data. It covers description and features of machine learning.
Icons Slide For Developing Strategic Insights Using Big Data Analytics Across Business Sectors
Download our innovative and attention grabbing Icons Slide For Developing Strategic Insights Using Big Data Analytics Across Business Sectors template. The set of slides exhibit completely customizable icons. These icons can be incorporated into any business presentation. So download it immediately to clearly communicate with your clientele. Our Icons Slide For Developing Strategic Insights Using Big Data Analytics Across Business Sectors are topically designed to provide an attractive backdrop to any subject. Use them to look like a presentation pro.
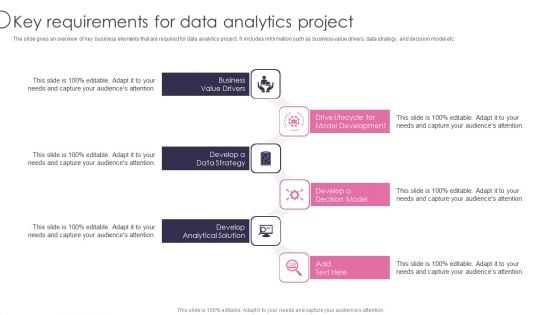
Information Transformation Process Toolkit Key Requirements For Data Analytics Project Designs PDF
The slide gives an overview of key business elements that are required for data analytics project. It includes information such as business value drivers, data strategy, and decision model etc. Presenting Information Transformation Process Toolkit Key Requirements For Data Analytics Project Designs PDF to provide visual cues and insights. Share and navigate important information on six stages that need your due attention. This template can be used to pitch topics like Business Value Drivers, Develop A Data Strategy, Develop Analytical Solution. In addtion, this PPT design contains high resolution images, graphics, etc, that are easily editable and available for immediate download.
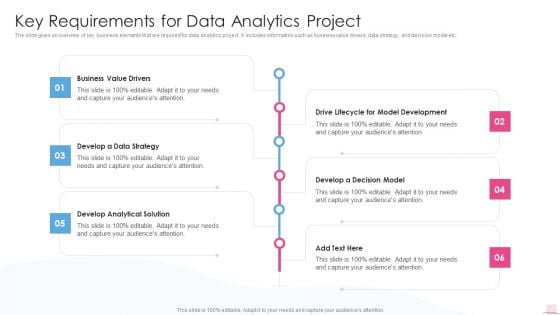
Key Requirements For Data Analytics Project Business Analysis Modification Toolkit Demonstration PDF
The slide gives an overview of key business elements that are required for data analytics project. It includes information such as business value drivers, data strategy, and decision model etc.Presenting Key Requirements For Data Analytics Project Business Analysis Modification Toolkit Demonstration PDF to provide visual cues and insights. Share and navigate important information on six stages that need your due attention. This template can be used to pitch topics like Analytical Solution, Model Development, Data Strategy. In addtion, this PPT design contains high resolution images, graphics, etc, that are easily editable and available for immediate download.
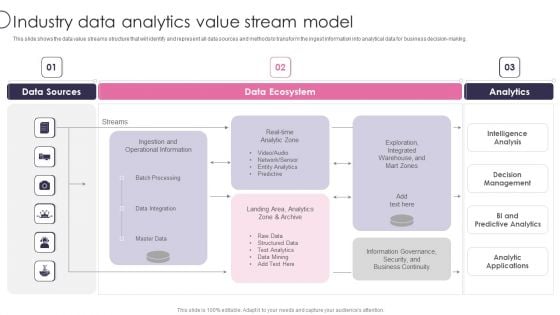
Information Transformation Process Toolkit Industry Data Analytics Value Stream Model Warehouse Template PDF
This slide shows the data value streams structure that will identify and represent all data sources and methods to transform the ingest information into analytical data for business decision making. Deliver an awe inspiring pitch with this creative Information Transformation Process Toolkit Industry Data Analytics Value Stream Model Warehouse Template PDF bundle. Topics like Data Sources, Data Ecosystem, Analytics can be discussed with this completely editable template. It is available for immediate download depending on the needs and requirements of the user.
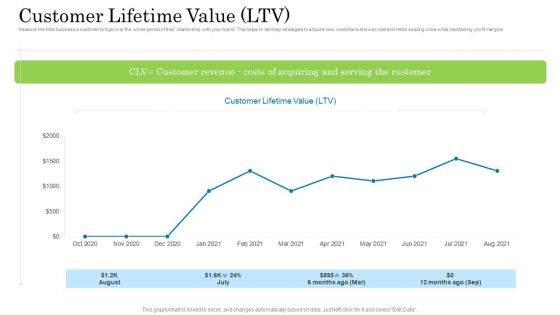
Customer Behavioral Data And Analytics Customer Lifetime Value Ltv Graphics PDF
Measure the total business a customer brings over the whole period of their relationship with your brand. This helps to develop strategies to acquire new customers at lower cost and retain existing ones while maintaining profit margins. Deliver and pitch your topic in the best possible manner with this customer behavioral data and analytics customer lifetime value ltv graphics pdf. Use them to share invaluable insights on customer lifetime value and impress your audience. This template can be altered and modified as per your expectations. So, grab it now.
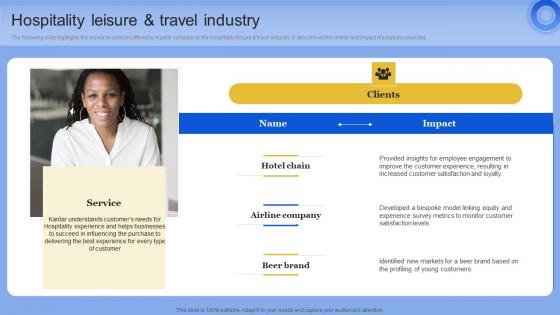
Hospitality Leisure And Travel Industry Data Analytics Company Outline Slides PDF
The following slide highlights the research services offered by Kantar company to the hospitality leisure and travel industry. It also shows the clients and impact of solutions providedWelcome to our selection of the Hospitality Leisure And Travel Industry Data Analytics Company Outline Slides PDF These are designed to help you showcase your creativity and bring your sphere to life. Planning and Innovation are essential for any business that is just starting out. This collection contains the designs that you need for your everyday presentations. All of our PowerPoints are 100 percent editable, so you can customize them to suit your needs. This multi-purpose template can be used in various situations. Grab these presentation templates today The following slide highlights the research services offered by Kantar company to the hospitality leisure and travel industry. It also shows the clients and impact of solutions provided
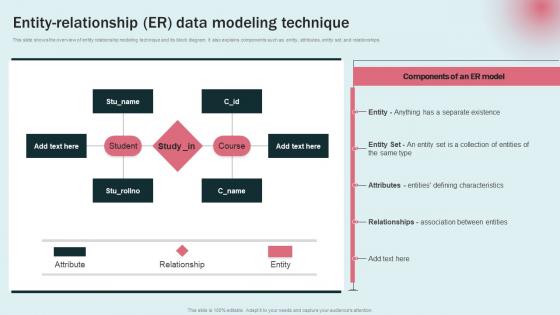
Entity Relationship Er Data Modeling Approaches For Modern Analytics Themes Pdf
This slide shows the overview of entity relationship modeling technique and its block diagram. It also explains components such as entity, attributes, entity set, and relationships. If your project calls for a presentation, then Slidegeeks is your go to partner because we have professionally designed, easy to edit templates that are perfect for any presentation. After downloading, you can easily edit Entity Relationship Er Data Modeling Approaches For Modern Analytics Themes Pdf and make the changes accordingly. You can rearrange slides or fill them with different images. Check out all the handy templates This slide shows the overview of entity relationship modeling technique and its block diagram. It also explains components such as entity, attributes, entity set, and relationships.
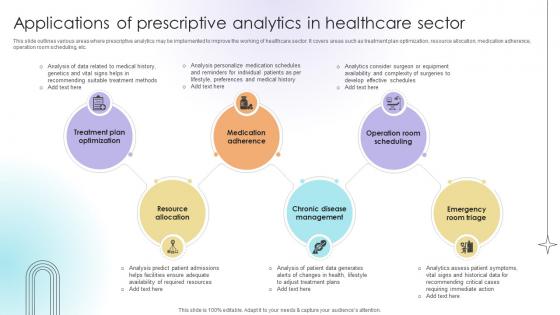
Applications Of Prescriptive Analytics In Healthcare Sector Data Analytics SS V
This slide outlines various areas where prescriptive analytics may be implemented to improve the working of healthcare sector. It covers areas such as treatment plan optimization, resource allocation, medication adherence, operation room scheduling, etc.Slidegeeks is here to make your presentations a breeze with Applications Of Prescriptive Analytics In Healthcare Sector Data Analytics SS V With our easy-to-use and customizable templates, you can focus on delivering your ideas rather than worrying about formatting. With a variety of designs to choose from, you are sure to find one that suits your needs. And with animations and unique photos, illustrations, and fonts, you can make your presentation pop. So whether you are giving a sales pitch or presenting to the board, make sure to check out Slidegeeks first This slide outlines various areas where prescriptive analytics may be implemented to improve the working of healthcare sector. It covers areas such as treatment plan optimization, resource allocation, medication adherence, operation room scheduling, etc.
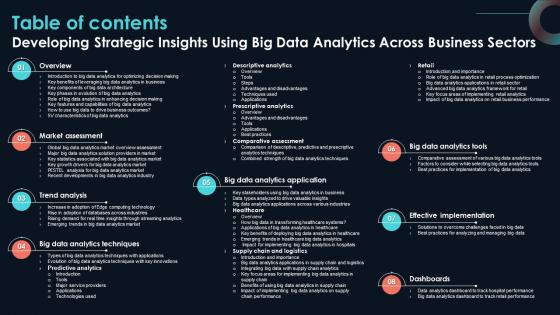
Table Of Contents Developing Strategic Insights Using Big Data Analytics Across Business Sectors
Retrieve professionally designed Table Of Contents Developing Strategic Insights Using Big Data Analytics Across Business Sectors to effectively convey your message and captivate your listeners. Save time by selecting pre-made slideshows that are appropriate for various topics, from business to educational purposes. These themes come in many different styles, from creative to corporate, and all of them are easily adjustable and can be edited quickly. Access them as PowerPoint templates or as Google Slides themes. You do not have to go on a hunt for the perfect presentation because Slidegeeks got you covered from everywhere. Our Table Of Contents Developing Strategic Insights Using Big Data Analytics Across Business Sectors are topically designed to provide an attractive backdrop to any subject. Use them to look like a presentation pro.
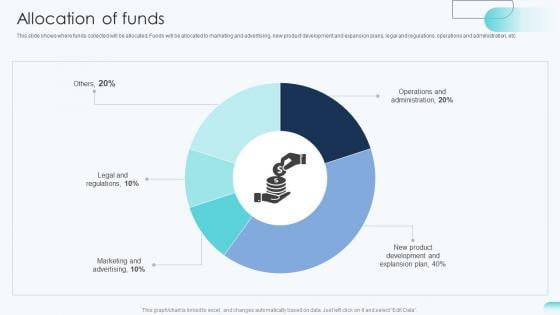
Allocation Of Funds Big Data Analytics Investor Funding Elevator Pitch Deck
This slide shows where funds collected will be allocated. Funds will be allocated to marketing and advertising, new product development and expansion plans, legal and regulations, operations and administration, etc. Find a pre-designed and impeccable Allocation Of Funds Big Data Analytics Investor Funding Elevator Pitch Deck. The templates can ace your presentation without additional effort. You can download these easy-to-edit presentation templates to make your presentation stand out from others. So, what are you waiting for Download the template from Slidegeeks today and give a unique touch to your presentation. This slide shows where funds collected will be allocated. Funds will be allocated to marketing and advertising, new product development and expansion plans, legal and regulations, operations and administration, etc.
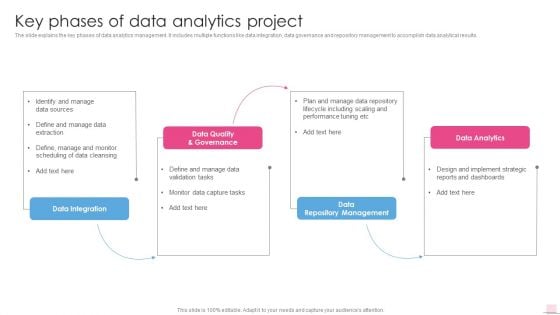
Key Phases Of Data Analytics Project Business Analysis Modification Toolkit Diagrams PDF
The slide explains the key phases of data analytics management. It includes multiple functions like data integration, data governance and repository management to accomplish data analytical results.Deliver and pitch your topic in the best possible manner with this Key Phases Of Data Analytics Project Business Analysis Modification Toolkit Diagrams PDF. Use them to share invaluable insights on Data Quality Governance, Performance Tuning, Including Scaling and impress your audience. This template can be altered and modified as per your expectations. So, grab it now.
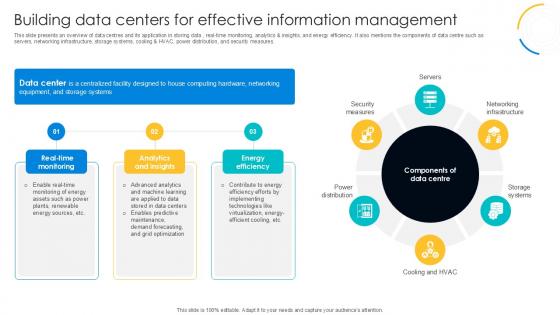
Building Data Centers For Effective Digital Transformation Journey PPT Slide DT SS V
This slide presents an overview of data centres and its application in storing data , real-time monitoring, analytics and insights, and energy efficiency. It also mentions the components of data centre such as servers, networking infrastructure, storage systems, cooling and HVAC, power distribution, and security measures. If you are looking for a format to display your unique thoughts, then the professionally designed Building Data Centers For Effective Digital Transformation Journey PPT Slide DT SS V is the one for you. You can use it as a Google Slides template or a PowerPoint template. Incorporate impressive visuals, symbols, images, and other charts. Modify or reorganize the text boxes as you desire. Experiment with shade schemes and font pairings. Alter, share or cooperate with other people on your work. Download Building Data Centers For Effective Digital Transformation Journey PPT Slide DT SS V and find out how to give a successful presentation. Present a perfect display to your team and make your presentation unforgettable. This slide presents an overview of data centres and its application in storing data , real-time monitoring, analytics and insights, and energy efficiency. It also mentions the components of data centre such as servers, networking infrastructure, storage systems, cooling and HVAC, power distribution, and security measures.
Vector Showing Data Quality Analysis Method Icon Ppt PowerPoint Presentation Icon Show PDF
Presenting vector showing data quality analysis method icon ppt powerpoint presentation icon show pdf to dispense important information. This template comprises three stages. It also presents valuable insights into the topics including vector showing data quality analysis method icon. This is a completely customizable PowerPoint theme that can be put to use immediately. So, download it and address the topic impactfully.
IT Management Plan With Data Governance Icon Ppt Styles Design Templates PDF
Presenting it management plan with data governance icon ppt styles design templates pdf to dispense important information. This template comprises three stages. It also presents valuable insights into the topics including it management plan with data governance icon. This is a completely customizable PowerPoint theme that can be put to use immediately. So, download it and address the topic impactfully.

Ways For Data Interpretation To Increase Profit In Financial Services Sample Pdf
Entire slide shows the different ways of data analysis to generate maximum of profit in financial sector which assist in gaining personalize customer services to retain the cilents. It includes boosting levers, identify new sources, etc.Pitch your topic with ease and precision using this Ways For Data Interpretation To Increase Profit In Financial Services Sample Pdf This layout presents information on Boosting Traditional, Sources Growth, Analytics Capabilities It is also available for immediate download and adjustment. So, changes can be made in the color, design, graphics or any other component to create a unique layout. Entire slide shows the different ways of data analysis to generate maximum of profit in financial sector which assist in gaining personalize customer services to retain the cilents. It includes boosting levers, identify new sources, etc.
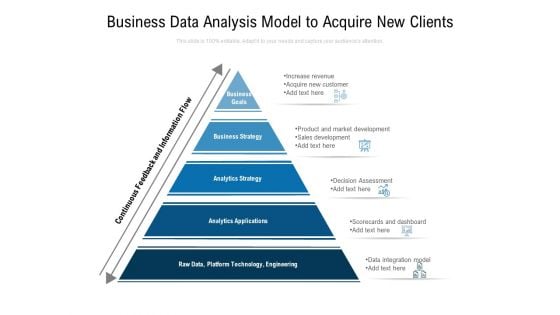
Business Data Analysis Model To Acquire New Clients Ppt PowerPoint Presentation Visual Aids Infographics PDF
Presenting this set of slides with name business data analysis model to acquire new clients ppt powerpoint presentation visual aids infographics pdf. This is a five stage process. The stages in this process are business goals, business strategy, analytics strategy, analytics applications, data, platform technology, engineering. This is a completely editable PowerPoint presentation and is available for immediate download. Download now and impress your audience.
Quantitative Methods Data Collection Ppt PowerPoint Presentation Infographic Template Infographic Template Cpb
Presenting this set of slides with name quantitative methods data collection ppt powerpoint presentation infographic template infographic template cpb. This is an editable Powerpoint four stages graphic that deals with topics like quantitative methods data collection to help convey your message better graphically. This product is a premium product available for immediate download and is 100 percent editable in Powerpoint. Download this now and use it in your presentations to impress your audience.
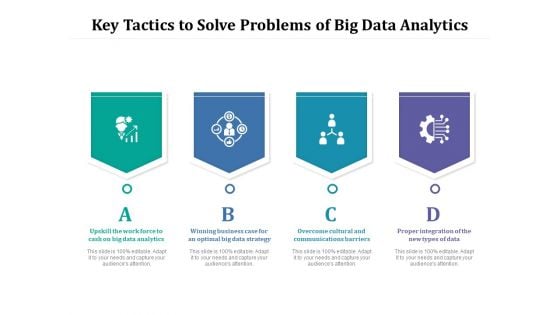
Key Tactics To Solve Problems Of Big Data Analytics Ppt PowerPoint Presentation Slides Styles PDF
Persuade your audience using this key tactics to solve problems of big data analytics ppt powerpoint presentation slides styles pdf. This PPT design covers four stages, thus making it a great tool to use. It also caters to a variety of topics including upskill the work force to cash on big data analytics, winning business case for an optimal big data strategy, overcome cultural and communications barriers, proper integration of the new types of data. Download this PPT design now to present a convincing pitch that not only emphasizes the topic but also showcases your presentation skills.
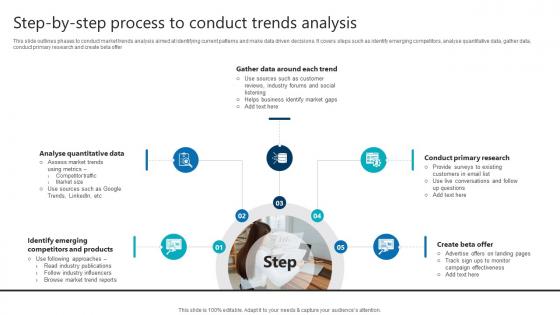
Step By Step Process To Conduct Trends Analysis Product Analytics Implementation Data Analytics V
This slide outlines phases to conduct market trends analysis aimed at identifying current patterns and make data driven decisions. It covers steps such as identify emerging competitors, analyse quantitative data, gather data, conduct primary research and create beta offerComing up with a presentation necessitates that the majority of the effort goes into the content and the message you intend to convey. The visuals of a PowerPoint presentation can only be effective if it supplements and supports the story that is being told. Keeping this in mind our experts created Step By Step Process To Conduct Trends Analysis Product Analytics Implementation Data Analytics V to reduce the time that goes into designing the presentation. This way, you can concentrate on the message while our designers take care of providing you with the right template for the situation. This slide outlines phases to conduct market trends analysis aimed at identifying current patterns and make data driven decisions. It covers steps such as identify emerging competitors, analyse quantitative data, gather data, conduct primary research and create beta offer
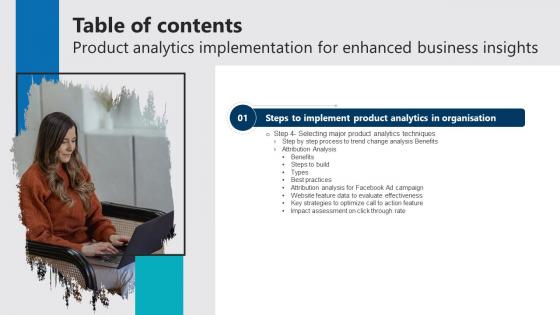
R75 Product Analytics Implementation For Enhanced Business Insights Table Of Contents Data Analytics V
There are so many reasons you need a R75 Product Analytics Implementation For Enhanced Business Insights Table Of Contents Data Analytics V. The first reason is you can not spend time making everything from scratch, Thus, Slidegeeks has made presentation templates for you too. You can easily download these templates from our website easily. Our R75 Product Analytics Implementation For Enhanced Business Insights Table Of Contents Data Analytics V are topically designed to provide an attractive backdrop to any subject. Use them to look like a presentation pro.
Data Governance Plan With Server Management Vector Icon Ppt PowerPoint Presentation File Information PDF
Persuade your audience using this data governance plan with server management vector icon ppt powerpoint presentation file information pdf. This PPT design covers three stages, thus making it a great tool to use. It also caters to a variety of topics including data governance plan with server management vector icon. Download this PPT design now to present a convincing pitch that not only emphasizes the topic but also showcases your presentation skills.
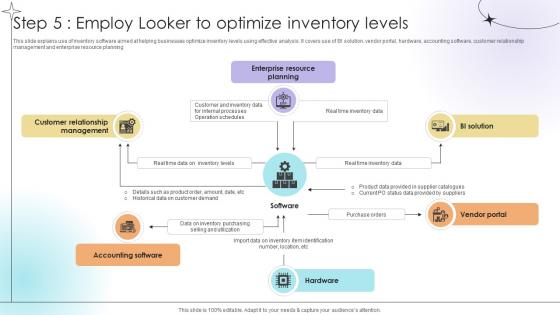
Step 5 Employ Looker To Optimize Inventory Levels Data Analytics SS V
This slide explains use of inventory software aimed at helping businesses optimize inventory levels using effective analysis. It covers use of BI solution, vendor portal, hardware, accounting software, customer relationship management and enterprise resource planning.This modern and well-arranged Step 5 Employ Looker To Optimize Inventory Levels Data Analytics SS V provides lots of creative possibilities. It is very simple to customize and edit with the Powerpoint Software. Just drag and drop your pictures into the shapes. All facets of this template can be edited with Powerpoint, no extra software is necessary. Add your own material, put your images in the places assigned for them, adjust the colors, and then you can show your slides to the world, with an animated slide included. This slide explains use of inventory software aimed at helping businesses optimize inventory levels using effective analysis. It covers use of BI solution, vendor portal, hardware, accounting software, customer relationship management and enterprise resource planning.
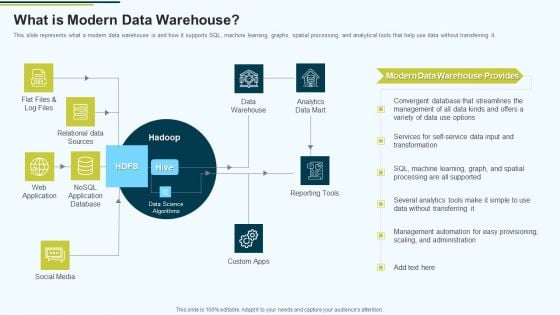
MIS What Is Modern Data Warehouse Ppt PowerPoint Presentation Layouts Graphics Example PDF
This slide represents what a modern data warehouse is and how it supports SQL, machine learning, graphs, spatial processing, and analytical tools that help use data without transferring it.Deliver an awe inspiring pitch with this creative MIS What Is Modern Data Warehouse Ppt PowerPoint Presentation Layouts Graphics Example PDF bundle. Topics like Relational Data Sources, Data Warehouse, Analytics Data Mart can be discussed with this completely editable template. It is available for immediate download depending on the needs and requirements of the user.
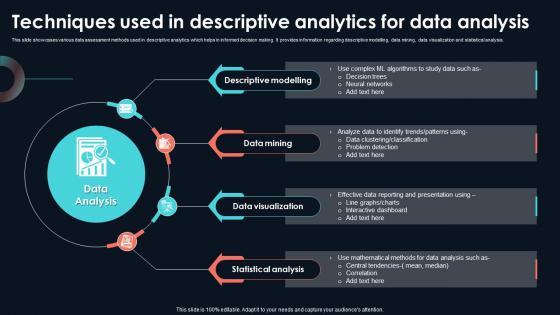
Techniques Used In Descriptive Analytics Developing Strategic Insights Using Big Data Analytics SS V
This slide showcases various data assessment methods used in descriptive analytics which helps in informed decision making. It provides information regarding descriptive modelling, data mining, data visualization and statistical analysis. Presenting this PowerPoint presentation, titled Techniques Used In Descriptive Analytics Developing Strategic Insights Using Big Data Analytics SS V, with topics curated by our researchers after extensive research. This editable presentation is available for immediate download and provides attractive features when used. Download now and captivate your audience. Presenting this Techniques Used In Descriptive Analytics Developing Strategic Insights Using Big Data Analytics SS V. Our researchers have carefully researched and created these slides with all aspects taken into consideration. This is a completely customizable Techniques Used In Descriptive Analytics Developing Strategic Insights Using Big Data Analytics SS V that is available for immediate downloading. Download now and make an impact on your audience. Highlight the attractive features available with our PPTs. This slide showcases various data assessment methods used in descriptive analytics which helps in informed decision making. It provides information regarding descriptive modelling, data mining, data visualization and statistical analysis.


 Continue with Email

 Home
Home


