Data Structure And Algorithm
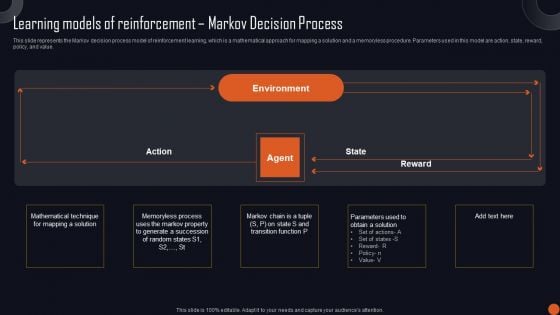
Reinforcement Learning Principles And Techniques Learning Models Of Reinforcement Markov Decision Structure PDF
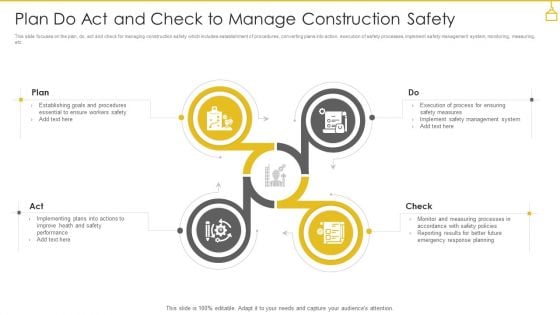
Plan Do Act And Check To Manage Construction Safety Structure PDF
This slide focuses on the plan, do, act and check for managing construction safety which includes establishment of procedures, converting plans into action, execution of safety processes, implement safety management system, monitoring, measuring, etc. Presenting Plan Do Act And Check To Manage Construction Safety Structure PDF to dispense important information. This template comprises four stages. It also presents valuable insights into the topics including Controlling Risks, Monitor Control Measures, Designing Safety Measures. This is a completely customizable PowerPoint theme that can be put to use immediately. So, download it and address the topic impactfully.
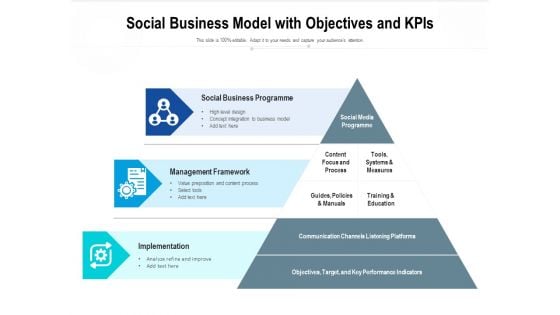
Social Business Model With Objectives And Kpis Ppt PowerPoint Presentation Professional Structure PDF
Presenting social business model with objectives and kpis ppt powerpoint presentation professional structure pdf to dispense important information. This template comprises three stages. It also presents valuable insights into the topics including social business programme, management framework, implementation, high level design, concept integration to business model, social media programme, content focus and process, tools, systems and measures, guides, policies and manuals, training and education. This is a completely customizable PowerPoint theme that can be put to use immediately. So, download it and address the topic impactfully.
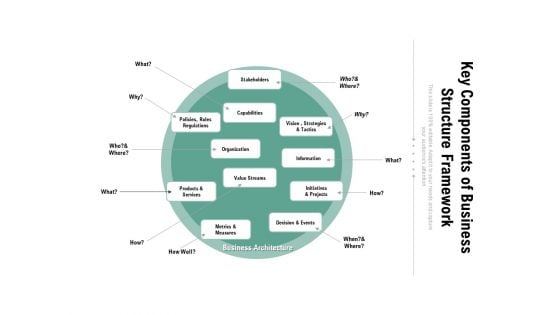
Key Components Of Business Structure Framework Ppt PowerPoint Presentation File Graphics PDF
Persuade your audience using this key components of business structure framework ppt powerpoint presentation file graphics pdf. This PPT design covers one stages, thus making it a great tool to use. It also caters to a variety of topics including stakeholders, policies, rules, regulations, capabilities, vision , strategies and tactics, organization, information, value streams, products and services, metrics and measures, decision and events, initiatives and projects, business architecture. Download this PPT design now to present a convincing pitch that not only emphasizes the topic but also showcases your presentation skills.
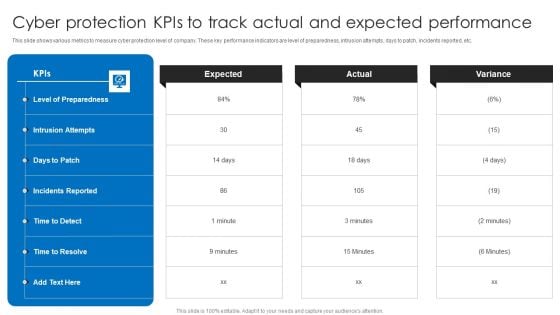
Cyber Protection Kpis To Track Actual And Expected Performance Structure PDF
This slide shows various metrics to measure cyber protection level of company. These key performance indicators are level of preparedness, intrusion attempts, days to patch, incidents reported, etc. Pitch your topic with ease and precision using this Cyber Protection Kpis To Track Actual And Expected Performance Structure PDF. This layout presents information on Cyber Protection Kpis, Track Actual Expected Performance. It is also available for immediate download and adjustment. So, changes can be made in the color, design, graphics or any other component to create a unique layout.
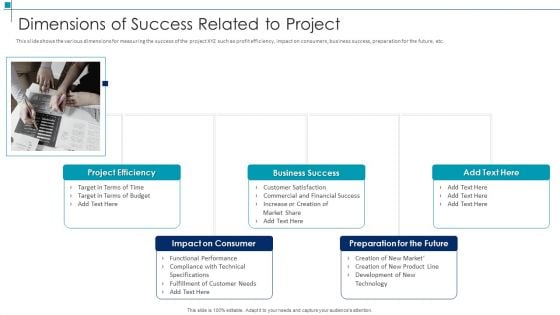
Project Scope Management Deliverables Dimensions Of Success Related To Project Structure PDF
This slide shows the various dimensions for measuring the success of the project XYZ such as profit efficiency, impact on consumers, business success, preparation for the future, etc. Presenting project scope management deliverables dimensions of success related to project structure pdf to provide visual cues and insights. Share and navigate important information on five stages that need your due attention. This template can be used to pitch topics like project efficiency, business success, impact on consumer, preparation for the future. In addtion, this PPT design contains high resolution images, graphics, etc, that are easily editable and available for immediate download.
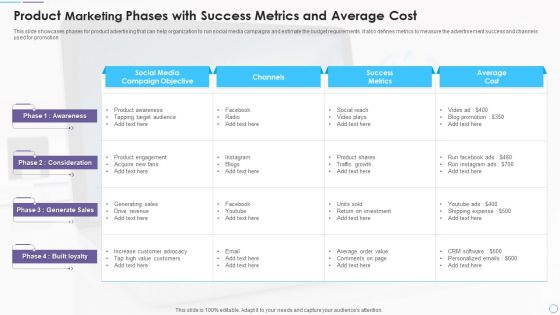
Product Marketing Phases With Success Metrics And Average Cost Structure PDF
This slide showcases phases for product advertising that can help organization to run social media campaigns and estimate the budget requirements. It also defines metrics to measure the advertisement success and channels used for promotion. Pitch your topic with ease and precision using this Product Marketing Phases With Success Metrics And Average Cost Structure PDF. This layout presents information on Awareness, Consideration, Generate Sales, Built loyalty. It is also available for immediate download and adjustment. So, changes can be made in the color, design, graphics or any other component to create a unique layout.
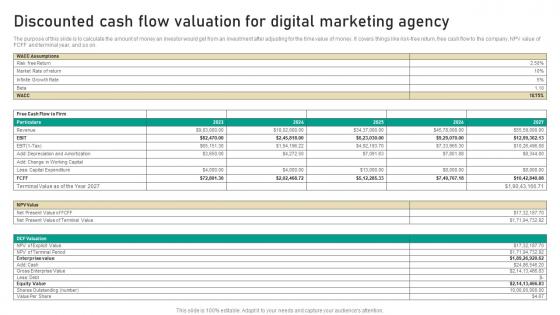
Discounted Cash Flow Valuation For Agency Digital Marketing Business Structure Pdf
The purpose of this slide is to calculate the amount of money an investor would get from an investment after adjusting for the time value of money. It covers things like risk-free return, free cash flow to the company, NPV value of FCFF and terminal year, and so on. Find highly impressive Discounted Cash Flow Valuation For Agency Digital Marketing Business Structure Pdf on Slidegeeks to deliver a meaningful presentation. You can save an ample amount of time using these presentation templates. No need to worry to prepare everything from scratch because Slidegeeks experts have already done a huge research and work for you. You need to download Discounted Cash Flow Valuation For Agency Digital Marketing Business Structure Pdf for your upcoming presentation. All the presentation templates are 100 percent editable and you can change the color and personalize the content accordingly. Download now The purpose of this slide is to calculate the amount of money an investor would get from an investment after adjusting for the time value of money. It covers things like risk-free return, free cash flow to the company, NPV value of FCFF and terminal year, and so on.
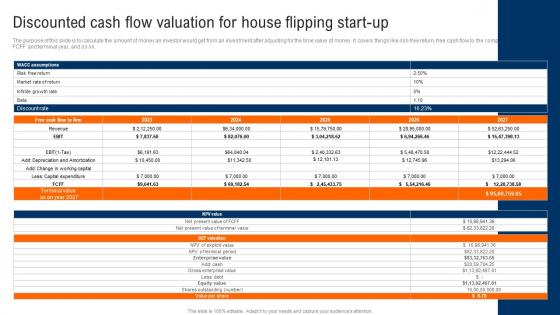
Discounted Cash Flow Valuation For House Flipping Start Up Real Estate Renovation Structure Pdf
The purpose of this slide is to calculate the amount of money an investor would get from an investment after adjusting for the time value of money. It covers things like risk-free return, free cash flow to the company, NPV value of FCFF and terminal year, and so on. Formulating a presentation can take up a lot of effort and time, so the content and message should always be the primary focus. The visuals of the PowerPoint can enhance the presenters message, so our Discounted Cash Flow Valuation For House Flipping Start Up Real Estate Renovation Structure Pdf was created to help save time. Instead of worrying about the design, the presenter can concentrate on the message while our designers work on creating the ideal templates for whatever situation is needed. Slidegeeks has experts for everything from amazing designs to valuable content, we have put everything into Discounted Cash Flow Valuation For House Flipping Start Up Real Estate Renovation Structure Pdf The purpose of this slide is to calculate the amount of money an investor would get from an investment after adjusting for the time value of money. It covers things like risk-free return, free cash flow to the company, NPV value of FCFF and terminal year, and so on.
Umbrella Branding Measures To Boost Brand Awareness Corporate Branding Activities Tracking Timeline Structure PDF
This slide provides information regarding corporate branding activities tracking timeline. The activities include brand messaging, brand architecture, trainings, launch assistance, etc. Slidegeeks is here to make your presentations a breeze with Umbrella Branding Measures To Boost Brand Awareness Corporate Branding Activities Tracking Timeline Structure PDF With our easy to use and customizable templates, you can focus on delivering your ideas rather than worrying about formatting. With a variety of designs to choose from, you are sure to find one that suits your needs. And with animations and unique photos, illustrations, and fonts, you can make your presentation pop. So whether you are giving a sales pitch or presenting to the board, make sure to check out Slidegeeks first
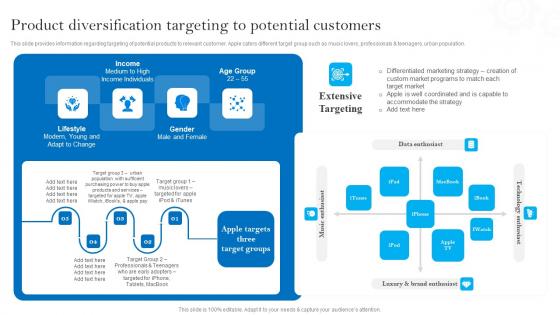
Product Diversification Targeting To Potential Apples Brand Promotional Measures Structure Pdf
This slide provides information regarding targeting of potential products to relevant customer. Apple caters different target group such as music lovers, professionals and teenagers, urban population. Take your projects to the next level with our ultimate collection of Product Diversification Targeting To Potential Apples Brand Promotional Measures Structure Pdf. Slidegeeks has designed a range of layouts that are perfect for representing task or activity duration, keeping track of all your deadlines at a glance. Tailor these designs to your exact needs and give them a truly corporate look with your own brand colors they all make your projects stand out from the rest. This slide provides information regarding targeting of potential products to relevant customer. Apple caters different target group such as music lovers, professionals And teenagers, urban population.
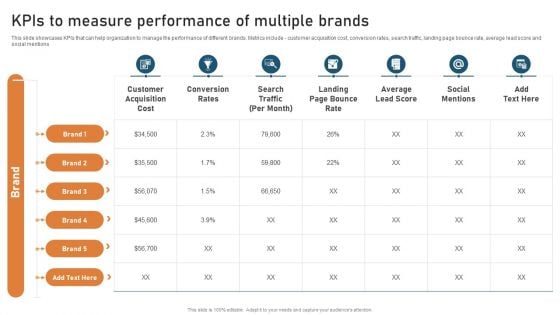
Targeted Market Entry Strategy Kpis To Measure Performance Of Multiple Brands Structure PDF
This slide showcases KPIs that can help organization to manage the performance of different brands. Metrics include - customer acquisition cost, conversion rates, search traffic, landing page bounce rate, average lead score and social mentions. Coming up with a presentation necessitates that the majority of the effort goes into the content and the message you intend to convey. The visuals of a PowerPoint presentation can only be effective if it supplements and supports the story that is being told. Keeping this in mind our experts created Targeted Market Entry Strategy Kpis To Measure Performance Of Multiple Brands Structure PDF to reduce the time that goes into designing the presentation. This way, you can concentrate on the message while our designers take care of providing you with the right template for the situation.

Unique Elements Of Apple Advertising Strategy Apples Brand Promotional Measures Structure Pdf
This slide provides information regarding essential elements of apple advertising initiative. These initiatives include product placement, life-style defining products and emotional connection with consumer. Slidegeeks is one of the best resources for PowerPoint templates. You can download easily and regulate Unique Elements Of Apple Advertising Strategy Apples Brand Promotional Measures Structure Pdf for your personal presentations from our wonderful collection. A few clicks is all it takes to discover and get the most relevant and appropriate templates. Use our Templates to add a unique zing and appeal to your presentation and meetings. All the slides are easy to edit and you can use them even for advertisement purposes. This slide provides information regarding essential elements of apple advertising initiative. These initiatives include product placement, life style defining products and emotional connection with consumer.
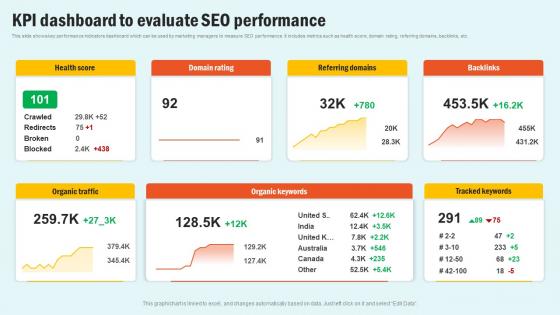
KPI Dashboard To Evaluate SEO Enhancing Website Performance With Search Engine Content Structure Pdf
This slide shows key performance indicators dashboard which can be used by marketing managers to measure SEO performance. It includes metrics such as health score, domain rating, referring domains, backlinks, etc. Welcome to our selection of the KPI Dashboard To Evaluate SEO Enhancing Website Performance With Search Engine Content Structure Pdf. These are designed to help you showcase your creativity and bring your sphere to life. Planning and Innovation are essential for any business that is just starting out. This collection contains the designs that you need for your everyday presentations. All of our PowerPoints are 100 percent editable, so you can customize them to suit your needs. This multi purpose template can be used in various situations. Grab these presentation templates today This slide shows key performance indicators dashboard which can be used by marketing managers to measure SEO performance. It includes metrics such as health score, domain rating, referring domains, backlinks, etc.
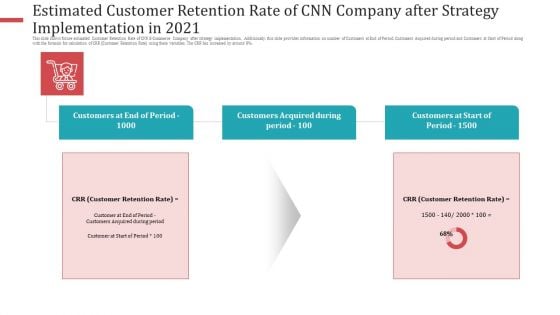
Estimated Customer Retention Rate Of CNN Company After Strategy Implementation In 2021 Structure PDF
This slide shows future estimated Customer Retention Rate of CNN E Commerce Company after strategy implementation. Additionally, this slide provides information on number of Customers at End of Period, Customers Acquired during period and Customers at Start of Period along with the formula for calculation of CRR Customer Retention Rate using these variables. The CRR has increased by around 8 persent. This is a estimated customer retention rate of CNN company after strategy implementation in 2021 structure pdf. template with various stages. Focus and dispense information on two stages using this creative set, that comes with editable features. It contains large content boxes to add your information on topics like customers acquired during period, customers at start of period. You can also showcase facts, figures, and other relevant content using this PPT layout. Grab it now.
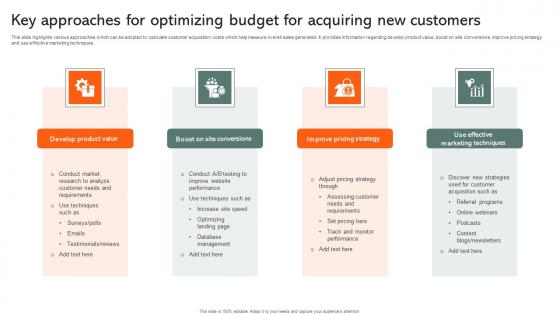
Key Approaches For Optimizing Budget For Acquiring New Customers Structure Pdf
This slide highlights various approaches which can be adopted to calculate customer acquisition costs which help measure overall sales generated. It provides information regarding develop product value, boost on site conversions, improve pricing strategy and use effective marketing techniques. Pitch your topic with ease and precision using this Key Approaches For Optimizing Budget For Acquiring New Customers Structure Pdf. This layout presents information on Develop Product Value, Boost On Site Conversions, Improve Pricing Strategy. It is also available for immediate download and adjustment. So, changes can be made in the color, design, graphics or any other component to create a unique layout. This slide highlights various approaches which can be adopted to calculate customer acquisition costs which help measure overall sales generated. It provides information regarding develop product value, boost on site conversions, improve pricing strategy and use effective marketing techniques.
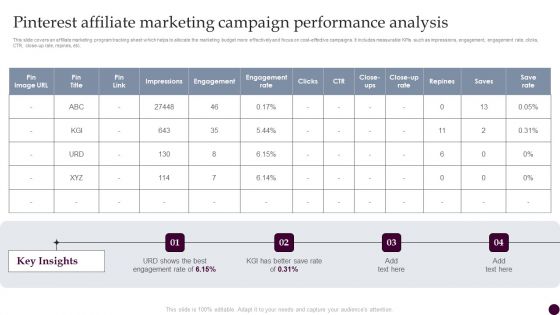
Pinterest Affiliate Marketing Campaign Performance Analysis Strategies For Acquiring Consumers Structure PDF
This slide covers an affiliate marketing program tracking sheet which helps to allocate the marketing budget more effectively and focus on cost-effective campaigns. It includes measurable KPIs such as impressions, engagement, engagement rate, clicks, CTR, close-up rate, repines, etc. Welcome to our selection of the Pinterest Affiliate Marketing Campaign Performance Analysis Strategies For Acquiring Consumers Structure PDF. These are designed to help you showcase your creativity and bring your sphere to life. Planning and Innovation are essential for any business that is just starting out. This collection contains the designs that you need for your everyday presentations. All of our PowerPoints are 100 parcent editable, so you can customize them to suit your needs. This multi-purpose template can be used in various situations. Grab these presentation templates today.
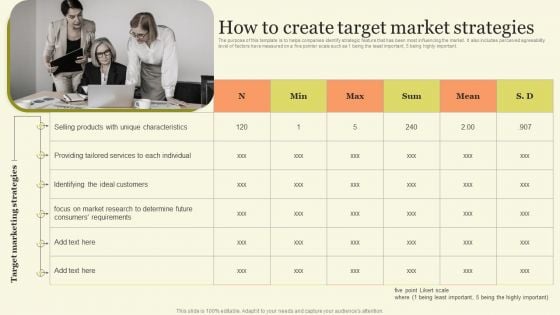
Marketing Techniques For Increasing Target Audience How To Create Target Market Strategies Structure PDF
The purpose of this template is to helps companies identify strategic feature that has been most influencing the market. It also includes perceived agreeability level of factors have measured on a five pointer scale such as 1 being the least important, 5 being highly important. Slidegeeks is here to make your presentations a breeze with Marketing Techniques For Increasing Target Audience How To Create Target Market Strategies Structure PDF With our easy to use and customizable templates, you can focus on delivering your ideas rather than worrying about formatting. With a variety of designs to choose from, you are sure to find one that suits your needs. And with animations and unique photos, illustrations, and fonts, you can make your presentation pop. So whether you are giving a sales pitch or presenting to the board, make sure to check out Slidegeeks first.
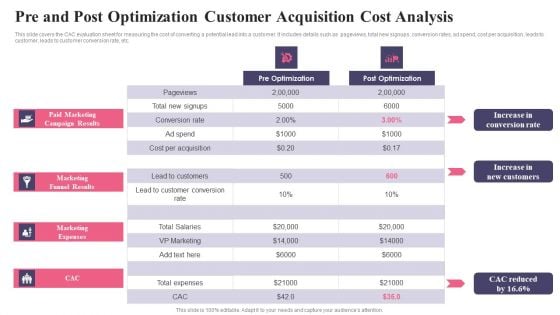
Comprehensive Guide To Acquire Customers Pre And Post Optimization Customer Structure PDF
This slide covers the CAC evaluation sheet for measuring the cost of converting a potential lead into a customer. It includes details such as pageviews, total new signups, conversion rates, ad spend, cost per acquisition, leads to customer, leads to customer conversion rate, etc. Want to ace your presentation in front of a live audience Our Comprehensive Guide To Acquire Customers Pre And Post Optimization Customer Structure PDF can help you do that by engaging all the users towards you. Slidegeeks experts have put their efforts and expertise into creating these impeccable powerpoint presentations so that you can communicate your ideas clearly. Moreover, all the templates are customizable, and easy-to-edit and downloadable. Use these for both personal and commercial use.
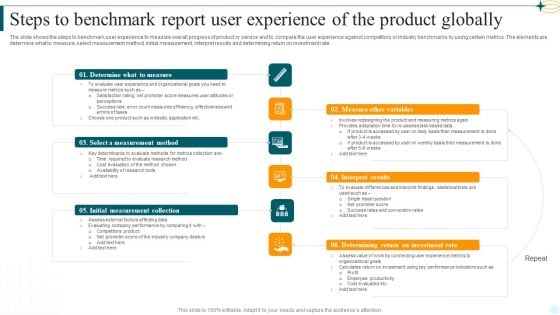
Steps To Benchmark Report User Experience Of The Product Globally Structure PDF
The slide shows the steps to benchmark user experience to measure overall progress of product or service and to compare the user experience against competitors or industry benchmarks by using certain metrics. The elements are determine what to measure, select measurement method, initial measurement, interpret results and determining return on investment rate. Presenting Steps To Benchmark Report User Experience Of The Product Globally Structure PDF to dispense important information. This template comprises six stages. It also presents valuable insights into the topics including Select Measurement Method, Initial Measurement Collection, Measure Other Variables. This is a completely customizable PowerPoint theme that can be put to use immediately. So, download it and address the topic impactfully.
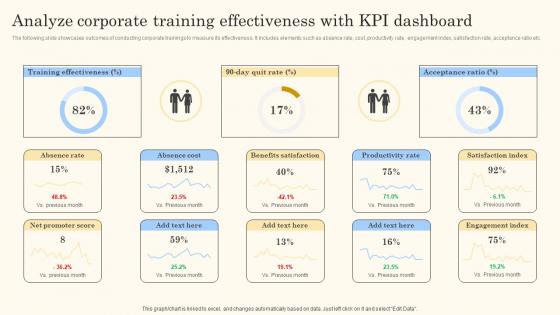
Analyze Corporate Training Effectiveness With Action Steps For Employee Engagement Structure Pdf
The following slide showcases outcomes of conducting corporate trainings to measure its effectiveness. It includes elements such as absence rate, cost, productivity rate, engagement index, satisfaction rate, acceptance ratio etc.Coming up with a presentation necessitates that the majority of the effort goes into the content and the message you intend to convey. The visuals of a PowerPoint presentation can only be effective if it supplements and supports the story that is being told. Keeping this in mind our experts created Analyze Corporate Training Effectiveness With Action Steps For Employee Engagement Structure Pdf to reduce the time that goes into designing the presentation. This way, you can concentrate on the message while our designers take care of providing you with the right template for the situation. The following slide showcases outcomes of conducting corporate trainings to measure its effectiveness. It includes elements such as absence rate, cost, productivity rate, engagement index, satisfaction rate, acceptance ratio etc.
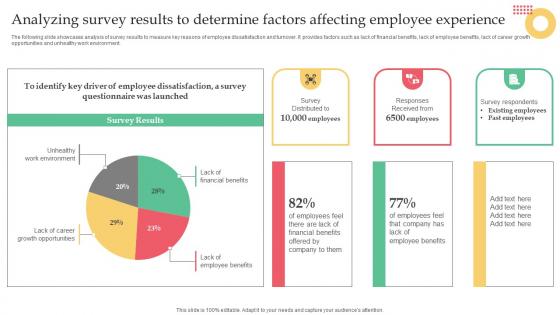
Employer Branding Strategy For Competitive Analyzing Survey Results To Determine Factors Structure Pdf
The following slide showcases analysis of survey results to measure key reasons of employee dissatisfaction and turnover. It provides factors such as lack of financial benefits, lack of employee benefits, lack of career growth opportunities and unhealthy work environment. Slidegeeks is one of the best resources for PowerPoint templates. You can download easily and regulate Employer Branding Strategy For Competitive Analyzing Survey Results To Determine Factors Structure Pdf for your personal presentations from our wonderful collection. A few clicks is all it takes to discover and get the most relevant and appropriate templates. Use our Templates to add a unique zing and appeal to your presentation and meetings. All the slides are easy to edit and you can use them even for advertisement purposes. The following slide showcases analysis of survey results to measure key reasons of employee dissatisfaction and turnover. It provides factors such as lack of financial benefits, lack of employee benefits, lack of career growth opportunities and unhealthy work environment.
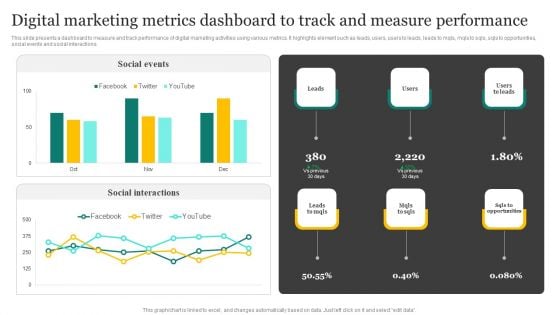
Strategic Promotion Plan Development Stages Digital Marketing Metrics Dashboard To Track Structure PDF
This slide presents a dashboard to measure and track performance of digital marketing activities using various metrics. It highlights element such as leads, users, users to leads, leads to mqls, mqls to sqls, sqls to opportunities, social events and social interactions. Are you in need of a template that can accommodate all of your creative concepts This one is crafted professionally and can be altered to fit any style. Use it with Google Slides or PowerPoint. Include striking photographs, symbols, depictions, and other visuals. Fill, move around, or remove text boxes as desired. Test out color palettes and font mixtures. Edit and save your work, or work with colleagues. Download Strategic Promotion Plan Development Stages Digital Marketing Metrics Dashboard To Track Structure PDF and observe how to make your presentation outstanding. Give an impeccable presentation to your group and make your presentation unforgettable.
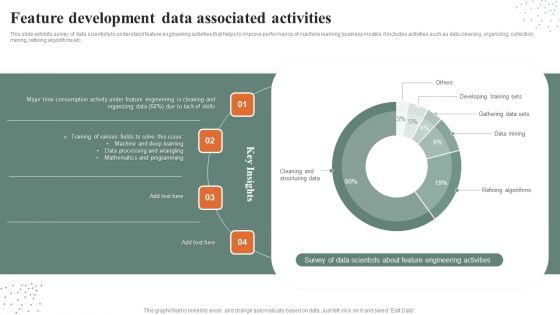
Feature Development Data Associated Activities Guidelines PDF
This slide exhibits survey of data scientists to understand feature engineering activities that helps to improve performance of machine learning business models. It includes activities such as data cleaning, organizing, collection, mining, refining algorithms etc. Pitch your topic with ease and precision using this Feature Development Data Associated Activities Guidelines PDF. This layout presents information on Programming, Developing Training Sets, Gathering Data Sets. It is also available for immediate download and adjustment. So, changes can be made in the color, design, graphics or any other component to create a unique layout.

Implementing An Effective Ecommerce Management Framework Impact Of Ecommerce Management System Post Implementation Structure PDF
This slide represents the key performance indicators to measure the impact of ecommerce management system on ecommerce business operations. It includes KPIs to such as average order value, gross profit, conversion rate, shopping cart abandonment rate, shopping cart conversion rate etc. Coming up with a presentation necessitates that the majority of the effort goes into the content and the message you intend to convey. The visuals of a PowerPoint presentation can only be effective if it supplements and supports the story that is being told. Keeping this in mind our experts created Implementing An Effective Ecommerce Management Framework Impact Of Ecommerce Management System Post Implementation Structure PDF to reduce the time that goes into designing the presentation. This way, you can concentrate on the message while our designers take care of providing you with the right template for the situation.

Effective Real Time Marketing Principles Set Kpis To Evaluate Current And Previous Performance Structure Pdf
The following slide covers various key performance indicators to measure and compare results of marketing efforts. It includes elements such as brand loyalty, engagement, net promotor score, return on investment, equity etc. Boost your pitch with our creative Effective Real Time Marketing Principles Set Kpis To Evaluate Current And Previous Performance Structure Pdf. Deliver an awe-inspiring pitch that will mesmerize everyone. Using these presentation templates you will surely catch everyones attention. You can browse the ppts collection on our website. We have researchers who are experts at creating the right content for the templates. So you do not have to invest time in any additional work. Just grab the template now and use them. The following slide covers various key performance indicators to measure and compare results of marketing efforts. It includes elements such as brand loyalty, engagement, net promotor score, return on investment, equity etc.
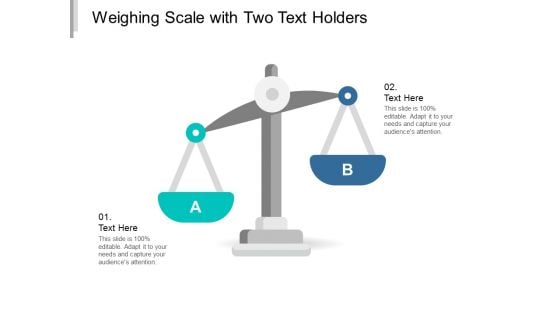
Weighing Scale With Two Text Holders Ppt Powerpoint Presentation Ideas Structure
This is a weighing scale with two text holders ppt powerpoint presentation ideas structure. This is a two stage process. The stages in this process are balance scale, weighing scale, measuring scale.
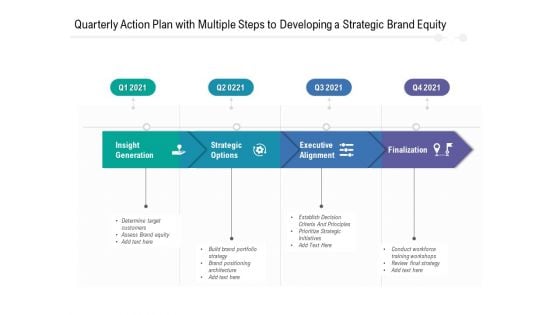
Quarterly Action Plan With Multiple Steps To Developing A Strategic Brand Equity Structure
Introducing our quarterly action plan with multiple steps to developing a strategic brand equity structure. This PPT presentation is Google Slides compatible, therefore, you can share it easily with the collaborators for measuring the progress. Also, the presentation is available in both standard screen and widescreen aspect ratios. So edit the template design by modifying the font size, font type, color, and shapes as per your requirements. As this PPT design is fully editable it can be presented in PDF, JPG and PNG formats.
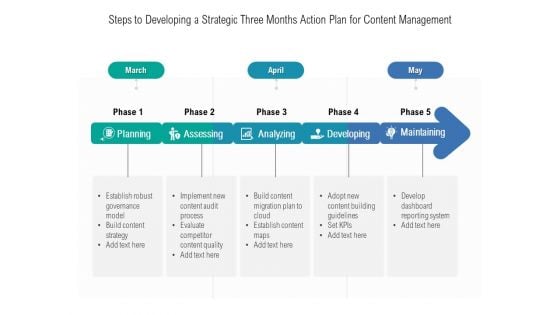
Steps To Developing A Strategic Three Months Action Plan For Content Management Structure
Introducing our steps to developing a strategic three months action plan for content management structure. This PPT presentation is Google Slides compatible, therefore, you can share it easily with the collaborators for measuring the progress. Also, the presentation is available in both standard screen and widescreen aspect ratios. So edit the template design by modifying the font size, font type, color, and shapes as per your requirements. As this PPT design is fully editable it can be presented in PDF, JPG and PNG formats.
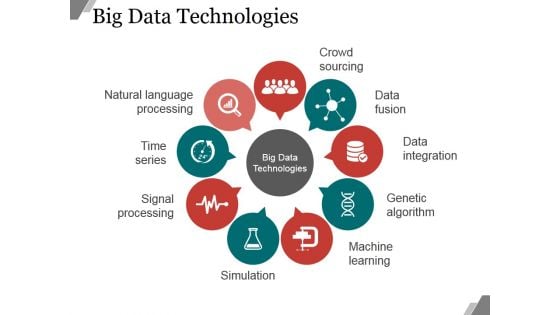
Big Data Technologies Ppt PowerPoint Presentation Themes
This is a big data technologies ppt powerpoint presentation themes. This is a nine stage process. The stages in this process are crowd sourcing, data fusion, data integration, genetic algorithm, machine learning.
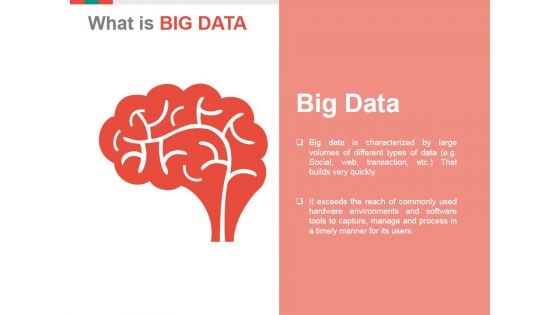
Big Data Ppt PowerPoint Presentation Portfolio Designs
This is a big data ppt powerpoint presentation portfolio designs. This is a nine stage process. The stages in this process are crowd sourcing, data fusion, data integration, genetic algorithm, machine learning, simulation, signal processing, time series, natural language processing.
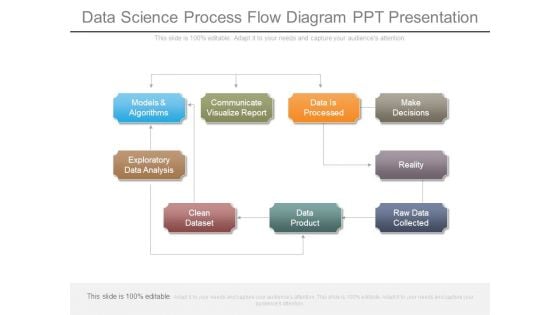
Data Science Process Flow Diagram Ppt Presentation
This is a data science process flow diagram ppt presentation. This is a nine stage process. The stages in this process are models and algorithms, communicate visualize report, data is processed, make decisions, exploratory data analysis, clean dataset, data product, raw data collected, reality.
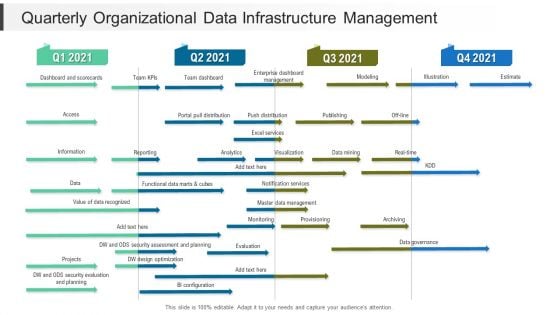
Quarterly Organizational Data Infrastructure Management Formats
Presenting our innovatively structured quarterly organizational data infrastructure management formats Template. Showcase your roadmap process in different formats like PDF, PNG, and JPG by clicking the download button below. This PPT design is available in both Standard Screen and Widescreen aspect ratios. It can also be easily personalized and presented with modified font size, font type, color, and shapes to measure your progress in a clear way.
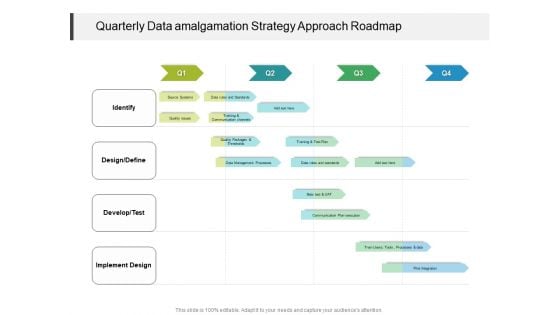
Quarterly Data Amalgamation Strategy Approach Roadmap Themes
Presenting our innovatively structured quarterly data amalgamation strategy approach roadmap themes Template. Showcase your roadmap process in different formats like PDF, PNG, and JPG by clicking the download button below. This PPT design is available in both Standard Screen and Widescreen aspect ratios. It can also be easily personalized and presented with modified font size, font type, color, and shapes to measure your progress in a clear way.
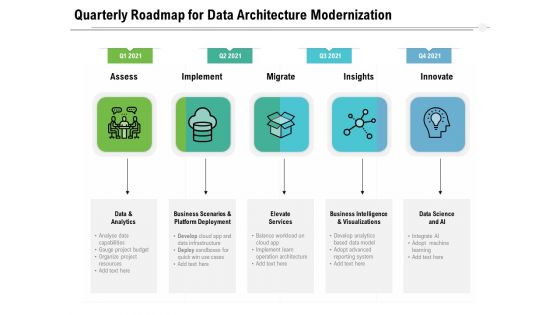
Quarterly Roadmap For Data Architecture Modernization Guidelines
Presenting our innovatively structured quarterly roadmap for data architecture modernization guidelines Template. Showcase your roadmap process in different formats like PDF, PNG, and JPG by clicking the download button below. This PPT design is available in both Standard Screen and Widescreen aspect ratios. It can also be easily personalized and presented with modified font size, font type, color, and shapes to measure your progress in a clear way.
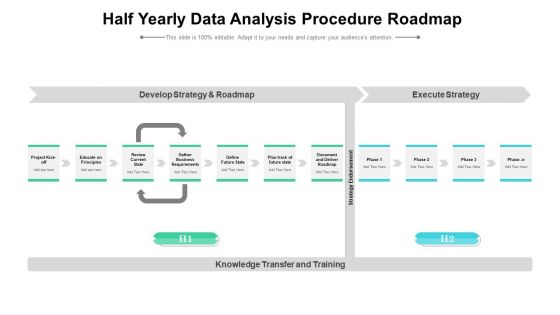
Half Yearly Data Analysis Procedure Roadmap Formats
Presenting our innovatively structured half yearly data analysis procedure roadmap formats Template. Showcase your roadmap process in different formats like PDF, PNG, and JPG by clicking the download button below. This PPT design is available in both Standard Screen and Widescreen aspect ratios. It can also be easily personalized and presented with modified font size, font type, color, and shapes to measure your progress in a clear way.
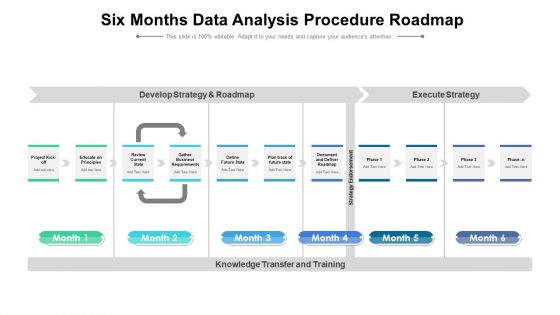
Six Months Data Analysis Procedure Roadmap Topics
Presenting our innovatively structured six months data analysis procedure roadmap topics Template. Showcase your roadmap process in different formats like PDF, PNG, and JPG by clicking the download button below. This PPT design is available in both Standard Screen and Widescreen aspect ratios. It can also be easily personalized and presented with modified font size, font type, color, and shapes to measure your progress in a clear way.
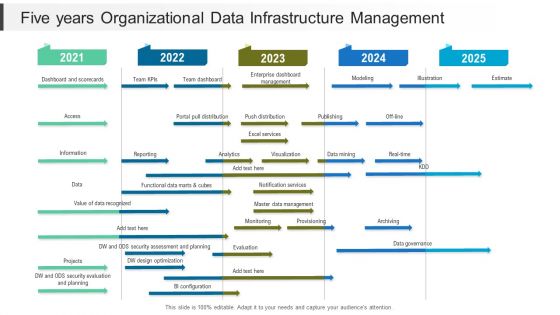
Five Years Organizational Data Infrastructure Management Template
Presenting our innovatively structured five years organizational data infrastructure management template Template. Showcase your roadmap process in different formats like PDF, PNG, and JPG by clicking the download button below. This PPT design is available in both Standard Screen and Widescreen aspect ratios. It can also be easily personalized and presented with modified font size, font type, color, and shapes to measure your progress in a clear way.
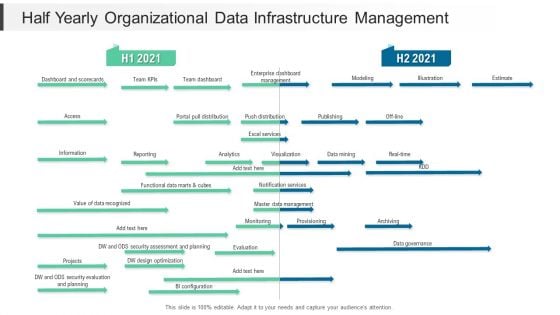
Half Yearly Organizational Data Infrastructure Management Slides
Presenting our innovatively structured half yearly organizational data infrastructure management slides Template. Showcase your roadmap process in different formats like PDF, PNG, and JPG by clicking the download button below. This PPT design is available in both Standard Screen and Widescreen aspect ratios. It can also be easily personalized and presented with modified font size, font type, color, and shapes to measure your progress in a clear way.
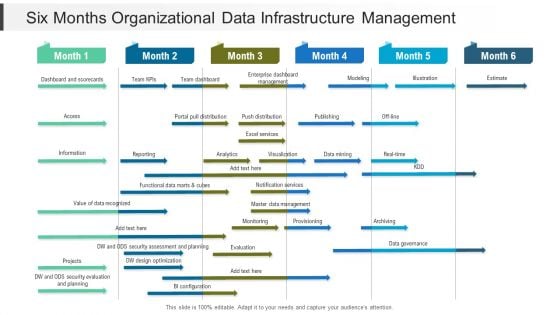
Six Months Organizational Data Infrastructure Management Mockup
Presenting our innovatively structured six months organizational data infrastructure management mockup Template. Showcase your roadmap process in different formats like PDF, PNG, and JPG by clicking the download button below. This PPT design is available in both Standard Screen and Widescreen aspect ratios. It can also be easily personalized and presented with modified font size, font type, color, and shapes to measure your progress in a clear way.
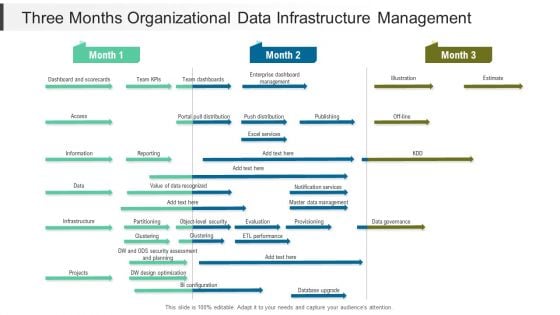
Three Months Organizational Data Infrastructure Management Introduction
Presenting our innovatively structured three months organizational data infrastructure management introduction Template. Showcase your roadmap process in different formats like PDF, PNG, and JPG by clicking the download button below. This PPT design is available in both Standard Screen and Widescreen aspect ratios. It can also be easily personalized and presented with modified font size, font type, color, and shapes to measure your progress in a clear way.
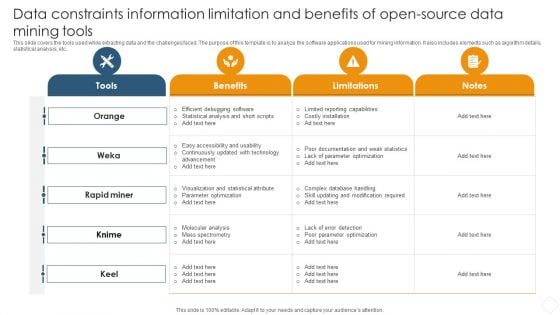
Data Constraints Information Limitation And Benefits Of Open Source Data Mining Tools Topics PDF
This slide covers the tools used while extracting data and the challenges faced. The purpose of this template is to analyze the software applications used for mining information. It also includes elements such as algorithm details, statistical analysis, etc..Pitch your topic with ease and precision using this Data Constraints Information Limitation And Benefits Of Open Source Data Mining Tools Topics PDF. This layout presents information on Efficient Debugging, Continuously Updated, Molecular Analysis. It is also available for immediate download and adjustment. So, changes can be made in the color, design, graphics or any other component to create a unique layout.
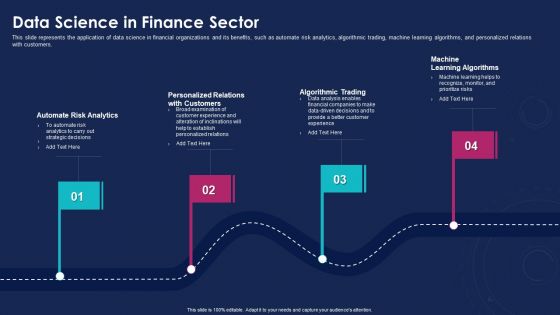
Data Analytics IT Data Science In Finance Sector Ppt Gallery Inspiration PDF
This slide represents the application of data science in financial organizations and its benefits, such as automate risk analytics, algorithmic trading, machine learning algorithms, and personalized relations with customers. This is a data analytics it data science in finance sector ppt gallery inspiration pdf template with various stages. Focus and dispense information on four stages using this creative set, that comes with editable features. It contains large content boxes to add your information on topics like automate risk analytics, personalized relations with customers, algorithmic trading, machine learning algorithms. You can also showcase facts, figures, and other relevant content using this PPT layout. Grab it now.
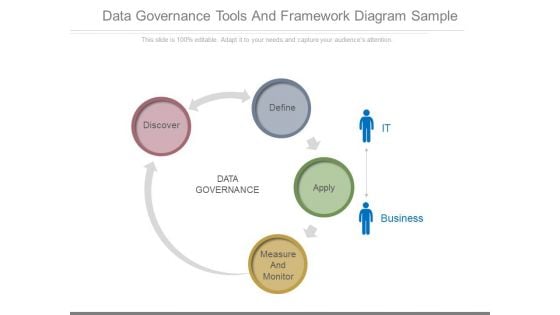
Data Governance Tools And Framework Diagram Sample
This is a data governance tools and framework diagram sample. This is a four stage process. The stages in this process are discover, define, apply, measure and monitor, data governance, it, business.
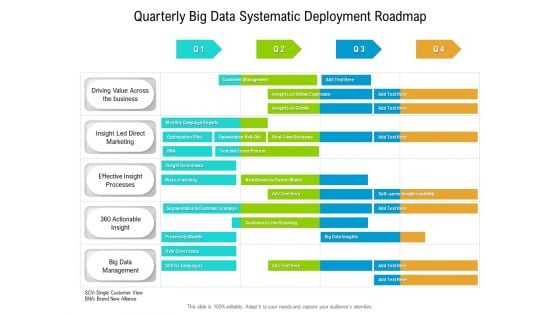
Quarterly Big Data Systematic Deployment Roadmap Diagrams
Presenting our innovatively-structured quarterly big data systematic deployment roadmap diagrams Template. Showcase your roadmap process in different formats like PDF, PNG, and JPG by clicking the download button below. This PPT design is available in both Standard Screen and Widescreen aspect ratios. It can also be easily personalized and presented with modified font size, font type, color, and shapes to measure your progress in a clear way.
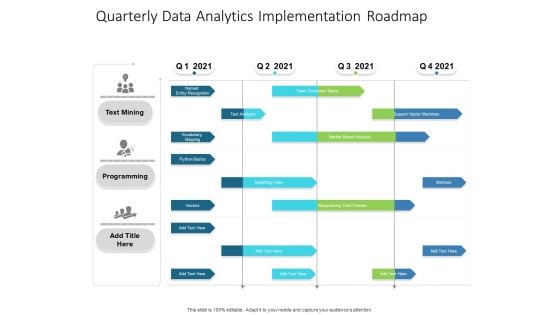
Quarterly Data Analytics Implementation Roadmap Pictures
Presenting our innovatively-structured quarterly data analytics implementation roadmap pictures Template. Showcase your roadmap process in different formats like PDF, PNG, and JPG by clicking the download button below. This PPT design is available in both Standard Screen and Widescreen aspect ratios. It can also be easily personalized and presented with modified font size, font type, color, and shapes to measure your progress in a clear way.
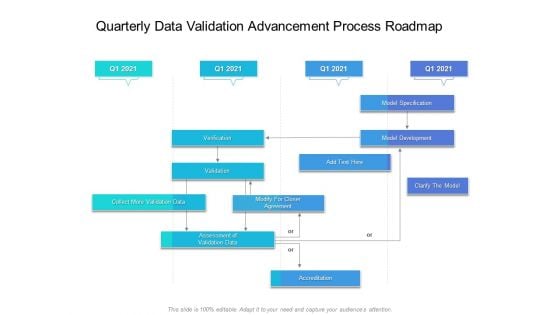
Quarterly Data Validation Advancement Process Roadmap Rules
Presenting our innovatively-structured quarterly data validation advancement process roadmap rules Template. Showcase your roadmap process in different formats like PDF, PNG, and JPG by clicking the download button below. This PPT design is available in both Standard Screen and Widescreen aspect ratios. It can also be easily personalized and presented with modified font size, font type, color, and shapes to measure your progress in a clear way.

Five Years Data Management Roadmap Timeline Demonstration
Presenting our innovatively-structured five years data management roadmap timeline demonstration Template. Showcase your roadmap process in different formats like PDF, PNG, and JPG by clicking the download button below. This PPT design is available in both Standard Screen and Widescreen aspect ratios. It can also be easily personalized and presented with modified font size, font type, color, and shapes to measure your progress in a clear way.
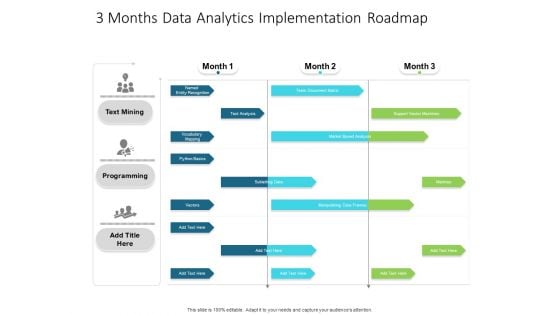
3 Months Data Analytics Implementation Roadmap Elements
Presenting our innovatively-structured 3 months data analytics implementation roadmap elements Template. Showcase your roadmap process in different formats like PDF, PNG, and JPG by clicking the download button below. This PPT design is available in both Standard Screen and Widescreen aspect ratios. It can also be easily personalized and presented with modified font size, font type, color, and shapes to measure your progress in a clear way.
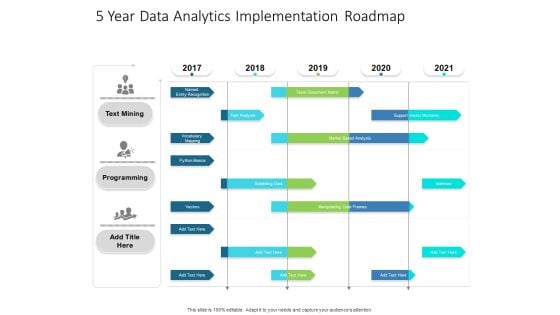
5 Year Data Analytics Implementation Roadmap Topics
Presenting our innovatively-structured 5 year data analytics implementation roadmap topics Template. Showcase your roadmap process in different formats like PDF, PNG, and JPG by clicking the download button below. This PPT design is available in both Standard Screen and Widescreen aspect ratios. It can also be easily personalized and presented with modified font size, font type, color, and shapes to measure your progress in a clear way.
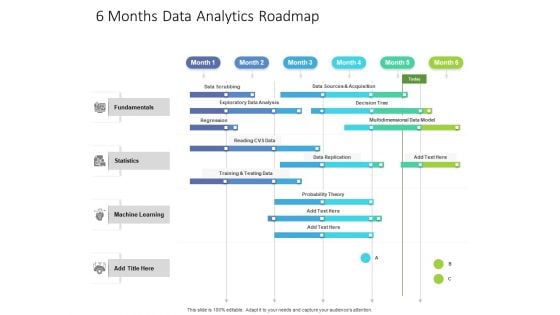
6 Months Data Analytics Roadmap Diagrams
Presenting our innovatively-structured 6 months data analytics roadmap diagrams Template. Showcase your roadmap process in different formats like PDF, PNG, and JPG by clicking the download button below. This PPT design is available in both Standard Screen and Widescreen aspect ratios. It can also be easily personalized and presented with modified font size, font type, color, and shapes to measure your progress in a clear way.
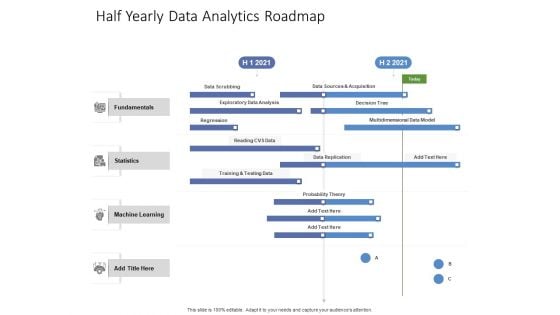
Half Yearly Data Analytics Roadmap Ideas
Presenting our innovatively-structured half yearly data analytics roadmap ideas Template. Showcase your roadmap process in different formats like PDF, PNG, and JPG by clicking the download button below. This PPT design is available in both Standard Screen and Widescreen aspect ratios. It can also be easily personalized and presented with modified font size, font type, color, and shapes to measure your progress in a clear way.
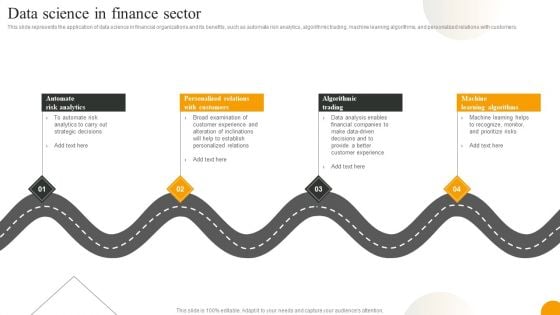
Using Data Science Technologies For Business Transformation Data Science In Finance Sector Slides PDF
This slide represents the application of data science in financial organizations and its benefits, such as automate risk analytics, algorithmic trading, machine learning algorithms, and personalized relations with customers. From laying roadmaps to briefing everything in detail, our templates are perfect for you. You can set the stage with your presentation slides. All you have to do is download these easy to edit and customizable templates. Using Data Science Technologies For Business Transformation Data Science In Finance Sector Slides PDF will help you deliver an outstanding performance that everyone would remember and praise you for. Do download this presentation today.
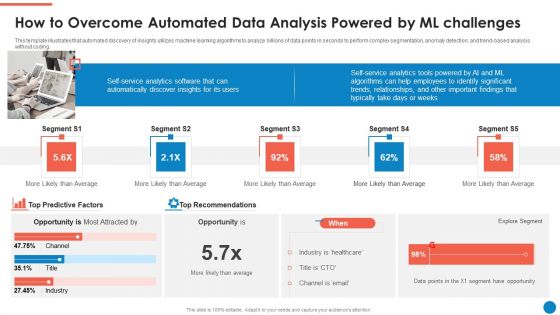
Data And Analytics Playbook How To Overcome Automated Data Analysis Powered By Ml Diagrams PDF
This template illustrates that automated discovery of insights utilizes machine learning algorithms to analyze billions of data points in seconds to perform complex segmentation, anomaly detection, and trend-based analysis without coding. This is a Data And Analytics Playbook How To Overcome Automated Data Analysis Powered By Ml Diagrams PDF template with various stages. Focus and dispense information on one stages using this creative set, that comes with editable features. It contains large content boxes to add your information on topics like Self Service Analytics Software, Top Recommendations, Explore Segment. You can also showcase facts, figures, and other relevant content using this PPT layout. Grab it now.
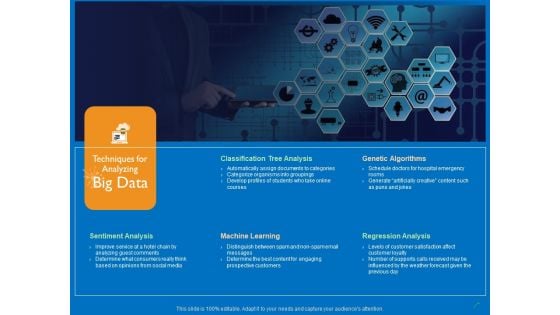
Transforming Big Data Analytics To Knowledge Techniques For Analyzing Big Data Ppt Model Inspiration PDF
This is a transforming big data analytics to knowledge techniques for analyzing big data ppt model inspiration pdf template with various stages. Focus and dispense information on one stages using this creative set, that comes with editable features. It contains large content boxes to add your information on topics like sentiment analysis, machine learning, classification tree analysis, genetic algorithms, regression analysis. You can also showcase facts, figures, and other relevant content using this PPT layout. Grab it now.

Data Governance IT Uses Of Data Stewardship Program In Business Background PDF
This slide represents the uses of a data stewardship program that includes resolving any data or data related challenges, decreasing risks by security measures, improving data documentation, developing and using quality measures, and so on. The Data Governance IT Uses Of Data Stewardship Program In Business Background PDF is a compilation of the most recent design trends as a series of slides. It is suitable for any subject or industry presentation, containing attractive visuals and photo spots for businesses to clearly express their messages. This template contains a variety of slides for the user to input data, such as structures to contrast two elements, bullet points, and slides for written information. Slidegeeks is prepared to create an impression.
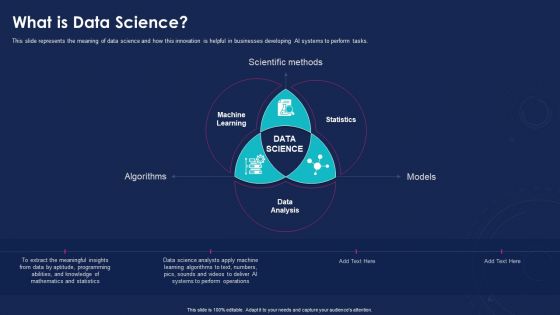
Data Analytics IT What Is Data Science Ppt Infographics Design Templates PDF
This slide represents the meaning of data science and how this innovation is helpful in businesses developing AI systems to perform tasks. This is a data analytics it what is data science ppt infographics design templates pdf template with various stages. Focus and dispense information on three stages using this creative set, that comes with editable features. It contains large content boxes to add your information on topics like algorithms, models, scientific methods. You can also showcase facts, figures, and other relevant content using this PPT layout. Grab it now.
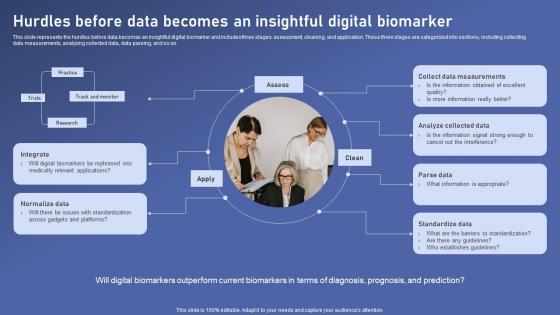
Hurdles Before Data Becomes Biomedical Data Science And Health Informatics Infographics Pdf
This slide represents the hurdles before data becomes an insightful digital biomarker and includes three stages assessment, cleaning, and application. These three stages are categorized into sections, including collecting data measurements, analyzing collected data, data parsing, and so on. Are you searching for a Hurdles Before Data Becomes Biomedical Data Science And Health Informatics Infographics Pdf that is uncluttered, straightforward, and original Its easy to edit, and you can change the colors to suit your personal or business branding. For a presentation that expresses how much effort you have put in, this template is ideal With all of its features, including tables, diagrams, statistics, and lists, its perfect for a business plan presentation. Make your ideas more appealing with these professional slides. Download Hurdles Before Data Becomes Biomedical Data Science And Health Informatics Infographics Pdf from Slidegeeks today. This slide represents the hurdles before data becomes an insightful digital biomarker and includes three stages assessment, cleaning, and application. These three stages are categorized into sections, including collecting data measurements, analyzing collected data, data parsing, and so on.
Data Stewardship In Business Processes Uses Of Data Stewardship Program Icons Pdf
This slide represents the uses of a data stewardship program that includes resolving any data or data related challenges, decreasing risks by security measures, improving data documentation, developing and using quality measures, and so on. Explore a selection of the finest Data Stewardship In Business Processes Uses Of Data Stewardship Program Icons Pdf here. With a plethora of professionally designed and pre made slide templates, you can quickly and easily find the right one for your upcoming presentation. You can use our Data Stewardship In Business Processes Uses Of Data Stewardship Program Icons Pdf to effectively convey your message to a wider audience. Slidegeeks has done a lot of research before preparing these presentation templates. The content can be personalized and the slides are highly editable. Grab templates today from Slidegeeks. This slide represents the uses of a data stewardship program that includes resolving any data or data related challenges, decreasing risks by security measures, improving data documentation, developing and using quality measures, and so on.
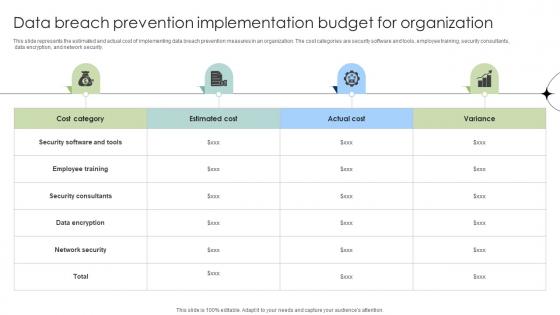
Data Breach Prevention Implementation Budget For Organization Data Fortification Strengthening Defenses
This slide represents the estimated and actual cost of implementing data breach prevention measures in an organization. The cost categories are security software and tools, employee training, security consultants, data encryption, and network security.If your project calls for a presentation, then Slidegeeks is your go-to partner because we have professionally designed, easy-to-edit templates that are perfect for any presentation. After downloading, you can easily edit Data Breach Prevention Implementation Budget For Organization Data Fortification Strengthening Defenses and make the changes accordingly. You can rearrange slides or fill them with different images. Check out all the handy templates This slide represents the estimated and actual cost of implementing data breach prevention measures in an organization. The cost categories are security software and tools, employee training, security consultants, data encryption, and network security.


 Continue with Email

 Home
Home


