Data Visualization Presentation

Slice Data With Apples Sliced PowerPoint Slides And Ppt Diagram Templates
Slice Data With Apples Sliced PowerPoint Slides And PPT Diagram Templates-These high quality, editable pre-designed powerpoint slides have been carefully created by our professional team to help you impress your audience. Each graphic in every slide is vector based and is 100% editable in powerpoint. Each and every property of any slide - color, size, shading etc can be modified to build an effective powerpoint presentation. Use these slides to convey complex business concepts in a simplified manner. Any text can be entered at any point in the powerpoint slide. Simply DOWNLOAD, TYPE and PRESENT! Branch out with our Slice Data With Apples Sliced PowerPoint Slides And Ppt Diagram Templates. You will come out on top.

Statistical Tools For Evidence 30 60 90 Days Plan To Perform Statistical Data Analysis
This slide represents 30-60-90 plan to conduct statistical data analysis. The purpose of this slide is to illustrate the plans of the first 90 days from the start of the project including steps to be followed at interval of one month. Do you have to make sure that everyone on your team knows about any specific topic I yes, then you should give Statistical Tools For Evidence 30 60 90 Days Plan To Perform Statistical Data Analysis a try. Our experts have put a lot of knowledge and effort into creating this impeccable Statistical Tools For Evidence 30 60 90 Days Plan To Perform Statistical Data Analysis. You can use this template for your upcoming presentations, as the slides are perfect to represent even the tiniest detail. You can download these templates from the Slidegeeks website and these are easy to edit. So grab these today This slide represents 30-60-90 plan to conduct statistical data analysis. The purpose of this slide is to illustrate the plans of the first 90 days from the start of the project including steps to be followed at interval of one month.
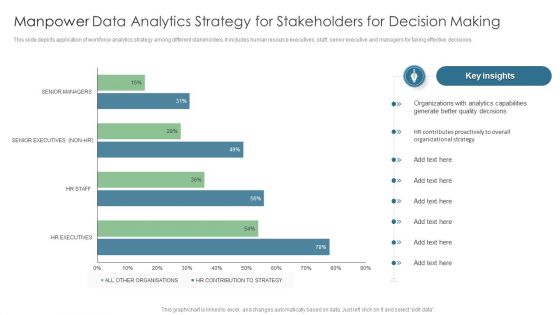
Manpower Data Analytics Strategy For Stakeholders For Decision Making Summary PDF
This slide depicts application of workforce analytics strategy among different stakeholders. It includes human resource executives, staff, senior executive and managers for taking effective decisions. Pitch your topic with ease and precision using this Manpower Data Analytics Strategy For Stakeholders For Decision Making Summary PDF. This layout presents information on Organizations, Analytics Capabilities, Generate Better Quality. It is also available for immediate download and adjustment. So, changes can be made in the color, design, graphics or any other component to create a unique layout.
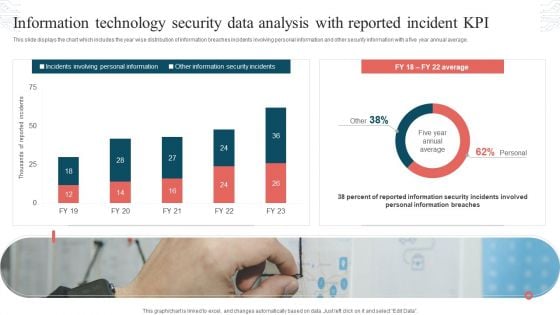
Information Technology Security Data Analysis With Reported Incident KPI Download PDF
This slide displays the chart which includes the year wise distribution of information breaches incidents involving personal information and other security information with a five year annual average. Showcasing this set of slides titled Information Technology Security Data Analysis With Reported Incident KPI Download PDF. The topics addressed in these templates are Incidents Involving, Personal Information, Other Information, Security Incidents. All the content presented in this PPT design is completely editable. Download it and make adjustments in color, background, font etc. as per your unique business setting.
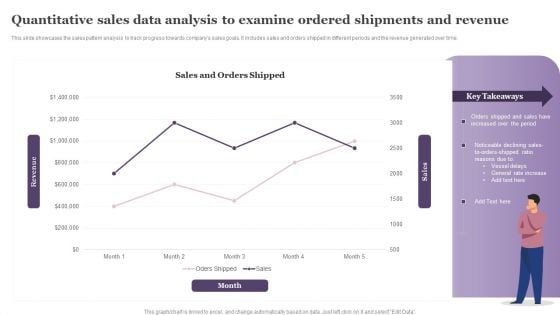
Quantitative Sales Data Analysis To Examine Ordered Shipments And Revenue Information PDF
This slide showcases the sales pattern analysis to track progress towards companys sales goals. It includes sales and orders shipped in different periods and the revenue generated over time. Showcasing this set of slides titled Quantitative Sales Data Analysis To Examine Ordered Shipments And Revenue Information PDF. The topics addressed in these templates are Sales And Orders, Month, Vessel Delays. All the content presented in this PPT design is completely editable. Download it and make adjustments in color, background, font etc. as per your unique business setting.
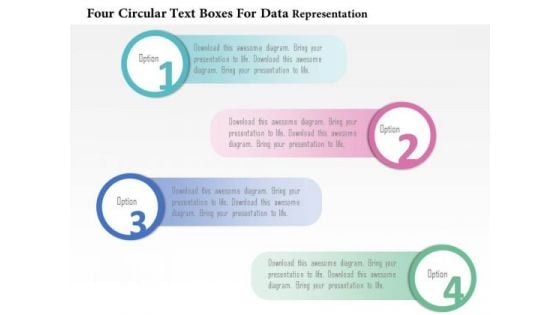
Business Diagram Four Circular Text Boxes For Data Representation PowerPoint Template
Graphic of four circular text boxes are used to craft this power point template. This PPT contains the concept of data representation. This PPT is suitable for business and marketing related presentations.
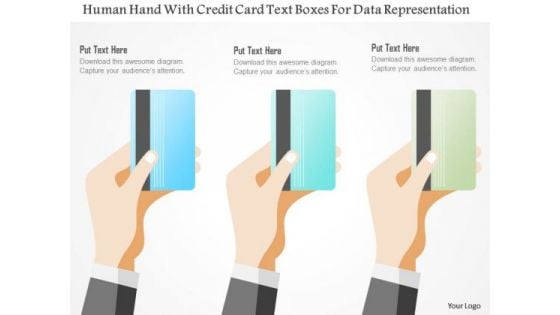
Business Diagram Human Hand With Credit Card Text Boxes For Data Representation Ppt Template
This power point template has been crafted with graphic of human hand and credit card style text boxes. his PPT diagram contains the concept of data representation. This PPT is suitable for your business and marketing presentations.
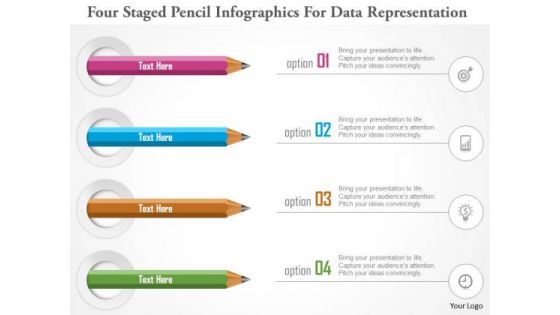
Business Diagram Four Staged Pencil Infographics For Data Representation PowerPoint Template
Four staged pencil info graphics has been used to design this power point template. This diagram template contains the concept of data representations. Use this PPT for your business and marketing presentations.
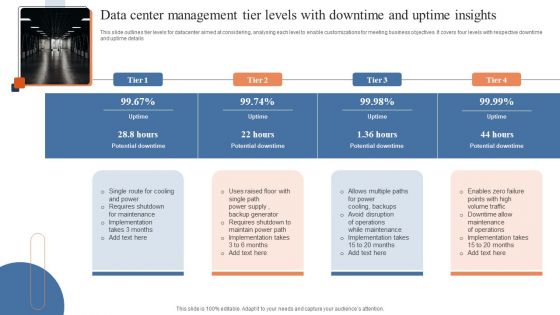
Data Center Management Tier Levels With Downtime And Uptime Insights Template PDF
This slide outlines tier levels for datacenter aimed at considering, analysing each level to enable customizations for meeting business objectives. It covers four levels with respective downtime and uptime details. Showcasing this set of slides titled Data Center Management Tier Levels With Downtime And Uptime Insights Template PDF. The topics addressed in these templates are Single Route Cooling, Allows Multiple Paths, Enables Zero Failure. All the content presented in this PPT design is completely editable. Download it and make adjustments in color, background, font etc. as per your unique business setting.
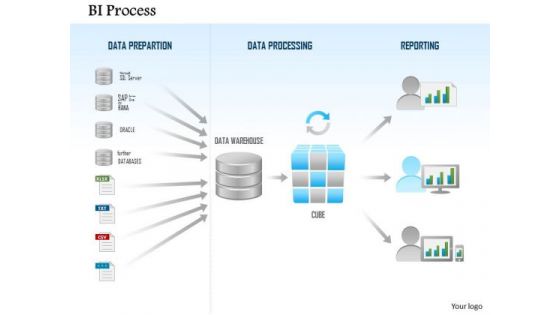
Business Diagram Business Intelligence Process Data Preparation Processing Reporting Ppt Slide
This technology diagram has been designed with graphic of computer server and databases with connectivity. This slide depicts the concept of business intelligence for data preparation. Download this diagram to build professional presentations.
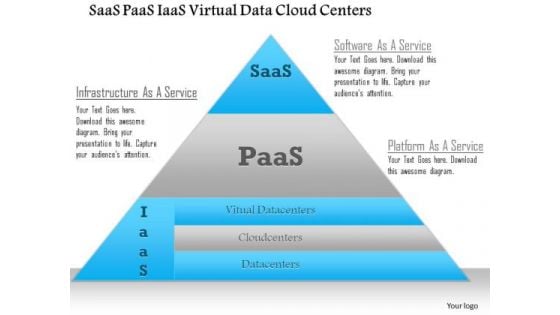
Business Diagram Saas Paas Iaas Virtual Data Cloud Centers Ppt Slide
This technical diagram has been designed with graphic of triangle. This slide contains the concept of SAAS, PAAS and IASS. This slide also helps to explain the virtual data on cloud centers. Download this diagram to make professional presentations.
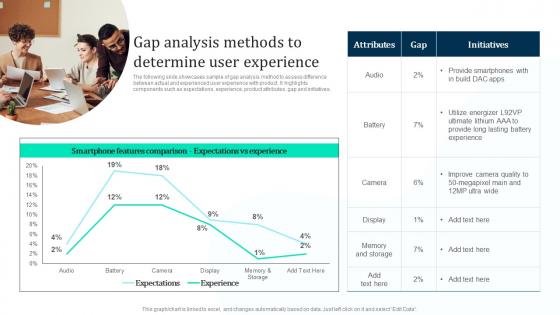
Gap Analysis Methods To Determine Marketing Intelligence Guide Data Gathering Download Pdf
The following slide showcases sample of gap analysis method to assess difference between actual and experienced user experience with product. It highlights components such as expectations, experience, product attributes, gap and initiatives. If your project calls for a presentation, then Slidegeeks is your go to partner because we have professionally designed, easy to edit templates that are perfect for any presentation. After downloading, you can easily edit Gap Analysis Methods To Determine Marketing Intelligence Guide Data Gathering Download Pdf and make the changes accordingly. You can rearrange slides or fill them with different images. Check out all the handy templates The following slide showcases sample of gap analysis method to assess difference between actual and experienced user experience with product. It highlights components such as expectations, experience, product attributes, gap and initiatives.
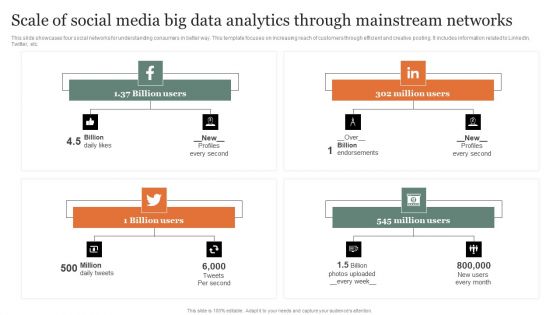
Scale Of Social Media Big Data Analytics Through Mainstream Networks Introduction PDF
This slide showcases four social networks for understanding consumers in better way. This template focuses on increasing reach of customers through efficient and creative posting. It includes information related to LinkedIn, Twitter, etc. Showcasing this set of slides titled Scale Of Social Media Big Data Analytics Through Mainstream Networks Introduction PDF Elements. The topics addressed in these templates are Mainstream Networks, Million Users, Scale. All the content presented in this PPT design is completely editable. Download it and make adjustments in color, background, font etc. as per your unique business setting.
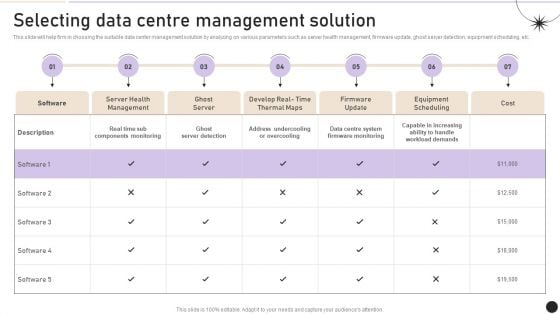
Selecting Data Centre Management Solution Workplace Security Management Program Information PDF
This slide will help firm in choosing the suitable data center management solution by analyzing on various parameters such as server health management, firmware update, ghost server detection, equipment scheduling, etc. If your project calls for a presentation, then Slidegeeks is your go to partner because we have professionally designed, easy to edit templates that are perfect for any presentation. After downloading, you can easily edit Selecting Data Centre Management Solution Workplace Security Management Program Information PDF and make the changes accordingly. You can rearrange slides or fill them with different images. Check out all the handy templates.
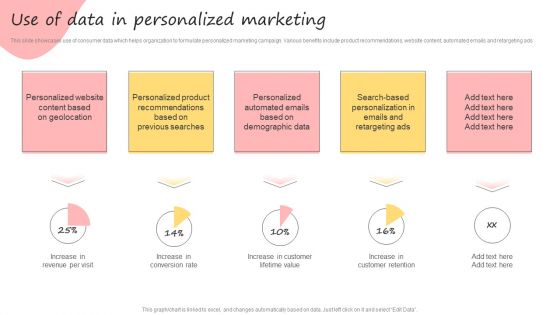
Developing Promotional Strategic Plan For Online Marketing Use Of Data In Personalized Marketing Inspiration PDF
This slide showcases use of consumer data which helps organization to formulate personalized marketing campaign. Various benefits include product recommendations, website content, automated emails and retargeting ads. If your project calls for a presentation, then Slidegeeks is your go-to partner because we have professionally designed, easy-to-edit templates that are perfect for any presentation. After downloading, you can easily edit Developing Promotional Strategic Plan For Online Marketing Use Of Data In Personalized Marketing Inspiration PDF and make the changes accordingly. You can rearrange slides or fill them with different images. Check out all the handy templates
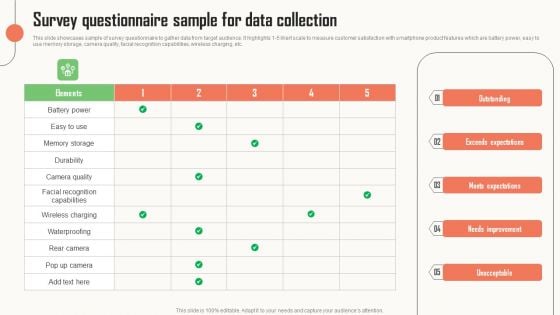
Strategic Market Insight Implementation Guide Survey Questionnaire Sample For Data Collection Designs PDF
This slide showcases sample of survey questionnaire to gather data from target audience. It highlights 1 5 likert scale to measure customer satisfaction with smartphone product features which are battery power, easy to use memory storage, camera quality, facial recognition capabilities, wireless charging, etc. If your project calls for a presentation, then Slidegeeks is your go to partner because we have professionally designed, easy to edit templates that are perfect for any presentation. After downloading, you can easily edit Strategic Market Insight Implementation Guide Survey Questionnaire Sample For Data Collection Designs PDF and make the changes accordingly. You can rearrange slides or fill them with different images. Check out all the handy templates
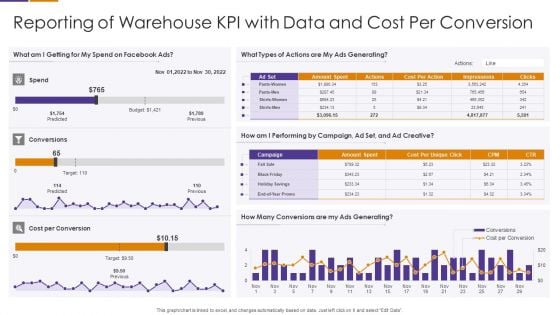
Reporting Of Warehouse KPI With Data And Cost Per Conversion Formats PDF
Pitch your topic with ease and precision using this Reporting Of Warehouse KPI With Data And Cost Per Conversion Formats PDF This layout presents information on Cost Per Conversion, Conversions Are My Ads Generating, Performing By Campaign It is also available for immediate download and adjustment. So, changes can be made in the color, design, graphics or any other component to create a unique layout.
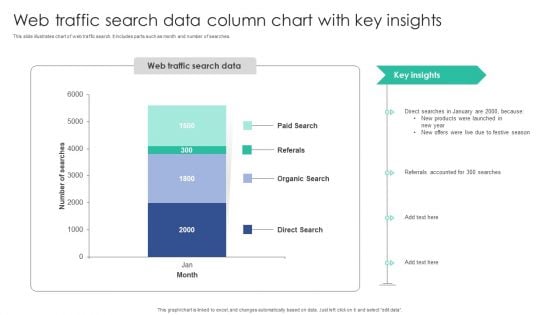
Web Traffic Search Data Column Chart With Key Insights Inspiration PDF
This slide illustrates chart of web traffic search. It includes parts such as month and number of searches.Pitch your topic with ease and precision using this Web Traffic Search Data Column Chart With Key Insights Inspiration PDF. This layout presents information on Organic Search, Referrals Accounted, Products Launched. It is also available for immediate download and adjustment. So, changes can be made in the color, design, graphics or any other component to create a unique layout.
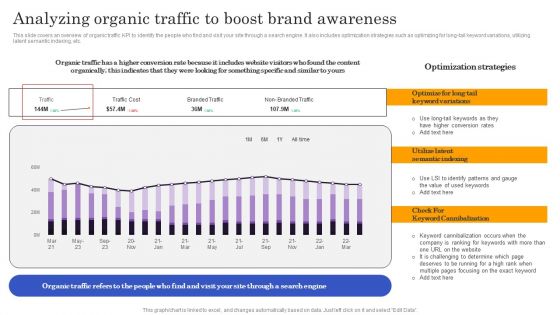
Marketers Guide To Data Analysis Optimization Analyzing Organic Traffic To Boost Brand Awareness Download PDF
This slide covers an overview of organic traffic KPI to identify the people who find and visit your site through a search engine. It also includes optimization strategies such as optimizing for long-tail keyword variations, utilizing latent semantic indexing, etc. If your project calls for a presentation, then Slidegeeks is your go to partner because we have professionally designed, easy to edit templates that are perfect for any presentation. After downloading, you can easily edit Marketers Guide To Data Analysis Optimization Analyzing Organic Traffic To Boost Brand Awareness Download PDF and make the changes accordingly. You can rearrange slides or fill them with different images. Check out all the handy templates
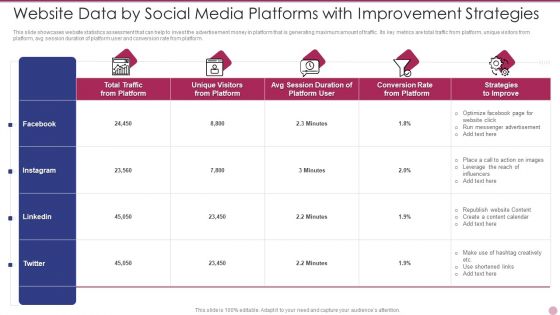
Website Data By Social Media Platforms With Improvement Strategies Diagrams PDF
This slide showcases website statistics assessment that can help to invest the advertisement money in platform that is generating maximum amount of traffic. Its key metrics are total traffic from platform, unique visitors from platform, avg session duration of platform user and conversion rate from platform. Showcasing this set of slides titled Website Data By Social Media Platforms With Improvement Strategies Diagrams PDF. The topics addressed in these templates are Strategies To Improve, Advertisement, Optimize. All the content presented in this PPT design is completely editable. Download it and make adjustments in color, background, font etc. as per your unique business setting.
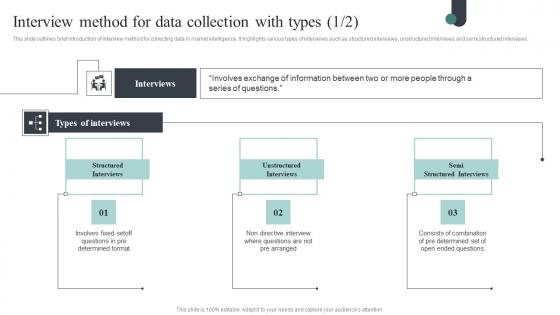
Competitive Intelligence Guide To Determine Market Interview Method For Data Designs Pdf
This slide outlines brief introduction of interview method for collecting data in market intelligence. It highlights various types of interviews such as structured interviews, unstructured interviews and semi structured interviews. If your project calls for a presentation, then Slidegeeks is your go-to partner because we have professionally designed, easy-to-edit templates that are perfect for any presentation. After downloading, you can easily edit Competitive Intelligence Guide To Determine Market Interview Method For Data Designs Pdf and make the changes accordingly. You can rearrange slides or fill them with different images. Check out all the handy templates This slide outlines brief introduction of interview method for collecting data in market intelligence. It highlights various types of interviews such as structured interviews, unstructured interviews and semi structured interviews.
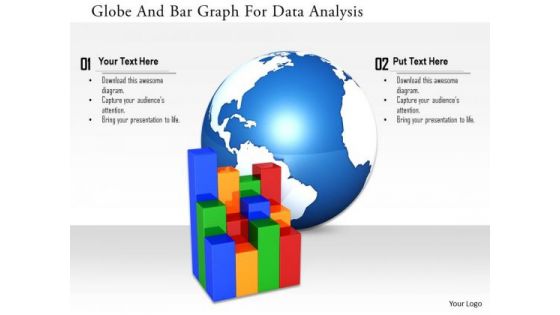
Stock Photo Globe And Bar Graph For Data Analysis Image Graphics For PowerPoint Slide
This image slide has been designed with business graph with globe in background. This image slide represents topics like global business, economic growth. This image will enhance the quality of your presentations.
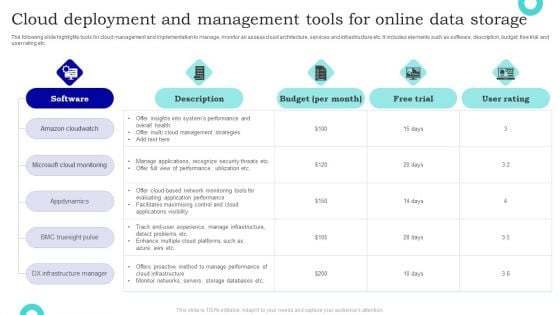
Cloud Deployment And Management Tools For Online Data Storage Clipart PDF
The following slide highlights tools for cloud management and implementation to manage, monitor an assess cloud architecture, services and infrastructure etc. It includes elements such as software, description, budget, free trial and user rating etc. Showcasing this set of slides titled Cloud Deployment And Management Tools For Online Data Storage Clipart PDF. The topics addressed in these templates are Description, Software, Budget. All the content presented in this PPT design is completely editable. Download it and make adjustments in color, background, font etc. as per your unique business setting.
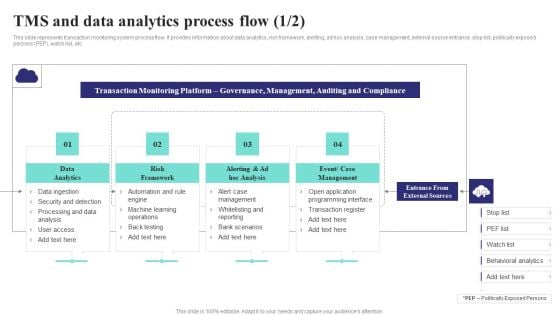
Formulating Money Laundering Tms And Data Analytics Process Flow Sample PDF
This slide represents transaction monitoring system process flow. It provides information about data analytics, risk framework, alerting, ad hoc analysis, case management, external source entrance, stop list, politically exposed persons PEP, watch list, etc. Do you have to make sure that everyone on your team knows about any specific topic I yes, then you should give Formulating Money Laundering Tms And Data Analytics Process Flow Sample PDF a try. Our experts have put a lot of knowledge and effort into creating this impeccable Formulating Money Laundering Tms And Data Analytics Process Flow Sample PDF. You can use this template for your upcoming presentations, as the slides are perfect to represent even the tiniest detail. You can download these templates from the Slidegeeks website and these are easy to edit. So grab these today.
1 Big Data Technology Icons Analytics Storage Replication Dashboard Magnify Ppt Slide

Stock Photo Three Lifesaver With Server For Data Protection PowerPoint Slide
This image slide displays 3d black computer server with life savers. This image has been designed with graphic of black computer server with red and white life savers on white background. Use this image slide to express views on client server computing and data safety. This image will enhance the quality of your presentations.

Table Of Contents For BI Technique For Data Informed Decisions Tool Diagrams PDF
If your project calls for a presentation, then Slidegeeks is your go to partner because we have professionally designed, easy to edit templates that are perfect for any presentation. After downloading, you can easily edit Table Of Contents For BI Technique For Data Informed Decisions Tool Diagrams PDF and make the changes accordingly. You can rearrange slides or fill them with different images. Check out all the handy templates.
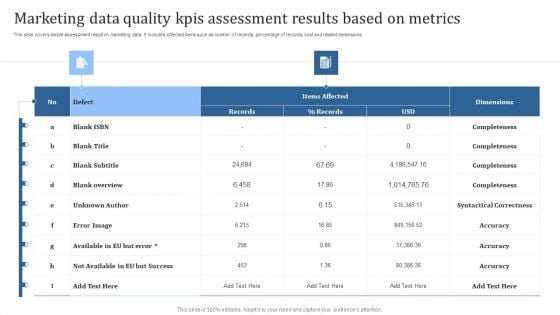
Marketing Data Quality Kpis Assessment Results Based On Metrics Summary PDF
This slide covers simple assessment result on marketing data. It includes affected items such as number of records, percentage of records, cost and related dimensions. Showcasing this set of slides titled Error Image, Unknown Author, Blank Overview. The topics addressed in these templates are Error Image, Unknown Author, Blank Overview. All the content presented in this PPT design is completely editable. Download it and make adjustments in color, background, font etc. as per your unique business setting.
Marketers Guide To Data Analysis Optimization Tracking Social Media Engagement Rate For Improving Conversions Brochure PDF
This slide covers an overview of the social media engagement rate to identify if the content is reaching the target audience. It also includes improvement strategies such as having a consistent, authentic voice, knowing your algorithms, and creating shareable content. Do you have to make sure that everyone on your team knows about any specific topic I yes, then you should give Marketers Guide To Data Analysis Optimization Tracking Social Media Engagement Rate For Improving Conversions Brochure PDF a try. Our experts have put a lot of knowledge and effort into creating this impeccable Marketers Guide To Data Analysis Optimization Tracking Social Media Engagement Rate For Improving Conversions Brochure PDF. You can use this template for your upcoming presentations, as the slides are perfect to represent even the tiniest detail. You can download these templates from the Slidegeeks website and these are easy to edit. So grab these today.
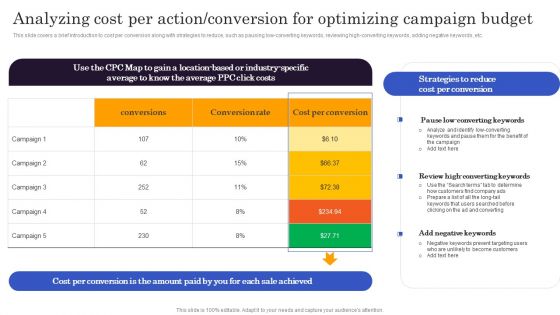
Marketers Guide To Data Analysis Optimization Analyzing Cost Per Action Conversion For Optimizing Structure PDF
This slide covers a brief introduction to cost per conversion along with strategies to reduce, such as pausing low-converting keywords, reviewing high converting keywords, adding negative keywords, etc. Do you have to make sure that everyone on your team knows about any specific topic I yes, then you should give Marketers Guide To Data Analysis Optimization Analyzing Cost Per Action Conversion For Optimizing Structure PDF a try. Our experts have put a lot of knowledge and effort into creating this impeccable Marketers Guide To Data Analysis Optimization Analyzing Cost Per Action Conversion For Optimizing Structure PDF. You can use this template for your upcoming presentations, as the slides are perfect to represent even the tiniest detail. You can download these templates from the Slidegeeks website and these are easy to edit. So grab these today.

Analyzing Impact Of Current Hr Management Process Analysing Hr Data For Effective Decision Making
This slide comprises the impact of poor HR management on organizational goals. These challenges include rising business cost, high customer dissatisfaction, and unmotivated employees. Do you have to make sure that everyone on your team knows about any specific topic I yes, then you should give Analyzing Impact Of Current Hr Management Process Analysing Hr Data For Effective Decision Making a try. Our experts have put a lot of knowledge and effort into creating this impeccable Analyzing Impact Of Current Hr Management Process Analysing Hr Data For Effective Decision Making. You can use this template for your upcoming presentations, as the slides are perfect to represent even the tiniest detail. You can download these templates from the Slidegeeks website and these are easy to edit. So grab these today This slide comprises the impact of poor HR management on organizational goals. These challenges include rising business cost, high customer dissatisfaction, and unmotivated employees.
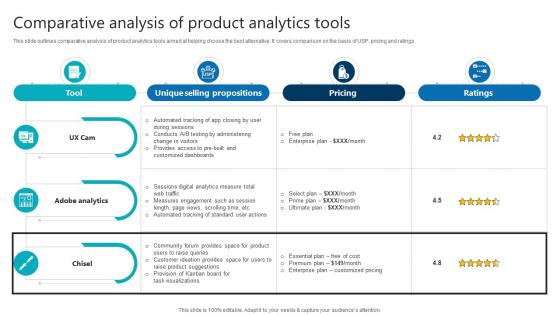
Comparative Analysis Of Product Analytics Tools Product Analytics Implementation Data Analytics V
This slide outlines comparative analysis of product analytics tools aimed at helping choose the best alternative. It covers comparison on the basis of USP, pricing and ratings If your project calls for a presentation, then Slidegeeks is your go-to partner because we have professionally designed, easy-to-edit templates that are perfect for any presentation. After downloading, you can easily edit Comparative Analysis Of Product Analytics Tools Product Analytics Implementation Data Analytics V and make the changes accordingly. You can rearrange slides or fill them with different images. Check out all the handy templates This slide outlines comparative analysis of product analytics tools aimed at helping choose the best alternative. It covers comparison on the basis of USP, pricing and ratings
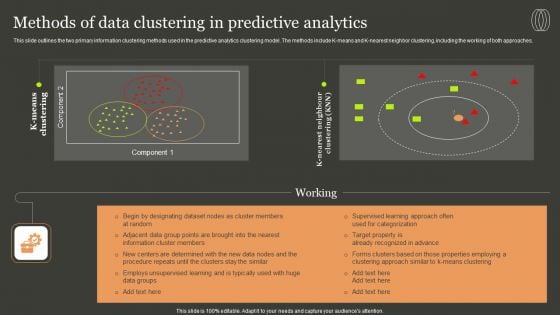
Predictive Analytics Methods Methods Of Data Clustering In Predictive Analytics Inspiration PDF
This slide outlines the two primary information clustering methods used in the predictive analytics clustering model. The methods include K-means and K-nearest neighbor clustering, including the working of both approaches. Do you have to make sure that everyone on your team knows about any specific topic I yes, then you should give Predictive Analytics Methods Methods Of Data Clustering In Predictive Analytics Inspiration PDF a try. Our experts have put a lot of knowledge and effort into creating this impeccable Predictive Analytics Methods Methods Of Data Clustering In Predictive Analytics Inspiration PDF. You can use this template for your upcoming presentations, as the slides are perfect to represent even the tiniest detail. You can download these templates from the Slidegeeks website and these are easy to edit. So grab these today.
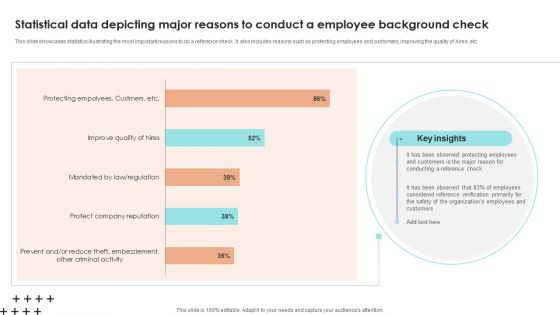
Statistical Data Depicting Major Reasons To Conduct A Employee Background Check Download PDF
This slide showcases statistics illustrating the most important reasons to do a reference check. It also includes reasons such as protecting employees and customers, improving the quality of hires, etc. Pitch your topic with ease and precision using this Statistical Data Depicting Major Reasons To Conduct A Employee Background Check Download PDF. This layout presents information on Key Insights, Reference Check, Customers. It is also available for immediate download and adjustment. So, changes can be made in the color, design, graphics or any other component to create a unique layout.
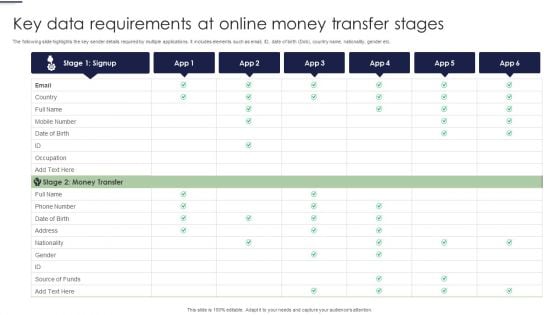
Key Data Requirements At Online Money Transfer Stages Ppt Portfolio Maker PDF
The following slide highlights the key sender details required by multiple applications. It includes elements such as email, ID, date of birth Dob, country name, nationality, gender etc. Pitch your topic with ease and precision using this Key Data Requirements At Online Money Transfer Stages Ppt Portfolio Maker PDF. This layout presents information on Money Transfer, Email, Occupation. It is also available for immediate download and adjustment. So, changes can be made in the color, design, graphics or any other component to create a unique layout.
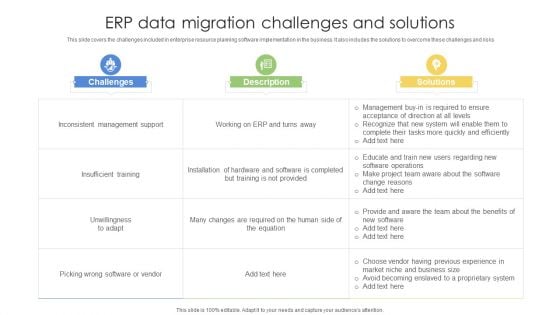
ERP Data Migration Challenges And Solutions Ppt Styles Design Inspiration PDF
This slide covers the challenges included in enterprise resource planning software implementation in the business. It also includes the solutions to overcome these challenges and risks. Pitch your topic with ease and precision using this ERP Data Migration Challenges And Solutions Ppt Styles Design Inspiration PDF. This layout presents information on Challenges, Solutions, Inconsistent Management Support. It is also available for immediate download and adjustment. So, changes can be made in the color, design, graphics or any other component to create a unique layout.
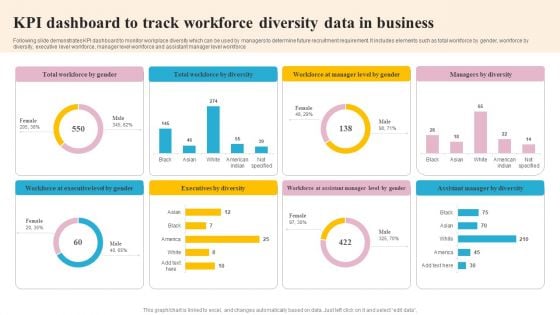
KPI Dashboard To Track Workforce Diversity Data In Business Mockup PDF
Following slide demonstrates KPI dashboard to monitor workplace diversity which can be used by managers to determine future recruitment requirement. It includes elements such as total workforce by gender, workforce by diversity, executive level workforce, manager level workforce and assistant manager level workforce. Pitch your topic with ease and precision using this KPI Dashboard To Track Workforce Diversity Data In Business Mockup PDF. This layout presents information on Executives By Diversity, Workforce By Diversity, Executive Level By Gender. It is also available for immediate download and adjustment. So, changes can be made in the color, design, graphics or any other component to create a unique layout.
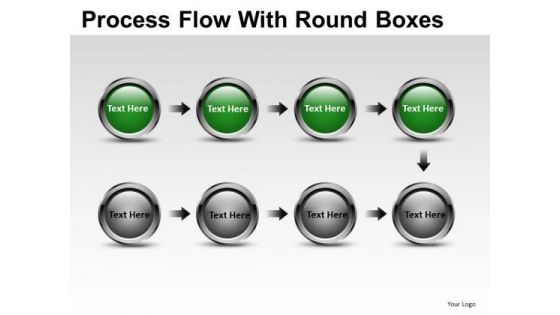
Data Process Flow With Round Boxes PowerPoint Slides And Ppt Diagram Templates
Data Process Flow With Round Boxes PowerPoint Slides And PPT Diagram Templates-These high quality, editable pre-designed powerpoint slides have been carefully created by our professional team to help you impress your audience. Each graphic in every slide is vector based and is 100% editable in powerpoint. Each and every property of any slide - color, size, shading etc can be modified to build an effective powerpoint presentation. Use these slides to convey complex business concepts in a simplified manner. Any text can be entered at any point in the powerpoint slide. Simply DOWNLOAD, TYPE and PRESENT! File it down with our Data Process Flow With Round Boxes PowerPoint Slides And Ppt Diagram Templates. Get your thoughts into the shape you desire.
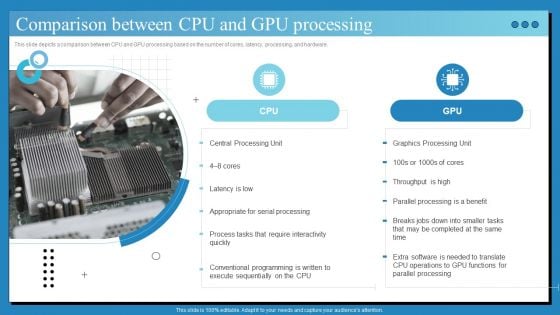
Data Center Infrastructure Technologies Comparison Between CPU And GPU Diagrams PDF
This slide depicts a comparison between CPU and GPU processing based on the number of cores, latency, processing, and hardware. If your project calls for a presentation, then Slidegeeks is your go-to partner because we have professionally designed, easy-to-edit templates that are perfect for any presentation. After downloading, you can easily edit Data Center Infrastructure Technologies Comparison Between CPU And GPU Diagrams PDF and make the changes accordingly. You can rearrange slides or fill them with different images. Check out all the handy templates.
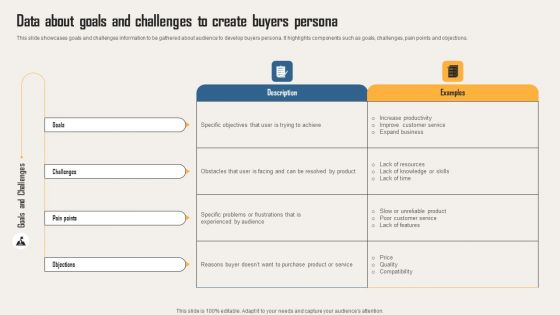
Creating Customer Personas For Customizing Data About Goals And Challenges To Create Mockup PDF
This slide showcases goals and challenges information to be gathered about audience to develop buyers persona. It highlights components such as goals, challenges, pain points and objections. If your project calls for a presentation, then Slidegeeks is your go-to partner because we have professionally designed, easy-to-edit templates that are perfect for any presentation. After downloading, you can easily edit Creating Customer Personas For Customizing Data About Goals And Challenges To Create Mockup PDF and make the changes accordingly. You can rearrange slides or fill them with different images. Check out all the handy templates.
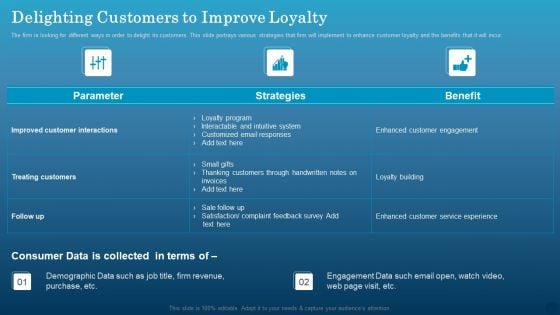
Data Monetization Approach To Drive Business Growth Delighting Customers To Improve Loyalty Inspiration PDF
The firm is looking for different ways in order to delight its customers. This slide portrays various strategies that firm will implement to enhance customer loyalty and the benefits that it will incur. If your project calls for a presentation, then Slidegeeks is your go to partner because we have professionally designed, easy to edit templates that are perfect for any presentation. After downloading, you can easily edit Data Monetization Approach To Drive Business Growth Delighting Customers To Improve Loyalty Inspiration PDF and make the changes accordingly. You can rearrange slides or fill them with different images. Check out all the handy templates.
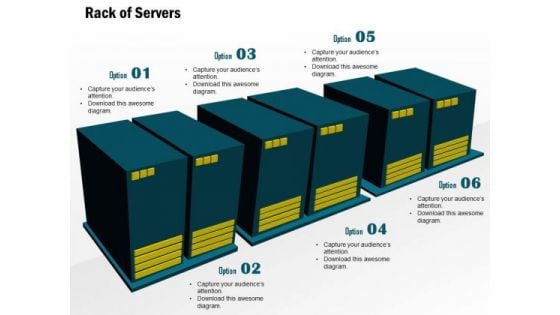
1 Editable Rack Of Servers In A Cluster For Data Warehousing In A Datacenter Ppt Slide
This image slide displays rack of servers. This image slide has been designed with graphic of computer server pairs on rack. Use this image slide, in your presentations to express views on networking, communication, storage and technology. This image slide will impart professional appearance to your presentations.

Product Analytics KPI Dashboard For Lead Generation Product Analytics Implementation Data Analytics V
This slide illustrates a dashboard to monitor the lead generation on website page using product analytics aimed at making necessary improvements. It covers insights regarding analysis of lead conversions, event retention rate and page views.Do you have to make sure that everyone on your team knows about any specific topic I yes, then you should give Product Analytics KPI Dashboard For Lead Generation Product Analytics Implementation Data Analytics V a try. Our experts have put a lot of knowledge and effort into creating this impeccable Product Analytics KPI Dashboard For Lead Generation Product Analytics Implementation Data Analytics V. You can use this template for your upcoming presentations, as the slides are perfect to represent even the tiniest detail. You can download these templates from the Slidegeeks website and these are easy to edit. So grab these today This slide illustrates a dashboard to monitor the lead generation on website page using product analytics aimed at making necessary improvements. It covers insights regarding analysis of lead conversions, event retention rate and page views
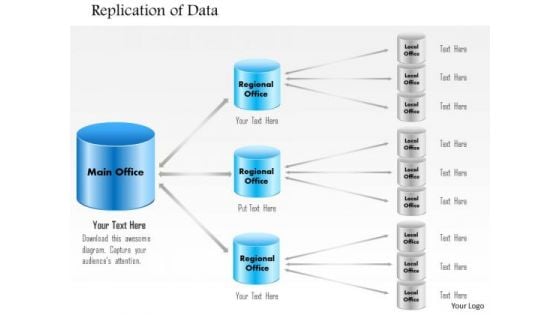
1 Replication Of Data From Main Office To Regional Office To Branch Offices Ppt Slide
This image slide explains the concept database replication in an organization. This image slide has been designed with graphic of database system transfers in main, regional and local office branches. You may change color, size and orientation of any icon to your liking. Use this image slide, in your presentations to express views on backup, storage, networking, communication and technology. Create wonderful presentations using this image slide.
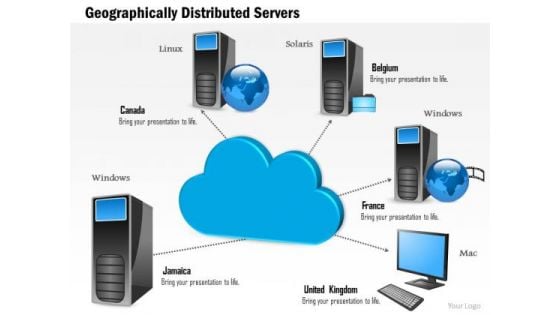
1 Geographically Distributed Servers Across Data Centers Connected To A Centralized Cloud Ppt Slides
This image slide displays geographically distributed server. This image slide has been designed with graphic of could, servers and globe. This image depicts cloud computing. You may change size, color and orientation of any icon to your liking. Use this PowerPoint template, in your presentations to explain concept of cloud computing both at local and global scale. This image slide will help you make professional presentations.
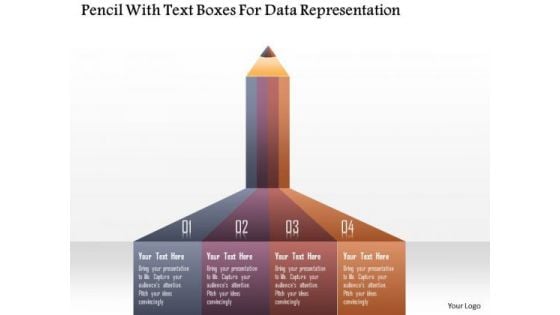
Business Diagram Pencil With Text Boxes For Data Representation PowerPoint Template
This power point template diagram has been designed with graphic of pencil style text boxes. These boxes are used to display the text and data. Use this PPT for your business presentation.
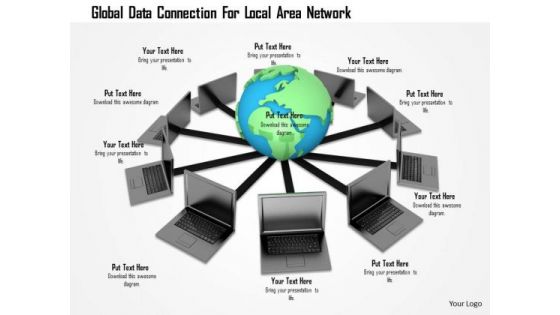
Stock Photo Global Data Connection For Local Area Network PowerPoint Slide
This Power point template has been designed with graphic of globe connected with laptops. This image slide contains the concept of global networking. Use this slide for your business network and communication related topics in any presentation.
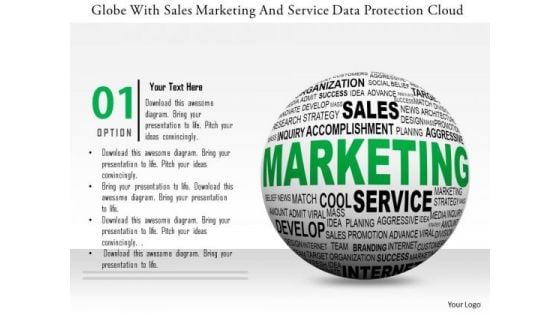
Stock Photo Globe With Sales Marketing And Service Data Protection Cloud PowerPoint Slide
This power point template has been designed with graphic of globe and cloud. This image template contains the concept of global sales and marketing service with cloud technology. Use this image template for global business related presentations.
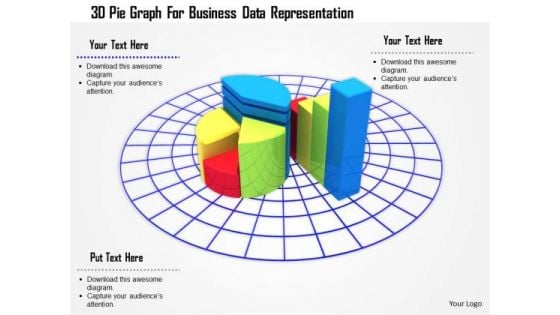
Stock Photo 3d Pie Graph For Business Data Representation PowerPoint Slide
3D business graph has been used to design this PowerPoint template. This Image slide is suitable to make business reports and charts. This slide can be used for business and marketing presentations.
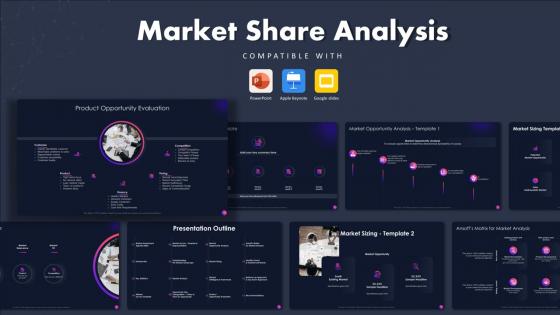
Market Share Analysis Powerpoint Presentation
This Market Share Analysis Powerpoint Presentation is designed to help you retain your audiences attention. This content-ready PowerPoint Template enables you to take your audience on a journey and share information in a way that is easier to recall. It helps you highlight the crucial parts of your work so that the audience does not get saddled with information download. This Market Share Analysis,Market Assessment,Market analysis-slide PPT Deck comes prepared with the graphs and charts you could need to showcase your information through visuals. You only need to enter your own data in them. Download this editable PowerPoint Theme and walk into that meeting with confidence. Market Share Analysis PowerPoint Presentation Slides helps you showcase your organizations market reach. This market share assessment PPT theme is useful for marketers to explain the assessment agenda of their organization. Exploit the design of market share evaluation PowerPoint slideshow to illustrate key statistics using impactful data visualization techniques. Further, you can also use market share research PPT template to graphically represent the market survey results. Communicate the market landscape to your audience by the means of infographics included in this market share review PowerPoint theme. Utilize the market analysis Venn diagram given in market intelligence PPT slideshow to demonstrate market relevance, market opportunities, and market fit. Showcase market sizing and market opportunity analysis by incorporating data visualization tools given in this visually appealing PowerPoint presentation. So, download this market size estimation PPT deck to portray product opportunity analysis through various key performance indicators.
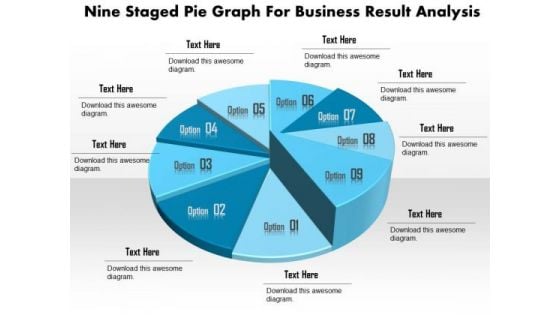
Business Diagram Nine Staged Pie Graph For Business Result Analysis Presentation Template
This business slide displays nine staged pie chart. This diagram is a data visualization tool that gives you a simple way to present statistical information. This slide helps your audience examine and interpret the data you present.
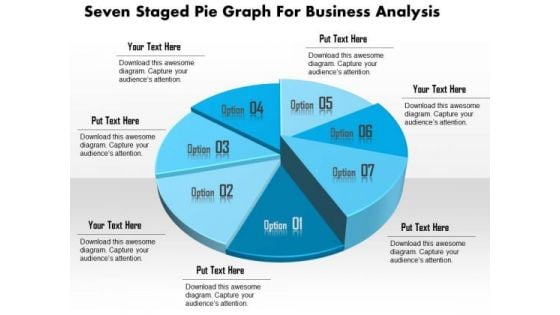
Business Diagram Seven Staged Pie Graph For Business Analysis Presentation Template
This business slide displays seven staged pie chart. This diagram is a data visualization tool that gives you a simple way to present statistical information. This slide helps your audience examine and interpret the data you present.
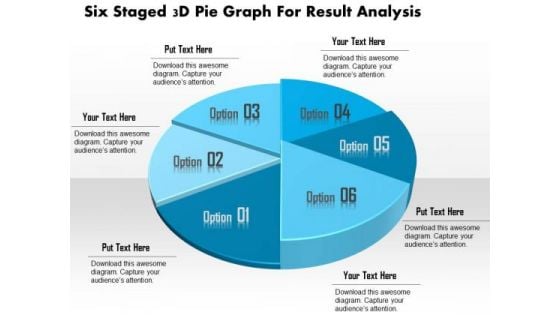
Business Diagram Six Staged 3d Pie Graph For Result Analysis Presentation Template
This business slide displays six staged pie chart. This diagram is a data visualization tool that gives you a simple way to present statistical information. This slide helps your audience examine and interpret the data you present.
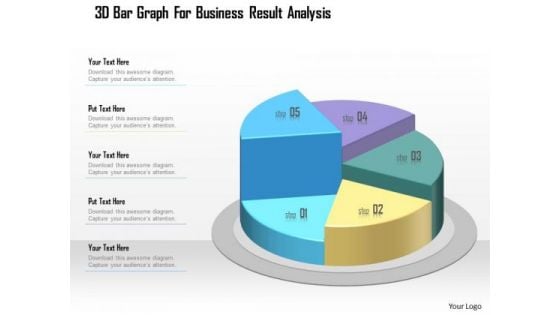
Business Diagram 3d Bar Graph For Business Result Analysis Presentation Template
This business slide displays five staged pie chart. This diagram is a data visualization tool that gives you a simple way to present statistical information. This slide helps your audience examine and interpret the data you present.
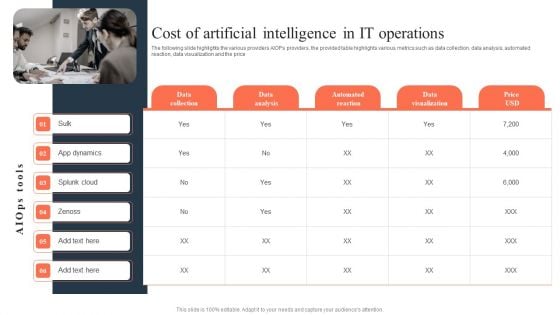
Ml And Big Data In Information Technology Processes Cost Of Artificial Intelligence In IT Operations Infographics PDF
The following slide highlights the various providers AIOPs providers, the provided table highlights various metrics such as data collection, data analysis, automated reaction, data visualization and the price Do you have to make sure that everyone on your team knows about any specific topic I yes, then you should give Ml And Big Data In Information Technology Processes Cost Of Artificial Intelligence In IT Operations Infographics PDF a try. Our experts have put a lot of knowledge and effort into creating this impeccable Ml And Big Data In Information Technology Processes Cost Of Artificial Intelligence In IT Operations Infographics PDF. You can use this template for your upcoming presentations, as the slides are perfect to represent even the tiniest detail. You can download these templates from the Slidegeeks website and these are easy to edit. So grab these today.
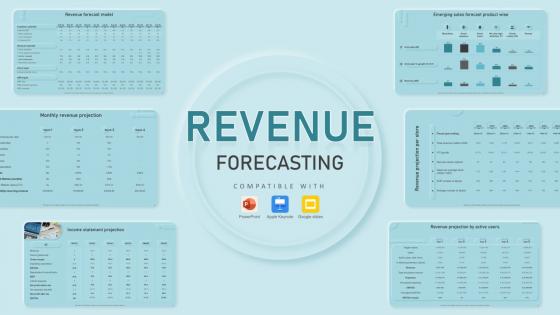
Revenue Forecasting Powerpoint Presentation Slides
Take advantage of this well-researched and professionally-designed Revenue Forecasting Powerpoint Presentation Slides to ace your next business meeting. Use this PPT complete deck to impress the management with your ideas for business growth and revenue increase. Use the Revenue Estimation, Sales Forecasting, Income Prediction, Financial Forecasting, Profit Projection-slide Template Bundle to leave no stone unturned as you present each step of your process. Employ the visual tools within the slides such as graphs, charts, and tables to ensure that the audience can never look away from the presentation. With attractive visuals, easy to understand structure, and your knowledge, your presentation will have the attention it deserves. Download this PPT Template from the link below. Plan your companys financial future with our Revenue Forecasting PowerPoint Slides. Including customizable templates, charts, and graphs, this deck simplifies income forecasting, revenue projections, and budgeting processes. Present financial data visually and showcase planning strategies with professional ease.
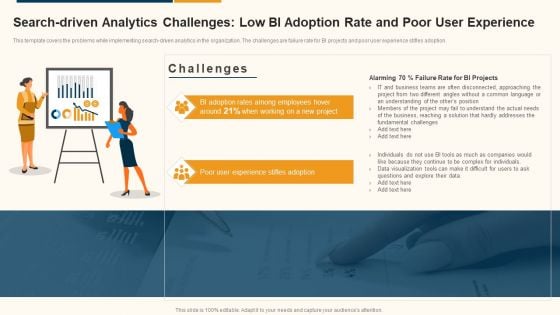
Data Interpretation And Analysis Playbook Search Driven Analytics Challenges Low Bi Adoption Rate And Poor Demonstration PDF
This template covers the problems while implementing search-driven analytics in the organization. The challenges are failure rate for BI projects and poor user experience stifles adoption. Presenting data interpretation and analysis playbook search driven analytics challenges low bi adoption rate and poor demonstration pdf to provide visual cues and insights. Share and navigate important information on two stages that need your due attention. This template can be used to pitch topics like business, data visualization, fundamental challenges. In addtion, this PPT design contains high resolution images, graphics, etc, that are easily editable and available for immediate download.
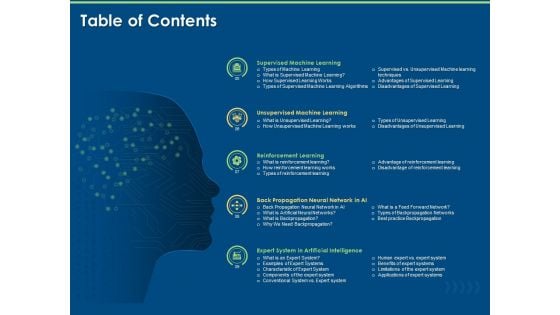
Artificial Intelligence Machine Learning Deep Learning Table Of Contents System Ppt PowerPoint Presentation Infographic Template Visuals PDF
Presenting this set of slides with name artificial intelligence machine learning deep learning table of contents system ppt powerpoint presentation infographic template visuals pdf. This is a five stage process. The stages in this process are supervised machine learning, unsupervised machine learning, reinforcement learning, back propagation neural network ai, expert system artificial intelligence. This is a completely editable PowerPoint presentation and is available for immediate download. Download now and impress your audience.
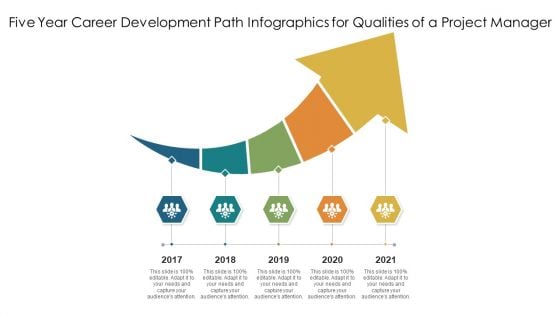
Five Year Career Development Path Infographics For Qualities Of A Project Manager Ppt PowerPoint Presentation Ideas Visuals PDF
Presenting five year career development path infographics for qualities of a project manager ppt powerpoint presentation ideas visuals pdf to dispense important information. This template comprises five stages. It also presents valuable insights into the topics including five year career development path infographics for qualities of a project manager This is a completely customizable PowerPoint theme that can be put to use immediately. So, download it and address the topic impactfully.
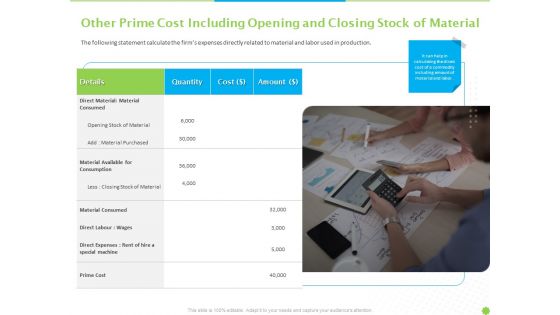
Price Architecture Other Prime Cost Including Opening And Closing Stock Of Material Ppt PowerPoint Presentation Gallery Visuals PDF
The following statement calculate the firms expenses directly related to material and labor used in production. This is a price architecture other prime cost including opening and closing stock of material ppt powerpoint presentation gallery visuals pdf template with various stages. Focus and dispense information on one stages using this creative set, that comes with editable features. It contains large content boxes to add your information on topics like material available consumption, closing stock material, material consumed, direct expenses, rent hire special machine, prime cost. You can also showcase facts, figures, and other relevant content using this PPT layout. Grab it now.


 Continue with Email

 Home
Home


