Data Visualization Presentation
Creating A Customer Persona Demographics Ppt Icon Visual Aids PDF
Buyer persona helps you develop a deeper understanding of your target audience which aids in creating the right customer experience strategy for them. Presenting creating a customer persona demographics ppt icon visual aids pdf. to provide visual cues and insights. Share and navigate important information on five stages that need your due attention. This template can be used to pitch topics like background and demographics, hobbies and interests, interest. In addtion, this PPT design contains high resolution images, graphics, etc, that are easily editable and available for immediate download.
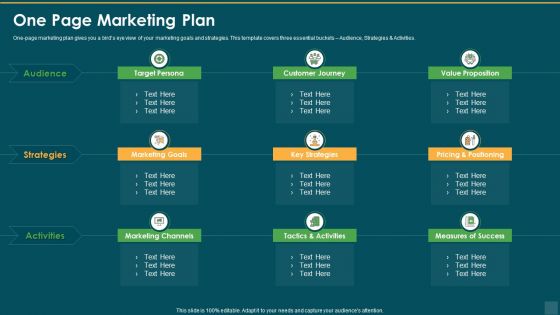
One Page Marketing Plan Ppt File Visual Aids PDF
One page marketing plan gives you a birds eye view of your marketing goals and strategies. This template covers three essential buckets Audience, Strategies and Activities. Presenting one page marketing plan ppt file visual aids pdf to provide visual cues and insights. Share and navigate important information on nine stages that need your due attention. This template can be used to pitch topics like target persona, marketing goals, marketing channels, customer journey. In addtion, this PPT design contains high resolution images, graphics, etc, that are easily editable and available for immediate download.
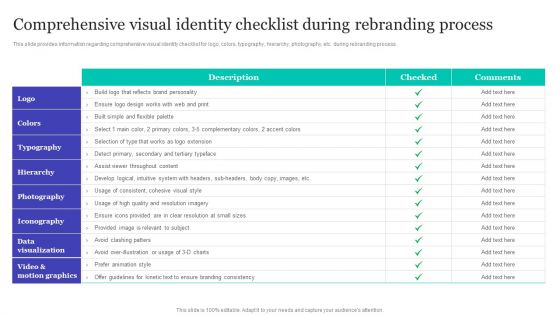
Comprehensive Visual Identity Checklist During Rebranding Process Pictures PDF
This slide provides information regarding comprehensive visual identity checklist for logo, colors, typography, hierarchy, photography, etc. during rebranding process. Here you can discover an assortment of the finest PowerPoint and Google Slides templates. With these templates, you can create presentations for a variety of purposes while simultaneously providing your audience with an eye catching visual experience. Download Comprehensive Visual Identity Checklist During Rebranding Process Pictures PDF to deliver an impeccable presentation. These templates will make your job of preparing presentations much quicker, yet still, maintain a high level of quality. Slidegeeks has experienced researchers who prepare these templates and write high quality content for you. Later on, you can personalize the content by editing the Comprehensive Visual Identity Checklist During Rebranding Process Pictures PDF.
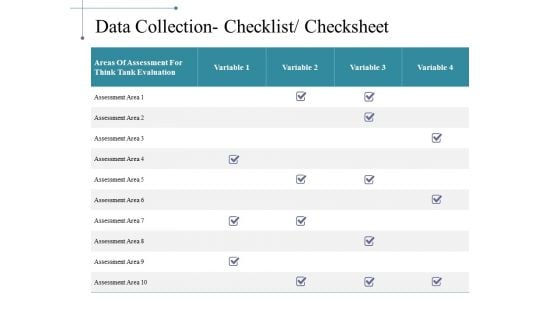
Data Collection Checklist Checksheet Ppt PowerPoint Presentation File Example File
This is a data collection checklist checksheet ppt powerpoint presentation file example file. This is a four stage process. The stages in this process are areas of assessment for think tank evaluation, table, data analysis, management.
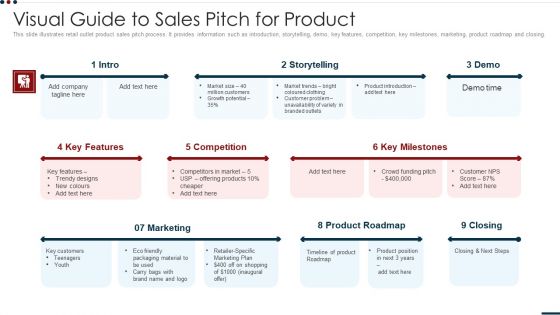
Visual Guide To Sales Pitch For Product Microsoft PDF
This slide illustrates retail outlet product sales pitch process. It provides information such as introduction, storytelling, demo, key features, competition, key milestones, marketing, product roadmap and closing. Presenting visual guide to sales pitch for product microsoft pdf to dispense important information. This template comprises nine stages. It also presents valuable insights into the topics including storytelling, marketing, product roadmap, key milestones, competition. This is a completely customizable PowerPoint theme that can be put to use immediately. So, download it and address the topic impactfully.
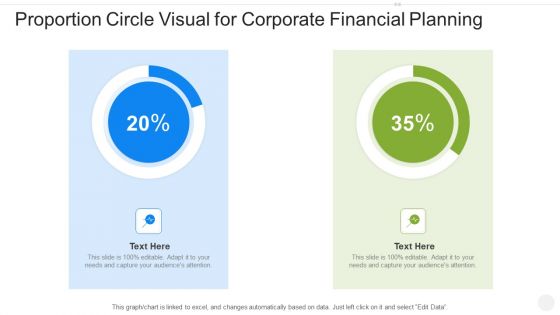
Proportion Circle Visual For Corporate Financial Planning Brochure PDF
Pitch your topic with ease and precision using this proportion circle visual for corporate financial planning brochure pdf. This layout presents information on proportion circle visual for corporate financial planning. It is also available for immediate download and adjustment. So, changes can be made in the color, design, graphics or any other component to create a unique layout.
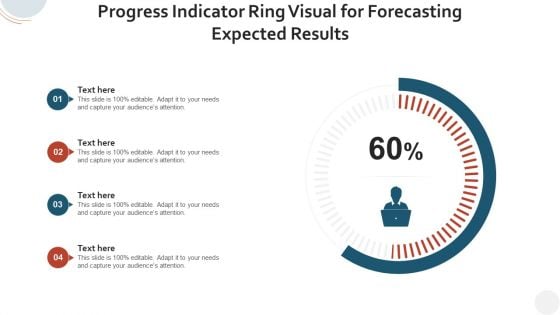
Progress Indicator Ring Visual For Forecasting Expected Results Diagrams PDF
Pitch your topic with ease and precision using this progress indicator ring visual for forecasting expected results diagrams pdf. This layout presents information on progress indicator ring visual for forecasting expected results. It is also available for immediate download and adjustment. So, changes can be made in the color, design, graphics or any other component to create a unique layout.
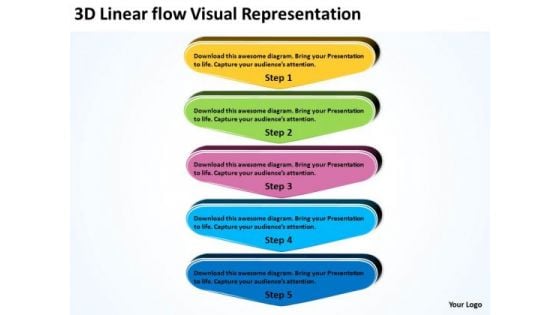
3d Linear Flow Visual Representation Business Tech Support PowerPoint Slides
We present our 3d linear flow visual representation business tech support PowerPoint Slides.Use our Arrows PowerPoint Templates because this diagram helps you to develop your marketing strategy and communicate your enthusiasm and motivation to raise the bar. Download and present our Business PowerPoint Templates because your fledgling career is in the chrysallis stage. Nurture it and watch it grow into a beautiful butterfly. Download our Shapes PowerPoint Templates because they will Amplify your plans to have dedicated sub groups working on related but distinct tasks. Download our Leadership PowerPoint Templates because this diagram can be used to illustrate the logical path or system. Download our Marketing PowerPoint Templates because you can outline your targets to your team.Use these PowerPoint slides for presentations relating to Abstract, Arrow, Arrows, Business, Chart, Design, Development, Diagram, Direction, Element, Flow, Flowchart, Graph, Linear, Management, Model, Motion, Organization, Plan, Process, Program, Section, Segment, Set, Sign, Solution, Strategy, Symbol, Technology. The prominent colors used in the PowerPoint template are Yellow, Green, Pink. Customers tell us our 3d linear flow visual representation business tech support PowerPoint Slides will impress their bosses and teams. The feedback we get is that our Diagram PowerPoint templates and PPT Slides are Romantic. Professionals tell us our 3d linear flow visual representation business tech support PowerPoint Slides are Clever. People tell us our Chart PowerPoint templates and PPT Slides are the best it can get when it comes to presenting. Customers tell us our 3d linear flow visual representation business tech support PowerPoint Slides are Endearing. Professionals tell us our Business PowerPoint templates and PPT Slides are Clever. Test boundaries of presenting with our 3d Linear Flow Visual Representation Business Tech Support PowerPoint Slides. Download without worries with our money back guaranteee.

Exit Strategy For The Investors Ppt Visual Aids Model PDF
This slide Provides the Exit Strategy which includes Acquisition, Financial Buyer and Liquidation.Presenting exit strategy for the investors ppt visual aids model pdf. to provide visual cues and insights. Share and navigate important information on three stages that need your due attention. This template can be used to pitch topics like acquisition, financial buyer, liquidation. In addtion, this PPT design contains high resolution images, graphics, etc, that are easily editable and available for immediate download.
Data Transfer Governance Vector Icon Ppt PowerPoint Presentation Infographics Tips
Presenting this set of slides with name data transfer governance vector icon ppt powerpoint presentation infographics tips. This is a one stage process. The stages in this process are data sources, database management, marketing. This is a completely editable PowerPoint presentation and is available for immediate download. Download now and impress your audience.

Young Crowd Enjoying Live Concert Ppt Pictures Visual Aids PDF
Pitch your topic with ease and precision using this young crowd enjoying live concert ppt pictures visual aids pdf. This layout presents information on young crowd enjoying live concert. It is also available for immediate download and adjustment. So, changes can be made in the color, design, graphics or any other component to create a unique layout.
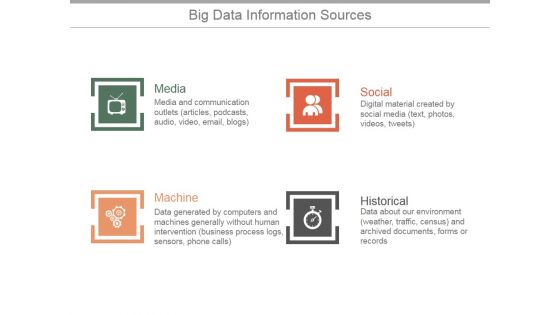
Big Data Information Sources Ppt PowerPoint Presentation Slides
This is a big data information sources ppt powerpoint presentation slides. This is a four stage process. The stages in this process are media, social, machine, historical.
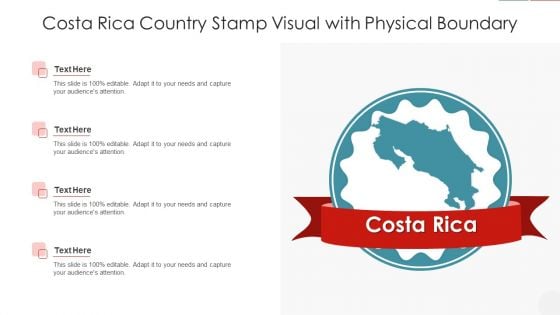
Costa Rica Country Stamp Visual With Physical Boundary Guidelines PDF
Showcasing this set of slides titled costa rica country stamp visual with physical boundary guidelines pdf. The topics addressed in these templates are costa rica country stamp visual with physical boundary. All the content presented in this PPT design is completely editable. Download it and make adjustments in color, background, font etc. as per your unique business setting.
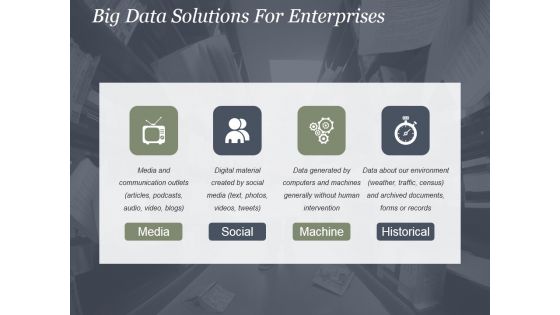
Big Data Solutions For Enterprises Ppt PowerPoint Presentation Layouts
This is a big data solutions for enterprises ppt powerpoint presentation layouts. This is a four stage process. The stages in this process are media, social, machine, historical.
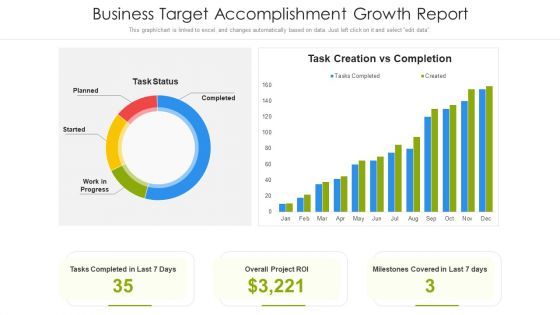
Business Target Accomplishment Growth Report Ppt Visual Aids Summary PDF
Pitch your topic with ease and precision using this business target accomplishment growth report ppt visual aids summary pdf. This layout presents information on business target accomplishment growth report. It is also available for immediate download and adjustment. So, changes can be made in the color, design, graphics or any other component to create a unique layout.
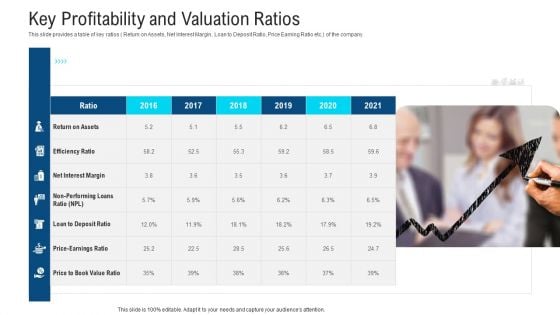
Key Profitability And Valuation Ratios Ppt Model Visual Aids PDF
This slide provides a table of key ratios Return on Assets, Net Interest Margin, Loan to Deposit Ratio, Price Earning Ratio etc. of the company.Presenting key profitability and valuation ratios ppt model visual aids pdf. to provide visual cues and insights. Share and navigate important information on one stage that need your due attention. This template can be used to pitch topics like net interest margin, loan to deposit ratio, price to book value ratio. In addtion, this PPT design contains high resolution images, graphics, etc, that are easily editable and available for immediate download.
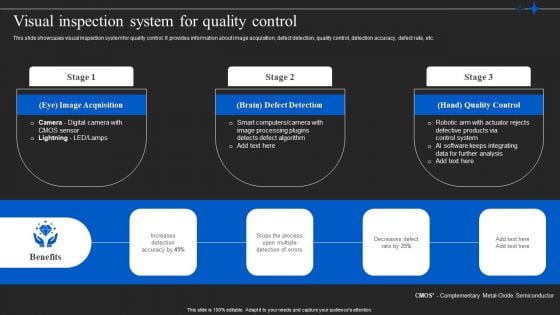
Automated Quality Control In Manufacturing Visual Inspection System Template PDF
This slide showcases visual inspection system for quality control. It provides information about image acquisition, defect detection, quality control, detection accuracy, defect rate, etc. Do you have to make sure that everyone on your team knows about any specific topic I yes, then you should give Automated Quality Control In Manufacturing Visual Inspection System Template PDF a try. Our experts have put a lot of knowledge and effort into creating this impeccable Automated Quality Control In Manufacturing Visual Inspection System Template PDF. You can use this template for your upcoming presentations, as the slides are perfect to represent even the tiniest detail. You can download these templates from the Slidegeeks website and these are easy to edit. So grab these today.
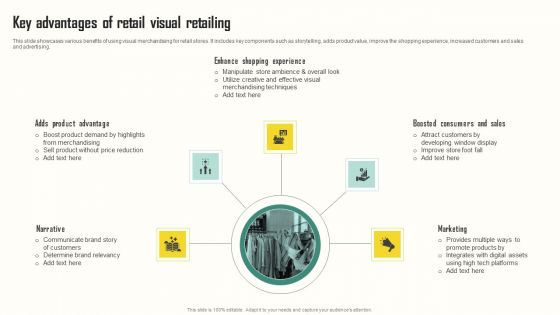
Key Advantages Of Retail Visual Retailing Sample PDF
This slide showcases various benefits of using visual merchandising for retail stores. It includes key components such as storytelling, adds product value, improve the shopping experience, increased customers and sales and advertising.Pitch your topic with ease and precision using this Key Advantages Of Retail Visual Retailing Sample PDF. This layout presents information on Narrative, Marketing, Boosted consumers and sales. It is also available for immediate download and adjustment. So, changes can be made in the color, design, graphics or any other component to create a unique layout.
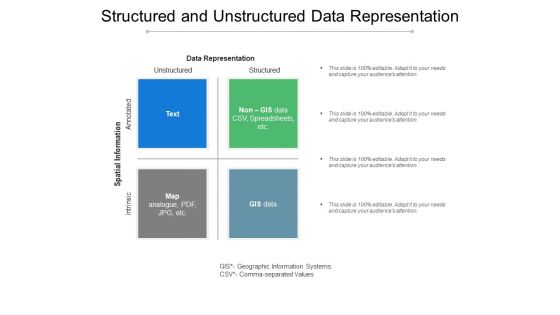
Structured And Unstructured Data Representation Ppt PowerPoint Presentation Styles Gridlines
Presenting this set of slides with name structured and unstructured data representation ppt powerpoint presentation styles gridlines. This is a four stage process. The stages in this process are data sources, database management, marketing. This is a completely editable PowerPoint presentation and is available for immediate download. Download now and impress your audience.
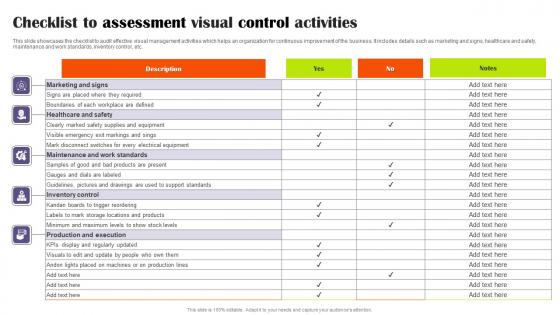
Checklist To Assessment Visual Control Activities Slides Pdf
This slide showcases the checklist to audit effective visual management activities which helps an organization for continuous improvement of the business. It includes details such as marketing and signs, healthcare and safety, maintenance and work standards, inventory control, etc. Pitch your topic with ease and precision using this Checklist To Assessment Visual Control Activities Slides Pdf This layout presents information on Marketing And Signs, Healthcare And Safety, Production And Execution It is also available for immediate download and adjustment. So, changes can be made in the color, design, graphics or any other component to create a unique layout. This slide showcases the checklist to audit effective visual management activities which helps an organization for continuous improvement of the business. It includes details such as marketing and signs, healthcare and safety, maintenance and work standards, inventory control, etc.
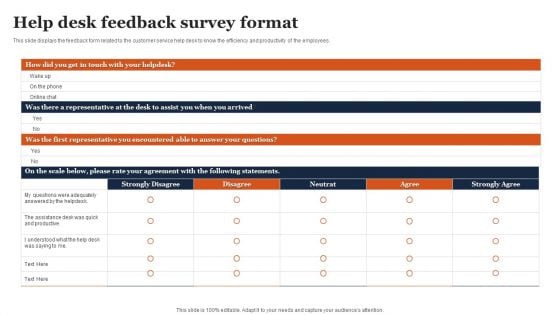
Help Desk Feedback Survey Format Ppt Visual Aids Summary PDF
This slide displays the feedback form related to the customer service help desk to know the efficiency and productivity of the employees. Pitch your topic with ease and precision using this Help Desk Feedback Survey Format Ppt Visual Aids Summary PDF. This layout presents information on Strongly Disagree, Disagree, Neutrat. It is also available for immediate download and adjustment. So, changes can be made in the color, design, graphics or any other component to create a unique layout.
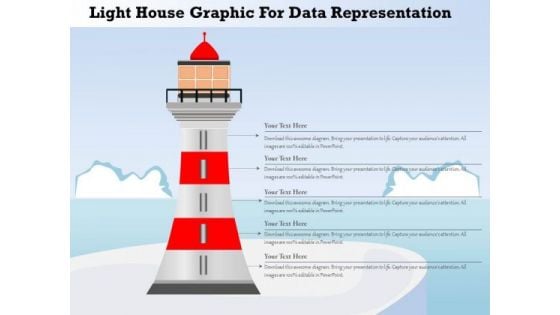
Busines Diagram Light House Graphic For Data Representation Presentation Template
Use this diagram for visual communication. Present your opinions with our impressive diagram. This image contains light house graphics. This diagram slide makes your presentations more interactive.
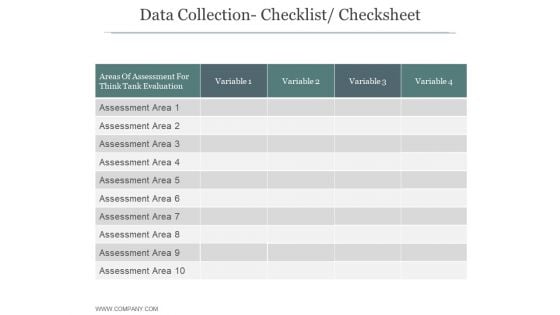
Data Collection Checklist Checksheet Ppt PowerPoint Presentation Styles
This is a data collection checklist checksheet ppt powerpoint presentation styles. This is a ten stage process. The stages in this process are areas of assessment for think tank evaluation, business, strategy, marketing.
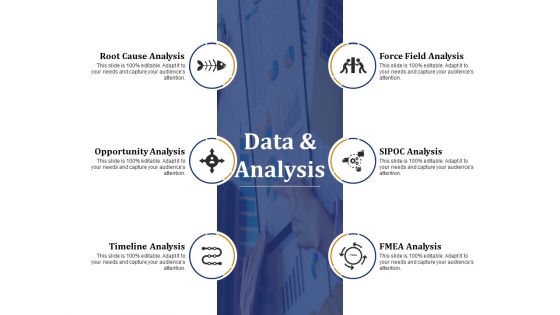
Data And Analysis Ppt PowerPoint Presentation Portfolio Layouts
This is a data and analysis ppt powerpoint presentation portfolio layouts. This is a six stage process. The stages in this process are root cause analysis, opportunity analysis, timeline analysis, force field analysis, fmea analysis.
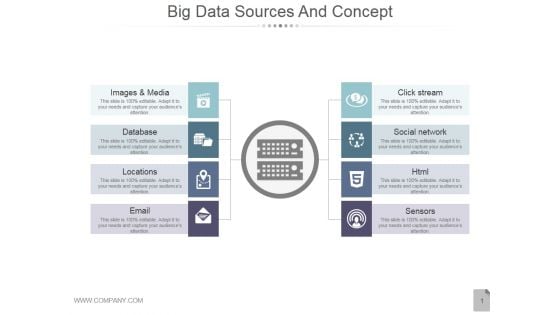
Big Data Sources And Concept Ppt PowerPoint Presentation Ideas
This is a big data sources and concept ppt powerpoint presentation ideas. This is a eight stage process. The stages in this process are images and media, database, locations, email, sensors.

Table Of Contents ITIL Implementation Ppt Summary Visual Aids PDF
Get a simple yet stunning designed Table Of Contents ITIL Implementation Ppt Summary Visual Aids PDF. It is the best one to establish the tone in your meetings. It is an excellent way to make your presentations highly effective. So, download this PPT today from Slidegeeks and see the positive impacts. Our easy-to-edit Table Of Contents ITIL Implementation Ppt Summary Visual Aids PDF can be your go-to option for all upcoming conferences and meetings. So, what are you waiting for Grab this template today.
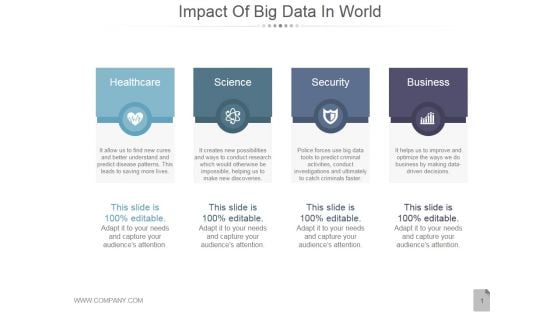
Impact Of Big Data In World Ppt PowerPoint Presentation Inspiration
This is a impact of big data in world ppt powerpoint presentation inspiration. This is a four stage process. The stages in this process are healthcare, science, security, business.
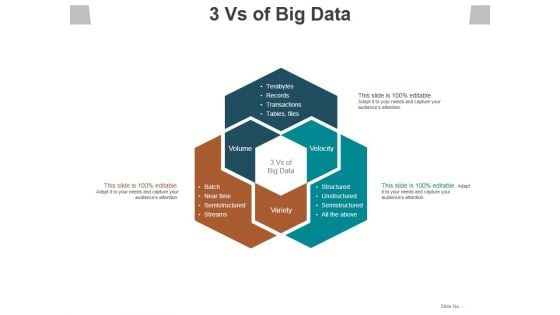
3 Vs Of Big Data Ppt PowerPoint Presentation Slides Samples
This is a 3 vs of big data ppt powerpoint presentation slides samples. This is a three stage process. The stages in this process are volume, variety, velocity, terabytes, transactions.
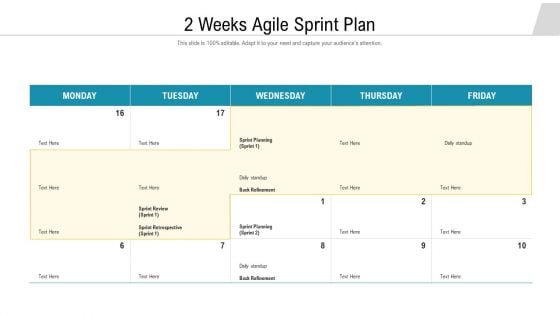
2 Weeks Agile Sprint Plan Ppt Inspiration Visual Aids PDF
Showcasing this set of slides titled 2 weeks agile sprint plan ppt inspiration visual aids pdf. The topics addressed in these templates are 2 weeks agile sprint plan. All the content presented in this PPT design is completely editable. Download it and make adjustments in color, background, font etc. as per your unique business setting.
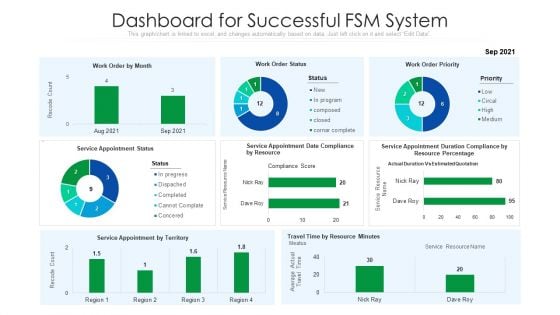
Dashboard For Successful FSM System Ppt Visual Aids Infographics PDF
Showcasing this set of slides titled dashboard for successful fsm system ppt visual aids infographics pdf. The topics addressed in these templates are resource percentage, duration compliance, priority. All the content presented in this PPT design is completely editable. Download it and make adjustments in color, background, font etc. as per your unique business setting.
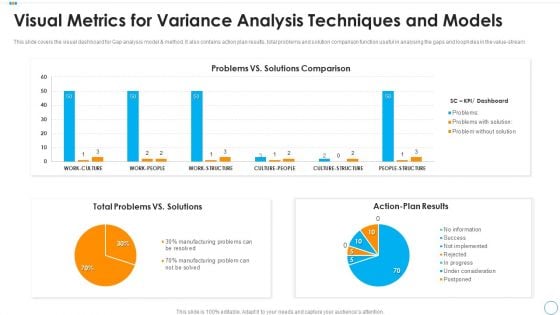
Visual Metrics For Variance Analysis Techniques And Models Mockup PDF
This slide covers the visual dashboard for Gap analysis model and method. It also contains action plan results, total problems and solution comparison function useful in analysing the gaps and loopholes in the value stream. Showcasing this set of slides titled visual metrics for variance analysis techniques and models mockup pdf. The topics addressed in these templates are total problems vs solutions, action plan results, problems vs solutions comparison. All the content presented in this PPT design is completely editable. Download it and make adjustments in color, background, font etc. as per your unique business setting.
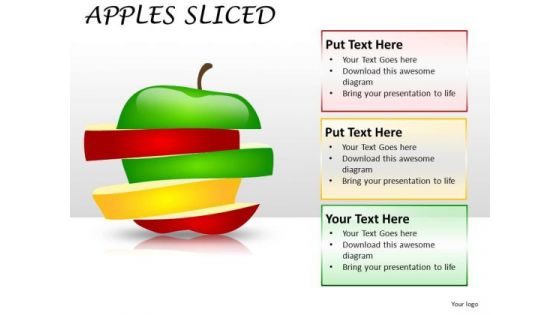
Company Merger Visual Apples PowerPoint Slides And Ppt Diagram Templates
Company Merger Visual Apples PowerPoint Slides And PPT Diagram Templates-These high quality powerpoint pre-designed slides and powerpoint templates have been carefully created by our professional team to help you impress your audience. All slides have been created and are 100% editable in powerpoint. Each and every property of any graphic - color, size, orientation, shading, outline etc. can be modified to help you build an effective powerpoint presentation. Any text can be entered at any point in the powerpoint template or slide. Simply DOWNLOAD, TYPE and PRESENT! Measure your team's success with our Company Merger Visual Apples PowerPoint Slides And Ppt Diagram Templates. You will be at the top of your game.
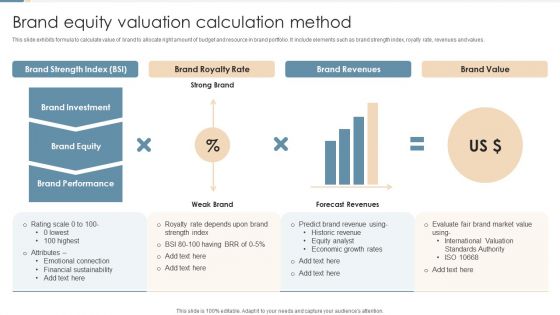
Brand Equity Valuation Calculation Method Ppt Visual Aids PDF
This slide exhibits formula to calculate value of brand to allocate right amount of budget and resource in brand portfolio. It include elements such as brand strength index, royalty rate, revenues and values. Showcasing this set of slides titled Brand Equity Valuation Calculation Method Ppt Visual Aids PDF. The topics addressed in these templates are Brand Strength Index, Brand Royalty Rate, Brand Revenues. All the content presented in this PPT design is completely editable. Download it and make adjustments in color, background, font etc. as per your unique business setting.
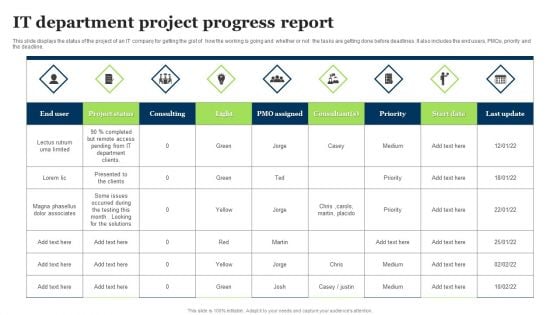
IT Department Project Progress Report Ppt Summary Visual Aids PDF
This slide displays the status of the project of an IT company for getting the gist of how the working is going and whether or not the tasks are getting done before deadlines. It also includes the end users, PMOs, priority and the deadline. Showcasing this set of slides titled IT Department Project Progress Report Ppt Summary Visual Aids PDF. The topics addressed in these templates are Project Status, PMO Assigned, Priority. All the content presented in this PPT design is completely editable. Download it and make adjustments in color, background, font etc. as per your unique business setting.
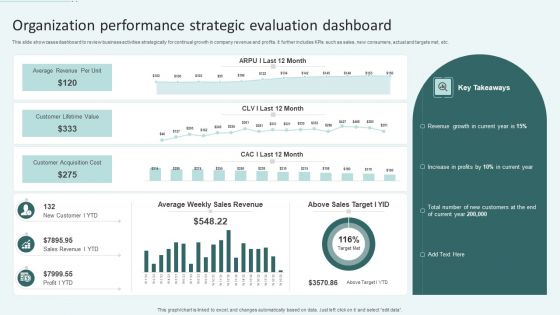
Organization Performance Strategic Evaluation Dashboard Ppt Slides Visual Aids PDF
This slide showcases dashboard to review business activities strategically for continual growth in company revenue and profits. It further includes KPIs such as sales, new consumers, actual and targets met, etc. Showcasing this set of slides titled Organization Performance Strategic Evaluation Dashboard Ppt Slides Visual Aids PDF. The topics addressed in these templates are Average Revenue Per Unit, Customer Lifetime Value, Customer Acquisition Cost. All the content presented in this PPT design is completely editable. Download it and make adjustments in color, background, font etc. as per your unique business setting.
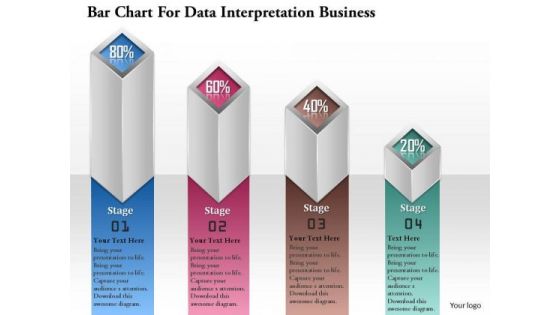
Consulting Slides Bar Chart For Data Interpretation Business Presentation
This pre-designed and appealing bar chart for PowerPoint offer an optimized possibility to illustrate your business strategy. You can use this diagram for data interpretation. This diagram is editable and can be easily adjusted.
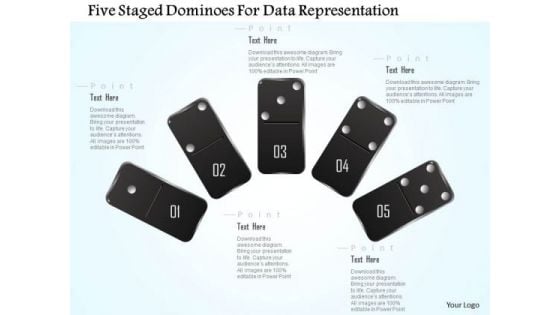
Busines Diagram Five Staged Dominoes For Data Representation Presentation Template
This business diagram displays graphics of five staged dominoes. Use this slide to represent your data in visual manner. This slide offers an excellent background to build professional presentations.
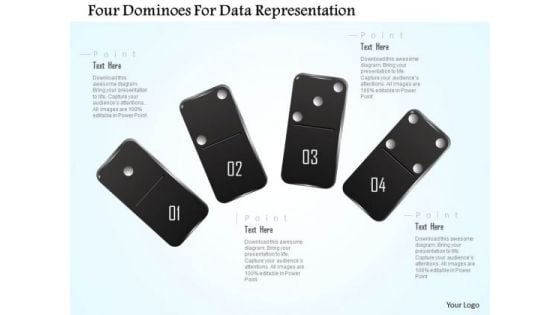
Busines Diagram Four Dominoes For Data Representation Presentation Template
This business diagram displays graphics of four staged dominoes. Use this slide to represent your data in visual manner. This slide offers an excellent background to build professional presentations.
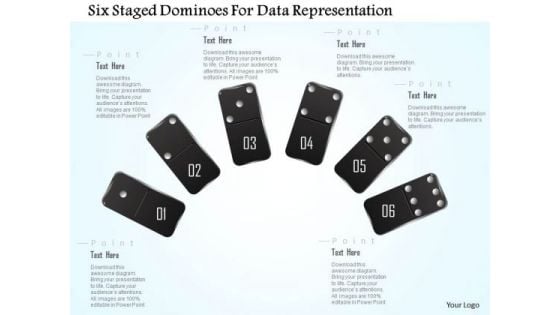
Busines Diagram Six Staged Dominoes For Data Representation Presentation Template
This business diagram displays graphics of six staged dominoes. Use this slide to represent your data in visual manner. This slide offers an excellent background to build professional presentations.

Facts About Big Data In Marketing Ppt PowerPoint Presentation Clipart
This is a facts about big data in marketing ppt powerpoint presentation clipart. This is a eight stage process. The stages in this process are arrow, process, business, marketing, success.
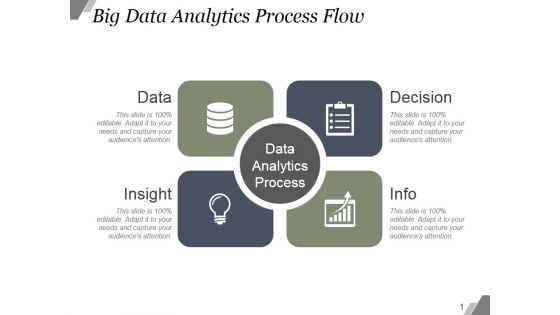
Big Data Analytics Process Flow Ppt PowerPoint Presentation Diagrams
This is a big data analytics process flow ppt powerpoint presentation diagrams. This is a four stage process. The stages in this process are data, decision, insight, info.
Icons Slide For Tokenization Strategies For Data Security PPT Presentation
Introducing our well designed Icons Slide For Tokenization Strategies For Data Security PPT Presentation set of slides. The slide displays editable icons to enhance your visual presentation. The icons can be edited easily. So customize according to your business to achieve a creative edge. Download and share it with your audience. Our Icons Slide For Tokenization Strategies For Data Security PPT Presentation are topically designed to provide an attractive backdrop to any subject. Use them to look like a presentation pro.
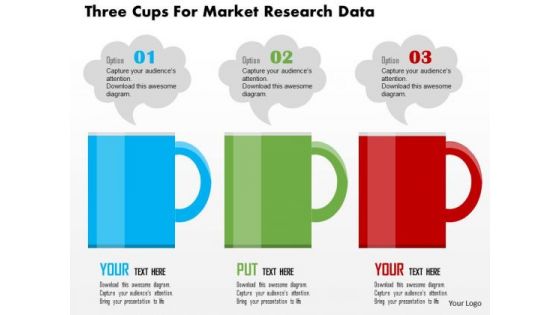
Business Diagram Three Cups For Market Research Data Presentation Template
This business diagram has been designed with graphic of three cups. This diagram can be used to display information in visual manner. Use this diagram in your presentations to get good remarks from your viewers.
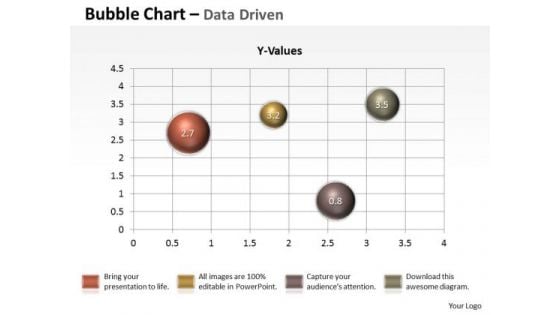
Data Analysis Techniques 3d Graphical Presentation Of PowerPoint Templates
Our data analysis techniques 3d graphical presentation of Powerpoint Templates Will Follow The Drill. They Accomplish The Task Assigned To Them.

Data Management Analysis Ppt PowerPoint Presentation Complete Deck With Slides
This is a data management analysis ppt powerpoint presentation complete deck with slides. This is a one stage process. The stages in this process are business, data analysis, management, marketing, strategy.
Overview Of Data Science Methods Ppt PowerPoint Presentation Gallery Icon
This is a overview of data science methods ppt powerpoint presentation gallery icon. This is a four stage process. The stages in this process are data analysis, data review, data evaluation.
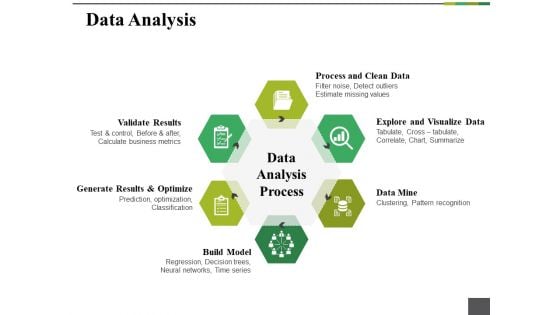
Data Analysis Ppt PowerPoint Presentation Outline Example Topics
This is a data analysis ppt powerpoint presentation outline example topics. This is a six stage process. The stages in this process are data mine, build model, validate results, process and clean data, data analysis process.
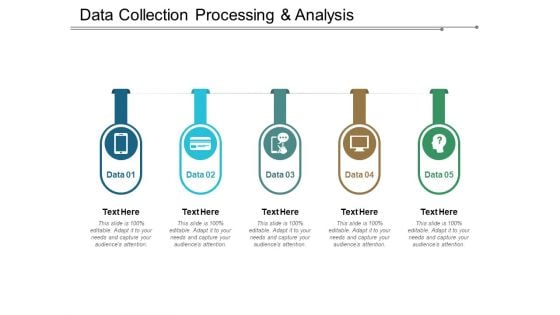
Data Collection Processing And Analysis Ppt PowerPoint Presentation Pictures Infographics
This is a data collection processing and analysis ppt powerpoint presentation pictures infographics. This is a five stage process. The stages in this process are data flow, data management, big data.
Data Engineering Vector Icons Ppt PowerPoint Presentation Model Graphic Images
This is a data engineering vector icons ppt powerpoint presentation model graphic images. This is a three stage process. The stages in this process are data, analysis, data science, information science.
Data Mining Vector Icon Ppt PowerPoint Presentation Images
This is a data mining vector icon ppt powerpoint presentation images. This is a one stage process. The stages in this process are data, analysis, data science, information science.
Data Storage Management Icon Ppt PowerPoint Presentation Ideas Files
This is a data storage management icon ppt powerpoint presentation ideas files. This is a four stage process. The stages in this process are data, analysis, data science, information science.
Data Interpretation Percentage Analysis Ppt Powerpoint Presentation Summary Icon
This is a data interpretation percentage analysis ppt powerpoint presentation summary icon. This is a six stage process. The stages in this process are data presentation, content presentation, information presentation.
Marketing Data Analytics Ppt PowerPoint Presentation Icon Master Slide Cpb
This is a marketing data analytics ppt powerpoint presentation icon master slide cpb. This is a three stage process. The stages in this process are marketing data analytics.

Data Storage Server Networking Ppt Powerpoint Presentation Summary Background
This is a data storage server networking ppt powerpoint presentation summary background. This is a three stage process. The stages in this process are data management, data centre, storage system.
Data Storage Backup And Networking Ppt Powerpoint Presentation Icon Ideas
This is a data storage backup and networking ppt powerpoint presentation icon ideas. This is a five stage process. The stages in this process are data management, data centre, storage system.
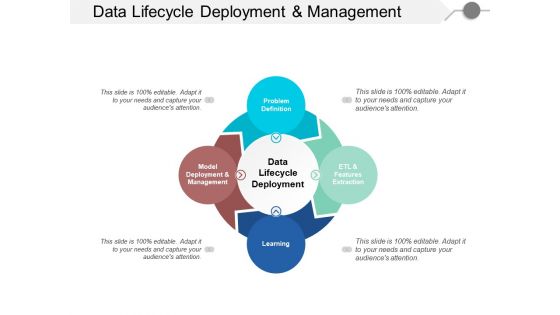
Data Lifecycle Deployment And Management Ppt PowerPoint Presentation File Formats
This is a data lifecycle deployment and management ppt powerpoint presentation file formats. This is a four stage process. The stages in this process are data, analysis, data science, information science.
Data Analysis Vector Icons Ppt Powerpoint Presentation Layouts Gridlines
This is a data analysis vector icons ppt powerpoint presentation layouts gridlines. This is a two stage process. The stages in this process are data presentation, content presentation, information presentation.
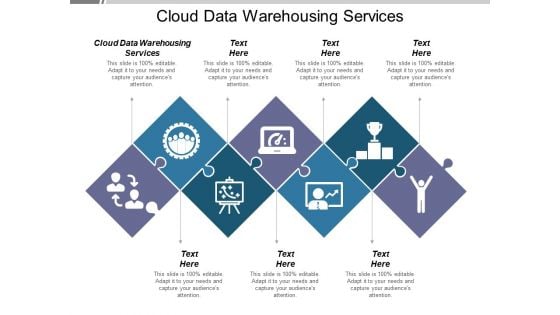
Cloud Data Warehousing Services Ppt PowerPoint Presentation Portfolio Layouts
This is a cloud data warehousing services ppt powerpoint presentation portfolio layouts. This is a seven stage process. The stages in this process are cloud data warehousing services.
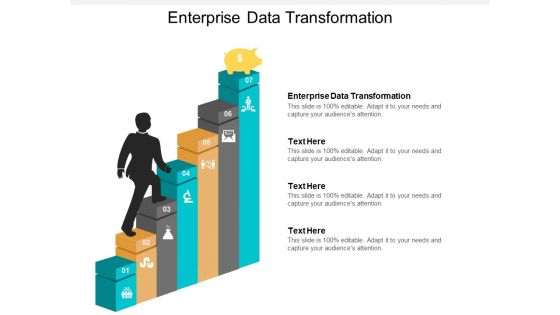
Enterprise Data Transformation Ppt PowerPoint Presentation Outline Example File Cpb
This is a enterprise data transformation ppt powerpoint presentation outline example file cpb. This is a seven stage process. The stages in this process are enterprise data transformation.
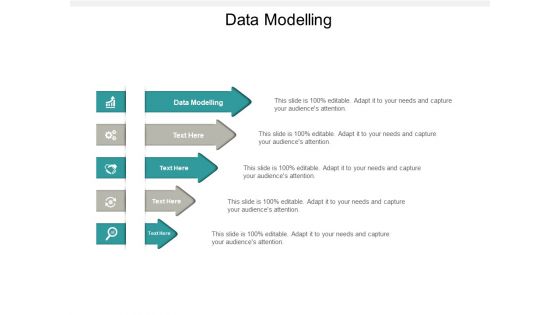
Data Modelling Ppt PowerPoint Presentation Portfolio Slide Cpb
This is a data modelling ppt powerpoint presentation portfolio slide cpb. This is a five stage process. The stages in this process are data modelling.


 Continue with Email

 Home
Home


