Data Visualization Presentation
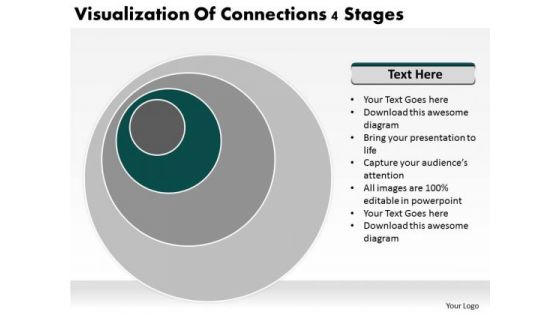
Visualization Of Connections 4 Stages Business Plan PowerPoint Slides
We present our visualization of connections 4 stages business plan PowerPoint Slides.Use our Circle Charts PowerPoint Templates because It will mark the footprints of your journey. Illustrate how they will lead you to your desired destination. Download our Process and Flows PowerPoint Templates because You should Bet on your luck with our PowerPoint Templates and Slides. Be assured that you will hit the jackpot. Use our Business PowerPoint Templates because Our PowerPoint Templates and Slides will definately Enhance the stature of your presentation. Adorn the beauty of your thoughts with their colourful backgrounds. Use our Shapes PowerPoint Templates because Our PowerPoint Templates and Slides will let you Hit the right notes. Watch your audience start singing to your tune. Present our Spheres PowerPoint Templates because You have a driving passion to excel in your field. Our PowerPoint Templates and Slides will prove ideal vehicles for your ideas.Use these PowerPoint slides for presentations relating to Background, design, circular, vector, abstract, abstraction, graphic, art, concept, style, surface, wallpaper, techno, vibrant, perspective, dimension, digital art, urban, rippling, clip art, circle, rippled, digital illustration, digital, glow, technology, idea, trend, modern, illustration, dimensional, futuristic, backdrop, high-tech, coordinate, ripple, stylish, clip-art, artistic, illuminate. The prominent colors used in the PowerPoint template are Green dark , Gray, White. Bash on ahead with bold conviction. Have no fear with our Visualization Of Connections 4 Stages Business Plan PowerPoint Slides.
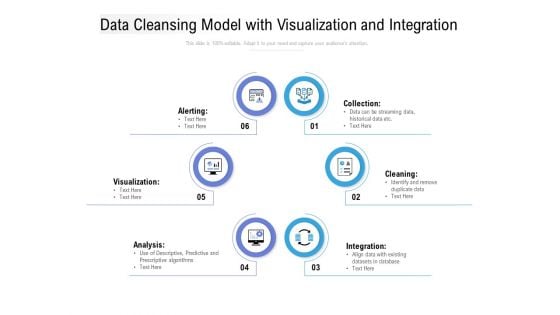
Data Cleansing Model With Visualization And Integration Ppt Slides Guidelines PDF
Presenting this set of slides with name data cleansing model with visualization and integration ppt slides guidelines pdf. This is a six stage process. The stages in this process are collection, cleaning, integration, analysis, visualization, alerting. This is a completely editable PowerPoint presentation and is available for immediate download. Download now and impress your audience.
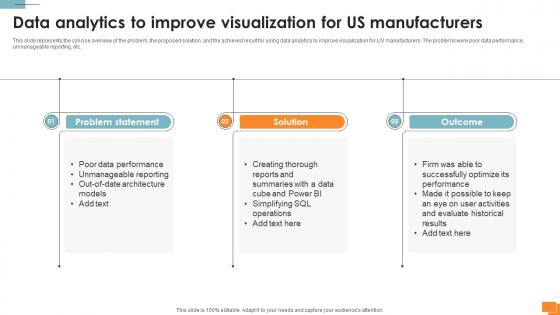
Statistical Tools For Evidence Data Analytics To Improve Visualization For Us Manufacturers
This slide represents the concise overview of the problem, the proposed solution, and the achieved result for using data analytics to improve visualization for US manufacturers. The problems were poor data performance, unmanageable reporting, etc. Crafting an eye-catching presentation has never been more straightforward. Let your presentation shine with this tasteful yet straightforward Statistical Tools For Evidence Data Analytics To Improve Visualization For Us Manufacturers template. It offers a minimalistic and classy look that is great for making a statement. The colors have been employed intelligently to add a bit of playfulness while still remaining professional. Construct the ideal Statistical Tools For Evidence Data Analytics To Improve Visualization For Us Manufacturers that effortlessly grabs the attention of your audience Begin now and be certain to wow your customers This slide represents the concise overview of the problem, the proposed solution, and the achieved result for using data analytics to improve visualization for US manufacturers. The problems were poor data performance, unmanageable reporting, etc.
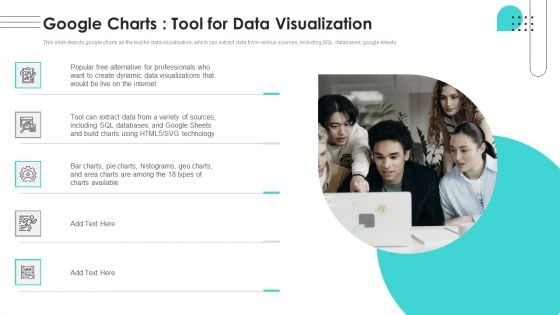
Branches For Visualization Research And Development Google Charts Tool For Data Elements PDF
This slide depicts google charts as the tool for data visualization, which can extract data from various sources, including SQL, databases, google sheets. Do you have an important presentation coming up Are you looking for something that will make your presentation stand out from the rest Look no further than Branches For Visualization Research And Development Google Charts Tool For Data Elements PDF. With our professional designs, you can trust that your presentation will pop and make delivering it a smooth process. And with Slidegeeks, you can trust that your presentation will be unique and memorable. So why wait Grab Branches For Visualization Research And Development Google Charts Tool For Data Elements PDF today and make your presentation stand out from the rest.
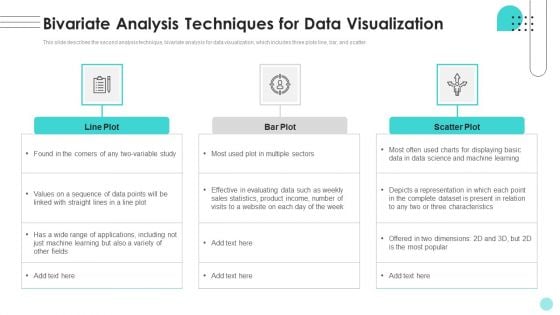
Branches For Visualization Research And Development Bivariate Analysis Techniques For Data Structure PDF
This slide describes the second analysis technique, bivariate analysis for data visualization, which includes three plots line, bar, and scatter. There are so many reasons you need a Branches For Visualization Research And Development Bivariate Analysis Techniques For Data Structure PDF. The first reason is you cant spend time making everything from scratch, Thus, Slidegeeks has made presentation templates for you too. You can easily download these templates from our website easily.
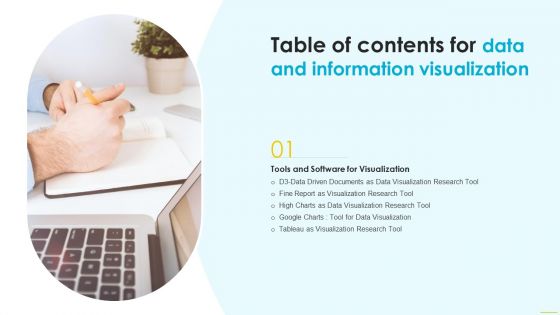
Table Of Contents For Data And Information Visualization Tool Structure PDF
Whether you have daily or monthly meetings, a brilliant presentation is necessary. Table Of Contents For Data And Information Visualization Tool Structure PDF can be your best option for delivering a presentation. Represent everything in detail using Table Of Contents For Data And Information Visualization Tool Structure PDF and make yourself stand out in meetings. The template is versatile and follows a structure that will cater to your requirements. All the templates prepared by Slidegeeks are easy to download and edit. Our research experts have taken care of the corporate themes as well. So, give it a try and see the results.
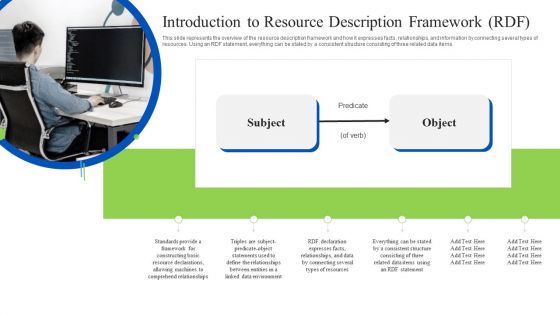
Linked Data Visualization Introduction To Resource Description Framework RDF Clipart PDF
This slide represents the overview of the resource description framework and how it expresses facts, relationships, and information by connecting several types of resources. Using an RDF statement, everything can be stated by a consistent structure consisting of three related data items. Do you have an important presentation coming up Are you looking for something that will make your presentation stand out from the rest Look no further than Linked Data Visualization Introduction To Resource Description Framework RDF Clipart PDF. With our professional designs, you can trust that your presentation will pop and make delivering it a smooth process. And with Slidegeeks, you can trust that your presentation will be unique and memorable. So why wait Grab Linked Data Visualization Introduction To Resource Description Framework RDF Clipart PDF today and make your presentation stand out from the rest.
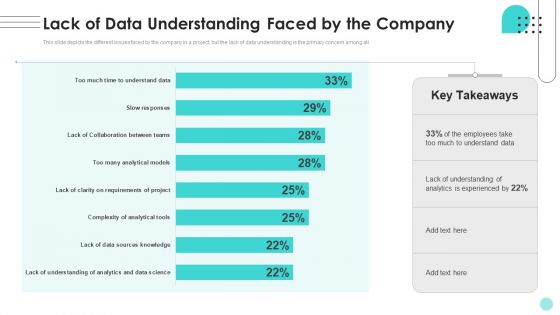
Branches For Visualization Research And Development Lack Of Data Understanding Faced Introduction PDF
This slide depicts the different issues faced by the company in a project, but the lack of data understanding is the primary concern among all. If you are looking for a format to display your unique thoughts, then the professionally designed Branches For Visualization Research And Development Lack Of Data Understanding Faced Introduction PDF is the one for you. You can use it as a Google Slides template or a PowerPoint template. Incorporate impressive visuals, symbols, images, and other charts. Modify or reorganize the text boxes as you desire. Experiment with shade schemes and font pairings. Alter, share or cooperate with other people on your work. Download Branches For Visualization Research And Development Lack Of Data Understanding Faced Introduction PDF and find out how to give a successful presentation. Present a perfect display to your team and make your presentation unforgettable.
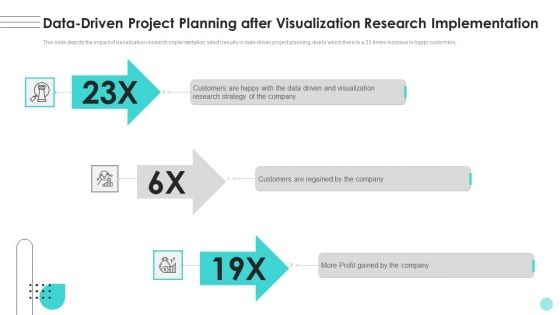
Branches For Visualization Research And Development Data Driven Project Planning Template PDF
This slide depicts the impact of visualization research implementation, which results in data-driven project planning, due to which there is a 23 times increase in happy customers. Get a simple yet stunning designed Branches For Visualization Research And Development Data Driven Project Planning Template PDF. It is the best one to establish the tone in your meetings. It is an excellent way to make your presentations highly effective. So, download this PPT today from Slidegeeks and see the positive impacts. Our easy-to-edit Branches For Visualization Research And Development Data Driven Project Planning Template PDF can be your go-to option for all upcoming conferences and meetings. So, what are you waiting for Grab this template today.
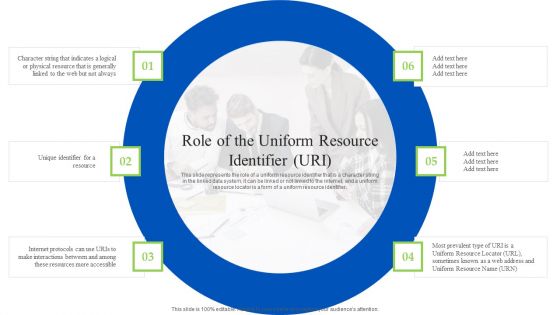
Linked Data Visualization Role Of The Uniform Resource Identifier URI Slides PDF
This slide represents the role of a uniform resource identifier that is a character string in the linked data system, it can be linked or not linked to the internet, and a uniform resource locator is a form of a uniform resource identifier. Are you in need of a template that can accommodate all of your creative concepts This one is crafted professionally and can be altered to fit any style. Use it with Google Slides or PowerPoint. Include striking photographs, symbols, depictions, and other visuals. Fill, move around, or remove text boxes as desired. Test out color palettes and font mixtures. Edit and save your work, or work with colleagues. Download Linked Data Visualization Role Of The Uniform Resource Identifier URI Slides PDF and observe how to make your presentation outstanding. Give an impeccable presentation to your group and make your presentation unforgettable.
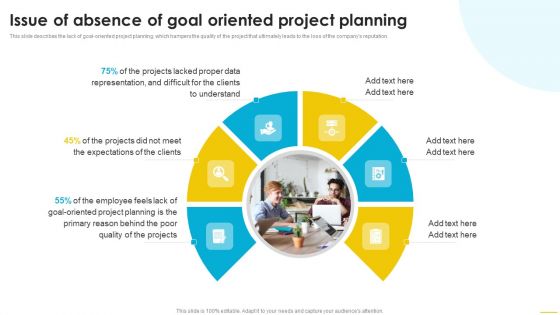
Data And Information Visualization Issue Of Absence Of Goal Oriented Project Planning Demonstration PDF
This slide describes the lack of goal oriented project planning, which hampers the quality of the project that ultimately leads to the loss of the companys reputation. Boost your pitch with our creative Data And Information Visualization Issue Of Absence Of Goal Oriented Project Planning Demonstration PDF. Deliver an awe inspiring pitch that will mesmerize everyone. Using these presentation templates you will surely catch everyones attention. You can browse the ppts collection on our website. We have researchers who are experts at creating the right content for the templates. So you do not have to invest time in any additional work. Just grab the template now and use them.
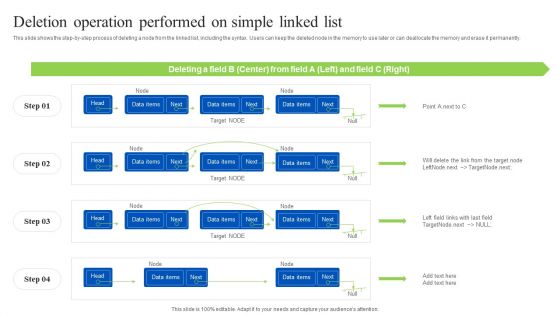
Linked Data Visualization Deletion Operation Performed On Simple Linked List Microsoft PDF
This slide shows the step-by-step process of deleting a node from the linked list, including the syntax. Users can keep the deleted node in the memory to use later or can deallocate the memory and erase it permanently. Get a simple yet stunning designed Linked Data Visualization Deletion Operation Performed On Simple Linked List Microsoft PDF. It is the best one to establish the tone in your meetings. It is an excellent way to make your presentations highly effective. So, download this PPT today from Slidegeeks and see the positive impacts. Our easy-to-edit Linked Data Visualization Deletion Operation Performed On Simple Linked List Microsoft PDF can be your go-to option for all upcoming conferences and meetings. So, what are you waiting for Grab this template today.
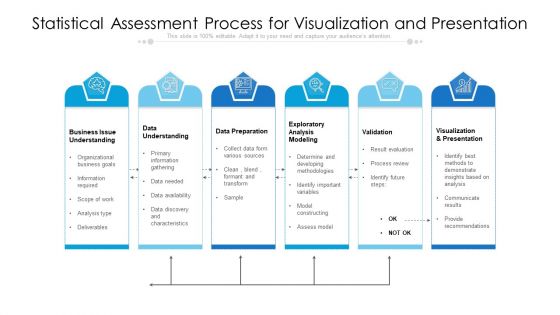
Statistical Assessment Process For Visualization And Presentation Ppt Styles Graphics Example PDF
Showcasing this set of slides titled statistical assessment process for visualization and presentation ppt styles graphics example pdf. The topics addressed in these templates are data understanding, data preparation, validation, visualization, presentation. All the content presented in this PPT design is completely editable. Download it and make adjustments in color, background, font etc. as per your unique business setting.
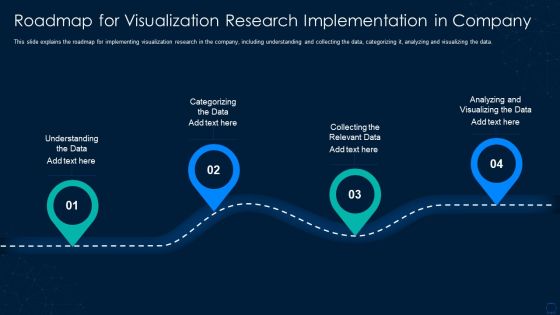
Graphical Representation Of Research IT Roadmap For Visualization Research Summary PDF
This slide explains the roadmap for implementing visualization research in the company, including understanding and collecting the data, categorizing it, analyzing and visualizing the data. Presenting graphical representation of research it roadmap for visualization research summary pdf to provide visual cues and insights. Share and navigate important information on four stages that need your due attention. This template can be used to pitch topics like roadmap for visualization research implementation in company. In addtion, this PPT design contains high resolution images, graphics, etc, that are easily editable and available for immediate download.
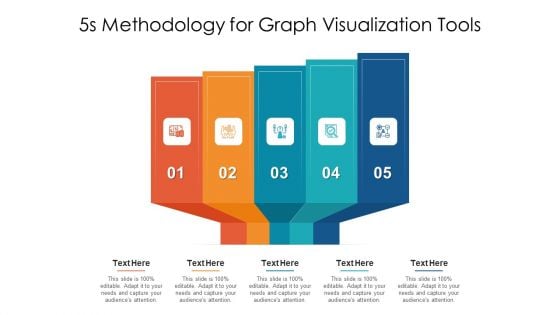
5S Methodology Slide For Graph Visualization Tools Ppt PowerPoint Presentation Summary Graphics Template PDF
Presenting 5s methodology slide for graph visualization tools ppt powerpoint presentation summary graphics template pdf to dispense important information. This template comprises five stages. It also presents valuable insights into the topics including 5s methodology for graph visualization tools. This is a completely customizable PowerPoint theme that can be put to use immediately. So, download it and address the topic impactfully.
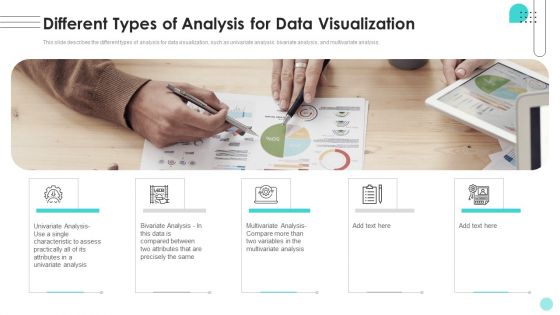
Branches For Visualization Research And Development Different Types Of Analysis Clipart PDF
This slide describes the different types of analysis for data visualization, such as univariate analysis, bivariate analysis, and multivariate analysis. Present like a pro with Branches For Visualization Research And Development Different Types Of Analysis Clipart PDF Create beautiful presentations together with your team, using our easy-to-use presentation slides. Share your ideas in real-time and make changes on the fly by downloading our templates. So whether youre in the office, on the go, or in a remote location, you can stay in sync with your team and present your ideas with confidence. With Slidegeeks presentation got a whole lot easier. Grab these presentations today.

Branches For Visualization Research And Development Univariate Analysis Techniques Download PDF
This slide depicts the univariate analysis technique for data visualization, including distribution, box and whisker, and the violin plot. This Branches For Visualization Research And Development Univariate Analysis Techniques Download PDF is perfect for any presentation, be it in front of clients or colleagues. It is a versatile and stylish solution for organizing your meetings. The Branches For Visualization Research And Development Univariate Analysis Techniques Download PDF features a modern design for your presentation meetings. The adjustable and customizable slides provide unlimited possibilities for acing up your presentation. Slidegeeks has done all the homework before launching the product for you. So, dont wait, grab the presentation templates today.
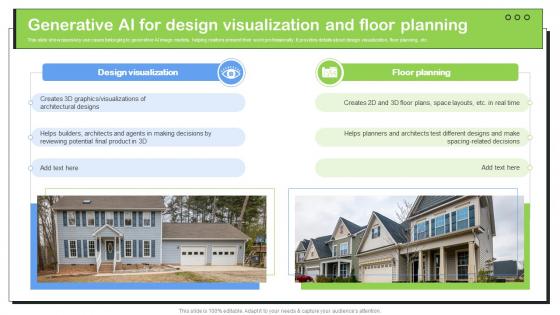
Transforming Real Estate Generative AI For Design Visualization And Floor ChatGPT SS V
This slide showcases key use cases belonging to generative AI image models, helping realtors present their work professionally. It provides details about design visualization, floor planning, etc. This Transforming Real Estate Generative AI For Design Visualization And Floor ChatGPT SS V is perfect for any presentation, be it in front of clients or colleagues. It is a versatile and stylish solution for organizing your meetings. The Transforming Real Estate Generative AI For Design Visualization And Floor ChatGPT SS V features a modern design for your presentation meetings. The adjustable and customizable slides provide unlimited possibilities for acing up your presentation. Slidegeeks has done all the homework before launching the product for you. So, do not wait, grab the presentation templates today This slide showcases key use cases belonging to generative AI image models, helping realtors present their work professionally. It provides details about design visualization, floor planning, etc.
Graphical Representation Of Research IT Information Visualization Research Branch Icons PDF
This slide explains information visualization as a branch of visualization research that includes visuals like histograms, trend graphs, flow charts. Presenting graphical representation of research it information visualization research branch icons pdf to provide visual cues and insights. Share and navigate important information on four stages that need your due attention. This template can be used to pitch topics like geographic, information, design. In addtion, this PPT design contains high resolution images, graphics, etc, that are easily editable and available for immediate download.
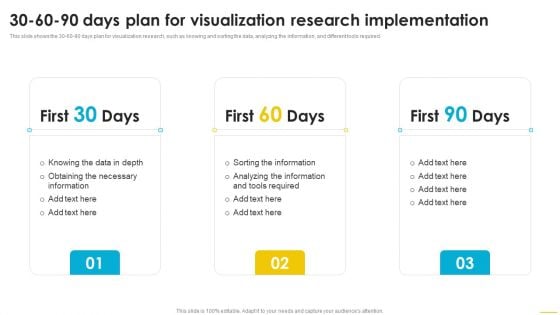
30 60 90 Days Plan For Visualization Research Implementation Themes PDF
This slide shows the 30 60 90 days plan for visualization research, such as knowing and sorting the data, analyzing the information, and different tools required. If you are looking for a format to display your unique thoughts, then the professionally designed 30 60 90 Days Plan For Visualization Research Implementation Themes PDF is the one for you. You can use it as a Google Slides template or a PowerPoint template. Incorporate impressive visuals, symbols, images, and other charts. Modify or reorganize the text boxes as you desire. Experiment with shade schemes and font pairings. Alter, share or cooperate with other people on your work. Download 30 60 90 Days Plan For Visualization Research Implementation Themes PDF and find out how to give a successful presentation. Present a perfect display to your team and make your presentation unforgettable.
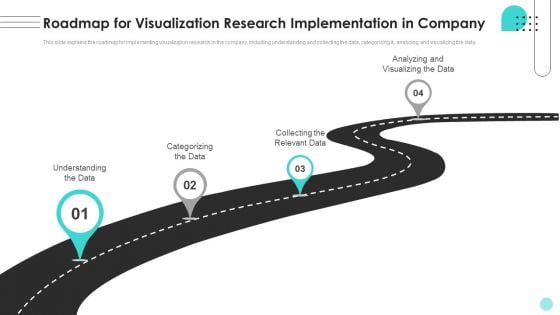
Roadmap For Visualization Research Implementation In Company Ppt Inspiration Summary PDF
This slide explains the roadmap for implementing visualization research in the company, including understanding and collecting the data, categorizing it, analyzing and visualizing the data. This Roadmap For Visualization Research Implementation In Company Ppt Inspiration Summary PDF from Slidegeeks makes it easy to present information on your topic with precision. It provides customization options, so you can make changes to the colors, design, graphics, or any other component to create a unique layout. It is also available for immediate download, so you can begin using it right away. Slidegeeks has done good research to ensure that you have everything you need to make your presentation stand out. Make a name out there for a brilliant performance.
Visualization Of Merged Real And Virtual Environment Technology Icon Inspiration PDF
Showcasing this set of slides titled Visualization Of Merged Real And Virtual Environment Technology Icon Inspiration PDF. The topics addressed in these templates are Visualization Merged Real, Virtual Environment, Technology Icon. All the content presented in this PPT design is completely editable. Download it and make adjustments in color, background, font etc. as per your unique business setting.
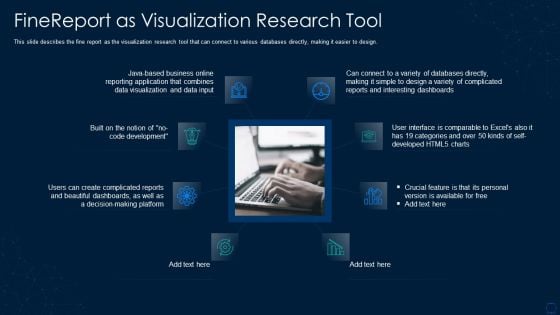
Graphical Representation Of Research IT Finereport As Visualization Research Tool Structure PDF
This slide describes the fine report as the visualization research tool that can connect to various databases directly, making it easier to design. Presenting graphical representation of research it finereport as visualization research tool structure pdf to provide visual cues and insights. Share and navigate important information on eight stages that need your due attention. This template can be used to pitch topics like application, dashboards, databases. In addtion, this PPT design contains high resolution images, graphics, etc, that are easily editable and available for immediate download.
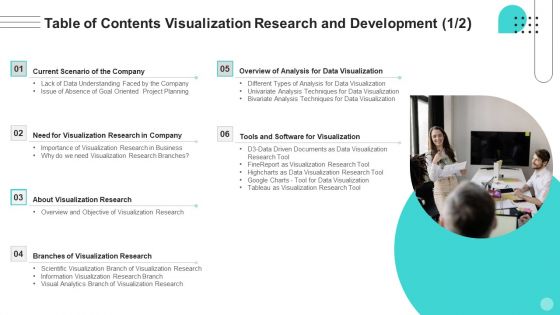
Table Of Contents Visualization Research And Development Ppt Infographic Template Rules PDF
Do you know about Slidesgeeks Table Of Contents Visualization Research And Development Ppt Infographic Template Rules PDFThese are perfect for delivering any kind od presentation. Using it, create PowerPoint presentations that communicate your ideas and engage audiences. Save time and effort by using our pre-designed presentation templates that are perfect for a wide range of topic. Our vast selection of designs covers a range of styles, from creative to business, and are all highly customizable and easy to edit. Download as a PowerPoint template or use them as Google Slides themes.
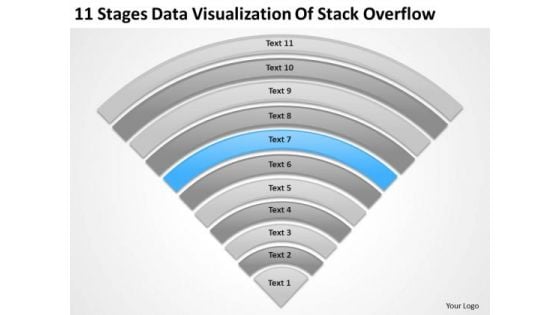
Visualization Of Stack Overflow Executive Summary Example Business Plan PowerPoint Slides
We present our visualization of stack overflow executive summary example business plan PowerPoint Slides.Present our Advertising PowerPoint Templates because You can Be the puppeteer with our PowerPoint Templates and Slides as your strings. Lead your team through the steps of your script. Use our Competition PowerPoint Templates because It can Bubble and burst with your ideas. Present our Business PowerPoint Templates because Your success is our commitment. Our PowerPoint Templates and Slides will ensure you reach your goal. Download our Shapes PowerPoint Templates because Our PowerPoint Templates and Slides will help you be quick off the draw. Just enter your specific text and see your points hit home. Download and present our Targets PowerPoint Templates because You can Double your output with our PowerPoint Templates and Slides. They make beating deadlines a piece of cake.Use these PowerPoint slides for presentations relating to Legal, pressure, heap, documents, file, messy, copy, bureaucracy, order, business, problems, chaos, stack, pile, occupation, finance, data, cardboard, supply, report, vertical, folders, tall, paperwork, stacking, up, overflowing, high, excess, group, objects, paper, over-sized, organization, archive, working, angle, space, drudgery, organized, office, large, ideas, 3d. The prominent colors used in the PowerPoint template are Blue, Gray, White. Serve presentations with our Visualization Of Stack Overflow Executive Summary Example Business Plan PowerPoint Slides. Download without worries with our money back guaranteee.
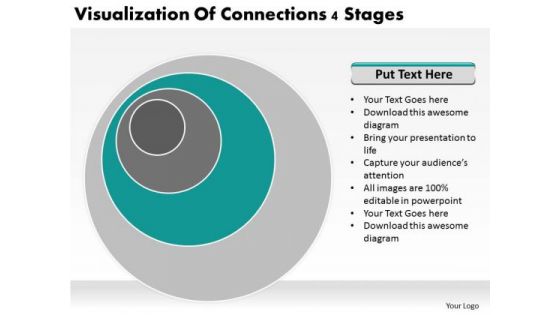
Visualization Of Connections 4 Stages Ppt It Business Plan PowerPoint Templates
We present our visualization of connections 4 stages ppt it business plan PowerPoint templates.Download our Circle Charts PowerPoint Templates because You are well armed with penetrative ideas. Our PowerPoint Templates and Slides will provide the gunpowder you need. Download our Process and Flows PowerPoint Templates because Our PowerPoint Templates and Slides are like the strings of a tennis racquet. Well strung to help you serve aces. Download and present our Business PowerPoint Templates because Our PowerPoint Templates and Slides will weave a web of your great ideas. They are gauranteed to attract even the most critical of your colleagues. Download and present our Shapes PowerPoint Templates because You can Inspire your team with our PowerPoint Templates and Slides. Let the force of your ideas flow into their minds. Present our Spheres PowerPoint Templates because Our PowerPoint Templates and Slides will bullet point your ideas. See them fall into place one by one.Use these PowerPoint slides for presentations relating to Background, design, circular, vector, abstract, abstraction, graphic, art, concept, style, surface, wallpaper, techno, vibrant, perspective, dimension, digital art, urban, rippling, clip art, circle, rippled, digital illustration, digital, glow, technology, idea, trend, modern, illustration, dimensional, futuristic, backdrop, high-tech, coordinate, ripple, stylish, clip-art, artistic, illuminate. The prominent colors used in the PowerPoint template are Green, Gray, White. Our Visualization Of Connections 4 Stages Ppt It Business Plan PowerPoint Templates combine to create an exciting ensemble. Each one has a distinct character.
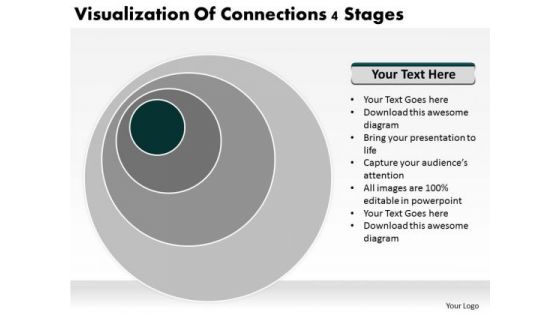
Visualization Of Connections 4 Stages Ppt Business Plan For PowerPoint Slides
We present our visualization of connections 4 stages ppt business plan for PowerPoint Slides.Present our Circle Charts PowerPoint Templates because You can Be the star of the show with our PowerPoint Templates and Slides. Rock the stage with your ideas. Use our Process and Flows PowerPoint Templates because You can Inspire your team with our PowerPoint Templates and Slides. Let the force of your ideas flow into their minds. Use our Business PowerPoint Templates because Our PowerPoint Templates and Slides will fulfill your every need. Use them and effectively satisfy the desires of your audience. Download and present our Shapes PowerPoint Templates because Our PowerPoint Templates and Slides are effectively colour coded to prioritise your plans They automatically highlight the sequence of events you desire. Download our Spheres PowerPoint Templates because Our PowerPoint Templates and Slides offer you the needful to organise your thoughts. Use them to list out your views in a logical sequence.Use these PowerPoint slides for presentations relating to Background, design, circular, vector, abstract, abstraction, graphic, art, concept, style, surface, wallpaper, techno, vibrant, perspective, dimension, digital art, urban, rippling, clip art, circle, rippled, digital illustration, digital, glow, technology, idea, trend, modern, illustration, dimensional, futuristic, backdrop, high-tech, coordinate, ripple, stylish, clip-art, artistic, illuminate. The prominent colors used in the PowerPoint template are Green dark , Gray, White. Examine the facts in all their combinations. Run the comb through with our Visualization Of Connections 4 Stages Ppt Business Plan For PowerPoint Slides.
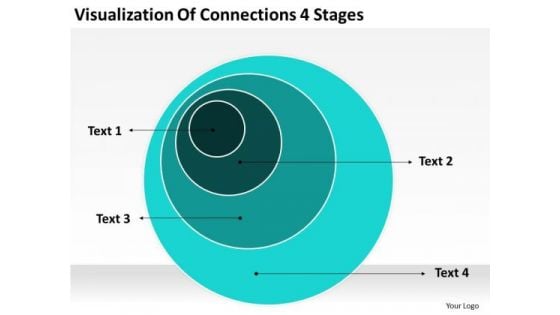
Visualization Of Connections 4 Stages Growthink Business Plan Template PowerPoint Templates
We present our visualization of connections 4 stages growthink business plan template PowerPoint templates.Download our Process and Flows PowerPoint Templates because Our PowerPoint Templates and Slides have the Brilliant backdrops. Guaranteed to illuminate the minds of your audience. Use our Business PowerPoint Templates because They will Put your wonderful verbal artistry on display. Our PowerPoint Templates and Slides will provide you the necessary glam and glitter. Download our Marketing PowerPoint Templates because You aspire to touch the sky with glory. Let our PowerPoint Templates and Slides provide the fuel for your ascent. Download our Circle Charts PowerPoint Templates because It can Conjure up grand ideas with our magical PowerPoint Templates and Slides. Leave everyone awestruck by the end of your presentation. Use our Shapes PowerPoint Templates because Our PowerPoint Templates and Slides have the Brilliant backdrops. Guaranteed to illuminate the minds of your audience.Use these PowerPoint slides for presentations relating to Blue, abstract, spiral, background, light, design, motion, shape, vector, round, line, graphic, business, modern, effect, pattern, blank, flowing, wallpaper, decoration, concept, technology, illustration, shiny, color, style, space, image, simplicity, textured. The prominent colors used in the PowerPoint template are Green, Blue light, White. Attempt great targets with our Visualization Of Connections 4 Stages Growthink Business Plan Template PowerPoint Templates. You will come out on top.
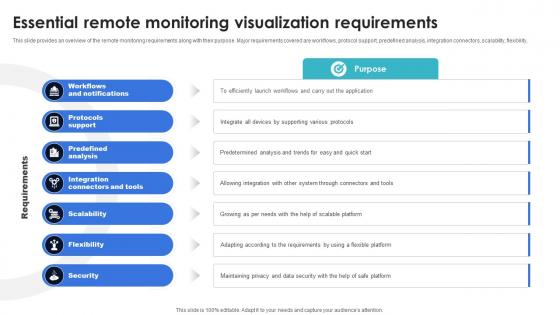
Optimization Of IoT Remote Monitoring Essential Remote Monitoring Visualization Requirements IoT SS V
This slide provides an overview of the remote monitoring requirements along with their purpose. Major requirements covered are workflows, protocol support, predefined analysis, integration connectors, scalability, flexibility, The Optimization Of IoT Remote Monitoring Essential Remote Monitoring Visualization Requirements IoT SS V is a compilation of the most recent design trends as a series of slides. It is suitable for any subject or industry presentation, containing attractive visuals and photo spots for businesses to clearly express their messages. This template contains a variety of slides for the user to input data, such as structures to contrast two elements, bullet points, and slides for written information. Slidegeeks is prepared to create an impression. This slide provides an overview of the remote monitoring requirements along with their purpose. Major requirements covered are workflows, protocol support, predefined analysis, integration connectors, scalability, flexibility,
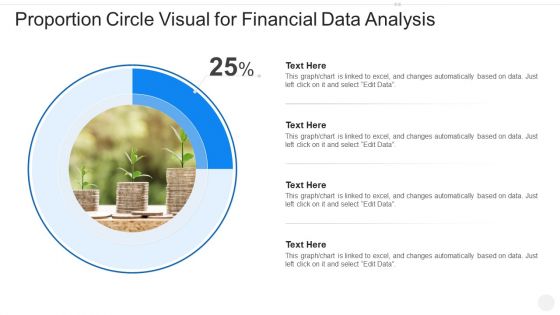
Proportion Circle Visual For Financial Data Analysis Guidelines PDF
Showcasing this set of slides titled proportion circle visual for financial data analysis guidelines pdf. The topics addressed in these templates are proportion circle visual for financial data analysis. All the content presented in this PPT design is completely editable. Download it and make adjustments in color, background, font etc. as per your unique business setting.
Plan Financial Data Governance Icon Ppt Visual Aids PDF
Presenting Plan Financial Data Governance Icon Ppt Visual Aids PDF to dispense important information. This template comprises four stages. It also presents valuable insights into the topics including Plan Financial, Data Governance, Icon. This is a completely customizable PowerPoint theme that can be put to use immediately. So, download it and address the topic impactfully.
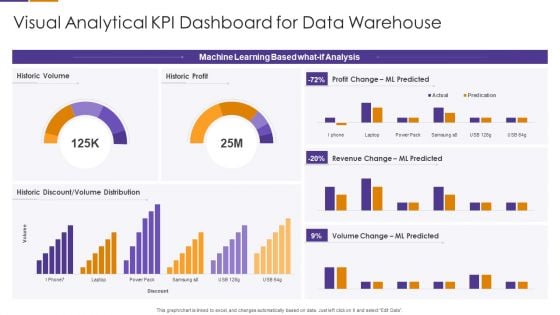
Visual Analytical KPI Dashboard For Data Warehouse Template PDF
Pitch your topic with ease and precision using this Visual Analytical KPI Dashboard For Data Warehouse Template PDF This layout presents information on Machine Learning Based, Volume Change, Revenue Change It is also available for immediate download and adjustment. So, changes can be made in the color, design, graphics or any other component to create a unique layout.
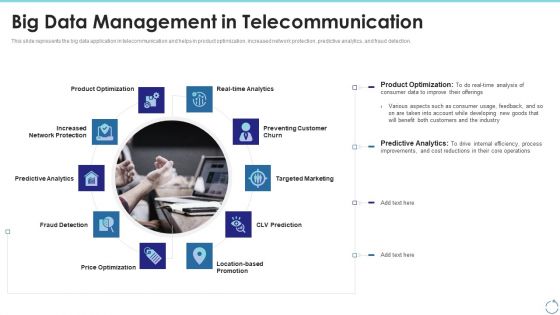
Big Data Management In Telecommunication Ppt Outline Visual Aids PDF
This slide represents the big data application in telecommunication and helps in product optimization, increased network protection, predictive analytics, and fraud detection. Presenting big data management in telecommunication ppt outline visual aids pdf to provide visual cues and insights. Share and navigate important information on ten stages that need your due attention. This template can be used to pitch topics like cost reductions, developing, industry, product optimization. In addtion, this PPT design contains high resolution images, graphics, etc, that are easily editable and available for immediate download.
Visual Analytics Vector Icon Ppt PowerPoint Presentation Visual Aids Show
Presenting this set of slides with name visual analytics vector icon ppt powerpoint presentation visual aids show. This is a three stage process. The stages in this process are data visualization icon, research analysis, business focus. This is a completely editable PowerPoint presentation and is available for immediate download. Download now and impress your audience.

Data Augmentation Software Comparison Chart Ppt Visual Aids Show PDF
The slide covers the feature comparison table for data enrichment tools. It includes significant features such as real-time enrichment, data appending services, automatic lead segmentation, etc. Showcasing this set of slides titled Data Augmentation Software Comparison Chart Ppt Visual Aids Show PDF. The topics addressed in these templates are Real Time Enrichment, Data Appending Service, Automatic Lead Segmentation. All the content presented in this PPT design is completely editable. Download it and make adjustments in color, background, font etc. as per your unique business setting.
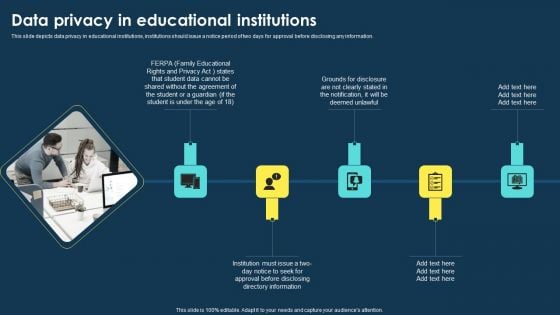
Integrating Data Privacy System Data Privacy In Educational Institutions Ppt Gallery Visual Aids PDF
This slide depicts data privacy in educational institutions, institutions should issue a notice period of two days for approval before disclosing any information. Find highly impressive Integrating Data Privacy System Data Privacy In Educational Institutions Ppt Gallery Visual Aids PDF on Slidegeeks to deliver a meaningful presentation. You can save an ample amount of time using these presentation templates. No need to worry to prepare everything from scratch because Slidegeeks experts have already done a huge research and work for you. You need to download Integrating Data Privacy System Data Privacy In Educational Institutions Ppt Gallery Visual Aids PDF for your upcoming presentation. All the presentation templates are 100 percent editable and you can change the color and personalize the content accordingly. Download now.
Data Folders Back Up On Server Vector Icon Ppt PowerPoint Presentation File Visual Aids PDF
Persuade your audience using this data folders back up on server vector icon ppt powerpoint presentation file visual aids pdf. This PPT design covers three stages, thus making it a great tool to use. It also caters to a variety of topics including data folders back up on server vector icon. Download this PPT design now to present a convincing pitch that not only emphasizes the topic but also showcases your presentation skills.
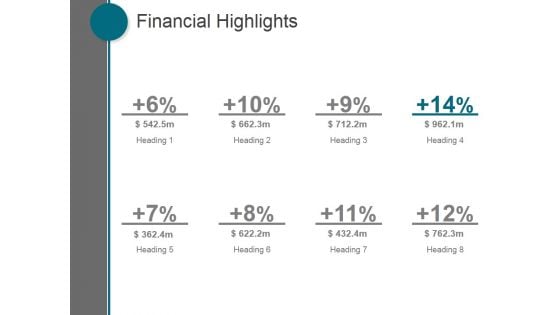
Financial Highlights Ppt PowerPoint Presentation Visual Aids
This is a financial highlights ppt powerpoint presentation visual aids. This is a eight stage process. The stages in this process are business, marketing, management, finance, strategy.
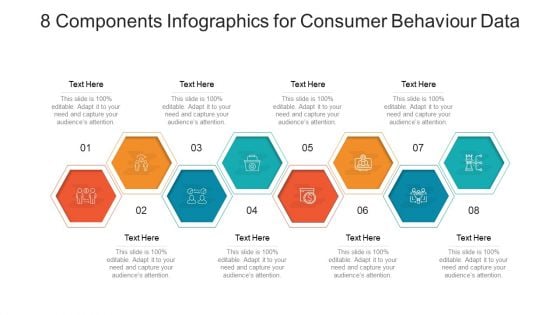
8 Components Infographics For Consumer Behaviour Data Ppt Visual Aids Portfolio PDF
Presenting 8 components infographics for consumer behaviour data ppt visual aids portfolio pdf to dispense important information. This template comprises eight stages. It also presents valuable insights into the topics including 8 components infographics for consumer behaviour data. This is a completely customizable PowerPoint theme that can be put to use immediately. So, download it and address the topic impactfully.
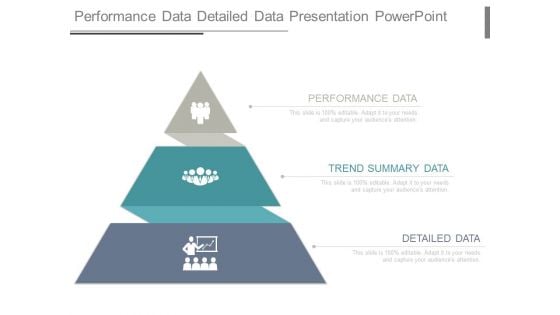
Performance Data Detailed Data Presentation Powerpoint
This is a performance data detailed data presentation powerpoint. This is a three stage process. The stages in this process are performance data, trend summary data, detailed data.
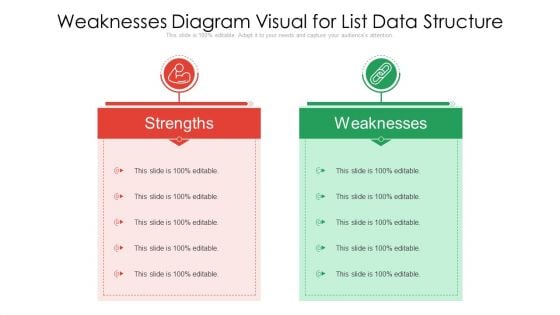
Strengths And Weaknesses Diagram Visual For List Data Structure Structure PDF
Persuade your audience using this strengths and weaknesses diagram visual for list data structure structure pdf. This PPT design covers two stages, thus making it a great tool to use. It also caters to a variety of topics including weaknesses diagram visual for list data structure. Download this PPT design now to present a convincing pitch that not only emphasizes the topic but also showcases your presentation skills.
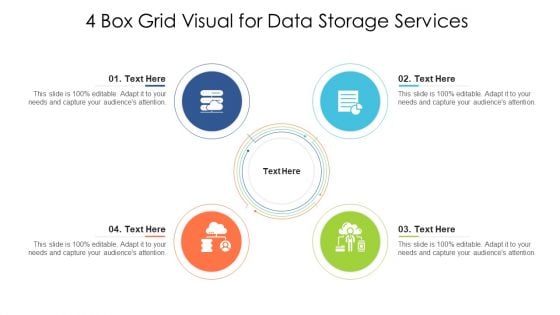
4 Box Grid Visual For Data Storage Services Ppt Gallery Demonstration PDF
Persuade your audience using this 4 box grid visual for data storage services ppt gallery demonstration pdf. This PPT design covers four stages, thus making it a great tool to use. It also caters to a variety of topics including 4 box grid visual for data storage services. Download this PPT design now to present a convincing pitch that not only emphasizes the topic but also showcases your presentation skills.
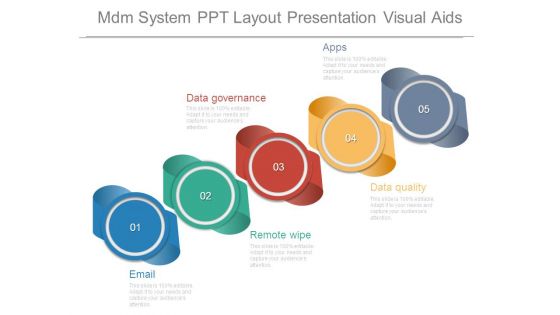
Mdm System Ppt Layout Presentation Visual Aids
This is a mdm system ppt layout presentation visual aids. This is a five stage process. The stages in this process are email, data governance, apps, remote wipe, data quality.
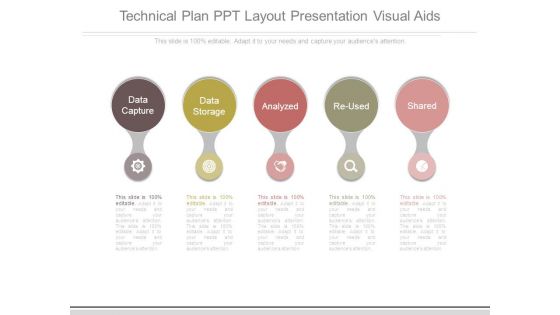
Technical Plan Ppt Layout Presentation Visual Aids
This is a technical plan ppt layout presentation visual aids. This is a five stage process. The stages in this process are data capture, data storage, analyzed, re used, shared.
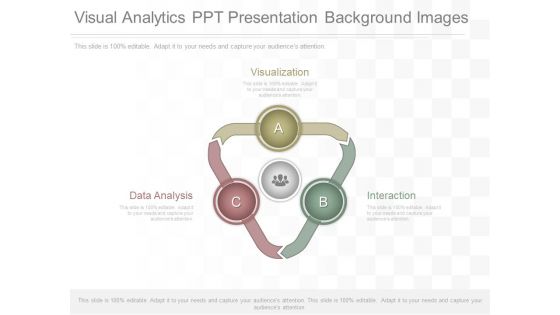
Visual Analytics Ppt Presentation Background Images
This is a visual analytics ppt presentation background images. This is a three stage process. The stages in this process are visualization, interaction, data analysis.
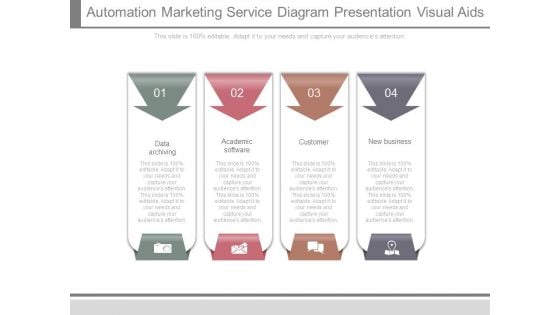
Automation Marketing Service Diagram Presentation Visual Aids
This is a automation marketing service diagram presentation visual aids. This is a four stage process. The stages in this process are data archiving, academic software, customer, new business.
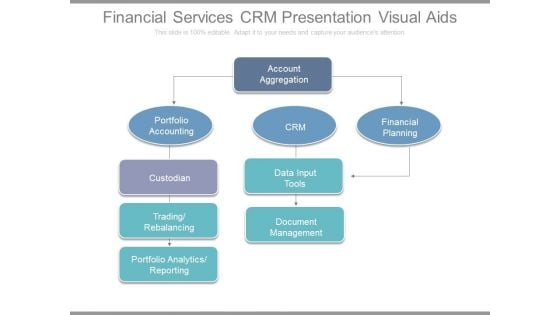
Financial Services Crm Presentation Visual Aids
This is a financial services crm presentation visual aids. This is a five stage process. The stages in this process are account aggregation, financial planning, crm, data input tools, document management, portfolio accounting, custodian, trading rebalancing, portfolio analytics reporting.
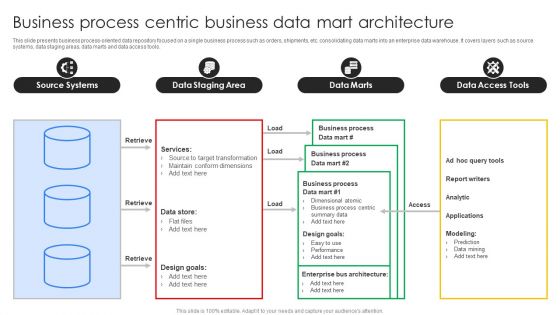
Business Process Centric Business Data Mart Architecture Ppt Infographics Visual Aids PDF
This slide presents business process-oriented data repository focused on a single business process such as orders, shipments, etc. consolidating data marts into an enterprise data warehouse. it covers layers such as source systems, data staging areas, data marts and data access tools. Pitch your topic with ease and precision using this Business Process Centric Business Data Mart Architecture Ppt Infographics Visual Aids PDF. This layout presents information on Source Systems, Data Staging Area, Data Marts, Data Access Tools. It is also available for immediate download and adjustment. So, changes can be made in the color, design, graphics or any other component to create a unique layout.

Data Driven Automated Testing Framework Cycle Ppt Visual Aids Inspiration PDF
This slide exhibits data driven automation testing framework cycle which can be referred by IT firms to streamline the process of testing to achieve maximum quality of data . It contains information about data files, driver script, application testing, test outcomes, etc. Presenting Data Driven Automated Testing Framework Cycle Ppt Visual Aids Inspiration PDF to dispense important information. This template comprises four stages. It also presents valuable insights into the topics including Data Containing, Driver Script, Actual, Output. This is a completely customizable PowerPoint theme that can be put to use immediately. So, download it and address the topic impactfully.
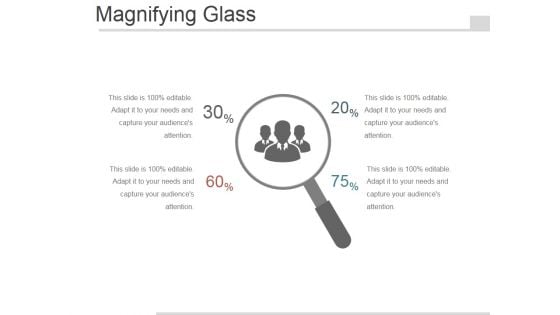
Magnifying Glass Ppt PowerPoint Presentation Visual Aids
This is a magnifying glass ppt powerpoint presentation visual aids. This is a two stage process. The stages in this process are management, magnifying glass, business, marketing.
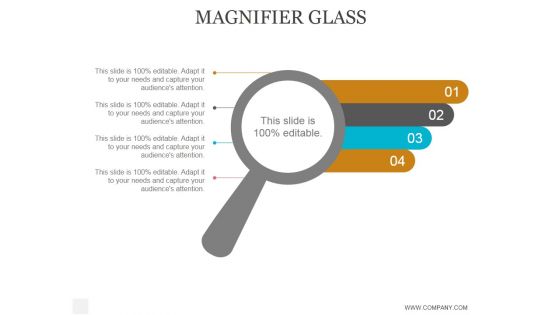
Magnifier Glass Ppt PowerPoint Presentation Visual Aids
This is a magnifier glass ppt powerpoint presentation visual aids. This is a four stage process. The stages in this process are business, strategy, marketing, analysis, success, magnifier glass.
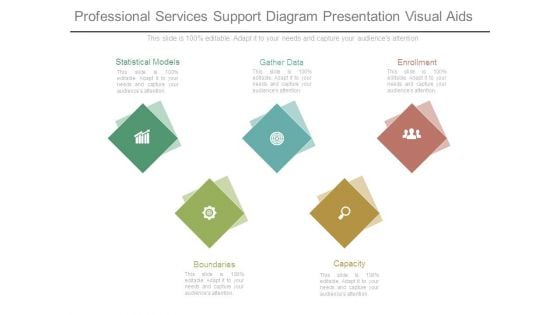
Professional Services Support Diagram Presentation Visual Aids
This is a professional services support diagram presentation visual aids. This is a five stage process. The stages in this process are statistical models, gather data, enrollment, capacity, boundaries.

Newspaper Ppt PowerPoint Presentation Visual Aids Deck
This is a newspaper ppt powerpoint presentation visual aids deck. This is a one stage process. The stages in this process are business, newspaper, marketing, information, strategy.

Business Analysis Introduction Ppt Presentation Visual Aids
This is a business analysis introduction ppt presentation visual aids. This is a six stage process. The stages in this process are vision, mission, strategy, objectives, organization, tasks.
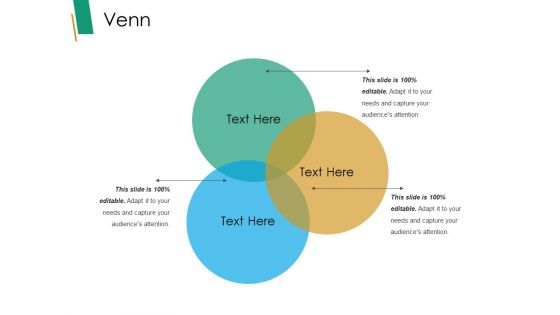
Venn Ppt PowerPoint Presentation Visual Aids Backgrounds
This is a venn ppt powerpoint presentation visual aids backgrounds. This is a three stage process. The stages in this process are venn, business, management, strategy, analysis.

Venn Ppt PowerPoint Presentation Slides Visual Aids
This is a venn ppt powerpoint presentation slides visual aids. This is a four stage process. The stages in this process are venn, marketing, strategy, planning, analysis.
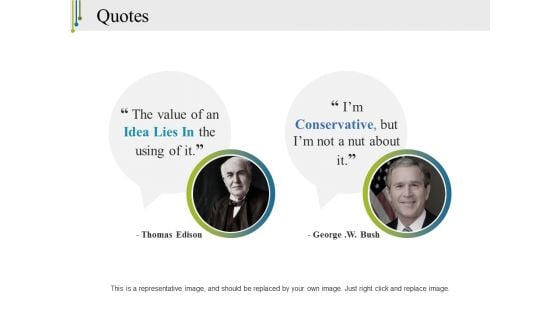
Quotes Ppt PowerPoint Presentation Infographics Visual Aids
This is a quotes ppt powerpoint presentation infographics visual aids. This is a one stage process. The stages in this process are quotes, communication, planning, business, analysis.
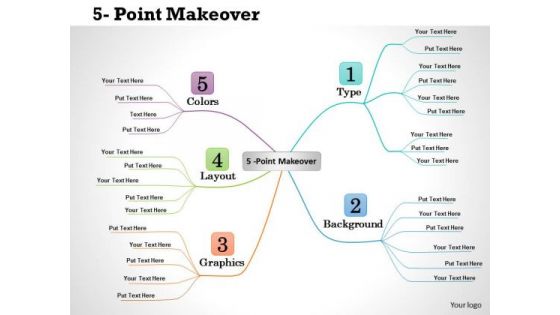
Business Diagram Visual Information PowerPoint Ppt Presentation
Open Up Doors That Lead To Success. Our Business Diagram Visual Information PowerPoint PPT Presentation Powerpoint Templates Provide The Handles. Opportunity Will Come Knocking At Your Door. Welcome It With Our Business Powerpoint Templates.
Bulb Ppt PowerPoint Presentation Visual Aids Inspiration
This is a bulb ppt powerpoint presentation visual aids inspiration. This is a one stage process. The stages in this process are bulb, technology, marketing, analysis, business.
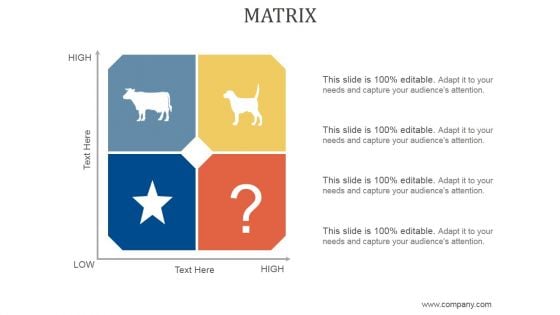
Matrix Ppt PowerPoint Presentation Visual Aids
This is a matrix ppt powerpoint presentation visual aids. This is a four stage process. The stages in this process are business, strategy, marketing, analysis, matrix, swot analysis.


 Continue with Email

 Home
Home


