Data Visualization Presentation
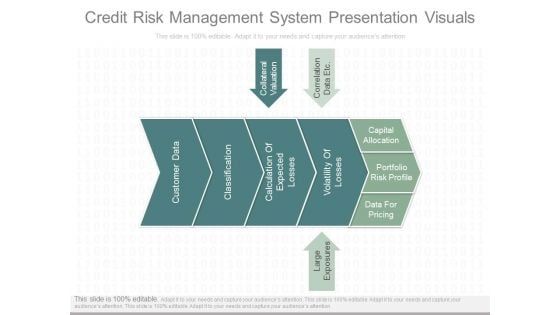
Credit Risk Management System Presentation Visuals
This is a credit risk management system presentation visuals. This is a one stage process. The stages in this process are customer data, classification, calculation of expected losses, volatility of losses, large exposures, data for pricing, portfolio risk profile, capital allocation, collateral valuation, correlation data etc.
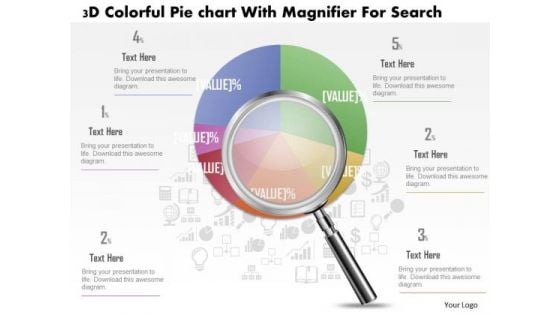
Business Diagram 3d Colorful Pie Graph With Magnifier Data Search PowerPoint Slide
This business slide displays 3d colorful pie graph with magnifier. This diagram is a data visualization tool that gives you a simple way to present statistical information. This slide helps your audience examine and interpret the data you present.

Business Diagram Data Driven Pie Chart Inside The Magnifier PowerPoint Slide
This business slide displays 3d colorful pie graph with magnifier. This diagram is a data visualization tool that gives you a simple way to present statistical information. This slide helps your audience examine and interpret the data you present.

Data Collection Storage And Analysis Strategies DT SS V
This slide present various digital strategies for effective data collection, storage, and analysis to improve data-based decision making. It includes customer feedback and surveys, cloud-based solutions, data visualization tools , etc. Coming up with a presentation necessitates that the majority of the effort goes into the content and the message you intend to convey. The visuals of a PowerPoint presentation can only be effective if it supplements and supports the story that is being told. Keeping this in mind our experts created Data Collection Storage And Analysis Strategies DT SS V to reduce the time that goes into designing the presentation. This way, you can concentrate on the message while our designers take care of providing you with the right template for the situation. This slide present various digital strategies for effective data collection, storage, and analysis to improve data-based decision making. It includes customer feedback and surveys, cloud-based solutions, data visualization tools , etc.
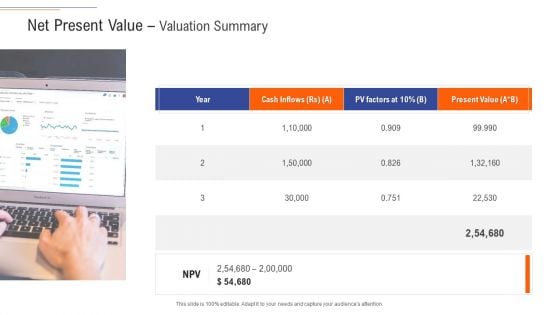
Support Services Management Net Present Value Valuation Summary Ppt Visual Aids Gallery PDF
Presenting support services management net present value valuation summary ppt visual aids gallery pdf to provide visual cues and insights. Share and navigate important information on one stages that need your due attention. This template can be used to pitch topics like net present value valuation summary. In addtion, this PPT design contains high resolution images, graphics, etc, that are easily editable and available for immediate download.
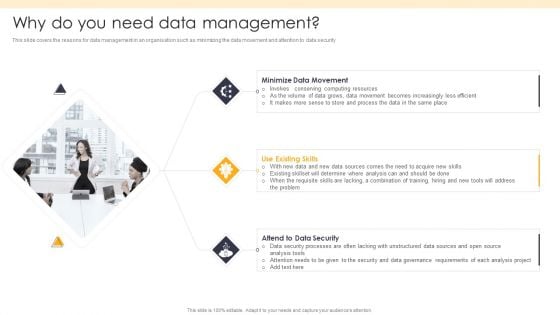
ETL Repository Why Do You Need Data Management Ppt PowerPoint Presentation Styles Slideshow PDF
This slide covers the reasons for data management in an organisation such as minimizing the data movement and attention to data security.Presenting ETL Repository Why Do You Need Data Management Ppt PowerPoint Presentation Styles Slideshow PDF to provide visual cues and insights. Share and navigate important information on three stages that need your due attention. This template can be used to pitch topics like Minimize Data, Existing Skills, Data Security. In addtion, this PPT design contains high resolution images, graphics, etc, that are easily editable and available for immediate download.

Six Steps Big Data Project Lifecycle Process For Effective Decision Making Inspiration PDF
This slide covers six steps big data lifecycle process for effective decision making. It involves business case valuation, data identification, extraction, presentation, visualization and utilization of analysis results.Persuade your audience using this Six Steps Big Data Project Lifecycle Process For Effective Decision Making Inspiration PDF. This PPT design covers six stages, thus making it a great tool to use. It also caters to a variety of topics including Business Case Valuation, Data Visualization, Graphical Communication. Download this PPT design now to present a convincing pitch that not only emphasizes the topic but also showcases your presentation skills.
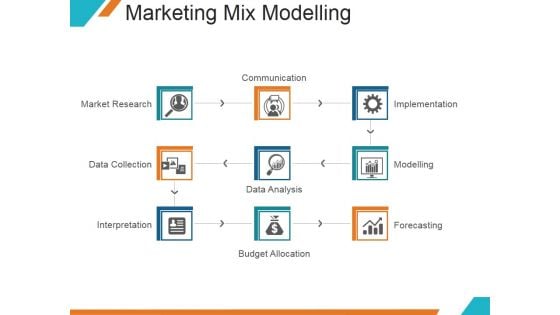
Marketing Mix Modelling Ppt PowerPoint Presentation Visuals
This is a marketing mix modelling ppt powerpoint presentation visuals. This is a nine stage process. The stages in this process are market research, communication, implementation, data collection.
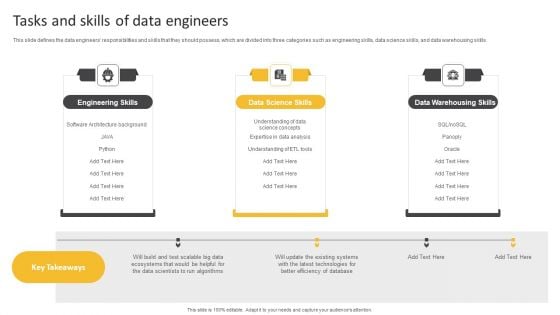
Information Science Tasks And Skills Of Data Engineers Ppt PowerPoint Presentation Layouts Format PDF
This slide defines the data engineers responsibilities and skills that they should possess, which are divided into three categories such as engineering skills, data science skills, and data warehousing skills.Presenting Information Science Tasks And Skills Of Data Engineers Ppt PowerPoint Presentation Layouts Format PDF to provide visual cues and insights. Share and navigate important information on three stages that need your due attention. This template can be used to pitch topics like Engineering Skills, Data Science, Warehousing Skills. In addtion, this PPT design contains high resolution images, graphics, etc, that are easily editable and available for immediate download.
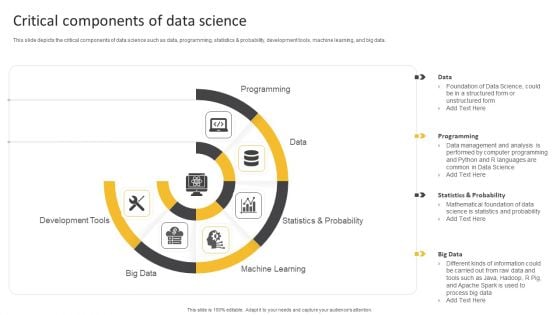
Information Science Critical Components Of Data Science Ppt PowerPoint Presentation Gallery Objects PDF
This slide depicts the critical components of data science such as data, programming, statistics probability, development tools, machine learning, and big data.Presenting Information Science Critical Components Of Data Science Ppt PowerPoint Presentation Gallery Objects PDF to provide visual cues and insights. Share and navigate important information on six stages that need your due attention. This template can be used to pitch topics like Programming, Development Tools, Machine Learning. In addtion, this PPT design contains high resolution images, graphics, etc, that are easily editable and available for immediate download.
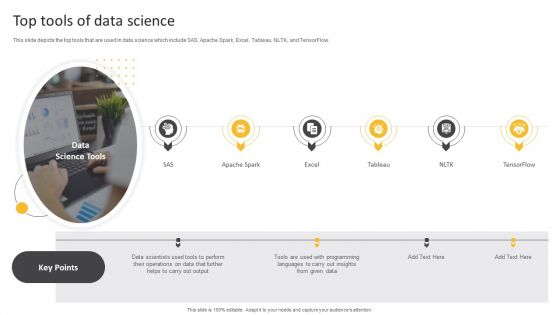
Information Science Top Tools Of Data Science Ppt PowerPoint Presentation Professional Designs PDF
This slide depicts the top tools that are used in data science which include SAS, Apache Spark, Excel, Tableau, NLTK, and TensorFlow.Presenting Information Science Top Tools Of Data Science Ppt PowerPoint Presentation Professional Designs PDF to provide visual cues and insights. Share and navigate important information on six stages that need your due attention. This template can be used to pitch topics like Data Scientists, Operations Data, Languages Insights. In addtion, this PPT design contains high resolution images, graphics, etc, that are easily editable and available for immediate download.
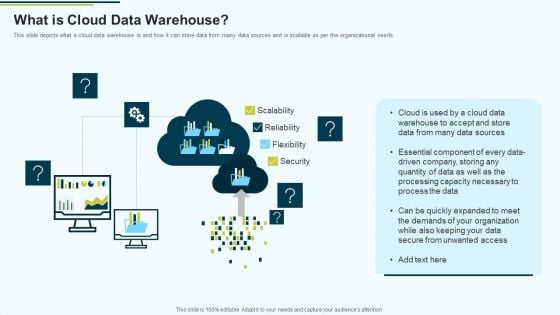
MIS What Is Cloud Data Warehouse Ppt PowerPoint Presentation Inspiration Introduction PDF
This slide depicts what a cloud data warehouse is and how it can store data from many data sources and is scalable as per the organizational needs.Presenting MIS What Is Cloud Data Warehouse Ppt PowerPoint Presentation Inspiration Introduction PDF to provide visual cues and insights. Share and navigate important information on one stage that need your due attention. This template can be used to pitch topics like Essential Component, Processing Capacity Necessary, Warehouse To Accept In addtion, this PPT design contains high resolution images, graphics, etc, that are easily editable and available for immediate download.
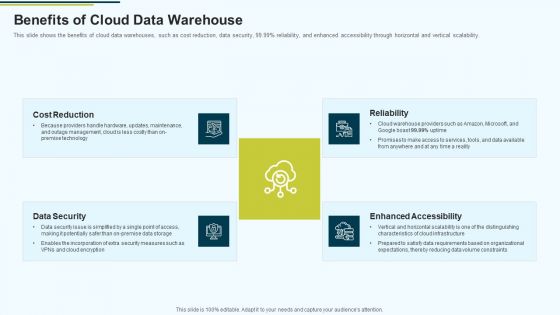
MIS Benefits Of Cloud Data Warehouse Ppt PowerPoint Presentation Portfolio Display PDF
This slide shows the benefits of cloud data warehouses, such as cost reduction, data security, 99.99persent reliability, and enhanced accessibility through horizontal and vertical scalability.Presenting MIS Benefits Of Cloud Data Warehouse Ppt PowerPoint Presentation Portfolio Display PDF to provide visual cues and insights. Share and navigate important information on four stages that need your due attention. This template can be used to pitch topics like Enhanced Accessibility, Reliability, Data Security In addtion, this PPT design contains high resolution images, graphics, etc, that are easily editable and available for immediate download.
Due Diligence For M And A With Magnifying Glass Icon Ppt Visual Aids Infographics PDF
Persuade your audience using this Due Diligence For M And A With Magnifying Glass Icon Ppt Visual Aids Infographics PDF. This PPT design covers one stages, thus making it a great tool to use. It also caters to a variety of topics including Ensure Alignment, Stakeholders, Senior Leaders Cooperation. Download this PPT design now to present a convincing pitch that not only emphasizes the topic but also showcases your presentation skills.
MIS Applications Of Data Warehouse Ppt PowerPoint Presentation Icon Example PDF
This slide describes the applications of data warehouses in different industries such as banking, healthcare, government, education, insurance, finance, retail, and manufacturing.Presenting MIS Applications Of Data Warehouse Ppt PowerPoint Presentation Icon Example PDF to provide visual cues and insights. Share and navigate important information on eight stages that need your due attention. This template can be used to pitch topics like Healthcare, Government, Manufacturing In addtion, this PPT design contains high resolution images, graphics, etc, that are easily editable and available for immediate download.
Information Science Different Types Of Data Scientists Ppt PowerPoint Presentation Model Icons PDF
This slide represents the different types of data scientists, including vertical experts, stat DS managers, generalists, legends, statisticians, ML engineers, and dabblers.Presenting Information Science Different Types Of Data Scientists Ppt PowerPoint Presentation Model Icons PDF to provide visual cues and insights. Share and navigate important information on seven stages that need your due attention. This template can be used to pitch topics like Vertical Experts, Information Consistently, Roadblocks Tooling. In addtion, this PPT design contains high resolution images, graphics, etc, that are easily editable and available for immediate download.
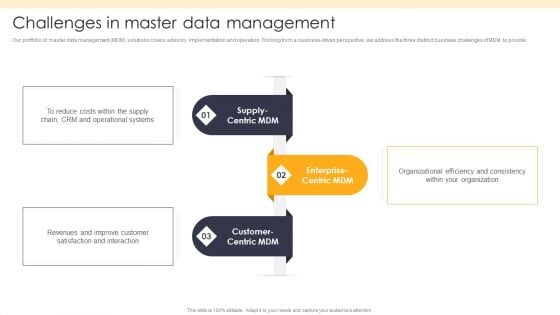
ETL Repository Challenges In Master Data Management Ppt PowerPoint Presentation Infographics Outline PDF
Our portfolio of master data management MDM solutions covers advisory, implementation and operation. Working from a business driven perspective, we address the three distinct business challenges of MDM to provide.Presenting ETL Repository Challenges In Master Data Management Ppt PowerPoint Presentation Infographics Outline PDF to provide visual cues and insights. Share and navigate important information on three stages that need your due attention. This template can be used to pitch topics like Supply Centric, Enterprise Centric, Customer Centric . In addtion, this PPT design contains high resolution images, graphics, etc, that are easily editable and available for immediate download.
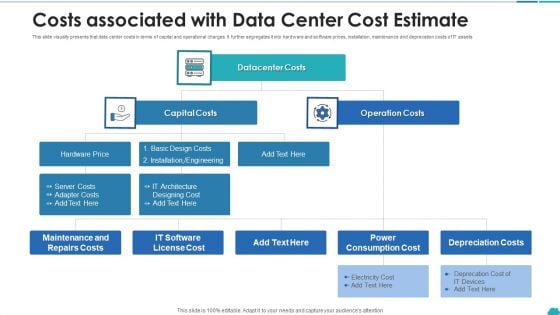
Costs Associated With Data Center Cost Estimate Sample PDF
This slide visually presents that data center costs in terms of capital and operational charges. It further segregates it into hardware and software prices, installation, maintenance and deprecation costs of IT assets Presenting costs associated with data center cost estimate sample pdf to dispense important information. This template comprises three stages. It also presents valuable insights into the topics including capital costs, operation costs, datacenter costs. This is a completely customizable PowerPoint theme that can be put to use immediately. So, download it and address the topic impactfully.
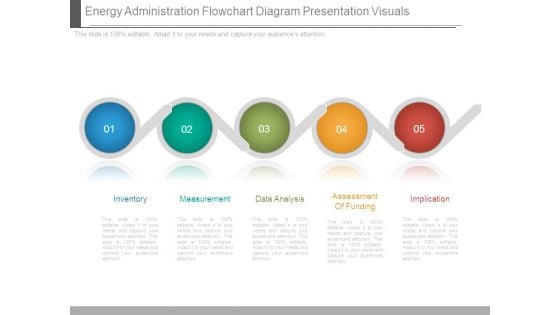
Energy Administration Flowchart Diagram Presentation Visuals
This is a energy administration flowchart diagram presentation visuals. This is a five stage process. The stages in this process are inventory, measurement, data analysis, assessment of funding, implication.
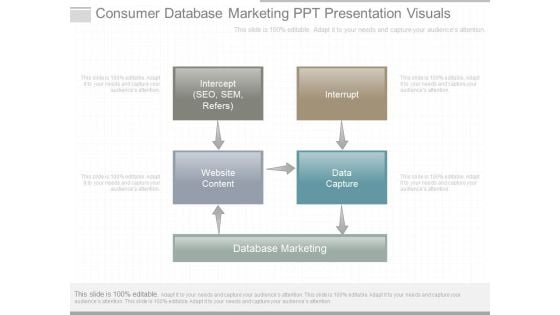
Consumer Database Marketing Ppt Presentation Visuals
This is a consumer database marketing ppt presentation visuals. This is a five stage process. The stages in this process are intercept seo sem refers, interrupt, website content, data capture, database marketing.
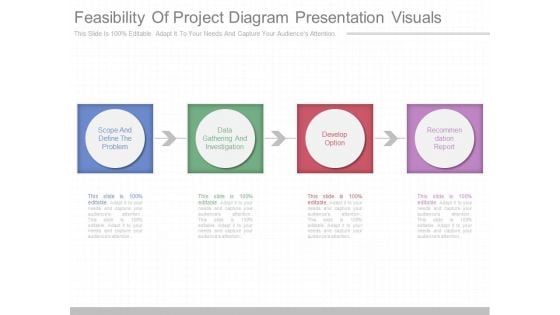
Feasibility Of Project Diagram Presentation Visuals
This is a feasibility of project diagram presentation visuals. This is a four stage process. The stages in this process are scope and define the problem, data gathering and investigation, develop option, recommendation report.
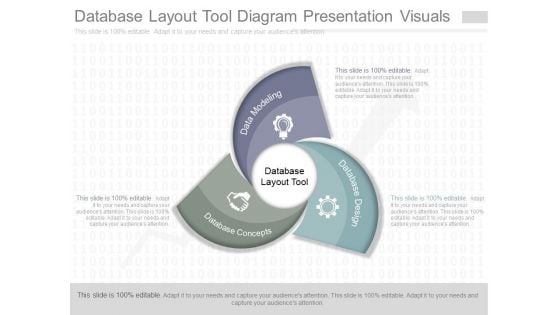
Database Layout Tool Diagram Presentation Visuals
This is a database layout tool diagram presentation visuals. This is a three stage process. The stages in this process are database concepts, data modeling, database layout tool, database design.\n\n\n\n
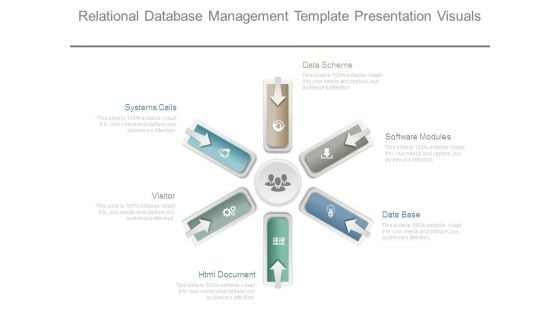
Relational Database Management Template Presentation Visuals
This is a relational database management template presentation visuals. This is a six stage process. The stages in this process are systems calls, visitor, html document, database, software modules, data scheme.

Business Diagram 3d Pie Chart With Arrows For Data Representation PowerPoint Slide
This business slide displays pie chart with timeline graphics. This diagram has been designed with graphic of with four arrows representing yearly data. Use this diagram, in your presentations to display process steps, stages, for business management.
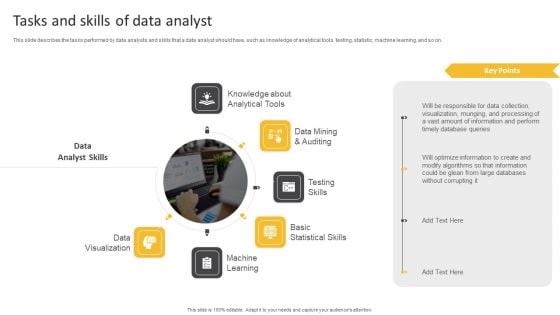
Information Science Tasks And Skills Of Data Analyst Ppt PowerPoint Presentation Professional Graphics Design PDF
This slide describes the tasks performed by data analysts and skills that a data analyst should have, such as knowledge of analytical tools, testing, statistic, machine learning, and so on.Presenting Information Science Tasks And Skills Of Data Analyst Ppt PowerPoint Presentation Professional Graphics Design PDF to provide visual cues and insights. Share and navigate important information on six stages that need your due attention. This template can be used to pitch topics like Analytical Tools, Data Mining, Testing Skills. In addtion, this PPT design contains high resolution images, graphics, etc, that are easily editable and available for immediate download.
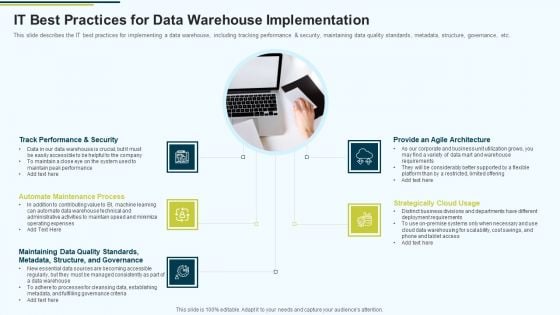
MIS IT Best Practices For Data Warehouse Implementation Ppt PowerPoint Presentation Pictures Infographics PDF
This slide describes the IT best practices for implementing a data warehouse, including tracking performance and security, maintaining data quality standards, metadata, structure, governance, etc.Presenting MIS IT Best Practices For Data Warehouse Implementation Ppt PowerPoint Presentation Pictures Infographics PDF to provide visual cues and insights. Share and navigate important information on five stages that need your due attention. This template can be used to pitch topics like Provide An Agile Architecture, Strategically Cloud Usage, Maintaining Data Quality In addtion, this PPT design contains high resolution images, graphics, etc, that are easily editable and available for immediate download.
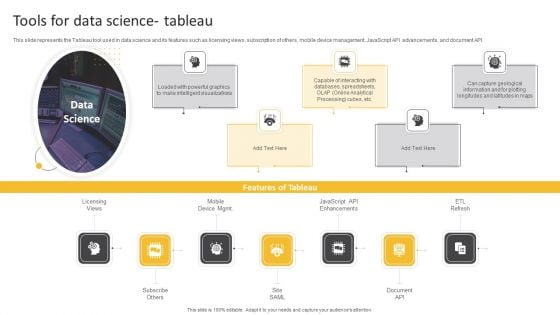
Information Science Tools For Data Science Tableau Ppt PowerPoint Presentation File Designs PDF
This slide represents the Tableau tool used in data science and its features such as licensing views, subscription of others, mobile device management, JavaScript API advancements, and document API.Presenting Information Science Tools For Data Science Tableau Ppt PowerPoint Presentation File Designs PDF to provide visual cues and insights. Share and navigate important information on five stages that need your due attention. This template can be used to pitch topics like Information Plotting, Longitudes Latitudes, Capture Geological. In addtion, this PPT design contains high resolution images, graphics, etc, that are easily editable and available for immediate download.
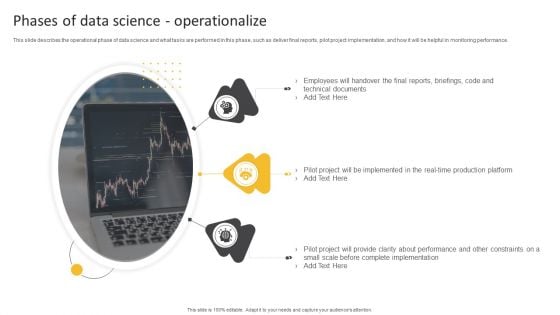
Information Science Phases Of Data Science Operationalize Ppt PowerPoint Presentation Show Display PDF
This slide describes the operational phase of data science and what tasks are performed in this phase, such as deliver final reports, pilot project implementation, and how it will be helpful in monitoring performance.Presenting Information Science Phases Of Data Science Operationalize Ppt PowerPoint Presentation Show Display PDF to provide visual cues and insights. Share and navigate important information on three stages that need your due attention. This template can be used to pitch topics like Technical Documents, Project Implemented, Complete Implementation. In addtion, this PPT design contains high resolution images, graphics, etc, that are easily editable and available for immediate download.
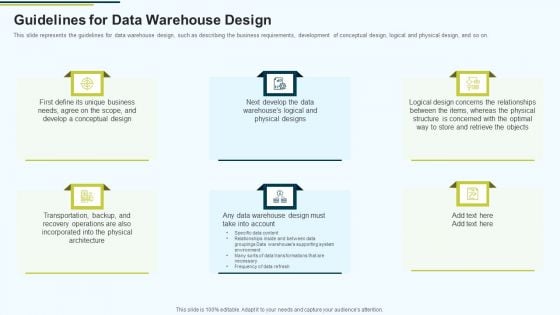
MIS Guidelines For Data Warehouse Design Ppt PowerPoint Presentation Layouts Layout PDF
This slide represents the guidelines for data warehouse design, such as describing the business requirements, development of conceptual design, logical and physical design, and so on.Presenting MIS Guidelines For Data Warehouse Design Ppt PowerPoint Presentation Layouts Layout PDF to provide visual cues and insights. Share and navigate important information on six stages that need your due attention. This template can be used to pitch topics like Conceptual Design, Incorporated Into The Physical, Recovery Operations In addtion, this PPT design contains high resolution images, graphics, etc, that are easily editable and available for immediate download.

Manager Present Business Data To Potential Stakeholder Ppt PowerPoint Presentation Gallery Background Image PDF
Persuade your audience using this manager present business data to potential stakeholder ppt powerpoint presentation gallery background image pdf. This PPT design covers two stages, thus making it a great tool to use. It also caters to a variety of topics including manager present business data to potential stakeholder. Download this PPT design now to present a convincing pitch that not only emphasizes the topic but also showcases your presentation skills.
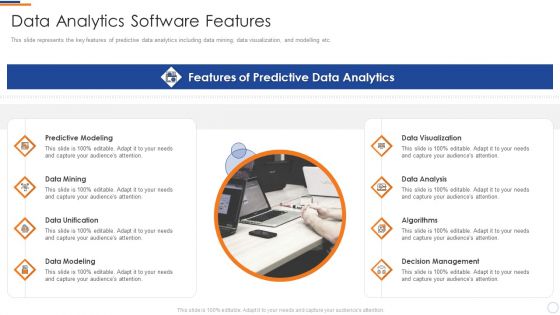
Business Intelligence And Big Transformation Toolkit Data Analytics Software Features Slides PDF
This slide represents the key features of predictive data analytics including data mining, data visualization, and modelling etc. This is a business intelligence and big transformation toolkit data analytics software features slides pdf template with various stages. Focus and dispense information on eight stages using this creative set, that comes with editable features. It contains large content boxes to add your information on topics like predictive modeling, data mining, data unification, data modeling, visualization and presentation. You can also showcase facts, figures, and other relevant content using this PPT layout. Grab it now.
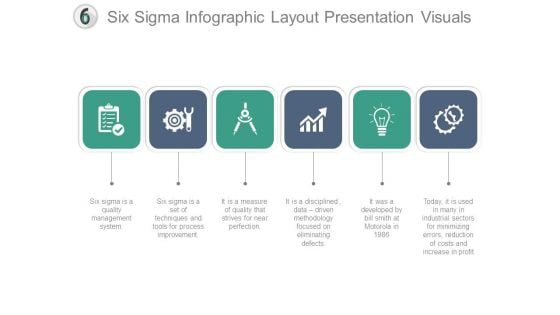
Six Sigma Infographic Layout Presentation Visuals
This is a six sigma infographic layout presentation visuals. This is a six stage process. The stages in this process are six sigma is a quality management system, six sigma is a set of techniques and tools for process improvement, it is a measure of quality that strives for near perfection, it is a disciplined, data driven methodology focused on eliminating defects, it was a developed by bill smith at motorola in 1986, today, it is used in many in industrial sectors for minimizing errors, reduction of costs and increase in profit.
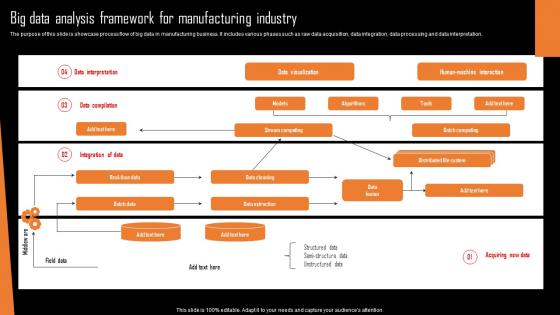
Big Data Analysis Framework For Manufacturing Industry Background Pdf
The purpose of this slide is showcase process flow of big data in manufacturing business. It includes various phases such as raw data acquisition, data integration, data processing and data interpretation.Showcasing this set of slides titled Big Data Analysis Framework For Manufacturing Industry Background Pdf The topics addressed in these templates are Data Visualization, Data Extraction, Data Cleaning All the content presented in this PPT design is completely editable. Download it and make adjustments in color, background, font etc. as per your unique business setting. The purpose of this slide is showcase process flow of big data in manufacturing business. It includes various phases such as raw data acquisition, data integration, data processing and data interpretation.
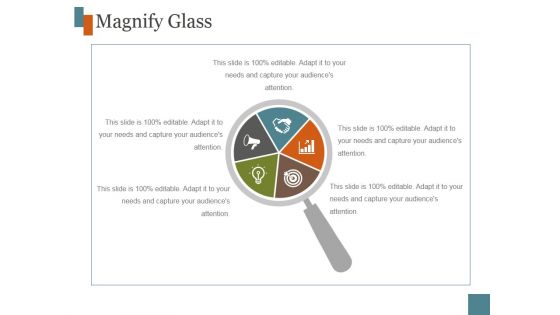
Magnify Glass Ppt PowerPoint Presentation Visuals
This is a magnify glass ppt powerpoint presentation visuals. This is a five stage process. The stages in this process are management, magnifying, glass, icons, business.
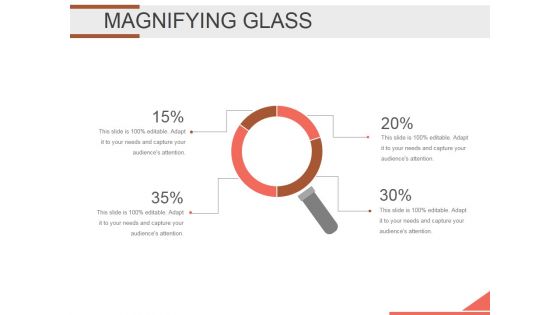
Magnifying Glass Ppt PowerPoint Presentation Visuals
This is a magnifying glass ppt powerpoint presentation visuals. This is a four stage process. The stages in this process are magnifier glass, search, marketing, sales, analysis, business.
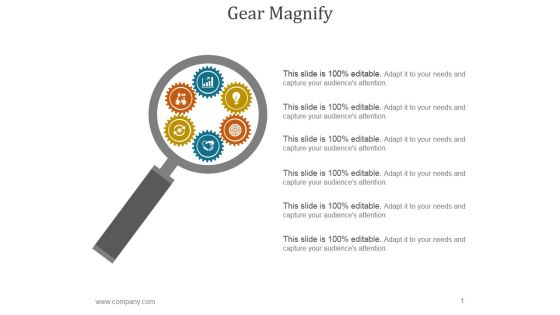
Gear Magnify Ppt PowerPoint Presentation Visuals
This is a gear magnify ppt powerpoint presentation visuals. This is a one stage process. The stages in this process are gear, magnify, management, business, marketing.

Magnifying Glass Ppt PowerPoint Presentation Portfolio Visuals
This is a magnifying glass ppt powerpoint presentation portfolio visuals. This is a three stage process. The stages in this process are magnifying glass, business, gears, strategy, process.
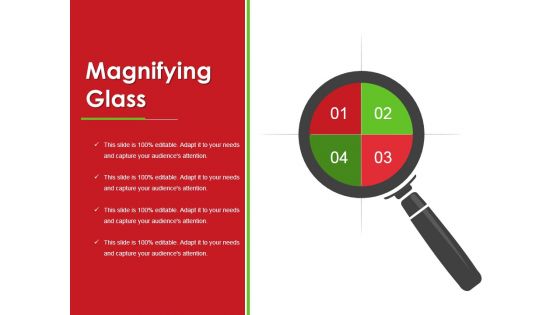
Magnifying Glass Ppt PowerPoint Presentation Model Visuals
This is a magnifying glass ppt powerpoint presentation model visuals. This is a four stage process. The stages in this process are magnifying glass, business, marketing, management, planning.

MIS How Do Data Warehouses Databases And Data Lakes Work Together Ppt PowerPoint Presentation Layouts Design Ideas PDF
This slide represents how data warehouses, databases, and data lakes work together to process the data and carry out beneficial outputs.This is a MIS How Do Data Warehouses Databases And Data Lakes Work Together Ppt PowerPoint Presentation Layouts Design Ideas PDF template with various stages. Focus and dispense information on seven stages using this creative set, that comes with editable features. It contains large content boxes to add your information on topics like Explore And Prepare Data, Analyze There, Land Data In Data Warehouse You can also showcase facts, figures, and other relevant content using this PPT layout. Grab it now.
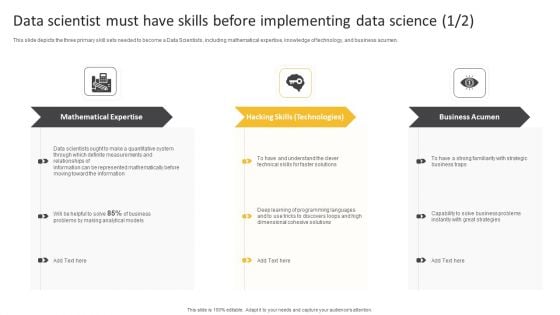
Information Science Data Scientist Must Have Skills Before Implementing Data Science Ppt PowerPoint Presentation Summary Portrait PDF
This slide depicts the three primary skill sets needed to become a Data Scientists, including mathematical expertise, knowledge of technology, and business acumen.This is a Information Science Data Scientist Must Have Skills Before Implementing Data Science Ppt PowerPoint Presentation Summary Portrait PDF template with various stages. Focus and dispense information on three stages using this creative set, that comes with editable features. It contains large content boxes to add your information on topics like Mathematical Expertise, Business Acumen, Skills Technologies. You can also showcase facts, figures, and other relevant content using this PPT layout. Grab it now.
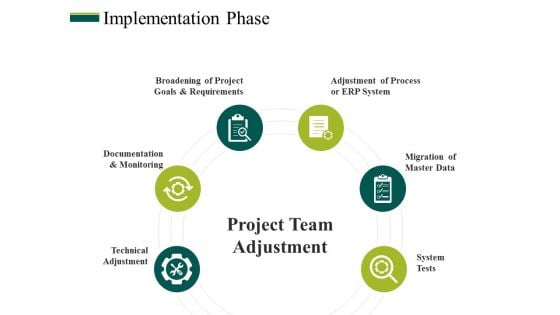
Implementation Phase Ppt PowerPoint Presentation Show Visuals
This is a implementation phase ppt powerpoint presentation show visuals. This is a six stage process. The stages in this process are technical adjustment, documentation and monitoring, broadening of project goals and requirements, adjustment of process or erp system, migration of master data.
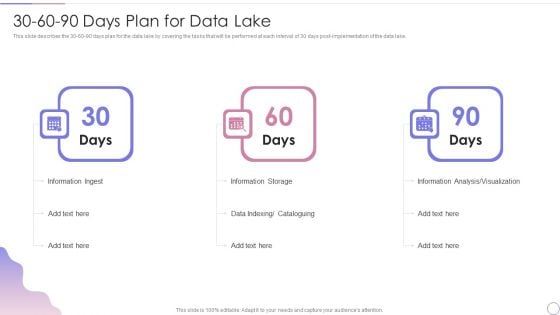
Data Lake Architecture Future Of Data Analysis 30 60 90 Days Plan For Data Lake Designs PDF
This slide describes the 30 60 90 days plan for the data lake by covering the tasks that will be performed at each interval of 30 days post implementation of the data lake.Presenting Data Lake Architecture Future Of Data Analysis 30 60 90 Days Plan For Data Lake Designs PDF to provide visual cues and insights. Share and navigate important information on three stages that need your due attention. This template can be used to pitch topics like Information Ingest, Information Storage, Analysis Visualization. In addtion, this PPT design contains high resolution images, graphics, etc, that are easily editable and available for immediate download.
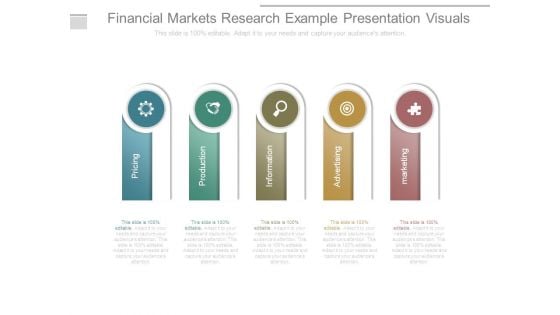
Financial Markets Research Example Presentation Visuals
This is a financial markets research example presentation visuals. This is a five stage process. The stages in this process are pricing, production, information, advertising, marketing.
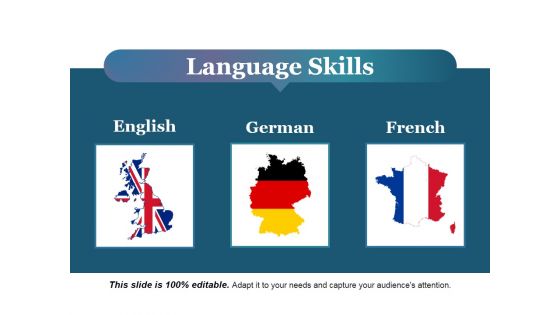
Language Skills Ppt PowerPoint Presentation Ideas Visuals
This is a language skills ppt powerpoint presentation ideas visuals. This is a three stage process. The stages in this process are business, location, geography, information, management.

News Paper Ppt PowerPoint Presentation Visuals
This is a news paper ppt powerpoint presentation visuals. This is a one stage process. The stages in this process are business, marketing, management, newspaper, information.
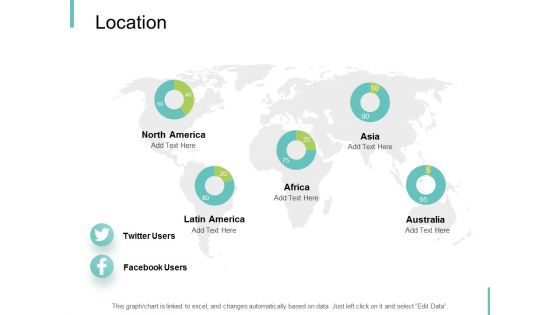
Location Geography Ppt PowerPoint Presentation Professional Visuals
Presenting this set of slides with name location geography ppt powerpoint presentation professional visuals. This is a five stage process. The stages in this process are location, information, geography, management, strategy. This is a completely editable PowerPoint presentation and is available for immediate download. Download now and impress your audience.
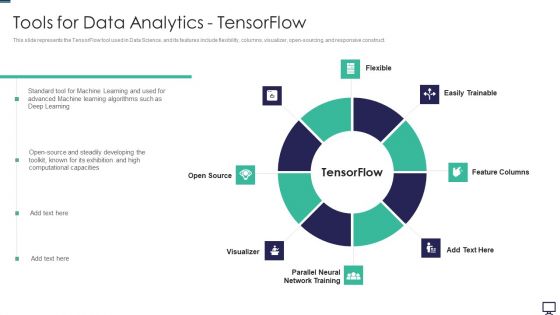
Tools For Data Analytics Tensorflow Ppt Model Rules PDF
This slide represents the TensorFlow tool used in Data Science, and its features include flexibility, columns, visualizer, open-sourcing, and responsive construct. Presenting tools for data analytics tensorflow ppt model rules pdf to provide visual cues and insights. Share and navigate important information on eight stages that need your due attention. This template can be used to pitch topics like developing, source. In addtion, this PPT design contains high resolution images, graphics, etc, that are easily editable and available for immediate download.

Online Business Growth Rate Layout Presentation Visuals
This is a online business growth rate layout presentation visuals. This is a six stage process. The stages in this process are business intelligence, transaction, integrated, information, optimized, mobile strategy.
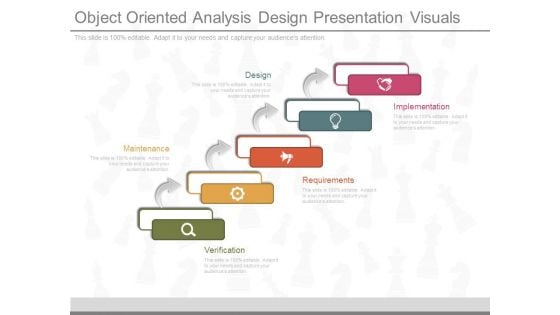
Object Oriented Analysis Design Presentation Visuals
This is a object oriented analysis design presentation visuals. This is a five stage process. The stages in this process are implementation, design, requirements, maintenance, verification.
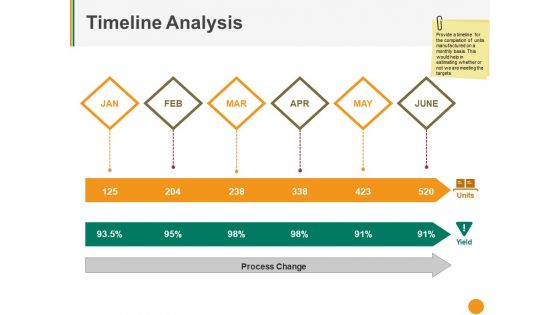
Timeline Analysis Ppt PowerPoint Presentation Summary Visuals
This is a timeline analysis ppt powerpoint presentation summary visuals. This is a six stage process. The stages in this process are process change, percentage, business, timelines.
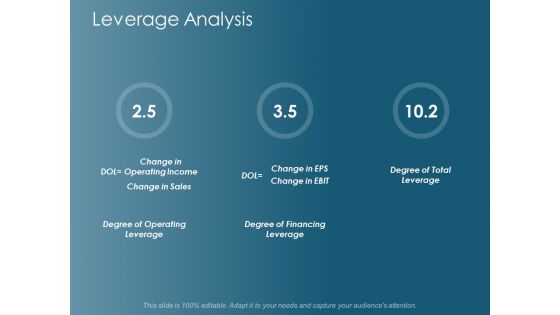
Leverage Analysis Ppt Powerpoint Presentation Model Visuals
This is a leverage analysis ppt powerpoint presentation model visuals. This is a three stage process. The stages in this process are business, management, planning, strategy, marketing.
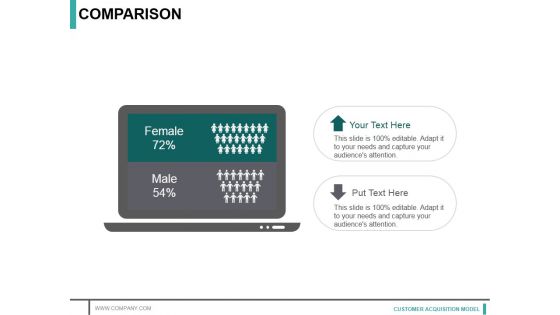
Comparison Ppt PowerPoint Presentation Slides Visuals
This is a comparison ppt powerpoint presentation slides visuals. This is a two stage process. The stages in this process are female, male, compare, percentage, technology.
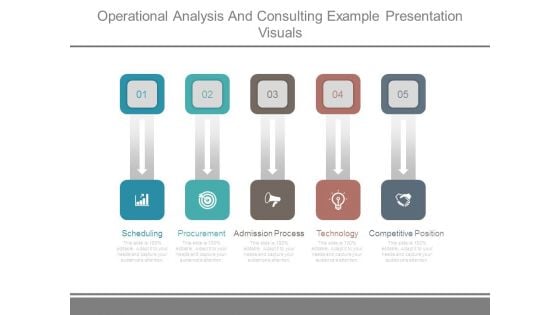
Operational Analysis And Consulting Example Presentation Visuals
This is a operational analysis and consulting example presentation visuals. This is a six stage process. The stages in this process are scheduling, procurement, admission process, technology, competitive position.
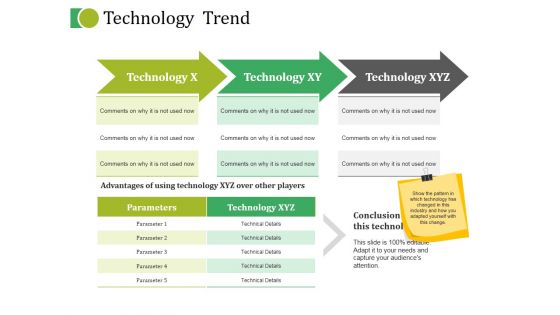
Technology Trend Ppt PowerPoint Presentation Ideas Visuals
This is a technology trend ppt powerpoint presentation ideas visuals. This is a five stage process. The stages in this process are technical details, technology, conclusion of using this technology.
Control Ppt PowerPoint Presentation Slides Visuals
This is a control ppt powerpoint presentation slides visuals. This is a five stage process. The stages in this process are strategy, process, business, marketing, analysis.

Supply Chain Analysis For Sales Presentation Visuals
This is a supply chain analysis for sales presentation visuals. This is a five stage process. The stages in this process are inbound logistics, operations, outbound logistics, marketing and sales, service.
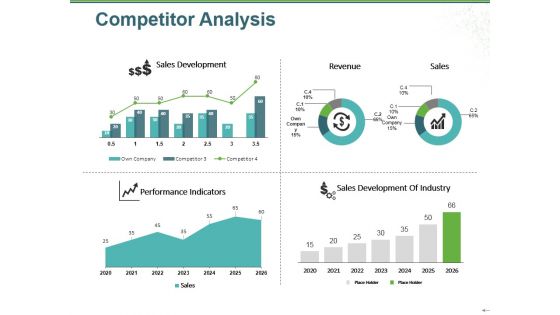
Competitor Analysis Ppt PowerPoint Presentation Pictures Visuals
This is a competitor analysis ppt powerpoint presentation pictures visuals. This is a four stage process. The stages in this process are sales development, performance indicators, sales development of industry, sales, revenue.
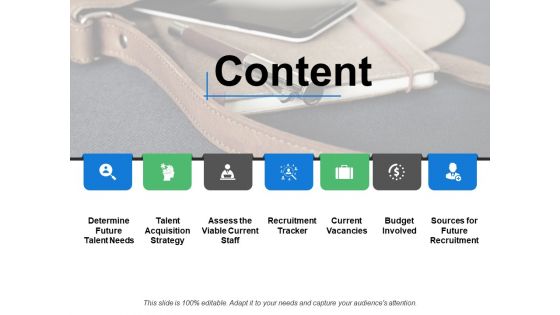
Content Ppt PowerPoint Presentation Inspiration Visuals
This is a content ppt powerpoint presentation inspiration visuals. This is a seven stage process. The stages in this process are current vacancies, budget involved, recruitment tracker.

Competitive Analysis Ppt PowerPoint Presentation Ideas Visuals
This is a competitive analysis ppt powerpoint presentation ideas visuals. This is a two stage process. The stages in this process are own company, competitors, strengths, weaknesses, business.
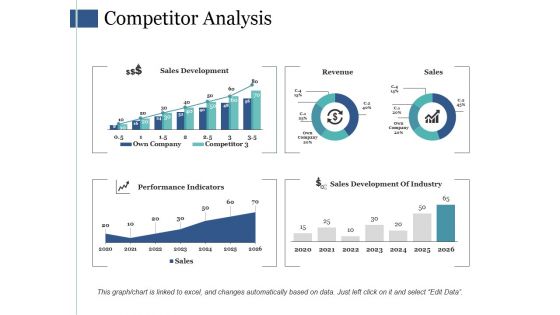
Competitor Analysis Ppt PowerPoint Presentation Slides Visuals
This is a competitor analysis ppt powerpoint presentation slides visuals. This is a four stage process. The stages in this process are sales development, revenue, sales, performance, indicators.


 Continue with Email

 Home
Home


