Data Visualization

Marketing Action Plan For Social Media Platforms Ppt Gallery Visual Aids PDF
This slide represents action plan for social media marketing on various platforms. It covers target audience, type of content and action plan. Welcome to our selection of the Marketing Action Plan For Social Media Platforms Ppt Gallery Visual Aids PDF. These are designed to help you showcase your creativity and bring your sphere to life. Planning and Innovation are essential for any business that is just starting out. This collection contains the designs that you need for your everyday presentations. All of our PowerPoints are 100 percent editable, so you can customize them to suit your needs. This multi purpose template can be used in various situations. Grab these presentation templates today.
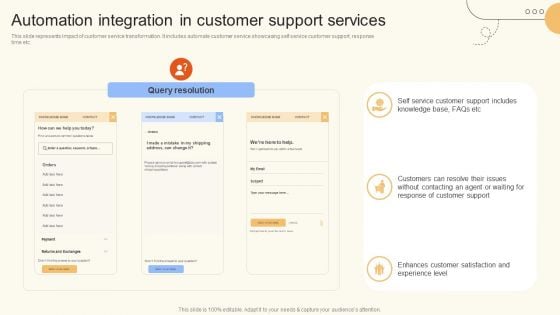
Automation Integration In Customer Support Services Ppt Visual Aids Inspiration PDF
This slide represents impact of customer service transformation. It includes automate customer service showcasing self service customer support, response time etc. Boost your pitch with our creative Automation Integration In Customer Support Services Ppt Visual Aids Inspiration PDF. Deliver an awe inspiring pitch that will mesmerize everyone. Using these presentation templates you will surely catch everyones attention. You can browse the ppts collection on our website. We have researchers who are experts at creating the right content for the templates. So you do not have to invest time in any additional work. Just grab the template now and use them.
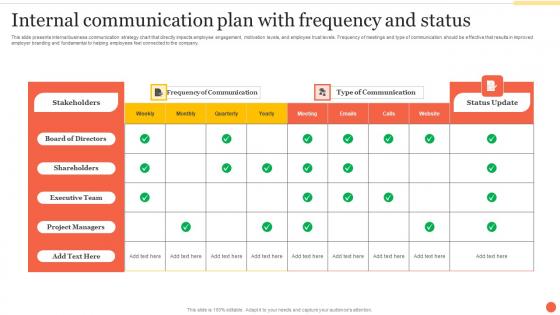
Internal Communication Plan With Frequency And Status Ppt Visual Aids Pictures Pdf
This slide presents internal business communication strategy chart that directly impacts employee engagement, motivation levels, and employee trust levels. Frequency of meetings and type of communication should be effective that results in improved employer branding and fundamental to helping employees feel connected to the company. Showcasing this set of slides titled Internal Communication Plan With Frequency And Status Ppt Visual Aids Pictures Pdf. The topics addressed in these templates are Shareholders, Executive Team, Project Managers. All the content presented in this PPT design is completely editable. Download it and make adjustments in color, background, font etc. as per your unique business setting. This slide presents internal business communication strategy chart that directly impacts employee engagement, motivation levels, and employee trust levels. Frequency of meetings and type of communication should be effective that results in improved employer branding and fundamental to helping employees feel connected to the company.

Lead Metrics For Software Performance Testing Ppt Show Visual Aids Pdf
This slide highlights various key performance indicators to track and calculate product success in market. It includes key metrics such as net promoter score, client retention rate, active user percentage, customer lifetime value and churn rate. Showcasing this set of slides titled Lead Metrics For Software Performance Testing Ppt Show Visual Aids Pdf. The topics addressed in these templates are Client Retention Rate, Active User Percentage, Customer Lifetime. All the content presented in this PPT design is completely editable. Download it and make adjustments in color, background, font etc. as per your unique business setting. This slide highlights various key performance indicators to track and calculate product success in market. It includes key metrics such as net promoter score, client retention rate, active user percentage, customer lifetime value and churn rate.
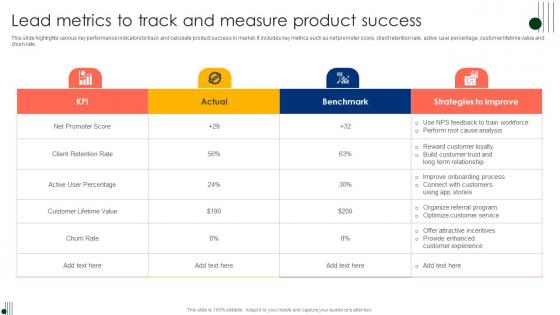
Lead Metrics To Track And Measure Product Success Ppt Visual Aids Ideas Pdf
This slide highlights various key performance indicators to track and calculate product success in market. It includes key metrics such as net promoter score, client retention rate, active user percentage, customer lifetime value and churn rate. Showcasing this set of slides titled Lead Metrics To Track And Measure Product Success Ppt Visual Aids Ideas Pdf. The topics addressed in these templates are Client Retention Rate, Active User Percentage, Customer Lifetime. All the content presented in this PPT design is completely editable. Download it and make adjustments in color, background, font etc. as per your unique business setting. This slide highlights various key performance indicators to track and calculate product success in market. It includes key metrics such as net promoter score, client retention rate, active user percentage, customer lifetime value and churn rate.

Merchandising Of Eatables Visual Graphics Ppt PowerPoint Presentation Complete Deck With Slides
If designing a presentation takes a lot of your time and resources and you are looking for a better alternative, then this merchandising of eatables visual graphics ppt powerpoint presentation complete deck with slides is the right fit for you. This is a prefabricated set that can help you deliver a great presentation on the topic. All the twelve slides included in this sample template can be used to present a birds-eye view of the topic. These slides are also fully editable, giving you enough freedom to add specific details to make this layout more suited to your business setting. Apart from the content, all other elements like color, design, theme are also replaceable and editable. This helps in designing a variety of presentations with a single layout. Not only this, you can use this PPT design in formats like PDF, PNG, and JPG once downloaded. Therefore, without any further ado, download and utilize this sample presentation as per your liking.

Nutritious Diet Visual Wellness Ppt PowerPoint Presentation Complete Deck With Slides
This nutritious diet visual wellness ppt powerpoint presentation complete deck with slides acts as backup support for your ideas, vision, thoughts, etc. Use it to present a thorough understanding of the topic. This PPT slideshow can be utilized for both in-house and outside presentations depending upon your needs and business demands. Entailing twelve slides with a consistent design and theme, this template will make a solid use case. As it is intuitively designed, it suits every business vertical and industry. All you have to do is make a few tweaks in the content or any other component to design unique presentations. The biggest advantage of this complete deck is that it can be personalized multiple times once downloaded. The color, design, shapes, and other elements are free to modify to add personal touches. You can also insert your logo design in this PPT layout. Therefore a well-thought and crafted presentation can be delivered with ease and precision by downloading this nutritious diet visual wellness ppt powerpoint presentation complete deck with slides PPT slideshow.

Visual Communication Pandemic Mobile Device Ppt PowerPoint Presentation Complete Deck With Slides
Improve your presentation delivery using this visual communication pandemic mobile device ppt powerpoint presentation complete deck with slides. Support your business vision and objectives using this well-structured PPT deck. This template offers a great starting point for delivering beautifully designed presentations on the topic of your choice. Comprising twelve this professionally designed template is all you need to host discussion and meetings with collaborators. Each slide is self-explanatory and equipped with high-quality graphics that can be adjusted to your needs. Therefore, you will face no difficulty in portraying your desired content using this PPT slideshow. This PowerPoint slideshow contains every important element that you need for a great pitch. It is not only editable but also available for immediate download and utilization. The color, font size, background, shapes everything can be modified to create your unique presentation layout. Therefore, download it now.
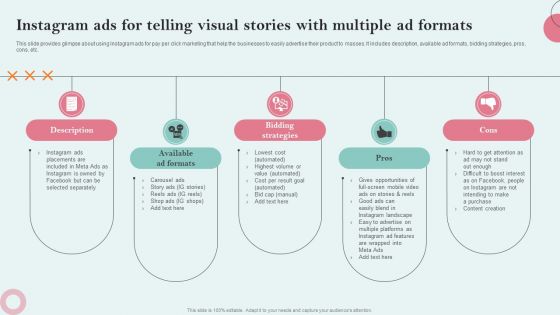
Instagram Ads For Telling Visual Stories With Multiple Ad Formats Slides PDF
This slide provides glimpse about using Instagram ads for pay per click marketing that help the businesses to easily advertise their product to masses. It includes description, available ad formats, bidding strategies, pros, cons, etc. If you are looking for a format to display your unique thoughts, then the professionally designed Bidding Strategies, Available Ad Formats, Pros is the one for you. You can use it as a Google Slides template or a PowerPoint template. Incorporate impressive visuals, symbols, images, and other charts. Modify or reorganize the text boxes as you desire. Experiment with shade schemes and font pairings. Alter, share or cooperate with other people on your work. Download Bidding Strategies, Available Ad Formats, Pros and find out how to give a successful presentation. Present a perfect display to your team and make your presentation unforgettable.
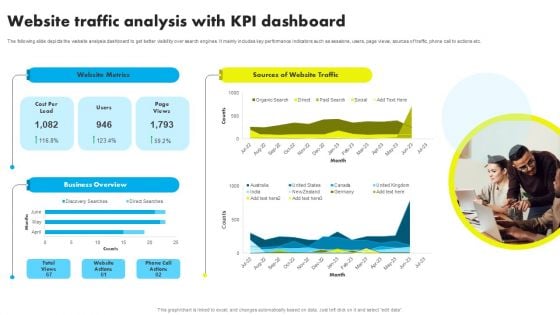
Website Traffic Analysis With KPI Dashboard Ppt Visual Aids Slides PDF

Manager Assessing Business Insurance Claim Dashboard Ppt PowerPoint Presentation Portfolio Visual Aids PDF
Persuade your audience using this manager assessing business insurance claim dashboard ppt powerpoint presentation gallery grid pdf. This PPT design covers two stages, thus making it a great tool to use. It also caters to a variety of topics including manager assessing business insurance claim dashboard. Download this PPT design now to present a convincing pitch that not only emphasizes the topic but also showcases your presentation skills.
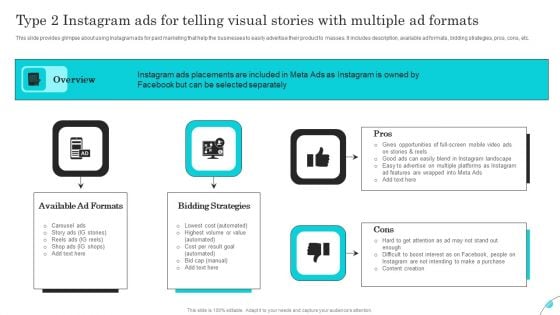
Type 2 Instagram Ads For Telling Visual Stories With Multiple Ad Formats Brochure PDF
This slide provides glimpse about using Instagram ads for paid marketing that help the businesses to easily advertise their product to masses. It includes description, available ad formats, bidding strategies, pros, cons, etc. Slidegeeks is here to make your presentations a breeze with Type 2 Instagram Ads For Telling Visual Stories With Multiple Ad Formats Brochure PDF With our easy to use and customizable templates, you can focus on delivering your ideas rather than worrying about formatting. With a variety of designs to choose from, you are sure to find one that suits your needs. And with animations and unique photos, illustrations, and fonts, you can make your presentation pop. So whether you are giving a sales pitch or presenting to the board, make sure to check out Slidegeeks first.

Digital Asset Management In Visual World Ppt PowerPoint Presentation Complete Deck With Slides
This complete presentation has PPT slides on wide range of topics highlighting the core areas of your business needs. It has professionally designed templates with relevant visuals and subject driven content. This presentation deck has total off thrity nine slides. Get access to the customizable templates. Our designers have created editable templates for your convenience. You can edit the colour, text and font size as per your need. You can add or delete the content if required. You are just a click to away to have this ready made presentation. Click the download button now.
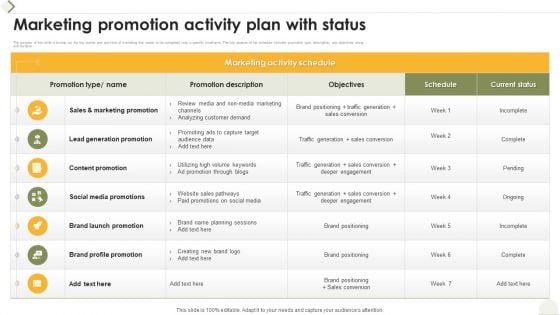
Marketing Promotion Activity Plan With Status Ppt Gallery Visual Aids PDF
The purpose of this slide is to map out the key events and activities of marketing that needs to be completed over a specific timeframe. The key aspects of the schedule includes promotion type, description, and objectives along with duration. Showcasing this set of slides titled Retail Business Marketing Plan Calendar Icon Ppt Model Themes PDF. The topics addressed in these templates are Lead Generation Promotion, Content Promotion, Social Media Promotions. All the content presented in this PPT design is completely editable. Download it and make adjustments in color, background, font etc. as per your unique business setting.
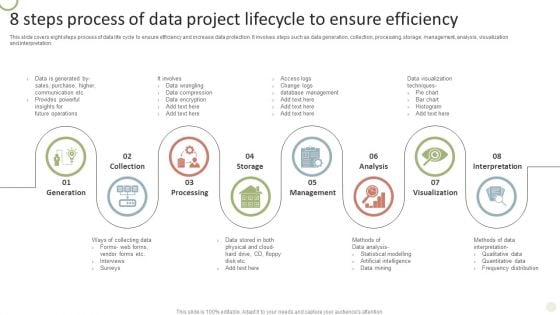
8 Steps Process Of Data Project Lifecycle To Ensure Efficiency Professional PDF
This slide covers eight steps process of data life cycle to ensure efficiency and increase data protection. It involves steps such as data generation, collection, processing, storage, management, analysis, visualization and interpretation.Presenting 8 Steps Process Of Data Project Lifecycle To Ensure Efficiency Professional PDF to dispense important information. This template comprises eights stages. It also presents valuable insights into the topics including Provides Powerful, Data Wrangling, Data Compression. This is a completely customizable PowerPoint theme that can be put to use immediately. So, download it and address the topic impactfully.
How To Use Big Data To Drive Business Developing Strategic Insights Using Big Data Analytics SS V
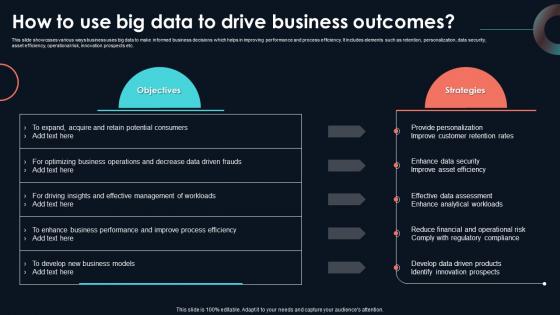
This slide showcases various ways business uses big data to make informed business decisions which helps in improving performance and process efficiency. It includes elements such as retention, personalization, data security, asset efficiency, operational risk, innovation prospects etc. Here you can discover an assortment of the finest PowerPoint and Google Slides templates. With these templates, you can create presentations for a variety of purposes while simultaneously providing your audience with an eye-catching visual experience. Download How To Use Big Data To Drive Business Developing Strategic Insights Using Big Data Analytics SS V to deliver an impeccable presentation. These templates will make your job of preparing presentations much quicker, yet still, maintain a high level of quality. Slidegeeks has experienced researchers who prepare these templates and write high-quality content for you. Later on, you can personalize the content by editing the How To Use Big Data To Drive Business Developing Strategic Insights Using Big Data Analytics SS V. This slide showcases various ways business uses big data to make informed business decisions which helps in improving performance and process efficiency. It includes elements such as retention, personalization, data security, asset efficiency, operational risk, innovation prospects etc.
Reasons Why Businesses Require Prescriptive Analytics Data Analytics SS V
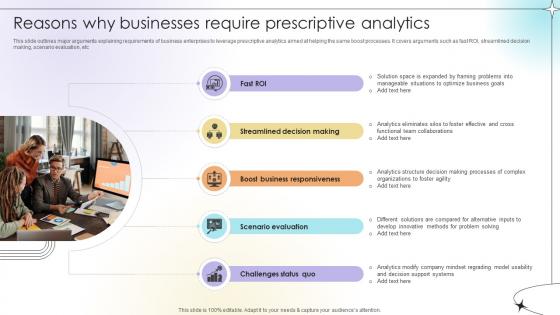
This slide outlines major arguments explaining requirements of business enterprises to leverage prescriptive analytics aimed at helping the same boost processes. It covers arguments such as fast ROI, streamlined decision making, scenario evaluation, etc.Here you can discover an assortment of the finest PowerPoint and Google Slides templates. With these templates, you can create presentations for a variety of purposes while simultaneously providing your audience with an eye-catching visual experience. Download Reasons Why Businesses Require Prescriptive Analytics Data Analytics SS V to deliver an impeccable presentation. These templates will make your job of preparing presentations much quicker, yet still, maintain a high level of quality. Slidegeeks has experienced researchers who prepare these templates and write high-quality content for you. Later on, you can personalize the content by editing the Reasons Why Businesses Require Prescriptive Analytics Data Analytics SS V. This slide outlines major arguments explaining requirements of business enterprises to leverage prescriptive analytics aimed at helping the same boost processes. It covers arguments such as fast ROI, streamlined decision making, scenario evaluation, etc.
Create Customer Data Platform Comprehensive CDP Guide For Promoters Designs Pdf
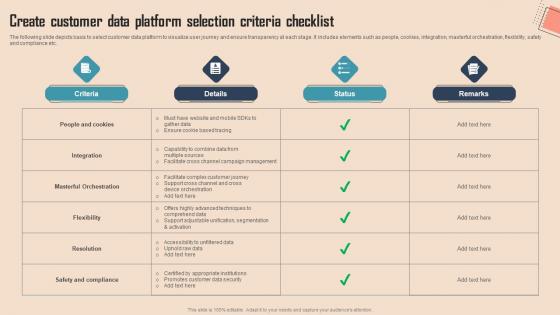
The following slide depicts basis to select customer data platform to visualize user journey and ensure transparency at each stage. It includes elements such as people, cookies, integration, masterful orchestration, flexibility, safety and compliance etc.Slidegeeks is one of the best resources for PowerPoint templates. You can download easily and regulate Create Customer Data Platform Comprehensive CDP Guide For Promoters Designs Pdf for your personal presentations from our wonderful collection. A few clicks is all it takes to discover and get the most relevant and appropriate templates. Use our Templates to add a unique zing and appeal to your presentation and meetings. All the slides are easy to edit and you can use them even for advertisement purposes. The following slide depicts basis to select customer data platform to visualize user journey and ensure transparency at each stage. It includes elements such as people, cookies, integration, masterful orchestration, flexibility, safety and compliance etc.
Create Customer Data Platform Selection Usability Of CDP Software Tool Microsoft Pdf
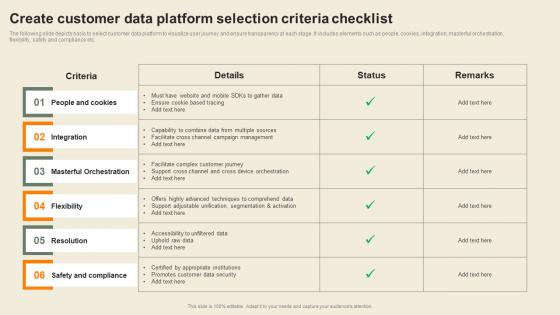
The following slide depicts basis to select customer data platform to visualize user journey and ensure transparency at each stage. It includes elements such as people, cookies, integration, masterful orchestration, flexibility, safety and compliance etc. Slidegeeks is here to make your presentations a breeze with Create Customer Data Platform Selection Usability Of CDP Software Tool Microsoft Pdf With our easy-to-use and customizable templates, you can focus on delivering your ideas rather than worrying about formatting. With a variety of designs to choose from, you are sure to find one that suits your needs. And with animations and unique photos, illustrations, and fonts, you can make your presentation pop. So whether you are giving a sales pitch or presenting to the board, make sure to check out Slidegeeks first The following slide depicts basis to select customer data platform to visualize user journey and ensure transparency at each stage. It includes elements such as people, cookies, integration, masterful orchestration, flexibility, safety and compliance etc.
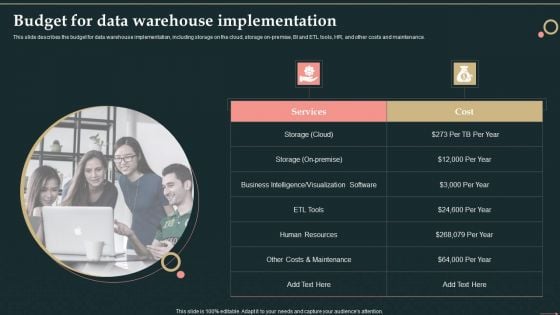
Management Information System Budget For Data Warehouse Implementation Mockup PDF
This slide describes the budget for data warehouse implementation, including storage on the cloud, storage on-premise, BI and ETL tools, HR, and other costs and maintenance.This is a Management Information System Budget For Data Warehouse Implementation Mockup PDF template with various stages. Focus and dispense information on one stage using this creative set, that comes with editable features. It contains large content boxes to add your information on topics like Business Intelligence, Visualization Software, Human Resources . You can also showcase facts, figures, and other relevant content using this PPT layout. Grab it now.

Horizontal Scaling Technique For Information Dashboard For Data Repository Monitoring Designs PDF
This slide presents the dashboard for effective monitoring of the data repository. It visually shows the information regarding the databases throughput, response time, query type, error code, etc.Deliver an awe inspiring pitch with this creative Horizontal Scaling Technique For Information Dashboard For Data Repository Monitoring Designs PDF bundle. Topics like Database Throughput, Average Database Response, Database Connections can be discussed with this completely editable template. It is available for immediate download depending on the needs and requirements of the user.
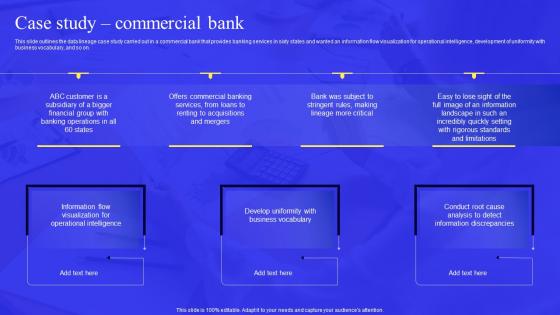
Business Process Data Lineage Case Study Commercial Bank Microsoft Pdf
This slide outlines the data lineage case study carried out in a commercial bank that provides banking services in sixty states and wanted an information flow visualization for operational intelligence, development of uniformity with business vocabulary, and so on. Do you have to make sure that everyone on your team knows about any specific topic I yes, then you should give Business Process Data Lineage Case Study Commercial Bank Microsoft Pdf a try. Our experts have put a lot of knowledge and effort into creating this impeccable Business Process Data Lineage Case Study Commercial Bank Microsoft Pdf. You can use this template for your upcoming presentations, as the slides are perfect to represent even the tiniest detail. You can download these templates from the Slidegeeks website and these are easy to edit. So grab these today This slide outlines the data lineage case study carried out in a commercial bank that provides banking services in sixty states and wanted an information flow visualization for operational intelligence, development of uniformity with business vocabulary, and so on.
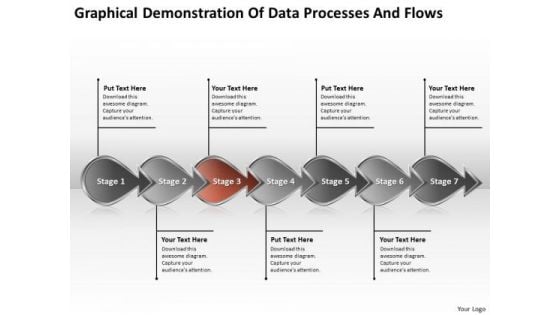
Demonstration Of Data Processes And Flows Business Flowcharting PowerPoint Templates
We present our demonstration of data processes and flows business flowcharting PowerPoint templates.Use our Leadership PowerPoint Templates because you can Raise your Company stocks at the Opening Bell. Present our Business PowerPoint Templates because you can Flutter your wings and enchant the world. Impress them with the innate attractiveness of your thoughts and words. Present our Arrows PowerPoint Templates because with the help of our Slides you can Illustrate your plans to your listeners with the same accuracy. Present our Marketing PowerPoint Templates because you can Determine your targets and sequence them as per your priorities. Present our Process and Flows PowerPoint Templates because our template will illustrate what you want to say.Use these PowerPoint slides for presentations relating to Arrow Arrows Block Business Chart Design Development Diagram Direction Element Flow Flowchart Graph Linear Management Organization Process Program Section Sign Solution Symbol. The prominent colors used in the PowerPoint template are Orange, Gray, Black. Use our demonstration of data processes and flows business flowcharting PowerPoint templates are Nifty. Presenters tell us our Direction PowerPoint templates and PPT Slides are Classic. Presenters tell us our demonstration of data processes and flows business flowcharting PowerPoint templates look good visually. You can be sure our Development PowerPoint templates and PPT Slides are Vintage. PowerPoint presentation experts tell us our demonstration of data processes and flows business flowcharting PowerPoint templates are Enchanting. Professionals tell us our Block PowerPoint templates and PPT Slides are Attractive. Exploit our Demonstration Of Data Processes And Flows Business Flowcharting PowerPoint Templates with your ideas. Extract every inch of space on them.
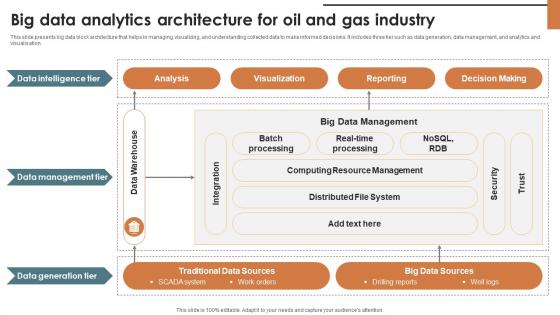
IoT Solutions For Oil Big Data Analytics Architecture For Oil And Gas Industry IoT SS V
This slide presents big data block architecture that helps in managing, visualizing, and understanding collected data to make informed decisions. It includes three tier such as data generation, data management, and analytics and visualisation. From laying roadmaps to briefing everything in detail, our templates are perfect for you. You can set the stage with your presentation slides. All you have to do is download these easy-to-edit and customizable templates. IoT Solutions For Oil Big Data Analytics Architecture For Oil And Gas Industry IoT SS V will help you deliver an outstanding performance that everyone would remember and praise you for. Do download this presentation today. This slide presents big data block architecture that helps in managing, visualizing, and understanding collected data to make informed decisions. It includes three tier such as data generation, data management, and analytics and visualisation.
Data Lineage Methods Case Study Commercial Bank Icons PDF
This slide outlines the data lineage case study carried out in a commercial bank that provides banking services in sixty states and wanted an information flow visualization for operational intelligence, development of uniformity with business vocabulary, and so on. This Data Lineage Methods Case Study Commercial Bank Icons PDF is perfect for any presentation, be it in front of clients or colleagues. It is a versatile and stylish solution for organizing your meetings. The Data Lineage Methods Case Study Commercial Bank Icons PDF features a modern design for your presentation meetings. The adjustable and customizable slides provide unlimited possibilities for acing up your presentation. Slidegeeks has done all the homework before launching the product for you. So, do not wait, grab the presentation templates today
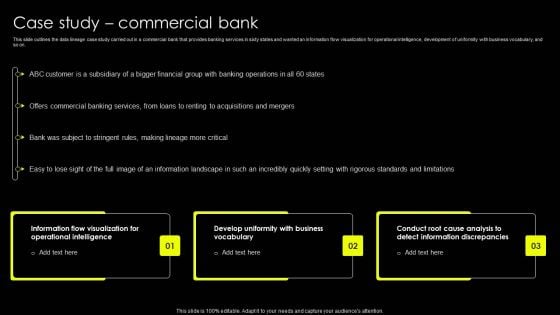
Data Lineage Implementation Case Study Commercial Bank Pictures PDF
This slide outlines the data lineage case study carried out in a commercial bank that provides banking services in sixty states and wanted an information flow visualization for operational intelligence, development of uniformity with business vocabulary, and so on. Do you have to make sure that everyone on your team knows about any specific topic I yes, then you should give Data Lineage Implementation Case Study Commercial Bank Pictures PDF a try. Our experts have put a lot of knowledge and effort into creating this impeccable Data Lineage Implementation Case Study Commercial Bank Pictures PDF. You can use this template for your upcoming presentations, as the slides are perfect to represent even the tiniest detail. You can download these templates from the Slidegeeks website and these are easy to edit. So grab these today.
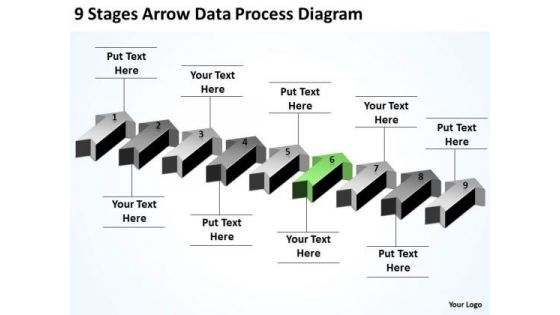
Parallel Data Processing 9 Stages Arrow Diagram PowerPoint Slides
We present our parallel data processing 9 stages arrow diagram PowerPoint Slides.Download and present our Arrows PowerPoint Templates because You should Press the right buttons with our PowerPoint Templates and Slides. They will take your ideas down the perfect channel. Download and present our Steps PowerPoint Templates because It will Give impetus to the hopes of your colleagues. Our PowerPoint Templates and Slides will aid you in winning their trust. Use our Process and Flows PowerPoint Templates because Our PowerPoint Templates and Slides will generate and maintain the level of interest you desire. They will create the impression you want to imprint on your audience. Use our Future PowerPoint Templates because It will Raise the bar of your Thoughts. They are programmed to take you to the next level. Download and present our Flow Charts PowerPoint Templates because It can be used to Set your controls for the heart of the sun. Our PowerPoint Templates and Slides will be the propellant to get you there.Use these PowerPoint slides for presentations relating to Advertising, arrow, blue, concept,creative, design, direction, flow, green,illustration, increase, infographic,instruction, label, layout, manual,modern, number, offer, one, options,order, page, paper, pointer, product,progress, promotion, sequence, simple,special, step, symbol. The prominent colors used in the PowerPoint template are Green lime, White, Gray. Presenters tell us our parallel data processing 9 stages arrow diagram PowerPoint Slides are visually appealing. Presenters tell us our concept PowerPoint templates and PPT Slides will make you look like a winner. Customers tell us our parallel data processing 9 stages arrow diagram PowerPoint Slides will impress their bosses and teams. Use our green PowerPoint templates and PPT Slides are second to none. Customers tell us our parallel data processing 9 stages arrow diagram PowerPoint Slides effectively help you save your valuable time. Presenters tell us our concept PowerPoint templates and PPT Slides are incredible easy to use. Excellence is an article of faith with our Parallel Data Processing 9 Stages Arrow Diagram PowerPoint Slides team. They give their all and more to achieve it.
Six Months Roadmap For Data Rationalization With Testing Plans Icons
A well thought out action plan makes execution easier and increases the possibility of success significantly. Ensure hitting all the milestones within the deadlines by introducing our fully customizable six months roadmap for data rationalization with testing plans icons. Streamline the work related information, budget, timeframe, key deliverable, landmarks, and major steps involved, all in one place to give an organized overview of the project by utilizing our PowerPoint theme. Minimize time lag and increase work efficiency by providing insight into the process with our comprehensively researched roadmap PowerPoint layout. Color coding helps in highlighting the process and grabs the attention of the audience. Download our handy six months roadmap for data rationalization with testing plans icons to identify the possible problem areas in a much shorter time and propose solutions. Have a productive brainstorming session with your workforce by utilizing our action plan visualization tool.

Case Study Commercial Bank Deploying Data Lineage IT Introduction PDF
This slide outlines the data lineage case study carried out in a commercial bank that provides banking services in sixty states and wanted an information flow visualization for operational intelligence, development of uniformity with business vocabulary, and so on.Boost your pitch with our creative Case Study Commercial Bank Deploying Data Lineage IT Introduction PDF. Deliver an awe-inspiring pitch that will mesmerize everyone. Using these presentation templates you will surely catch everyones attention. You can browse the ppts collection on our website. We have researchers who are experts at creating the right content for the templates. So you do not have to invest time in any additional work. Just grab the template now and use them.
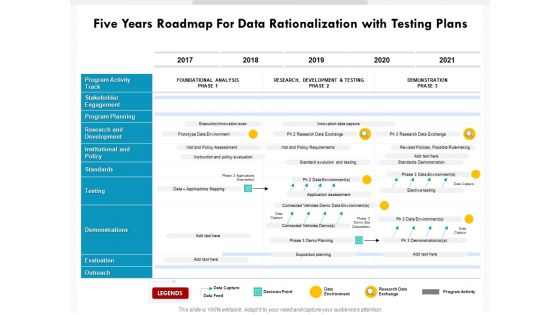
Five Years Roadmap For Data Rationalization With Testing Plans Information
A well thought out action plan makes execution easier and increases the possibility of success significantly. Ensure hitting all the milestones within the deadlines by introducing our fully customizable five years roadmap for data rationalization with testing plans information. Streamline the work related information, budget, timeframe, key deliverable, landmarks, and major steps involved, all in one place to give an organized overview of the project by utilizing our PowerPoint theme. Minimize time lag and increase work efficiency by providing insight into the process with our comprehensively researched roadmap PowerPoint layout. Color coding helps in highlighting the process and grabs the attention of the audience. Download our handy five years roadmap for data rationalization with testing plans information to identify the possible problem areas in a much shorter time and propose solutions. Have a productive brainstorming session with your workforce by utilizing our action plan visualization tool.

Quarterly Roadmap For Data Rationalization With Testing Plans Ideas
A well thought out action plan makes execution easier and increases the possibility of success significantly. Ensure hitting all the milestones within the deadlines by introducing our fully customizable quarterly roadmap for data rationalization with testing plans ideas. Streamline the work related information, budget, timeframe, key deliverable, landmarks, and major steps involved, all in one place to give an organized overview of the project by utilizing our PowerPoint theme. Minimize time lag and increase work efficiency by providing insight into the process with our comprehensively researched roadmap PowerPoint layout. Color coding helps in highlighting the process and grabs the attention of the audience. Download our handy quarterly roadmap for data rationalization with testing plans ideas to identify the possible problem areas in a much shorter time and propose solutions. Have a productive brainstorming session with your workforce by utilizing our action plan visualization tool.
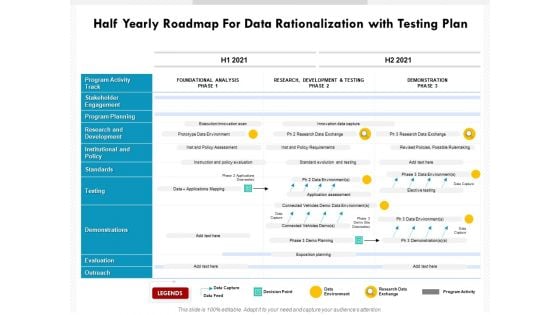
Half Yearly Roadmap For Data Rationalization With Testing Plan Structure
A well thought out action plan makes execution easier and increases the possibility of success significantly. Ensure hitting all the milestones within the deadlines by introducing our fully customizable half yearly roadmap for data rationalization with testing plan structure. Streamline the work related information, budget, timeframe, key deliverable, landmarks, and major steps involved, all in one place to give an organized overview of the project by utilizing our PowerPoint theme. Minimize time lag and increase work efficiency by providing insight into the process with our comprehensively researched roadmap PowerPoint layout. Color coding helps in highlighting the process and grabs the attention of the audience. Download our handy half yearly roadmap for data rationalization with testing plan structure to identify the possible problem areas in a much shorter time and propose solutions. Have a productive brainstorming session with your workforce by utilizing our action plan visualization tool.
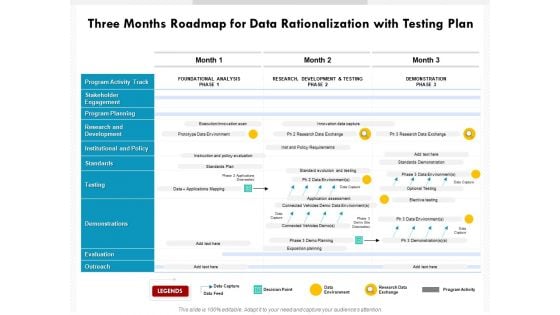
Three Months Roadmap For Data Rationalization With Testing Plan Designs
A well thought out action plan makes execution easier and increases the possibility of success significantly. Ensure hitting all the milestones within the deadlines by introducing our fully customizable three months roadmap for data rationalization with testing plan designs. Streamline the work related information, budget, timeframe, key deliverable, landmarks, and major steps involved, all in one place to give an organized overview of the project by utilizing our PowerPoint theme. Minimize time lag and increase work efficiency by providing insight into the process with our comprehensively researched roadmap PowerPoint layout. Color coding helps in highlighting the process and grabs the attention of the audience. Download our handy three months roadmap for data rationalization with testing plan designs to identify the possible problem areas in a much shorter time and propose solutions. Have a productive brainstorming session with your workforce by utilizing our action plan visualization tool.
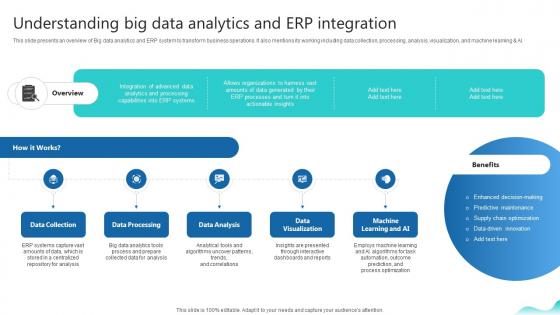
Understanding Big Data Analytics And Erp Integration Erp And Digital Transformation For Maximizing DT SS V
This slide presents an overview of Big data analytics and ERP system to transform business operations. It also mentions its working including data collection, processing, analysis, visualization, and machine learning and AI.There are so many reasons you need a Understanding Big Data Analytics And Erp Integration Erp And Digital Transformation For Maximizing DT SS V. The first reason is you can not spend time making everything from scratch, Thus, Slidegeeks has made presentation templates for you too. You can easily download these templates from our website easily. This slide presents an overview of Big data analytics and ERP system to transform business operations. It also mentions its working including data collection, processing, analysis, visualization, and machine learning and AI.
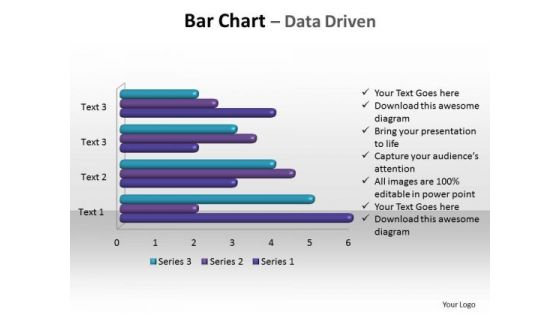
Business Sales PowerPoint Templates Business Bar Chart Data Driven Ppt Slides
Business Sales PowerPoint Templates Business bar chart data driven PPT Slides-This PowerPoint d Editable Data-Driven Chart is for visualizing your figures and data. Business Sales PowerPoint Templates Business bar chart data driven PPT Slides-This ppt can be used for concepts relating to-Chat, Illustration, data driven, figures, charts and Graphs. Set the audience alight with our Business Sales PowerPoint Templates Business Bar Chart Data Driven Ppt Slides. You will come up with a cracker of an idea.
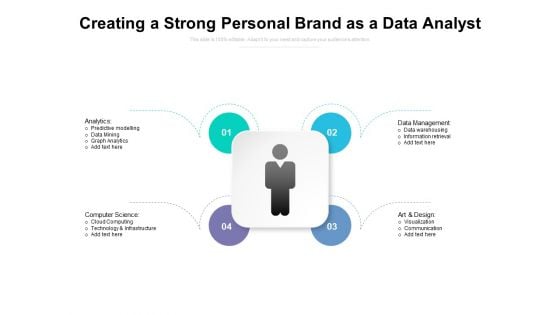
Creating A Strong Personal Brand As A Data Analyst Ppt PowerPoint Presentation Infographics Structure PDF
Presenting this set of slides with name creating a strong personal brand as a data analyst ppt powerpoint presentation infographics structure pdf. This is a four stage process. The stages in this process are analytics, data management, computer science, art and design, predictive modelling, data mining, graph analytics, cloud computing, technology and infrastructure, data warehousing, information retrieval, visualization, communication. This is a completely editable PowerPoint presentation and is available for immediate download. Download now and impress your audience.
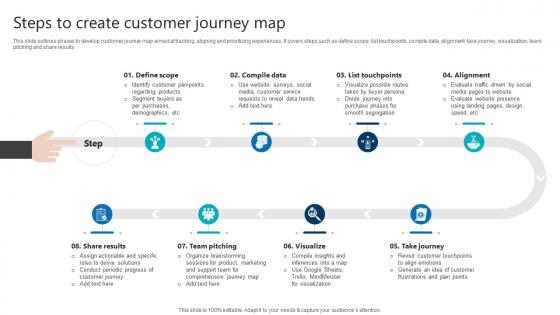
Steps To Create Customer Journey Map Product Analytics Implementation Data Analytics V
This slide outlines phases to develop customer journey map aimed at tracking, aligning and prioritizing experiences. It covers steps such as define scope, list touchpoints, compile data, alignment, take journey, visualization, team pitching and share results Welcome to our selection of the Steps To Create Customer Journey Map Product Analytics Implementation Data Analytics V. These are designed to help you showcase your creativity and bring your sphere to life. Planning and Innovation are essential for any business that is just starting out. This collection contains the designs that you need for your everyday presentations. All of our PowerPoints are 100 percent editable, so you can customize them to suit your needs. This multi-purpose template can be used in various situations. Grab these presentation templates today. This slide outlines phases to develop customer journey map aimed at tracking, aligning and prioritizing experiences. It covers steps such as define scope, list touchpoints, compile data, alignment, take journey, visualization, team pitching and share results
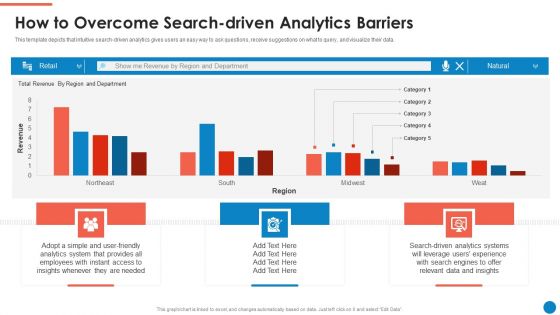
Data And Analytics Playbook How To Overcome Search Driven Analytics Barriers Template PDF
This template depicts that intuitive search-driven analytics gives users an easy way to ask questions, receive suggestions on what to query, and visualize their data. Deliver and pitch your topic in the best possible manner with this Data And Analytics Playbook How To Overcome Search Driven Analytics Barriers Template PDF. Use them to share invaluable insights on Total Revenue, Region And Department, Revenue and impress your audience. This template can be altered and modified as per your expectations. So, grab it now.
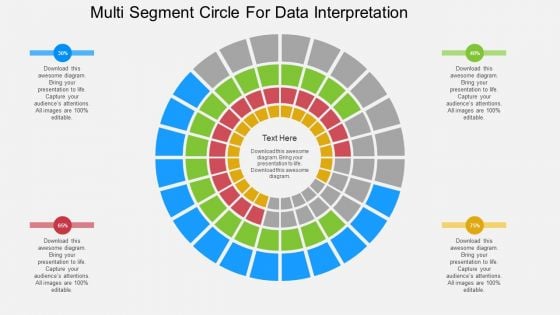
Multi Segment Circle For Data Interpretation Powerpoint Template
This PowerPoint template has been designed with circular web diagram. This diagram is useful to display outline of a business plan. Visual effect helps in maintaining the flow of the discussion and provides more clarity to the subject.
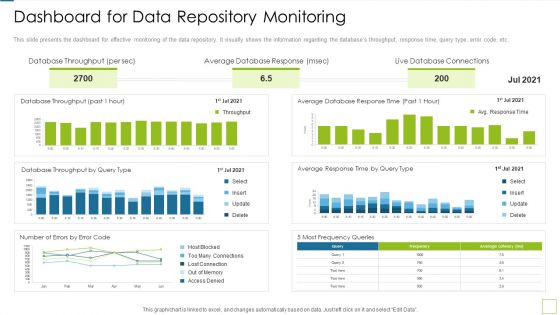
Database Expansion And Optimization Dashboard For Data Repository Monitoring Ppt Model Infographic Template
This slide presents the dashboard for effective monitoring of the data repository. It visually shows the information regarding the databases throughput, response time, query type, error code, etc. Deliver and pitch your topic in the best possible manner with this database expansion and optimization dashboard for data repository monitoring ppt model infographic template. Use them to share invaluable insights on database throughput, average database response, live database connections and impress your audience. This template can be altered and modified as per your expectations. So, grab it now.
Tactical Plan For Upgrading DBMS Dashboard For Data Repository Monitoring Diagrams PDF
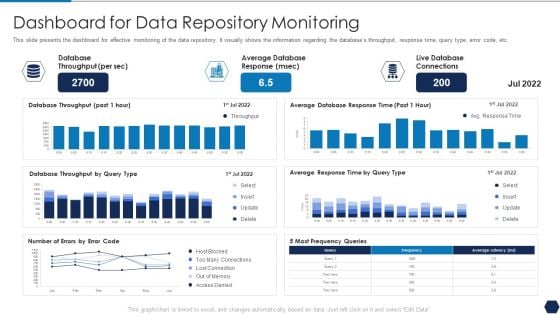
This slide presents the dashboard for effective monitoring of the data repository. It visually shows the information regarding the databases throughput, response time, query type, error code, etc. Deliver and pitch your topic in the best possible manner with this tactical plan for upgrading dbms dashboard for data repository monitoring diagrams pdf. Use them to share invaluable insights on database throughput, average database response, live database connections and impress your audience. This template can be altered and modified as per your expectations. So, grab it now.
Platform Engineering PowerPoint Template Slides Cloud Vs Traditional Data Centers Themes PDF
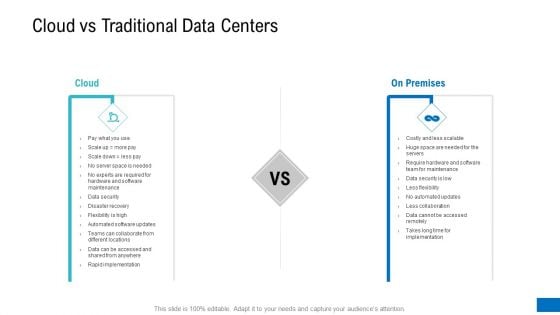
Presenting platform engineering powerpoint template slides cloud vs traditional data centers themes pdf. to provide visual cues and insights. Share and navigate important information on two stages that need your due attention. This template can be used to pitch topics like cloud, on premises. In addtion, this PPT design contains high resolution images, graphics, etc, that are easily editable and available for immediate download.
ETL Repository Big Data Integration Ppt PowerPoint Presentation Ideas Outline PDF
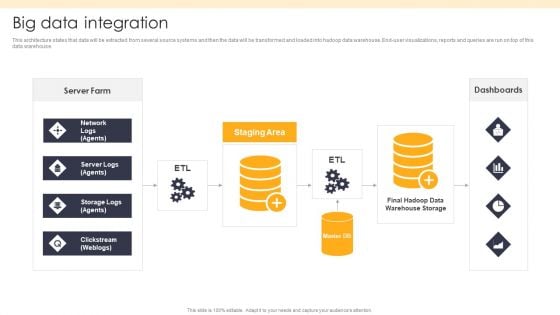
This architecture states that data will be extracted from several source systems and then the data will be transformed and loaded into hadoop data warehouse. End-user visualizations, reports and queries are run on top of this data warehouse.Deliver and pitch your topic in the best possible manner with this ETL Repository Big Data Integration Ppt PowerPoint Presentation Ideas Outline PDF. Use them to share invaluable insights on Server Farm, Staging Area, Dashboards and impress your audience. This template can be altered and modified as per your expectations. So, grab it now.
Data And Analytics Ppt PowerPoint Presentation Icon Layouts Cpb
This is a data and analytics ppt powerpoint presentation icon layouts cpb. This is a five stage process. The stages in this process are data and analytics.
Threat Administration Bundle Organization Risk Assessment And Tracking Log Data Designs PDF
Presenting threat administration bundle organization risk assessment and tracking log data designs pdf to provide visual cues and insights. Share and navigate important information on one stages that need your due attention. This template can be used to pitch topics like analysis, prototype, monitor, inadequate team, data collection inaccurate. In addtion, this PPT design contains high resolution images, graphics, etc, that are easily editable and available for immediate download.
Big Data Processing Application Ppt PowerPoint Presentation Shapes
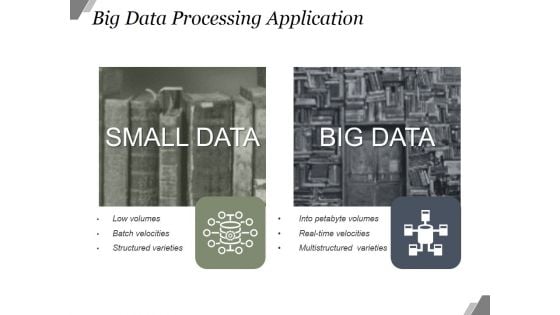
This is a big data processing application ppt powerpoint presentation shapes. This is a two stage process. The stages in this process are small data, big data, low volumes, batch velocities, structured varieties, into petabyte volumes.
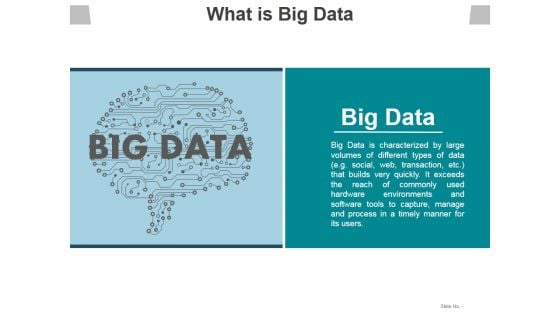
What Is Big Data Ppt PowerPoint Presentation Styles Background
This is a what is big data ppt powerpoint presentation styles background. This is a one stage process. The stages in this process are big data, data analysis, business, marketing, management.

Cloud Services Best Practices Marketing Plan Agenda Determine Your Cloud Journey With Us Data Template PDF
Presenting cloud services best practices marketing plan agenda determine your cloud journey with us data template pdf to provide visual cues and insights. Share and navigate important information on six stages that need your due attention. This template can be used to pitch topics like data center, cloud strategy, management, secure, modernize. In addtion, this PPT design contains high resolution images, graphics, etc, that are easily editable and available for immediate download.

Introduction To Big Data Analytics Technology Advanced Tools For Hyperautomation Ppt Designs Pdf
This slide represents the introduction of big data analytics, including the complete data handling process, such as data collection, storage, research, analysis, visualization, volume, and network. It also caters to the critical Vs and benefits of big data. Slidegeeks has constructed Introduction To Big Data Analytics Technology Advanced Tools For Hyperautomation Ppt Designs Pdf after conducting extensive research and examination. These presentation templates are constantly being generated and modified based on user preferences and critiques from editors. Here, you will find the most attractive templates for a range of purposes while taking into account ratings and remarks from users regarding the content. This is an excellent jumping-off point to explore our content and will give new users an insight into our top-notch PowerPoint Templates. This slide represents the introduction of big data analytics, including the complete data handling process, such as data collection, storage, research, analysis, visualization, volume, and network. It also caters to the critical Vs and benefits of big data.
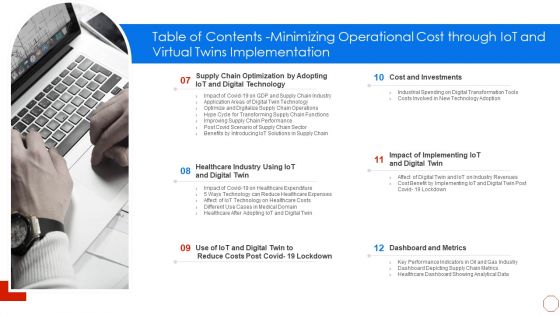
Table Of Contents Minimizing Operational Cost Through Iot And Virtual Twins Implementation Data Mockup PDF
Presenting table of contents minimizing operational cost through iot and virtual twins implementation data mockup pdf to provide visual cues and insights. Share and navigate important information on six stages that need your due attention. This template can be used to pitch topics like analysis, industries, technology, roadmap. In addtion, this PPT design contains high resolution images, graphics, etc, that are easily editable and available for immediate download.
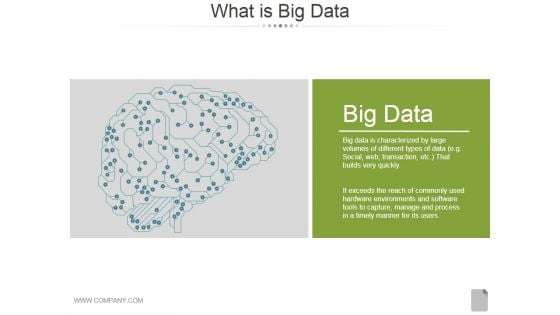
What Is Big Data Ppt PowerPoint Presentation Diagrams
This is a what is big data ppt powerpoint presentation diagrams. This is a one stage process. The stages in this process are big data, business, analysis, management, marketing.
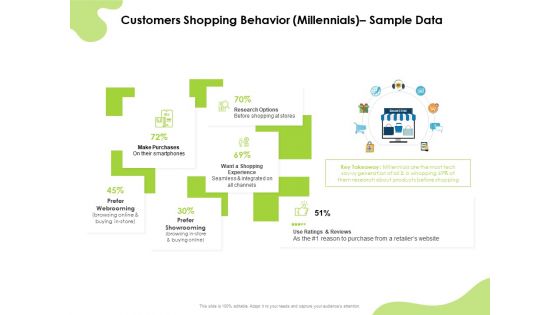
Reach Your Target Audience Customers Shopping Behavior Millennials Sample Data Guidelines PDF
Presenting reach your target audience customers shopping behavior millennials sample data guidelines pdf to provide visual cues and insights. Share and navigate important information on six stages that need your due attention. This template can be used to pitch topics like research options, prefer showrooming, prefer webrooming, make purchases, shopping experience. In addition, this PPT design contains high-resolution images, graphics, etc, that are easily editable and available for immediate download.
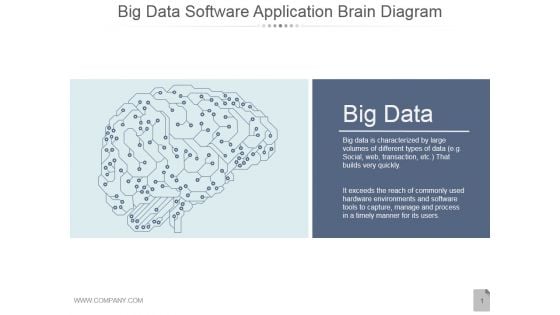
Big Data Software Application Brain Diagram Ppt PowerPoint Presentation Slides
This is a big data software application brain diagram ppt powerpoint presentation slides. This is a one stage process. The stages in this process are big data, communication, business, marketing, idea.
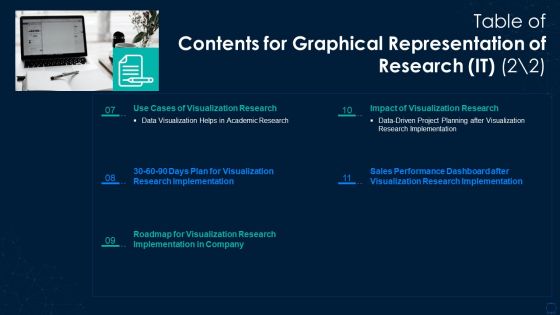
Table Of Contents For Graphical Representation Of Research IT Data Elements PDF
Presenting table of contents for graphical representation of research it data elements pdf to provide visual cues and insights. Share and navigate important information on five stages that need your due attention. This template can be used to pitch topics like implementation, plan, sales performance. In addtion, this PPT design contains high resolution images, graphics, etc, that are easily editable and available for immediate download.
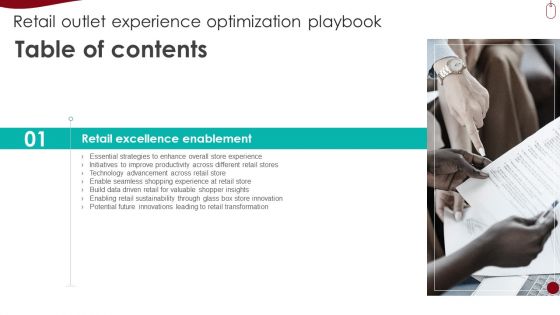
Table Of Contents Retail Outlet Experience Optimization Playbook Data Slides PDF
Presenting Table Of Contents Retail Outlet Experience Optimization Playbook Data Slides PDF to provide visual cues and insights. Share and navigate important information on one stages that need your due attention. This template can be used to pitch topics like Enabling Retail Sustainability, Retail Transformation, Essential Strategies. In addtion, this PPT design contains high resolution images, graphics, etc, that are easily editable and available for immediate download.
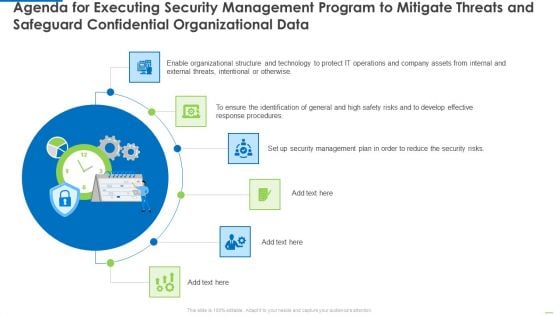
Agenda For Executing Security Management Program To Mitigate Threats And Safeguard Confidential Organizational Data Clipart PDF
Presenting Agenda for executing security management program to mitigate threats and safeguard confidential organizational data clipart pdf to provide visual cues and insights. Share and navigate important information on six stages that need your due attention. This template can be used to pitch topics like effective response procedures, intentional or otherwise, enable organizational. In addtion, this PPT design contains high resolution images, graphics, etc, that are easily editable and available for immediate download.
Graphical Representation Of Research IT Data Driven Project Planning Structure PDF
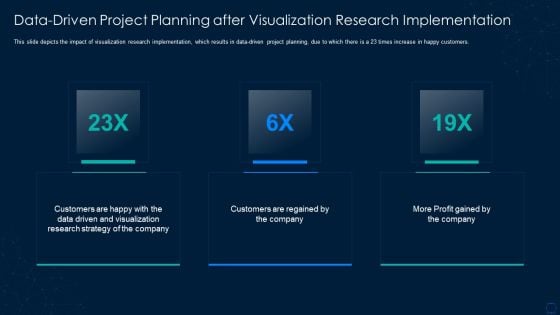
This slide depicts the impact of visualization research implementation, which results in data driven project planning, due to which there is a 23 times increase in happy customers. This is a graphical representation of research it data driven project planning structure pdf template with various stages. Focus and dispense information on three stages using this creative set, that comes with editable features. It contains large content boxes to add your information on topics like profit, customers, strategy. You can also showcase facts, figures, and other relevant content using this PPT layout. Grab it now.
Four Staged Numeric Tags For Data Representation Powerpoint Template
Our above PowerPoint slide contains diagram of four numeric tags. Download this business slide for data representations. Use this diagram to impart more clarity to data and to create more sound impact on viewers.
Arrow Infographics For Financial Data Analysis Powerpoint Template
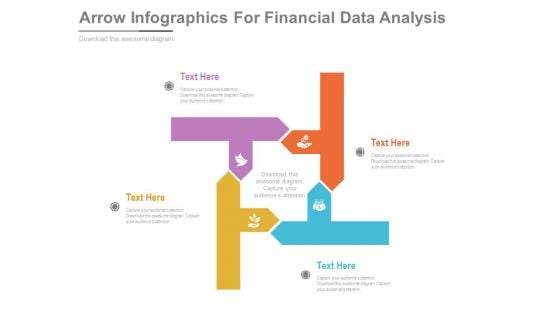
This PowerPoint slide contains diagram of arrows infographic. This professional slide helps to exhibit financial data analysis for business growth. Use this PowerPoint template to make impressive presentations.
Business Data Analytics Process Ppt PowerPoint Presentation Layout
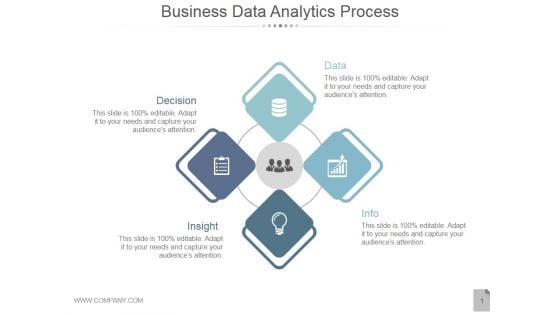
This is a business data analytics process ppt powerpoint presentation layout. This is a four stage process. The stages in this process are decision, data, insight, info.


 Continue with Email

 Home
Home


