Data
Data Quality Technology Project Vector Icon Ppt PowerPoint Presentation Styles Show PDF
Persuade your audience using this data quality technology project vector icon ppt powerpoint presentation styles show pdf. This PPT design covers three stages, thus making it a great tool to use. It also caters to a variety of topics including data quality technology project vector icon. Download this PPT design now to present a convincing pitch that not only emphasizes the topic but also showcases your presentation skills.
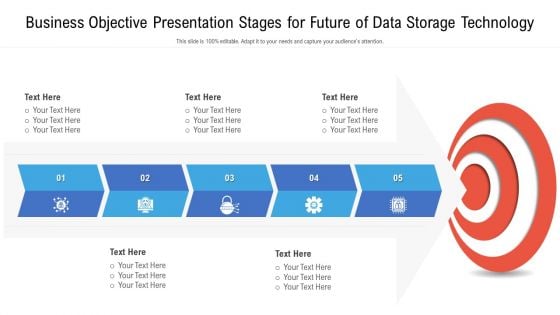
Business Objective Presentation Stages For Future Of Data Storage Technology Sample PDF
Persuade your audience using this business objective presentation stages for future of data storage technology sample pdf. This PPT design covers five stages, thus making it a great tool to use. It also caters to a variety of topics including business objective presentation stages for future of data storage technology. Download this PPT design now to present a convincing pitch that not only emphasizes the topic but also showcases your presentation skills.

Three Pillar Infographic For Future Of Data Storage Technology Ppt PowerPoint Presentation Images PDF
Persuade your audience using this three pillar infographic for future of data storage technology ppt powerpoint presentation images pdf. This PPT design covers three stages, thus making it a great tool to use. It also caters to a variety of topics including three pillar infographic for future of data storage technology. Download this PPT design now to present a convincing pitch that not only emphasizes the topic but also showcases your presentation skills.
Icon Showing Data Security Through Blockchain Technology In Supply Chain Rules PDF
Persuade your audience using this Icon Showing Data Security Through Blockchain Technology In Supply Chain Rules PDF. This PPT design covers four stages, thus making it a great tool to use. It also caters to a variety of topics including Icon Showing Data Security, Blockchain Technology Supply Chain. Download this PPT design now to present a convincing pitch that not only emphasizes the topic but also showcases your presentation skills.
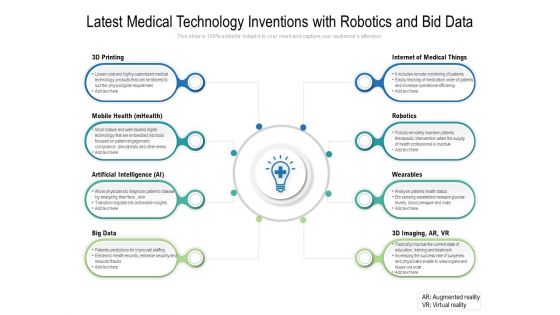
Latest Medical Technology Inventions With Robotics And Bid Data Ppt PowerPoint Presentation Summary Microsoft
Presenting this set of slides with name latest medical technology inventions with robotics and bid data ppt powerpoint presentation summary microsoft. This is a eight stage process. The stages in this process are 3d printing, mobile health, artificial intelligence, big data, internet of medical things, robotics, wearables, 3d imaging, ar, vr. This is a completely editable PowerPoint presentation and is available for immediate download. Download now and impress your audience.
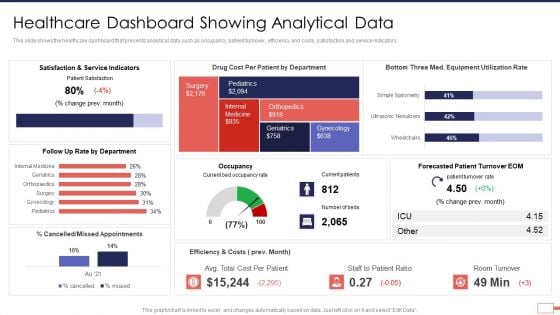
Iot Digital Twin Technology Post Covid Expenditure Management Healthcare Dashboard Showing Analytical Data Brochure PDF
This slide shows the healthcare dashboard that presents analytical data such as occupancy, patient turnover, efficiency and costs, satisfaction and service indicators. Deliver an awe inspiring pitch with this creative iot digital twin technology post covid expenditure management healthcare dashboard showing analytical data brochure pdf bundle. Topics like service, indicators, cost, appointments, turnover can be discussed with this completely editable template. It is available for immediate download depending on the needs and requirements of the user.
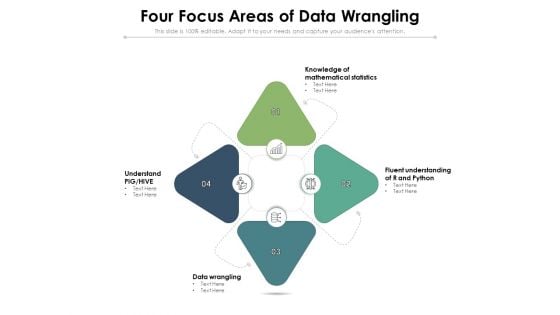
Four Focus Areas Of Data Wrangling Ppt PowerPoint Presentation Layouts Backgrounds PDF
Presenting this set of slides with name four focus areas of data wrangling ppt powerpoint presentation layouts backgrounds pdf. This is a four stage process. The stages in this process are knowledge of mathematical statistics, fluent understanding of r and python, understand pig, hive, data wrangling. This is a completely editable PowerPoint presentation and is available for immediate download. Download now and impress your audience.
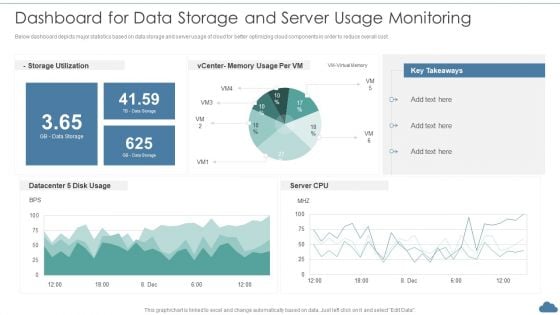
Cloud Optimization Infrastructure Model Dashboard For Data Storage And Server Usage Monitoring Rules PDF
Below dashboard depicts major statistics based on data storage and server usage of cloud for better optimizing cloud components in order to reduce overall cost.Deliver an awe inspiring pitch with this creative Cloud Optimization Infrastructure Model Dashboard For Data Storage And Server Usage Monitoring Rules PDF bundle. Topics like Storage Utilization, Key Takeaways, Datacenter can be discussed with this completely editable template. It is available for immediate download depending on the needs and requirements of the user.

Techniques To Implement Cloud Infrastructure Dashboard For Data Storage And Server Usage Monitoring Mockup PDF
Below dashboard depicts major statistics based on data storage and server usage of cloud for better optimizing cloud components in order to reduce overall cost.Deliver an awe inspiring pitch with this creative Techniques To Implement Cloud Infrastructure Dashboard For Data Storage And Server Usage Monitoring Mockup PDF bundle. Topics like Storage Utilization, Key Takeaways, Center Memory can be discussed with this completely editable template. It is available for immediate download depending on the needs and requirements of the user.
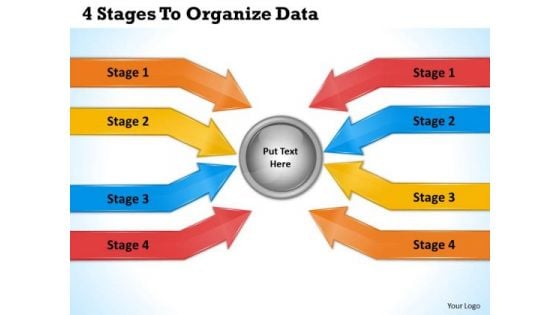
Business Planning Strategy 4 Stages To Organize Data Change Management Ppt Slide
Deliver The Right Dose With Our business planning strategy 4 stages to organize data change management ppt slide Powerpoint Templates. Your Ideas Will Get The Correct Illumination. Your Abilities Have Been Lying Dormant. Awaken Them With Our Arrows Powerpoint Templates.
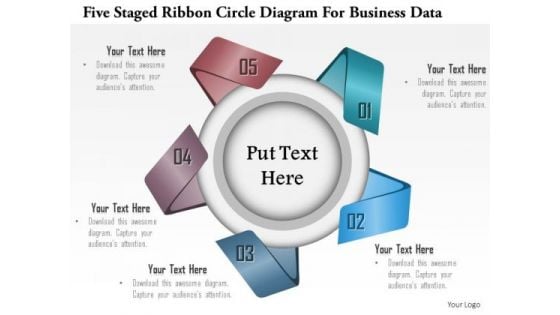
Business Diagram Five Staged Ribbon Circle Diagram For Business Data Presentation Template
This Power Point template slide has been crafted with graphic of five staged ribbon circle diagram. This PPT slide contains the concept of business data representation. Use this PPT slide and make an exclusive presentation for your viewers.

Business Diagram Five Staged Circular Ribbon Design For Data Representation Presentation Template
This business diagram displays five staged circular ribbon. This Power Point slide can be used for data representation. Use this PPT slide to show flow of activities in circular manner. Get professional with this exclusive business slide.
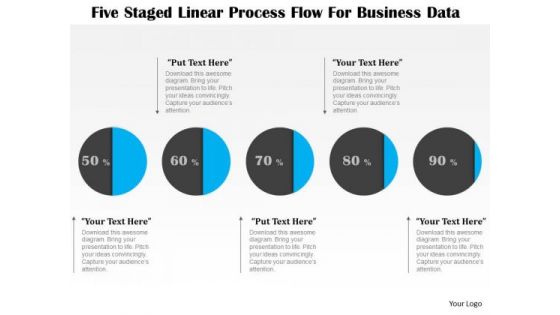
Business Diagram Five Staged Linear Process Flow For Business Data Presentation Template
This business diagram displays graphic of five staged process flow diagram. This PPT slide contains the concept of business data representation. Use this diagram to build professional presentation for your viewers.
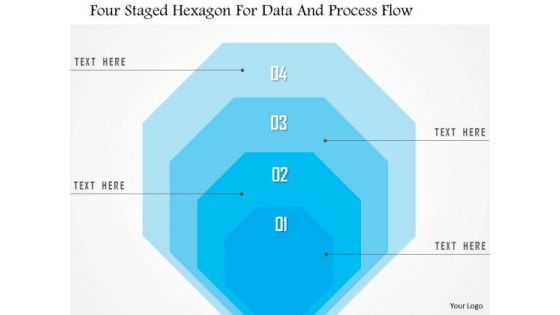
Business Diagram Four Staged Hexagon For Data And Process Flow Presentation Template
Four staged hexagon diagram has been used to design this power point template. This PPT contains the concept of data and process flow. Use this PPT and build professional presentation on business topics.
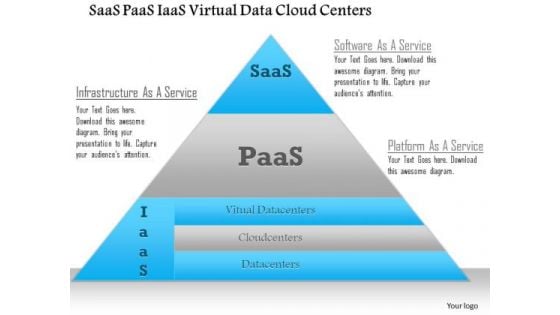
Business Diagram Saas Paas Iaas Virtual Data Cloud Centers Ppt Slide
This technical diagram has been designed with graphic of triangle. This slide contains the concept of SAAS, PAAS and IASS. This slide also helps to explain the virtual data on cloud centers. Download this diagram to make professional presentations.
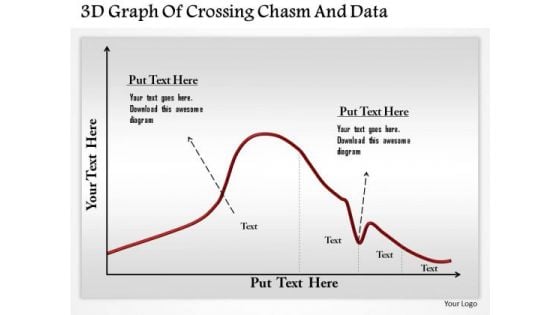
Business Diagram 3d Graph Of Crossing Chasm And Data Presentation Template
This business diagram has been designed with graphic of 3d graph. This slide contains the concept of chasm and data calculation. Use this slide to display chasm crossing condition. This business diagram adds value to your ideas.
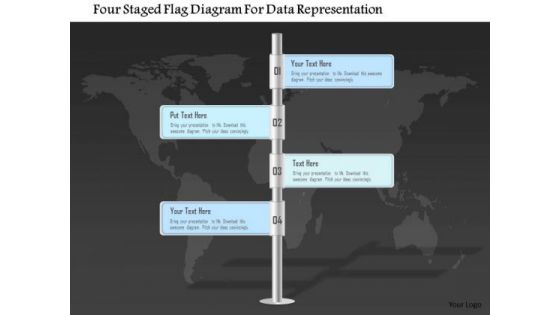
Business Diagram Four Staged Flag Diagram For Data Representation PowerPoint Template
Four staged flag diagram has been used to craft this power point template. This PPT diagram contains the concept of business agenda and data representation. Use this PPT for business and marketing related presentations.
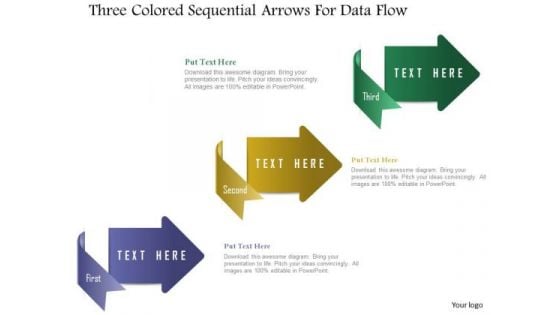
Business Diagram Three Colored Sequential Arrows For Data Flow Presentation Template
Three colored sequential arrows graphic has been used to design this power point template slide. This PPT slide contains the concept of data flow representation. Use this PPT slide for your business and management related presentations.
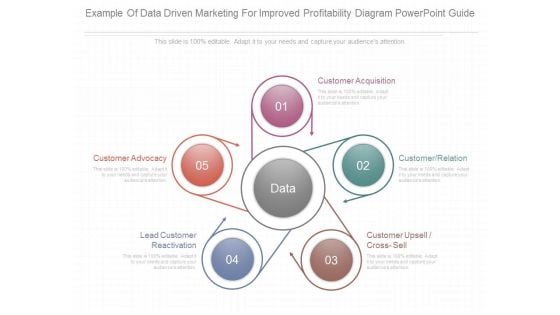
Example Of Data Driven Marketing For Improved Profitability Diagram Powerpoint Guide
This is a example of data driven marketing for improved profitability diagram powerpoint guide. This is a five stage process. The stages in this process are customer acquisition, customer relation, customer upsell cross sell, lead customer reactivation, customer advocacy.
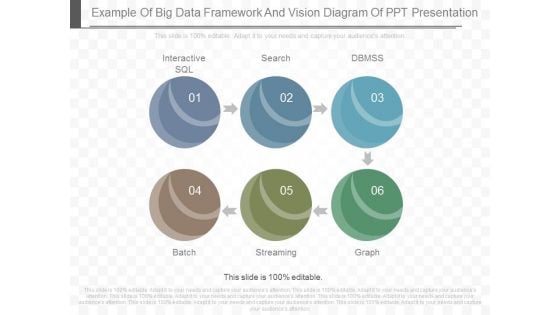
Example Of Big Data Framework And Vision Diagram Of Ppt Presentation
This is a example of big data framework and vision diagram of ppt presentation. This is a six stage process. The stages in this process are interactive sql, search, dbmss, batch, streaming, graph.
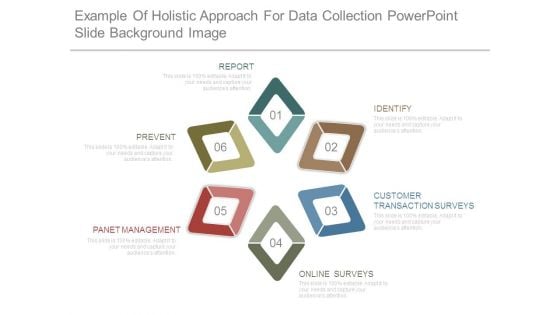
Example Of Holistic Approach For Data Collection Powerpoint Slide Background Image
This is a example of holistic approach for data collection powerpoint slide background image. This is a eight stage process. The stages in this process are report, prevent, panet management, identify, customer transaction surveys, online surveys.
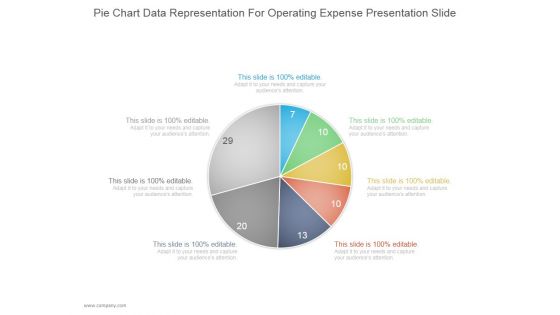
Pie Chart Data Representation For Operating Expense Ppt PowerPoint Presentation Deck
This is a pie chart data representation for operating expense ppt powerpoint presentation deck. This is a seven stage process. The stages in this process are business, strategy, marketing, pie chart, management.
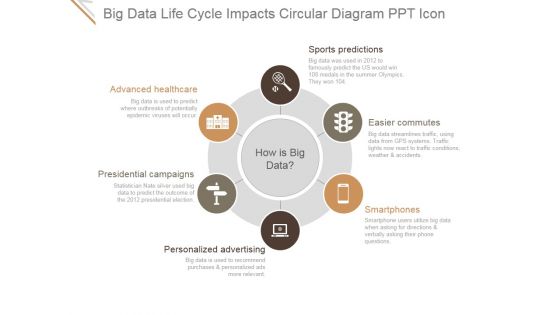
Big Data Life Cycle Impacts Circular Diagram Ppt PowerPoint Presentation Introduction
This is a big data life cycle impacts circular diagram ppt powerpoint presentation introduction. This is a six stage process. The stages in this process are sports predictions, easier commutes, smartphones, personalized advertising, presidential campaigns, advanced healthcare.
Four Ds Data Sets Shape Icons Diagrams Ppt PowerPoint Presentation Guidelines
This is a four ds data sets shape icons diagrams ppt powerpoint presentation guidelines. This is a four stage process. The stages in this process are deposit, discover, design, decide.
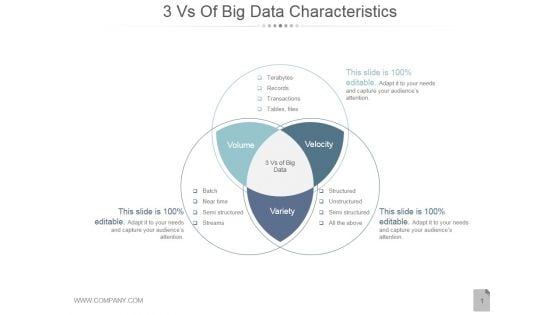
3 Vs Of Big Data Characteristics Ppt PowerPoint Presentation Example File
This is a 3 vs of big data characteristics ppt powerpoint presentation example file. This is a three stage process. The stages in this process are volume, velocity, variety.
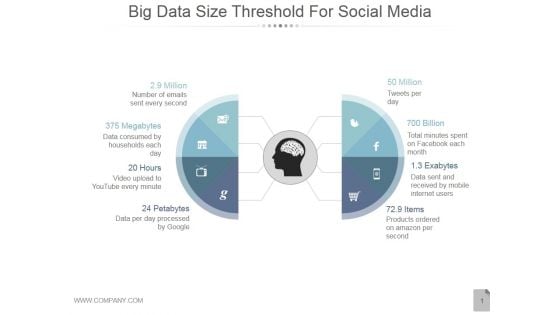
Big Data Size Threshold For Social Media Ppt PowerPoint Presentation Example
This is a big data size threshold for social media ppt powerpoint presentation example. This is a eight stage process. The stages in this process are million, megabytes, hours, petabytes, items.
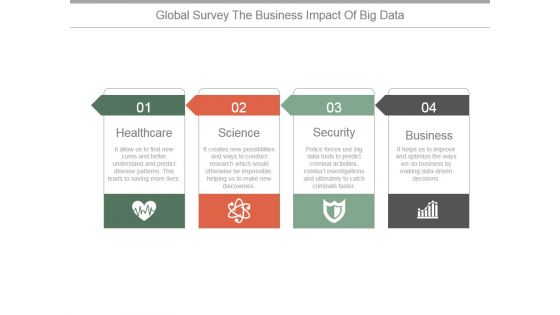
Global Survey The Business Impact Of Big Data Ppt PowerPoint Presentation Example 2015
This is a global survey the business impact of big data ppt powerpoint presentation example 2015. This is a four stage process. The stages in this process are healthcare, science, security, business.
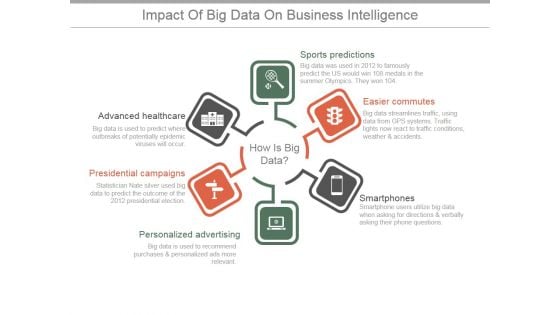
Impact Of Big Data On Business Intelligence Ppt PowerPoint Presentation Sample
This is a impact of big data on business intelligence ppt powerpoint presentation sample. This is a six stage process. The stages in this process are sports predictions, easier commutes, smartphones, personalized advertising, presidential campaigns, advanced healthcare.
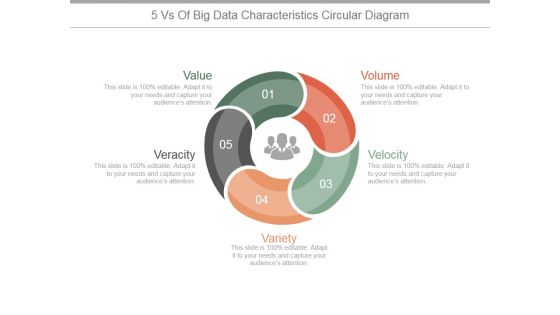
5 Vs Of Big Data Characteristics Circular Ppt PowerPoint Presentation Outline
This is a 5 vs of big data characteristics circular ppt powerpoint presentation outline. This is a five stage process. The stages in this process are value, volume, velocity, variety, veracity.
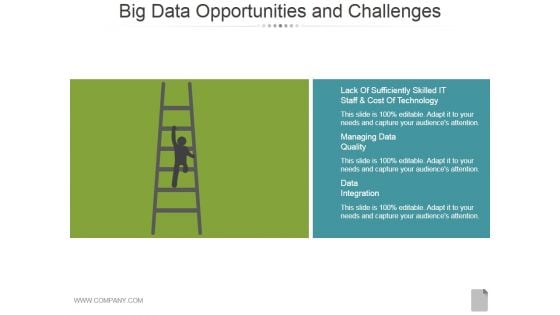
Big Data Opportunities And Challenges Template 1 Ppt PowerPoint Presentation Visual Aids
This is a big data opportunities and challenges template 1 ppt powerpoint presentation visual aids. This is a two stage process. The stages in this process are business, stairs, growth, opportunity, strategy, success.

Impact Of Big Data Template 1 Ppt PowerPoint Presentation Background Images
This is a impact of big data template 1 ppt powerpoint presentation background images. This is a four stage process. The stages in this process are healthcare, science, security, business.
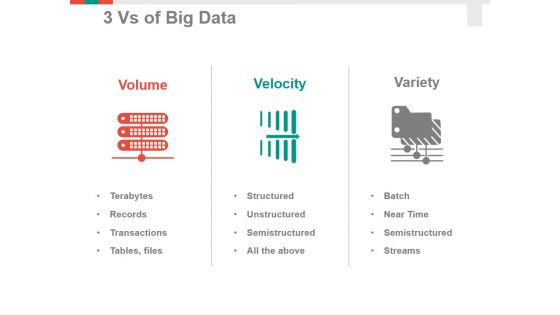
3 Vs Of Big Data Ppt PowerPoint Presentation Summary Example Introduction
This is a 3 vs of big data ppt powerpoint presentation summary example introduction. This is a three stage process. The stages in this process are volume, velocity, variety.
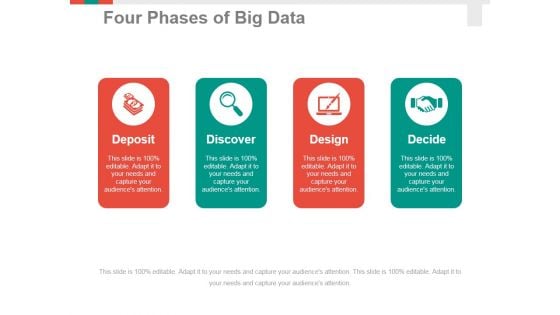
Four Phases Of Big Data Ppt PowerPoint Presentation Professional Format Ideas
This is a four phases of big data ppt powerpoint presentation professional format ideas. This is a four stage process. The stages in this process are deposit, discover, design, decide.
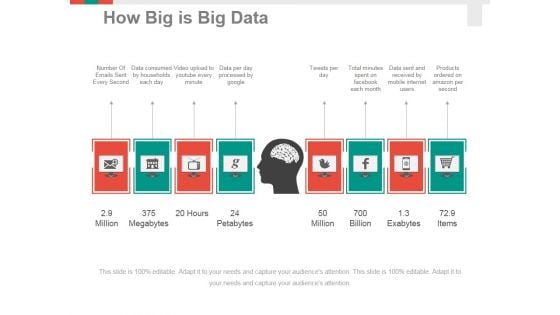
How Big Is Big Data Ppt PowerPoint Presentation Layouts Clipart Images
This is a how big is big data ppt powerpoint presentation layouts clipart images. This is a eight stage process. The stages in this process are million, megabytes, hours, petabytes.
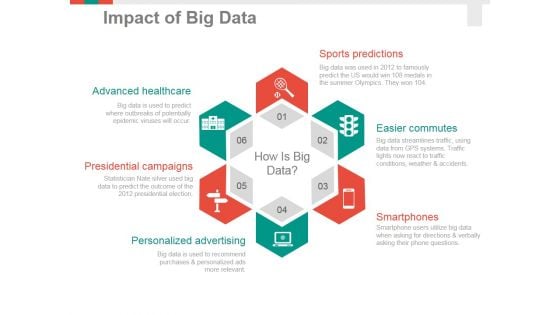
Impact Of Big Data Template 1 Ppt PowerPoint Presentation Outline Templates
This is a impact of big data template 1 ppt powerpoint presentation outline templates. This is a six stage process. The stages in this process are sports predictions, easier commutes, smartphones, personalized advertising, presidential campaigns, advanced healthcare.

Impact Of Big Data Template 2 Ppt PowerPoint Presentation Portfolio Model
This is a impact of big data template 2 ppt powerpoint presentation portfolio model. This is a four stage process. The stages in this process are healthcare, science, security, business.
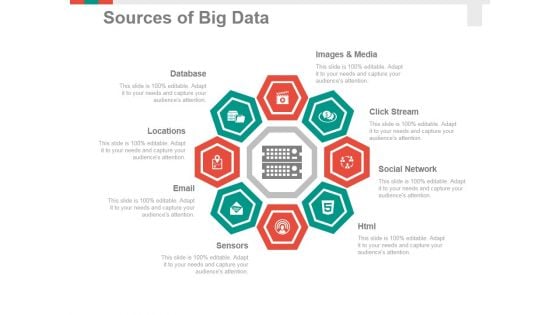
Sources Of Big Data Template 1 Ppt PowerPoint Presentation Styles Graphics
This is a sources of big data template 1 ppt powerpoint presentation styles graphics. This is a eight stage process. The stages in this process are images and media, click stream, social network, sensors, email, locations, database.
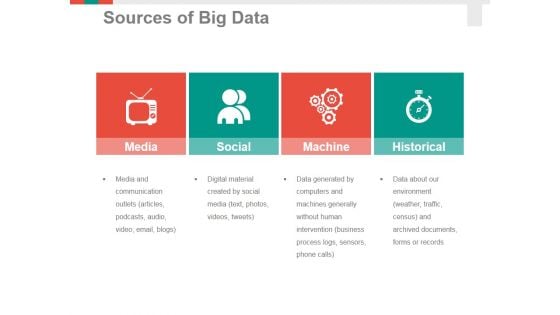
Sources Of Big Data Template 2 Ppt PowerPoint Presentation Portfolio Sample
This is a sources of big data template 2 ppt powerpoint presentation portfolio sample. This is a four stage process. The stages in this process are media, social, machine, historical.
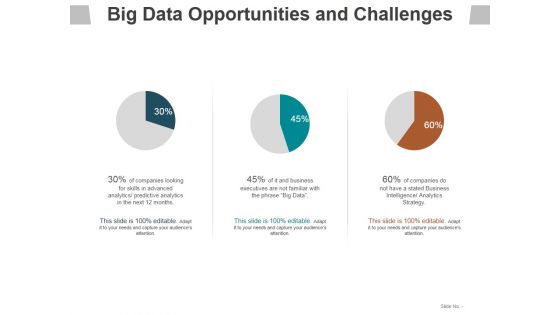
Big Data Opportunities And Challenges Template 2 Ppt PowerPoint Presentation Infographic Template Slides
This is a big data opportunities and challenges template 2 ppt powerpoint presentation infographic template slides. This is a three stage process. The stages in this process are business, management, marketing, process, success.
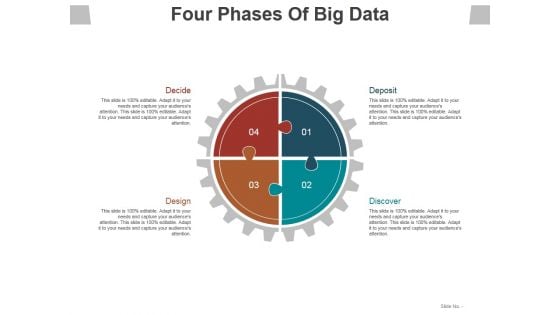
Four Phases Of Big Data Ppt PowerPoint Presentation Layouts Slide Download
This is a four phases of big data ppt powerpoint presentation layouts slide download. This is a four stage process. The stages in this process are decide, deposit, discover, design.
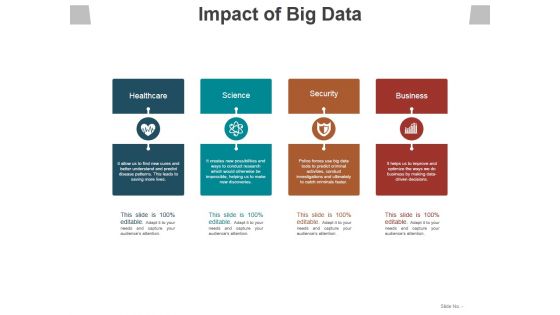
Impact Of Big Data Template 1 Ppt PowerPoint Presentation File Example File
This is a impact of big data template 1 ppt powerpoint presentation file example file. This is a four stage process. The stages in this process are healthcare, science, security, business.
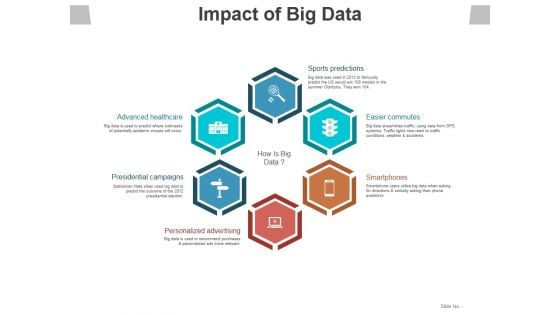
Impact Of Big Data Template 2 Ppt PowerPoint Presentation Styles Topics
This is a impact of big data template 2 ppt powerpoint presentation styles topics. This is a six stage process. The stages in this process are advanced healthcare, presidential campaigns, personalized advertising, smartphones, easier commutes.
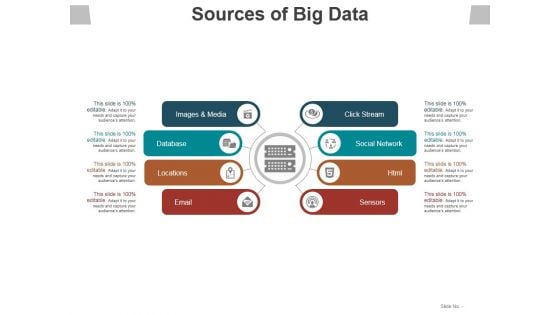
Sources Of Big Data Template 2 Ppt PowerPoint Presentation Layouts Picture
This is a sources of big data template 2 ppt powerpoint presentation layouts picture. This is a eight stage process. The stages in this process are images and media, database, locations, email, sensors.
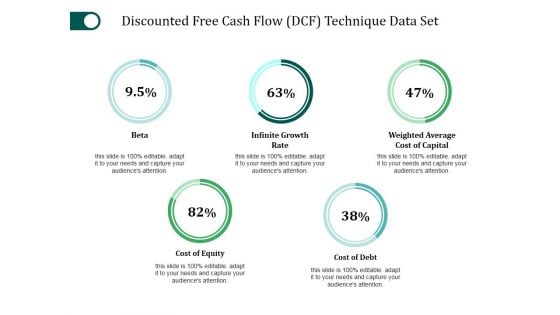
Discounted Free Cash Flow Technique Data Set Ppt PowerPoint Presentation File Summary
This is a discounted free cash flow technique data set ppt powerpoint presentation file summary. This is a five stage process. The stages in this process are beta, infinite growth rate, cost of equity, cost of debt.
View Data As A Shared Asset Ppt PowerPoint Presentation Icon Example Introduction
This is a view data as a shared asset ppt powerpoint presentation icon example introduction. This is a two stage process. The stages in this process are icons, strategy, business, management, marketing.
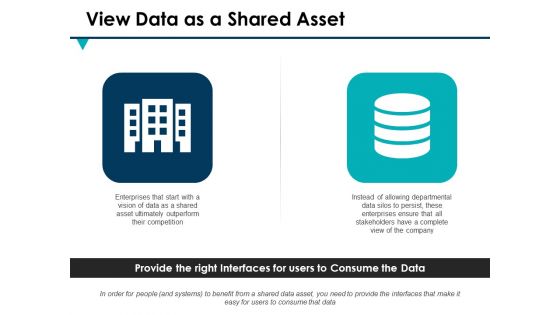
View Data As A Shared Asset Ppt PowerPoint Presentation Outline Design Ideas
This is a view data as a shared asset ppt powerpoint presentation outline design ideas. This is a two stage process. The stages in this process are marketing, business, management, planning, strategy.
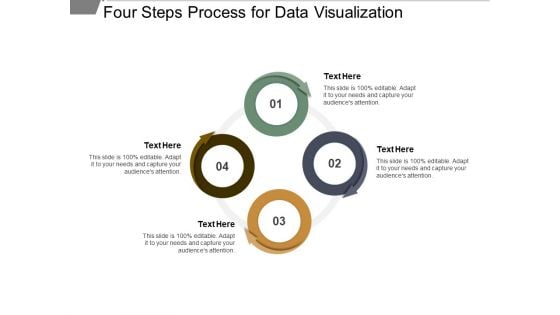
Four Steps Process For Data Visualization Ppt PowerPoint Presentation Infographic Template Inspiration
This is a four steps process for data visualization ppt powerpoint presentation infographic template inspiration. This is a four stage process. The stages in this process are circle process 4 arrows, circle cycle 4 arrows, circular process 4 arrows.
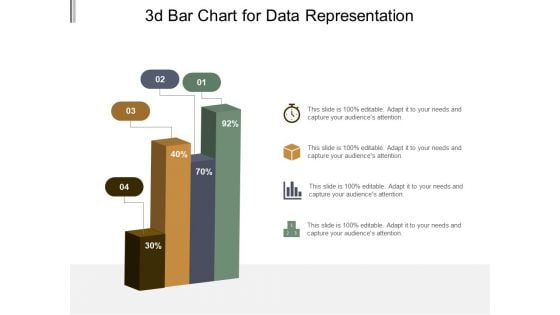
3D Bar Chart For Data Representation Ppt PowerPoint Presentation Model Graphic Tips
This is a 3d bar chart for data representation ppt powerpoint presentation model graphic tips. This is a four stage process. The stages in this process are art, colouring, paint brush.
3D Bar Chart To Display Data Ppt PowerPoint Presentation Icon Design Inspiration
This is a 3d bar chart to display data ppt powerpoint presentation icon design inspiration. This is a four stage process. The stages in this process are art, colouring, paint brush.
3D Chart For Graphical Display Of Data Ppt PowerPoint Presentation Styles Icon
This is a 3d chart for graphical display of data ppt powerpoint presentation styles icon. This is a four stage process. The stages in this process are art, colouring, paint brush.
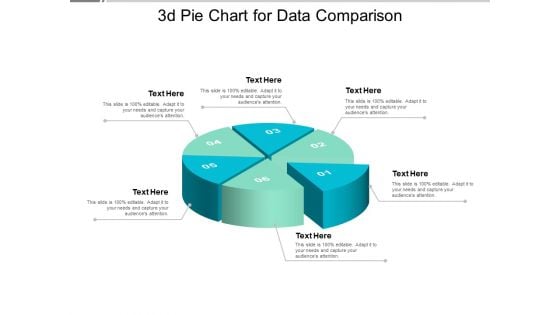
3D Pie Chart For Data Comparison Ppt PowerPoint Presentation Model Design Ideas
This is a 3d pie chart for data comparison ppt powerpoint presentation model design ideas. This is a six stage process. The stages in this process are art, colouring, paint brush.
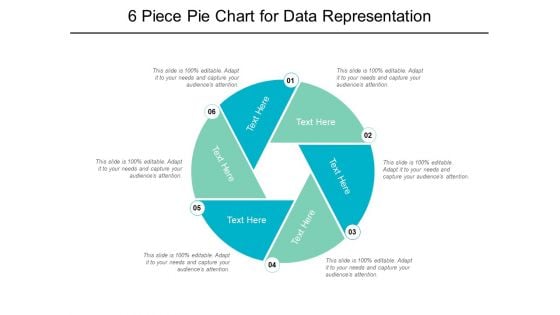
6 Piece Pie Chart For Data Representation Ppt PowerPoint Presentation Professional Brochure
This is a 6 piece pie chart for data representation ppt powerpoint presentation professional brochure. This is a six stage process. The stages in this process are 6 piece pie chart, 6 segment pie chart, 6 parts pie chart.
6 Segments Pie Chart For Data Representation Ppt PowerPoint Presentation Icon Graphics
This is a 6 segments pie chart for data representation ppt powerpoint presentation icon graphics. This is a six stage process. The stages in this process are 6 piece pie chart, 6 segment pie chart, 6 parts pie chart.
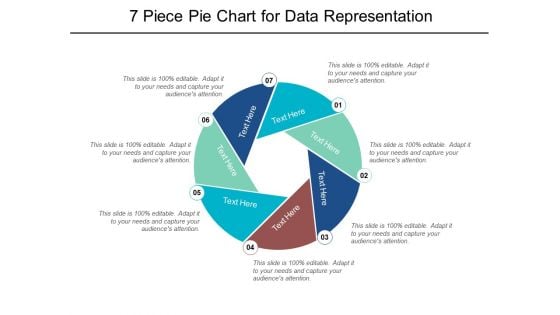
7 Piece Pie Chart For Data Representation Ppt PowerPoint Presentation Portfolio Graphics
This is a 7 piece pie chart for data representation ppt powerpoint presentation portfolio graphics. This is a seven stage process. The stages in this process are 6 piece pie chart, 6 segment pie chart, 6 parts pie chart.
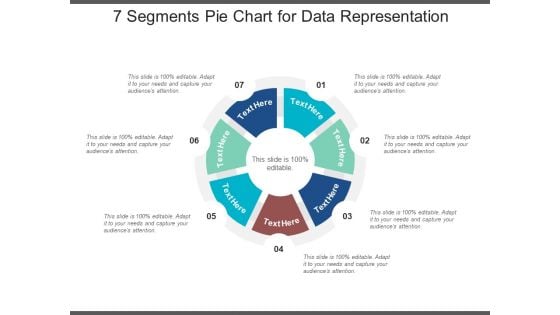
7 Segments Pie Chart For Data Representation Ppt PowerPoint Presentation Styles Summary
This is a 7 segments pie chart for data representation ppt powerpoint presentation styles summary. This is a seven stage process. The stages in this process are 6 piece pie chart, 6 segment pie chart, 6 parts pie chart.
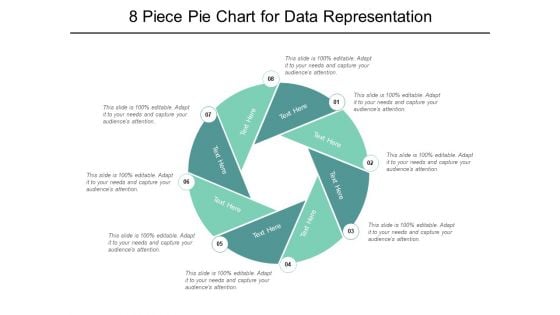
8 Piece Pie Chart For Data Representation Ppt PowerPoint Presentation Ideas
This is a 8 piece pie chart for data representation ppt powerpoint presentation ideas. This is a eight stage process. The stages in this process are 6 piece pie chart, 6 segment pie chart, 6 parts pie chart.
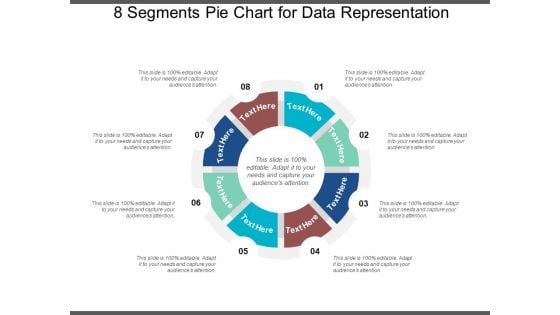
8 Segments Pie Chart For Data Representation Ppt PowerPoint Presentation Infographics Design Templates
This is a 8 segments pie chart for data representation ppt powerpoint presentation infographics design templates. This is a eight stage process. The stages in this process are 6 piece pie chart, 6 segment pie chart, 6 parts pie chart.
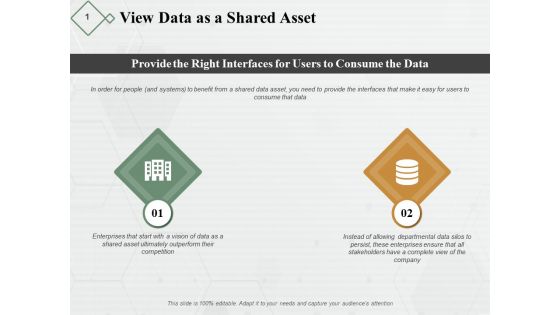
View Data As A Shared Asset Ppt PowerPoint Presentation Model Portfolio
This is a view data as a shared asset ppt powerpoint presentation model portfolio. This is a two stage process. The stages in this process are business, planning, strategy, marketing, management.

Data Governance Manage Configure Measure Ppt PowerPoint Presentation File Slide Portrait
This is a data governance manage configure measure ppt powerpoint presentation file slide portrait. This is a four stage process. The stages in this process are system integration, application integration, program integration.
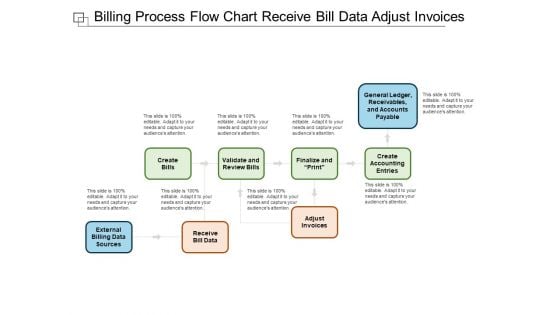
Billing Process Flow Chart Receive Bill Data Adjust Invoices Ppt Powerpoint Presentation Pictures Introduction
This is a billing process flow chart receive bill data adjust invoices ppt powerpoint presentation pictures introduction. This is a eight stage process. The stages in this process are billing process, billing procedure, billing cycle.


 Continue with Email

 Home
Home


