Data
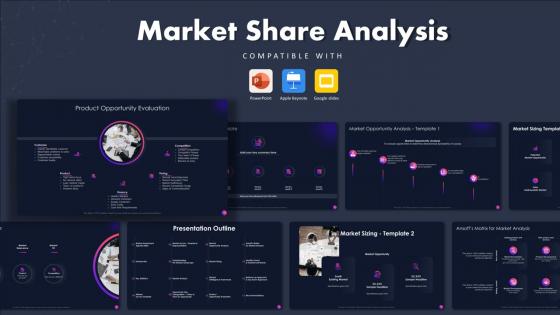
Market Share Analysis Powerpoint Presentation
This Market Share Analysis Powerpoint Presentation is designed to help you retain your audiences attention. This content-ready PowerPoint Template enables you to take your audience on a journey and share information in a way that is easier to recall. It helps you highlight the crucial parts of your work so that the audience does not get saddled with information download. This Market Share Analysis,Market Assessment,Market analysis-slide PPT Deck comes prepared with the graphs and charts you could need to showcase your information through visuals. You only need to enter your own data in them. Download this editable PowerPoint Theme and walk into that meeting with confidence. Market Share Analysis PowerPoint Presentation Slides helps you showcase your organizations market reach. This market share assessment PPT theme is useful for marketers to explain the assessment agenda of their organization. Exploit the design of market share evaluation PowerPoint slideshow to illustrate key statistics using impactful data visualization techniques. Further, you can also use market share research PPT template to graphically represent the market survey results. Communicate the market landscape to your audience by the means of infographics included in this market share review PowerPoint theme. Utilize the market analysis Venn diagram given in market intelligence PPT slideshow to demonstrate market relevance, market opportunities, and market fit. Showcase market sizing and market opportunity analysis by incorporating data visualization tools given in this visually appealing PowerPoint presentation. So, download this market size estimation PPT deck to portray product opportunity analysis through various key performance indicators.

Solar Computing IT Importance Of Green Cloud Computing Technology
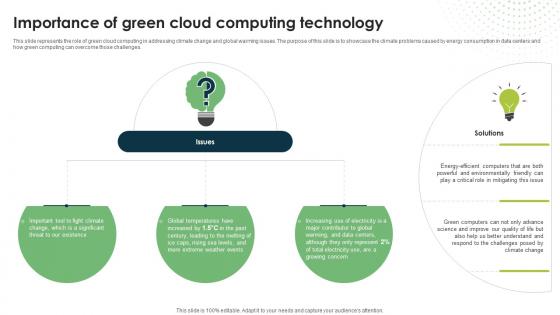
This slide represents the role of green cloud computing in addressing climate change and global warming issues. The purpose of this slide is to showcase the climate problems caused by energy consumption in data centers and how green computing can overcome those challenges. The Solar Computing IT Importance Of Green Cloud Computing Technology is a compilation of the most recent design trends as a series of slides. It is suitable for any subject or industry presentation, containing attractive visuals and photo spots for businesses to clearly express their messages. This template contains a variety of slides for the user to input data, such as structures to contrast two elements, bullet points, and slides for written information. Slidegeeks is prepared to create an impression. This slide represents the role of green cloud computing in addressing climate change and global warming issues. The purpose of this slide is to showcase the climate problems caused by energy consumption in data centers and how green computing can overcome those challenges.
Importance Of Green Cloud Computing Technology Eco Friendly Computing IT
This slide represents the role of green cloud computing in addressing climate change and global warming issues. The purpose of this slide is to showcase the climate problems caused by energy consumption in data centers and how green computing can overcome those challenges.The Importance Of Green Cloud Computing Technology Eco Friendly Computing IT is a compilation of the most recent design trends as a series of slides. It is suitable for any subject or industry presentation, containing attractive visuals and photo spots for businesses to clearly express their messages. This template contains a variety of slides for the user to input data, such as structures to contrast two elements, bullet points, and slides for written information. Slidegeeks is prepared to create an impression. This slide represents the role of green cloud computing in addressing climate change and global warming issues. The purpose of this slide is to showcase the climate problems caused by energy consumption in data centers and how green computing can overcome those challenges.
Food And Drink Industry Report Major Technology Trends Impacting Food And Beverage Industry IR SS V
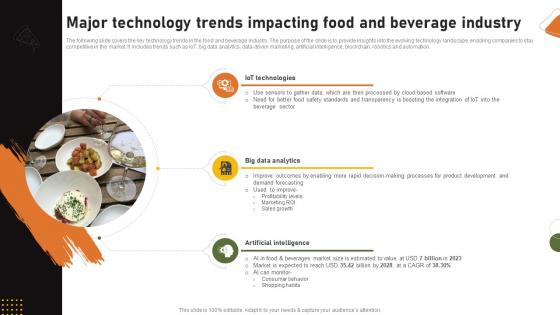
The following slide covers the key technology trends in the food and beverage industry. The purpose of the slide is to provide insights into the evolving technology landscape, enabling companies to stay competitive in the market. It includes trends such as IoT, big data analytics, data-driven marketing, artificial intelligence, blockchain, robotics and automation. Coming up with a presentation necessitates that the majority of the effort goes into the content and the message you intend to convey. The visuals of a PowerPoint presentation can only be effective if it supplements and supports the story that is being told. Keeping this in mind our experts created Food And Drink Industry Report Major Technology Trends Impacting Food And Beverage Industry IR SS V to reduce the time that goes into designing the presentation. This way, you can concentrate on the message while our designers take care of providing you with the right template for the situation. The following slide covers the key technology trends in the food and beverage industry. The purpose of the slide is to provide insights into the evolving technology landscape, enabling companies to stay competitive in the market. It includes trends such as IoT, big data analytics, data-driven marketing, artificial intelligence, blockchain, robotics and automation.
Comparison Between Software Defined Networking SDN Building Blocks Demonstration Pdf
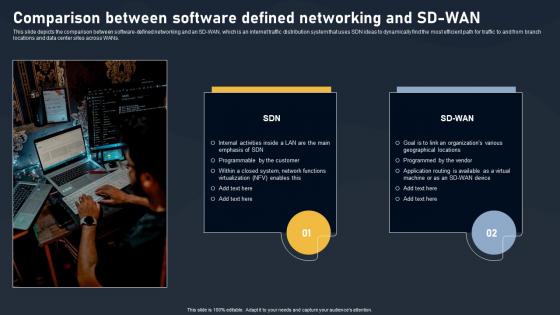
This slide depicts the comparison between software-defined networking and an SD-WAN, which is an internet traffic distribution system that uses SDN ideas to dynamically find the most efficient path for traffic to and from branch locations and data center sites across WANs.The Comparison Between Software Defined Networking SDN Building Blocks Demonstration Pdf is a compilation of the most recent design trends as a series of slides. It is suitable for any subject or industry presentation, containing attractive visuals and photo spots for businesses to clearly express their messages. This template contains a variety of slides for the user to input data, such as structures to contrast two elements, bullet points, and slides for written information. Slidegeeks is prepared to create an impression. This slide depicts the comparison between software defined networking and an SD WAN, which is an internet traffic distribution system that uses SDN ideas to dynamically find the most efficient path for traffic to and from branch locations and data center sites across WANs.
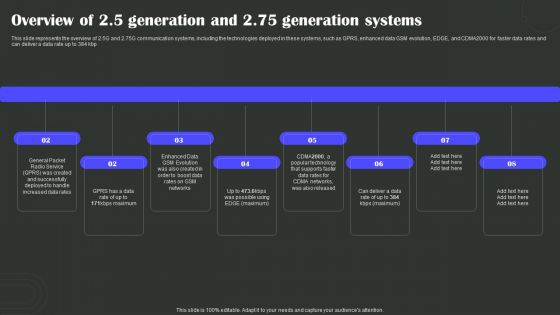
Overview Of 2 5 Generation And 2 75 Generation Systems Wireless Technology Transformation Clipart PDF
This slide represents the overview of 2 5G and 2 75G communication systems, including the technologies deployed in these systems, such as GPRS, enhanced data GSM evolution, EDGE, and CDMA2000 for faster data rates and can deliver a data rate up to 384 kbp. Presenting this PowerPoint presentation, titled Overview Of 2 5 Generation And 2 75 Generation Systems Wireless Technology Transformation Clipart PDF, with topics curated by our researchers after extensive research. This editable presentation is available for immediate download and provides attractive features when used. Download now and captivate your audience. Presenting this Overview Of 2 5 Generation And 2 75 Generation Systems Wireless Technology Transformation Clipart PDF. Our researchers have carefully researched and created these slides with all aspects taken into consideration. This is a completely customizable Overview Of 2 5 Generation And 2 75 Generation Systems Wireless Technology Transformation Clipart PDF that is available for immediate downloading. Download now and make an impact on your audience. Highlight the attractive features available with our PPTs.
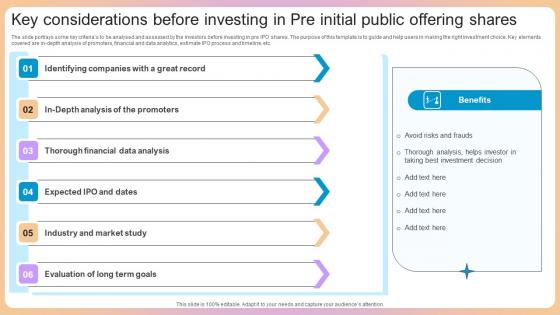
Key Considerations Before Investing In Pre Initial Public Offering Shares Guidelines Pdf
The slide portrays some key criterias to be analysed and assessed by the investors before investing in pre IPO shares. The purpose of this template is to guide and help users in making the right investment choice. Key elements covered are in-depth analysis of promoters, financial and data analytics, estimate IPO process and timeline, etc. Pitch your topic with ease and precision using this Key Considerations Before Investing In Pre Initial Public Offering Shares Guidelines Pdf This layout presents information on Identifying Companies, Great Record, Data Analysis It is also available for immediate download and adjustment. So, changes can be made in the color, design, graphics or any other component to create a unique layout. The slide portrays some key criterias to be analysed and assessed by the investors before investing in pre IPO shares. The purpose of this template is to guide and help users in making the right investment choice. Key elements covered are in-depth analysis of promoters, financial and data analytics, estimate IPO process and timeline, etc.
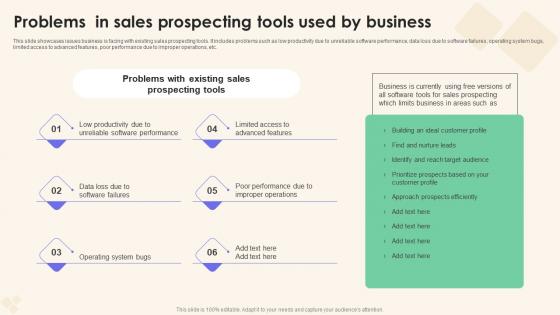
Problems In Sales Prospecting Tools Sales Performance Enhancement Elements Pdf
This slide showcases issues business is facing with existing sales prospecting tools. It includes problems such as low productivity due to unreliable software performance, data loss due to software failures, operating system bugs, limited access to advanced features, poor performance due to improper operations, etc. The Problems In Sales Prospecting Tools Sales Performance Enhancement Elements Pdf is a compilation of the most recent design trends as a series of slides. It is suitable for any subject or industry presentation, containing attractive visuals and photo spots for businesses to clearly express their messages. This template contains a variety of slides for the user to input data, such as structures to contrast two elements, bullet points, and slides for written information. Slidegeeks is prepared to create an impression. This slide showcases issues business is facing with existing sales prospecting tools. It includes problems such as low productivity due to unreliable software performance, data loss due to software failures, operating system bugs, limited access to advanced features, poor performance due to improper operations, etc.
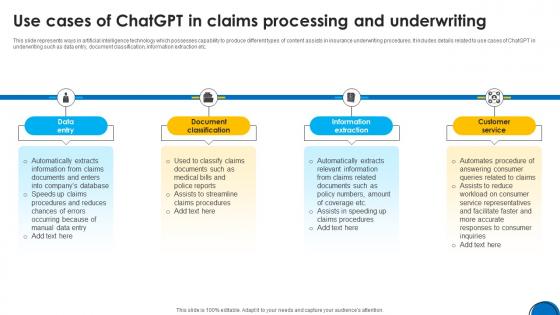
Implementing ChatGpt In Insurance Use Cases Of ChatGpt In Claims Processing ChatGpt SS V
This slide represents ways in artificial intelligence technology which possesses capability to produce different types of content assists in insurance underwriting procedures. It includes details related to use cases of ChatGPT in underwriting such as data entry, document classification, information extraction etc. The Implementing ChatGpt In Insurance Use Cases Of ChatGpt In Claims Processing ChatGpt SS V is a compilation of the most recent design trends as a series of slides. It is suitable for any subject or industry presentation, containing attractive visuals and photo spots for businesses to clearly express their messages. This template contains a variety of slides for the user to input data, such as structures to contrast two elements, bullet points, and slides for written information. Slidegeeks is prepared to create an impression. This slide represents ways in artificial intelligence technology which possesses capability to produce different types of content assists in insurance underwriting procedures. It includes details related to use cases of ChatGPT in underwriting such as data entry, document classification, information extraction etc.
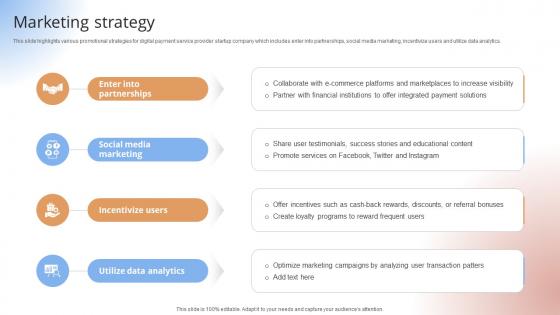
Marketing Strategy Payment Gateway Provider Startup GTM Strategy GTM SS V
This slide highlights various promotional strategies for digital payment service provider startup company which includes enter into partnerships, social media marketing, incentivize users and utilize data analytics.This slide highlights various promotional strategies for digital payment service provider startup company which includes enter into partnerships, social media marketing, incentivize users and utilize data analytics.Formulating a presentation can take up a lot of effort and time, so the content and message should always be the primary focus. The visuals of the PowerPoint can enhance the presenters message, so our Marketing Strategy Payment Gateway Provider Startup GTM Strategy GTM SS V was created to help save time. Instead of worrying about the design, the presenter can concentrate on the message while our designers work on creating the ideal templates for whatever situation is needed. Slidegeeks has experts for everything from amazing designs to valuable content, we have put everything into Marketing Strategy Payment Gateway Provider Startup GTM Strategy GTM SS V. This slide highlights various promotional strategies for digital payment service provider startup company which includes enter into partnerships, social media marketing, incentivize users and utilize data analytics.
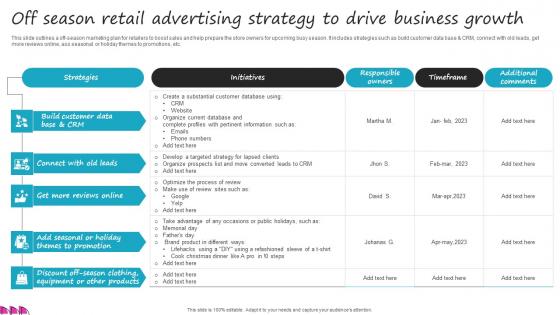
Off Season Retail Advertising Strategy To Drive Business Growth Diagrams Pdf
This slide outlines a off-season marketing plan for retailers to boost sales and help prepare the store owners for upcoming busy season. It includes strategies such as build customer data base and CRM, connect with old leads, get more reviews online, ass seasonal or holiday themes to promotions, etc. Showcasing this set of slides titled Off Season Retail Advertising Strategy To Drive Business Growth Diagrams Pdf. The topics addressed in these templates are Off Season Marketing Plan, Retailers To Boost Sales, Build Customer Data Base, Holiday Themes To Promotions. All the content presented in this PPT design is completely editable. Download it and make adjustments in color, background, font etc. as per your unique business setting. This slide outlines a off-season marketing plan for retailers to boost sales and help prepare the store owners for upcoming busy season. It includes strategies such as build customer data base and CRM, connect with old leads, get more reviews online, ass seasonal or holiday themes to promotions, etc.
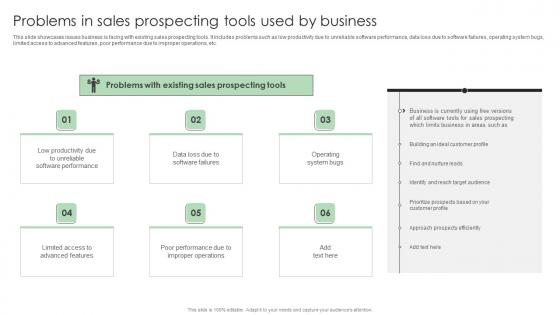
Performance Enhancement Plan Problems In Sales Prospecting Tools Used Ideas Pdf
This slide showcases issues business is facing with existing sales prospecting tools. It includes problems such as low productivity due to unreliable software performance, data loss due to software failures, operating system bugs, limited access to advanced features, poor performance due to improper operations, etc. The Performance Enhancement Plan Problems In Sales Prospecting Tools Used Ideas Pdf is a compilation of the most recent design trends as a series of slides. It is suitable for any subject or industry presentation, containing attractive visuals and photo spots for businesses to clearly express their messages. This template contains a variety of slides for the user to input data, such as structures to contrast two elements, bullet points, and slides for written information. Slidegeeks is prepared to create an impression. This slide showcases issues business is facing with existing sales prospecting tools. It includes problems such as low productivity due to unreliable software performance, data loss due to software failures, operating system bugs, limited access to advanced features, poor performance due to improper operations, etc.

Zero Trust Network Access User Flow Overview Ppt File Deck
This slide describes the overview of zero trust network access user flow. The purpose of this slide is to showcase how the user moves into a network when the ZTNA security model is applied. The key components include a remote user, MFA, security policies, a cloud data center and a branch office. The Zero Trust Network Access User Flow Overview Ppt File Deck is a compilation of the most recent design trends as a series of slides. It is suitable for any subject or industry presentation, containing attractive visuals and photo spots for businesses to clearly express their messages. This template contains a variety of slides for the user to input data, such as structures to contrast two elements, bullet points, and slides for written information. Slidegeeks is prepared to create an impression. This slide describes the overview of zero trust network access user flow. The purpose of this slide is to showcase how the user moves into a network when the ZTNA security model is applied. The key components include a remote user, MFA, security policies, a cloud data center and a branch office.
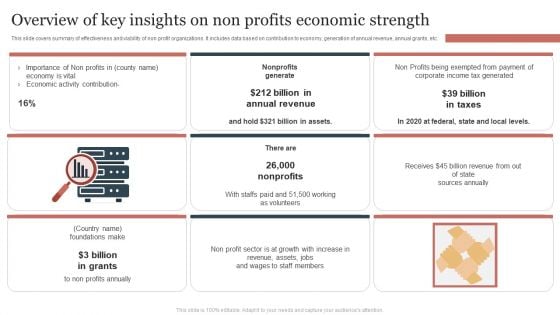
Overview Of Key Insights On Non Profits Economic Strength Summary PDF
This slide covers summary of effectiveness and viability of non profit organizations. It includes data based on contribution to economy, generation of annual revenue, annual grants, etc. Presenting Overview Of Key Insights On Non Profits Economic Strength Summary PDF to dispense important information. This template comprises threestages. It also presents valuable insights into the topics including Annual Revenue, Billion In Taxes, Non Profits. This is a completely customizable PowerPoint theme that can be put to use immediately. So, download it and address the topic impactfully.

IT Threats Response Playbook Cyber Threat Facts Figures And Statistics Themes PDF
This slide portrays statistical information about cyber threats. Information covered is related data breach, ransomware attacks, cyberthreat complaints and phishing attack.This is a IT Threats Response Playbook Cyber Threat Facts Figures And Statistics Themes PDF template with various stages. Focus and dispense information on six stages using this creative set, that comes with editable features. It contains large content boxes to add your information on topics like Ransomware Attacks, Cyberthreat Complaints, Trillion Annually. You can also showcase facts, figures, and other relevant content using this PPT layout. Grab it now.
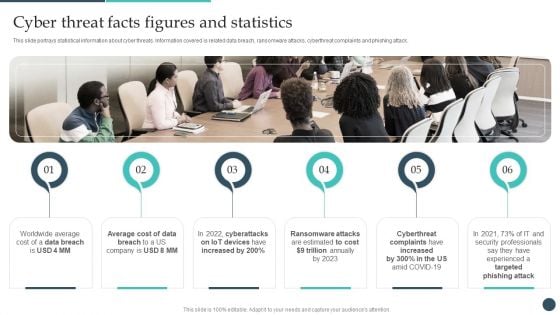
Safety Breach Response Playbook Cyber Threat Facts Figures And Statistics Demonstration PDF
This slide portrays statistical information about cyber threats. Information covered is related data breach, ransomware attacks, cyberthreat complaints and phishing attack. Boost your pitch with our creative Safety Breach Response Playbook Cyber Threat Facts Figures And Statistics Demonstration PDF. Deliver an awe-inspiring pitch that will mesmerize everyone. Using these presentation templates you will surely catch everyones attention. You can browse the ppts collection on our website. We have researchers who are experts at creating the right content for the templates. So you dont have to invest time in any additional work. Just grab the template now and use them.
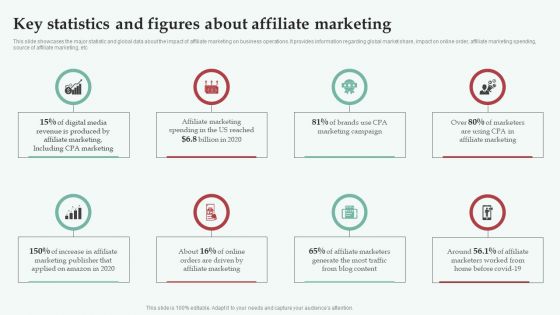
Integrating CPA Marketing Key Statistics And Figures About Affiliate Marketing Background PDF
This slide showcases the major statistic and global data about the impact of affiliate marketing on business operations. It provides information regarding global market share, impact on online order, affiliate marketing spending, source of affiliate marketing, etc. Make sure to capture your audiences attention in your business displays with our gratis customizable Integrating CPA Marketing Key Statistics And Figures About Affiliate Marketing Background PDF. These are great for business strategies, office conferences, capital raising or task suggestions. If you desire to acquire more customers for your tech business and ensure they stay satisfied, create your own sales presentation with these plain slides.
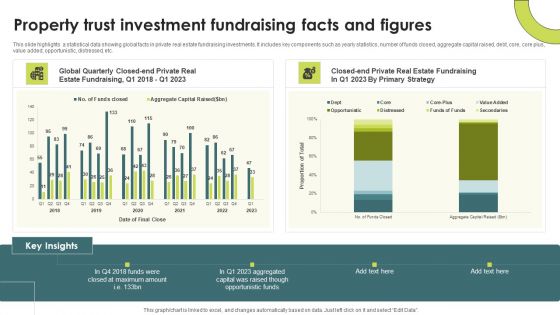
Property Trust Investment Fundraising Facts And Figures Background PDF
This slide highlights a statistical data showing global facts in private real estate fundraising investments. It includes key components such as yearly statistics, number of funds closed, aggregate capital raised, debt, core, core plus, value added, opportunistic, distressed, etc.Showcasing this set of slides titled Property Trust Investment Fundraising Facts And Figures Background PDF. The topics addressed in these templates are Closed At Maximum, Opportunistic Funds. All the content presented in this PPT design is completely editable. Download it and make adjustments in color, background, font etc. as per your unique business setting.
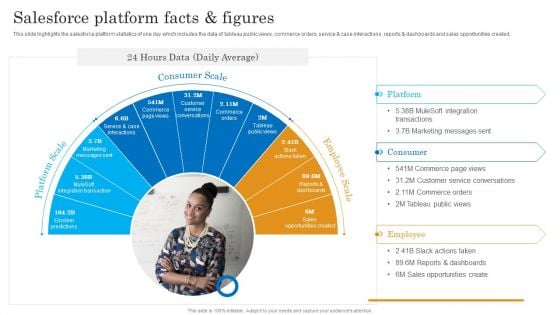
Salesforce Platform Facts AND Figures Salesforce Business Profile Graphics PDF
This slide highlights the salesforce platform statistics of one day which includes the data of tableau public views, commerce orders, service and case interactions, reports and dashboards and sales opportunities created. Presenting Salesforce Platform Facts AND Figures Salesforce Business Profile Graphics PDF to provide visual cues and insights. Share and navigate important information on three stages that need your due attention. This template can be used to pitch topics like Platform Scale, Consumer Scale, Employee Scale. In addtion, this PPT design contains high resolution images, graphics, etc, that are easily editable and available for immediate download.
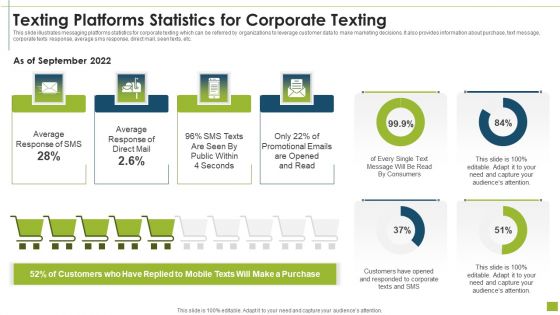
Texting Platforms Statistics For Corporate Texting Formats PDF
This slide illustrates messaging platforms statistics for corporate texting which can be referred by organizations to leverage customer data to make marketing decisions. It also provides information about purchase, text message, corporate texts response, average sms response, direct mail, seen texts, etc.Showcasing this set of slides titled texting platforms statistics for corporate texting formats pdf The topics addressed in these templates are average response, promotional emails, customers have opened All the content presented in this PPT design is completely editable. Download it and make adjustments in color, background, font etc. as per your unique business setting.
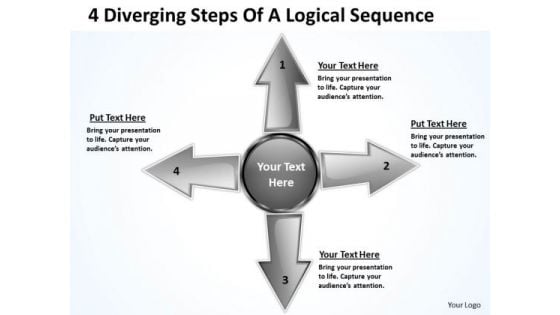
4 Diverging Steps Of A Logical Sequence Circular Arrow Diagram PowerPoint Templates
We present our 4 diverging steps of a logical sequence Circular Arrow Diagram PowerPoint templates.Download our Success PowerPoint Templates because the choices you make today will determine the future growth of your enterprise. Download our Business PowerPoint Templates because you have churned your mind and come upwith solutions. Use our Arrows PowerPoint Templates because getting it done may not be enough. Download and present our Flow Charts PowerPoint Templates because in this Slide Various threads are joining up and being stitched together providing necessary strength Now you have to take the last leap. Download our Shapes PowerPoint Templates because you have it all down to a nicety, slice by slice, layer by layer.Use these PowerPoint slides for presentations relating to Arrow, Brochure, Business, Chart, Circle, Cyclic, Data, Diagram, Financial, Goal, Graph, Illustration, Info, Information, Investment, Manage, Marketing, Model, Option, Part, Pie, Presentation, Process, Result, Sphere, Statistics, Stock, Strategy, Template, Wheel. The prominent colors used in the PowerPoint template are Black, Gray, White. People tell us our 4 diverging steps of a logical sequence Circular Arrow Diagram PowerPoint templates provide you with a vast range of viable options. Select the appropriate ones and just fill in your text. Customers tell us our Chart PowerPoint templates and PPT Slides are Luxuriant. People tell us our 4 diverging steps of a logical sequence Circular Arrow Diagram PowerPoint templates are Versatile. Professionals tell us our Data PowerPoint templates and PPT Slides are Wistful. Customers tell us our 4 diverging steps of a logical sequence Circular Arrow Diagram PowerPoint templates look good visually. Use our Data PowerPoint templates and PPT Slides are Romantic. Our 4 Diverging Steps Of A Logical Sequence Circular Arrow Diagram PowerPoint Templates are specially created by professionals. They diligently strive to come up with the right vehicle for your thoughts.

Three Ways Action To Achieve Goal Circular Flow Network PowerPoint Templates
We present our three ways action to achieve goal Circular Flow Network PowerPoint templates.Download and present our Marketing PowerPoint Templates because profit is fairly earned in what you believe. Present our Business PowerPoint Templates because you too have got the framework of your companys growth in place. Present our Shapes PowerPoint Templates because you will be able to Highlight these individual targets and the paths to their achievement. Use our Finance PowerPoint Templates because by using this slide you can Heighten the anticipation of your audience listing . Use our Symbol PowerPoint Templates because you know what it takes to keep it fit and healthy.Use these PowerPoint slides for presentations relating to Arrows, Business, Chart, Cyclic, Data, Diagram, Financial, Goal, Graph, Illustration, Info, Information, Marketing, Model, Option, Part, Pie, Presentation, Process, Result, Sphere, Statistics. The prominent colors used in the PowerPoint template are Red, Blue, White. We assure you our three ways action to achieve goal Circular Flow Network PowerPoint templates are Graceful. Customers tell us our Goal PowerPoint templates and PPT Slides are designed by professionals The feedback we get is that our three ways action to achieve goal Circular Flow Network PowerPoint templates are effectively colour coded to prioritise your plans They automatically highlight the sequence of events you desire. We assure you our Data PowerPoint templates and PPT Slides are Wonderful. People tell us our three ways action to achieve goal Circular Flow Network PowerPoint templates will help you be quick off the draw. Just enter your specific text and see your points hit home. We assure you our Data PowerPoint templates and PPT Slides are Exuberant. Greet your conference with our Three Ways Action To Achieve Goal Circular Flow Network PowerPoint Templates. Try us out and see what a difference our templates make.
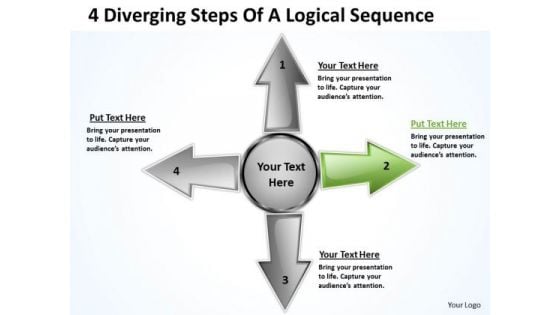
4 Diverging Steps Of A Logical Sequence Circular Arrow Diagram PowerPoint Template
We present our 4 diverging steps of a logical sequence Circular Arrow Diagram PowerPoint template.Present our Business PowerPoint Templates because Building castles in the sand is a danger and you are aware of. You have taken the precaution of building strong fundamentals. Use our Shapes PowerPoint Templates because they pinpoint the core values of your organisation. Download and present our Flow Charts PowerPoint Templates because you can illustrate your ideas and imprint them in the minds of your team with this template. Download our Arrows PowerPoint Templates because you can Enlighten them with your brilliant understanding of mental health. Present our Process and Flows PowerPoint Templates because readymade PowerPoint templates can prove best of your knowledge for your slides to show.Use these PowerPoint slides for presentations relating to Arrow, Brochure, Business, Chart, Circle, Cyclic, Data, Diagram, Financial, Goal, Graph, Illustration, Info, Information, Investment, Manage, Marketing, Model, Option, Part, Pie, Presentation, Process, Result, Sphere, Statistics, Stock, Strategy, Template, Wheel. The prominent colors used in the PowerPoint template are Green, Gray, White. People tell us our 4 diverging steps of a logical sequence Circular Arrow Diagram PowerPoint template are Wistful. Customers tell us our Data PowerPoint templates and PPT Slides are Stylish. People tell us our 4 diverging steps of a logical sequence Circular Arrow Diagram PowerPoint template are designed by professionals Professionals tell us our Data PowerPoint templates and PPT Slides are Majestic. Customers tell us our 4 diverging steps of a logical sequence Circular Arrow Diagram PowerPoint template are Youthful. Use our Chart PowerPoint templates and PPT Slides are Great. Create an effective checklist with our 4 Diverging Steps Of A Logical Sequence Circular Arrow Diagram PowerPoint Template. Put all the ticks in the right place.
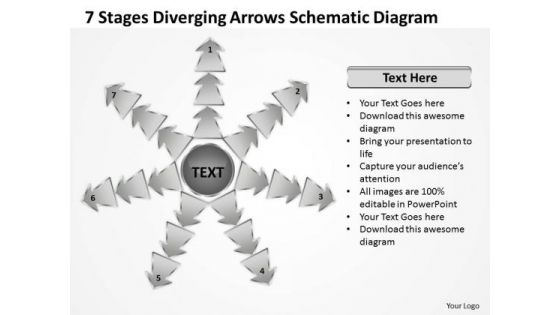
7 Stages Diverging Arrows Schematic Diagram Charts And Networks PowerPoint Slides
We present our 7 stages diverging arrows schematic diagram Charts and Networks PowerPoint Slides.Download and present our Marketing PowerPoint Templates because different personalities, different abilities but formidable together. Download and present our Shapes PowerPoint Templates because you have to coordinate and motivate your team. Download and present our Arrows PowerPoint Templates because our templates illustrates your ability. Download and present our Business PowerPoint Templates because everybody knows The world over it is a priority for many. Along with it there are so many oppurtunities waiting to be utilised. Use our Process and Flows PowerPoint Templates because they pinpoint the core values of your organisation.Use these PowerPoint slides for presentations relating to Arrows, Business, Chart, Cyclic, Data, Diagram, Financial, Goal, Graph, Illustration, Info, Information, Marketing, Model, Option, Part, Pie, Presentation, Process, Result, Sphere, Statistics. The prominent colors used in the PowerPoint template are White, Gray, Black. The feedback we get is that our 7 stages diverging arrows schematic diagram Charts and Networks PowerPoint Slides help you meet deadlines which are an element of today's workplace. Just browse and pick the slides that appeal to your intuitive senses. People tell us our Data PowerPoint templates and PPT Slides are Cheerful. Presenters tell us our 7 stages diverging arrows schematic diagram Charts and Networks PowerPoint Slides look good visually. Use our Data PowerPoint templates and PPT Slides are Wonderful. Use our 7 stages diverging arrows schematic diagram Charts and Networks PowerPoint Slides are Youthful. Use our Diagram PowerPoint templates and PPT Slides are Upbeat. Correct the errant with our 7 Stages Diverging Arrows Schematic Diagram Charts And Networks PowerPoint Slides. They will willingly accept your advice.
B2B Content Marketing Latest Trend Analysis Statistical Icons PDF
This slide shows the graph representing the statistical data related to latest trends emerging in the field of content marketing. It includes trends such as blog posts, email newsletters, case studies, videos, virtual events, infographics etc. Deliver an awe inspiring pitch with this creative B2B Content Marketing Latest Trend Analysis Statistical Icons PDF bundle. Topics like B2b Content Marketing, Latest Trend Analysis Statistical can be discussed with this completely editable template. It is available for immediate download depending on the needs and requirements of the user.
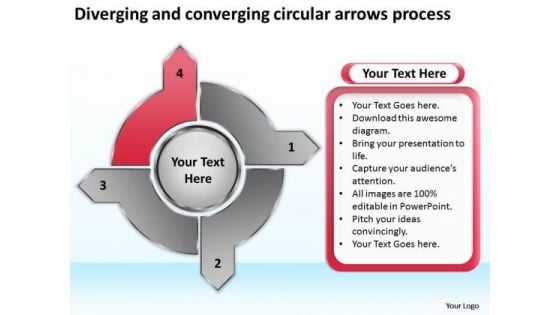
And Converging Circular Arrows Process Flow Motion PowerPoint Templates
We present our and converging circular arrows process Flow Motion PowerPoint templates.Download and present our Arrow PowerPoint Templates because you have the entire picture in mind. Use our Business PowerPoint Templates because infrastructure growth is an obvious requirement of today.inform your group on how exactly this potential is tailor made for you. Use our Process and Flows PowerPoint Templates because you must Evolve the strategy to take you down the required path with appropriate, efficient and effective marketing along the way. Use our Ring Charts PowerPoint Templates because you require care and diligence to function well. Download and present our Marketing PowerPoint Templates because your marketing strategies can funnel down to the cone, stage by stage, refining as you go along.Use these PowerPoint slides for presentations relating to Arrow, business, chart, circle,computegraphic, concepts, cycle, data,design, diagram, finance, flowing, global business, graph, growth, investment,marketing, organisation, presentation,repetition, square, stocks and shares, strategy, success, symbol, three-dimensional shape. The prominent colors used in the PowerPoint template are Red, Black, White. You can be sure our and converging circular arrows process Flow Motion PowerPoint templates are Efficacious. Professionals tell us our data PowerPoint templates and PPT Slides will make the presenter successul in his career/life. PowerPoint presentation experts tell us our and converging circular arrows process Flow Motion PowerPoint templates are Efficacious. You can be sure our concepts PowerPoint templates and PPT Slides are Multicolored. You can be sure our and converging circular arrows process Flow Motion PowerPoint templates are Dazzling. The feedback we get is that our data PowerPoint templates and PPT Slides are Clever. Collect prizes for presenting with our And Converging Circular Arrows Process Flow Motion PowerPoint Templates. You will come out on top.
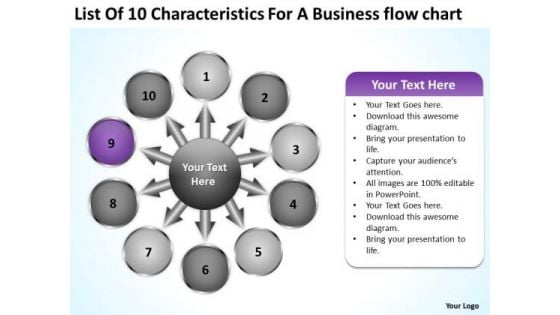
For A Free Business PowerPoint Templates Flow Chart Circular Process Slides
We present our for a free business powerpoint templates flow chart Circular Process Slides.Download our Ring Charts PowerPoint Templates because it is inspired by the indelible Olympic logo this graphic exemplifies the benefits of teamwork. Use our Shapes PowerPoint Templates because this slide demonstrates how they contribute to the larger melting pot. Download and present our Circle Charts PowerPoint Templates because it unravels the process layer by layer and exposes their relevance to the core issue. Download our Business PowerPoint Templates because you are sure you have the right people for your plans. Download our Process and Flows PowerPoint Templates because it unravels the process layer by layer and exposes their relevance to the core issue.Use these PowerPoint slides for presentations relating to Business,chart, circle, colors, concept,contemporary, corporate, cycle, data,design, detail, development, diagram, engineering, graphic, ideas,illustration, implement, implementation,management, model, modern,organization, phase, plan, process,product, professional, project, quality,schema, set, software, stack, stage, steps, strategy, success, system, tag, team. The prominent colors used in the PowerPoint template are Purple, Gray, Black. Customers tell us our for a free business powerpoint templates flow chart Circular Process Slides are Excellent. Customers tell us our data PowerPoint templates and PPT Slides are the best it can get when it comes to presenting. Customers tell us our for a free business powerpoint templates flow chart Circular Process Slides are Fashionable. People tell us our data PowerPoint templates and PPT Slides are Radiant. Customers tell us our for a free business powerpoint templates flow chart Circular Process Slides are Youthful. Customers tell us our colors PowerPoint templates and PPT Slides will save the presenter time. Exceed expectations with our For A Free Business PowerPoint Templates Flow Chart Circular Process Slides. You will come out on top.
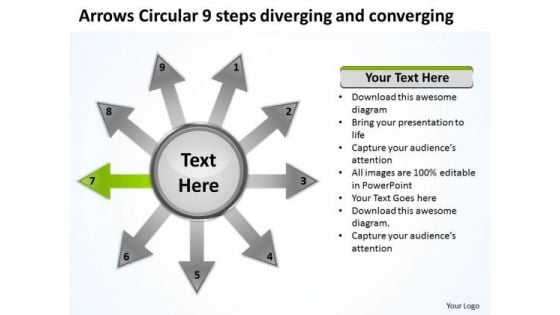
9 Steps Diverging And Converging Relative Circular Flow Arrow Network PowerPoint Templates
We present our 9 steps diverging and converging Relative Circular Flow Arrow Network PowerPoint templates.Use our Ring Charts PowerPoint Templates because with the help of our Slides you can Illustrate these thoughts with this slide. Present our Shapes PowerPoint Templates because you are ready to flap your wings and launch off. All poised are you to touch the sky with glory. Use our Circle Charts PowerPoint Templates because it unravels the process layer by layer and exposes their relevance to the core issue. Use our Business PowerPoint Templates because spell out your advertising plans to increase market share. The feedback has been positive and productive. Use our Process and Flows PowerPoint Templates because this slide helps you to communicate your concerns and educate your team along the path to success.Use these PowerPoint slides for presentations relating to Business, chart, circle, colors, concept, corporate, cycle, data, design, detail, development, diagram, engineering, graphic, ideas, illustration, image, implement, implementation, life, lifecycle, management, model, objects, organization, plan, process, product, professional, project, quality, schema, shape, stack, stage, steps, strategy, structure, success, symbol. The prominent colors used in the PowerPoint template are Orange, Black, Gray. You can be sure our 9 steps diverging and converging Relative Circular Flow Arrow Network PowerPoint templates are Nice. Presenters tell us our data PowerPoint templates and PPT Slides are Tranquil. We assure you our 9 steps diverging and converging Relative Circular Flow Arrow Network PowerPoint templates are Efficacious. Customers tell us our data PowerPoint templates and PPT Slides are One-of-a-kind. Presenters tell us our 9 steps diverging and converging Relative Circular Flow Arrow Network PowerPoint templates are One-of-a-kind. You can be sure our cycle PowerPoint templates and PPT Slides are Stylish. Success without failure is difficult to achieve. Our 9 Steps Diverging And Converging Relative Circular Flow Arrow Network PowerPoint Templates help add to the chances.
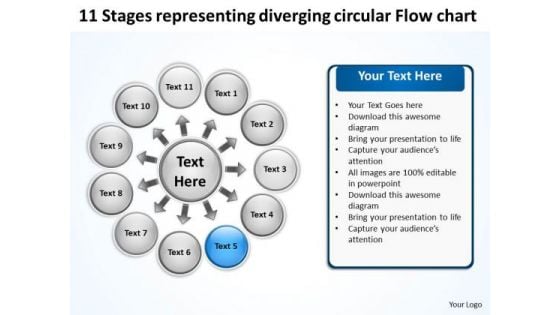
11 Stages Representing Diverging Circular Flow Chart Cycle Layout Diagram PowerPoint Slides
We present our 11 stages representing diverging circular flow chart Cycle Layout Diagram PowerPoint Slides.Download our Arrows PowerPoint Templates because this diagram helps you to explain your strategy to co-ordinate activities of these seperate groups. Use our Flow charts PowerPoint Templates because this template helps you to put your finger on the pulse of your business and sense the need to re-align a bit. Download and present our Business PowerPoint Templates because it helps you to project your enthusiasm and single mindedness to your colleagues. Download and present our Process and Flows PowerPoint Templates because your brain is always churning out ideas like cogs in a wheel. Present our Circle charts PowerPoint Templates because it shows you the vision of a desired destination and the best road to take to reach that goal.Use these PowerPoint slides for presentations relating to Business, chart, circle, colors, concept, corporate, cycle, data, design, detail, development, diagram, engineering, graphic, ideas, illustration, image, implement, implementation, life, lifecycle, management, model, objects, organization, plan, process, product, professional, project, quality, schema, shape, stack, stage, steps, strategy, structure, success, symbol. The prominent colors used in the PowerPoint template are Blue, Gray, Black. You can be sure our 11 stages representing diverging circular flow chart Cycle Layout Diagram PowerPoint Slides are designed by a team of presentation professionals. Presenters tell us our circle PowerPoint templates and PPT Slides are Precious. We assure you our 11 stages representing diverging circular flow chart Cycle Layout Diagram PowerPoint Slides are Clever. Customers tell us our data PowerPoint templates and PPT Slides are Dazzling. Presenters tell us our 11 stages representing diverging circular flow chart Cycle Layout Diagram PowerPoint Slides are Amazing. You can be sure our data PowerPoint templates and PPT Slides are incredible easy to use. Nourish the self-esteem of your employees. Acknowledge their accomplishments with our 11 Stages Representing Diverging Circular Flow Chart Cycle Layout Diagram PowerPoint Slides.
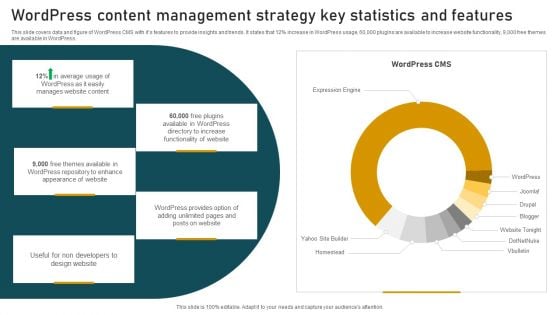
Wordpress Content Management Strategy Key Statistics And Features Summary PDF
This slide covers data and figure of WordPress CMS with its features to provide insights and trends. It states that 12 percent increase in WordPress usage, 60,000 plugins are available to increase website functionality, 9,000 free themes are available in WordPress. Showcasing this set of slides titled Wordpress Content Management Strategy Key Statistics And Features Summary PDF. The topics addressed in these templates are Wordpress Content, Management Strategy, Statistics And Features. All the content presented in this PPT design is completely editable. Download it and make adjustments in color, background, font etc. as per your unique business setting.
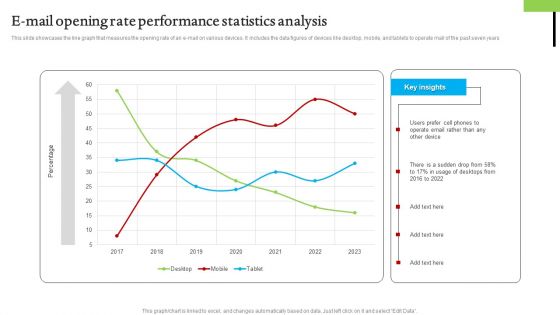
E Mail Opening Rate Performance Statistics Analysis Mockup PDF
This slide showcases the line graph that measures the opening rate of an e-mail on various devices. It includes the data figures of devices like desktop, mobile, and tablets to operate mail of the past seven years. Showcasing this set of slides titled E Mail Opening Rate Performance Statistics Analysis Mockup PDF. The topics addressed in these templates are E Mail Opening Rate, Performance Statistics Analysis. All the content presented in this PPT design is completely editable. Download it and make adjustments in color, background, font etc. as per your unique business setting.
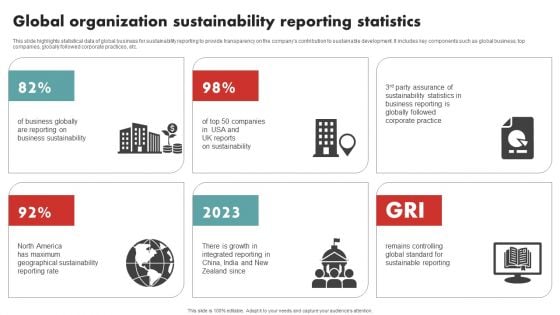
Global Organization Sustainability Reporting Statistics Inspiration PDF
This slide highlights statistical data of global business for sustainability reporting to provide transparency on the companys contribution to sustainable development. It includes key components such as global business, top companies, globally followed corporate practices, etc. Pitch your topic with ease and precision using this Global Organization Sustainability Reporting Statistics Inspiration PDF This layout presents information on Business Sustainability, Sustainability, Corporate Practice. It is also available for immediate download and adjustment. So, changes can be made in the color, design, graphics or any other component to create a unique layout.
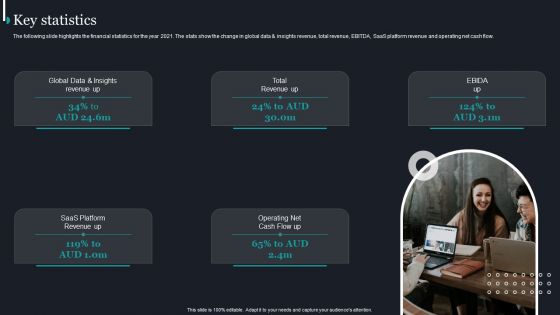
Pureprofile Business Overview Key Statistics Ppt Styles Microsoft PDF
The following slide highlights the financial statistics for the year 2021. The stats show the change in global data and insights revenue, total revenue, EBITDA, SaaS platform revenue and operating net cash flow. This is a Pureprofile Business Overview Key Statistics Ppt Styles Microsoft PDF template with various stages. Focus and dispense information on one stages using this creative set, that comes with editable features. It contains large content boxes to add your information on topics like SaaS Platform, Revenue Operating Net, Cash Flow. You can also showcase facts, figures, and other relevant content using this PPT layout. Grab it now.
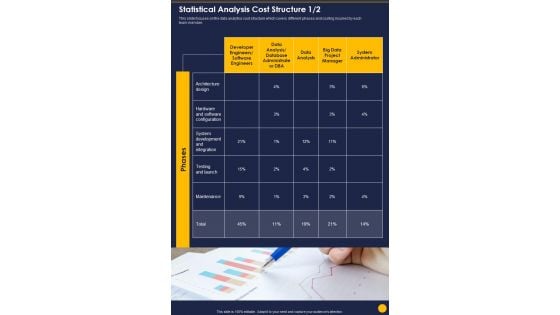
Statistical Evaluation Of Research Discovery Statistical Analysis Cost Structure One Pager Sample Example Document
This slide focuses on the data analytics cost structure which covers different phases and costing incurred by each team member. Presenting you an exemplary Statistical Evaluation Of Research Discovery Statistical Analysis Cost Structure One Pager Sample Example Document. Our one pager comprises all the must have essentials of an inclusive document. You can edit it with ease, as its layout is completely editable. With such freedom, you can tweak its design and other elements to your requirements. Download this Statistical Evaluation Of Research Discovery Statistical Analysis Cost Structure One Pager Sample Example Document brilliant piece now.
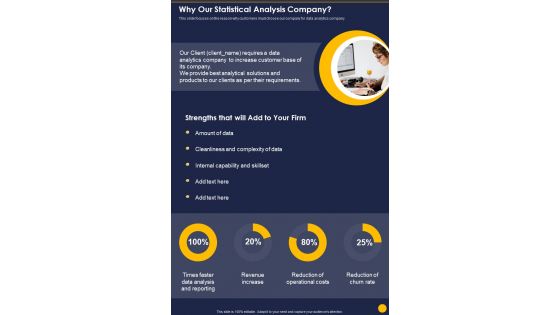
Statistical Evaluation Of Research Discovery Why Our Statistical Analysis Company One Pager Sample Example Document
This slide focuses on the reason why customers must choose our company for data analytics company. Presenting you an exemplary Statistical Evaluation Of Research Discovery Why Our Statistical Analysis Company One Pager Sample Example Document. Our one pager comprises all the must have essentials of an inclusive document. You can edit it with ease, as its layout is completely editable. With such freedom, you can tweak its design and other elements to your requirements. Download this Statistical Evaluation Of Research Discovery Why Our Statistical Analysis Company One Pager Sample Example Document brilliant piece now.
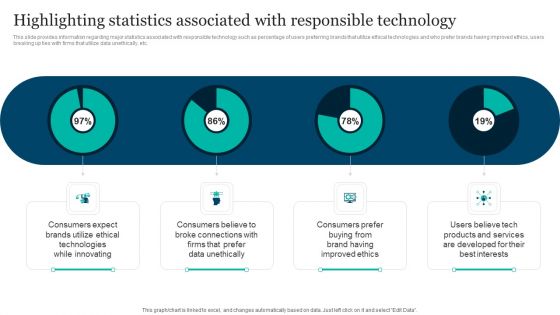
Responsible Technology Playbook Highlighting Statistics Associated With Responsible Rules PDF
This slide provides information regarding major statistics associated with responsible technology such as percentage of users preferring brands that utilize ethical technologies and who prefer brands having improved ethics, users breaking up ties with firms that utilize data unethically, etc. There are so many reasons you need a Responsible Technology Playbook Highlighting Statistics Associated With Responsible Rules PDF. The first reason is you cant spend time making everything from scratch, Thus, Slidegeeks has made presentation templates for you too. You can easily download these templates from our website easily.
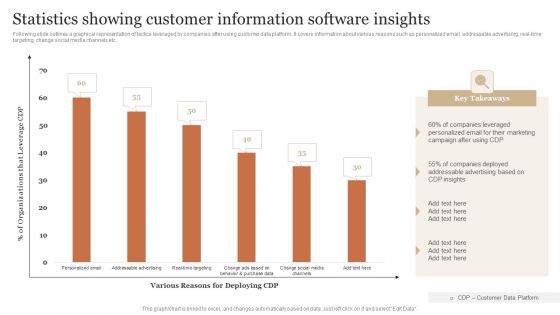
Statistics Showing Customer Information Software Insights Portrait PDF
Following slide outlines a graphical representation of tactics leveraged by companies after using customer data platform. It covers information about various reasons such as personalized email, addressable advertising, real-time targeting, change social media channels etc. Showcasing this set of slides titled Statistics Showing Customer Information Software Insights Portrait PDF. The topics addressed in these templates are Companies Leveraged, Personalized Marketing, Addressable Advertising. All the content presented in this PPT design is completely editable. Download it and make adjustments in color, background, font etc. as per your unique business setting.
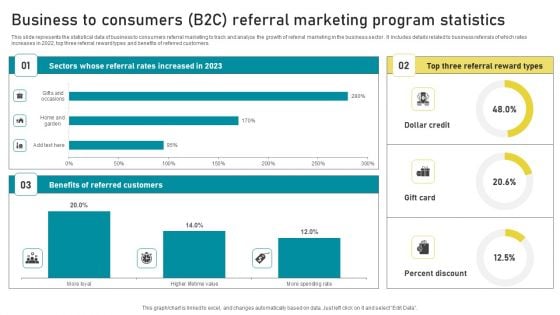
Business To Consumers B2C Referral Marketing Program Statistics Information PDF
This slide represents the statistical data of business to consumers referral marketing to track and analyze the growth of referral marketing in the business sector . It includes details related to business referrals of which rates increases in 2022, top three referral reward types and benefits of referred customers. Pitch your topic with ease and precision using this Business To Consumers B2C Referral Marketing Program Statistics Information PDF. This layout presents information on Top Three Referral, Reward Types, Dollar Credit, Percent Discount, Gift Card. It is also available for immediate download and adjustment. So, changes can be made in the color, design, graphics or any other component to create a unique layout.
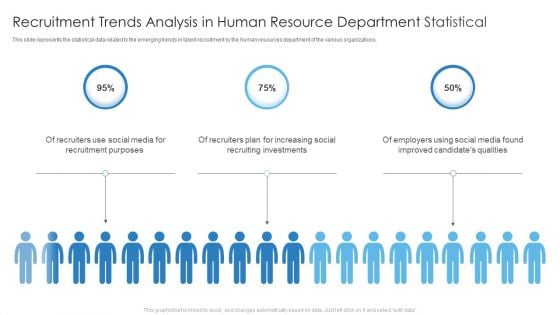
Recruitment Trends Analysis In Human Resource Department Statistical Download PDF
This slide represents the statistical data related to the emerging trends in talent recruitment by the human resources department of the various organizations. Presenting Recruitment Trends Analysis In Human Resource Department Statistical Download PDF to provide visual cues and insights. Share and navigate important information on three stages that need your due attention. This template can be used to pitch topics like Recruiting Investments, Social Media, Recruitment Purposes. In addtion, this PPT design contains high resolution images, graphics, etc, that are easily editable and available for immediate download.
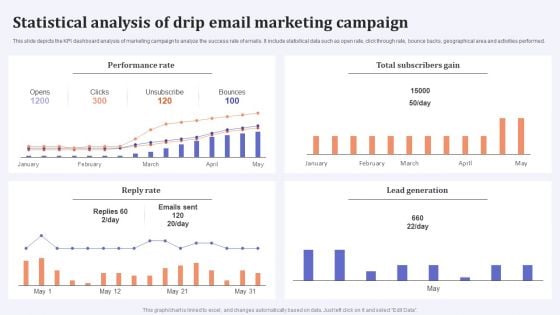
Statistical Analysis Of Drip Email Marketing Campaign Microsoft PDF
This slide depicts the KPI dashboard analysis of marketing campaign to analyze the success rate of emails. It include statistical data such as open rate, click through rate, bounce backs, geographical area and activities performed. Showcasing this set of slides titled Statistical Analysis Of Drip Email Marketing Campaign Microsoft PDF. The topics addressed in these templates are Performance Rate, Total Subscribers Gain, Reply Rate. All the content presented in this PPT design is completely editable. Download it and make adjustments in color, background, font etc. as per your unique business setting.
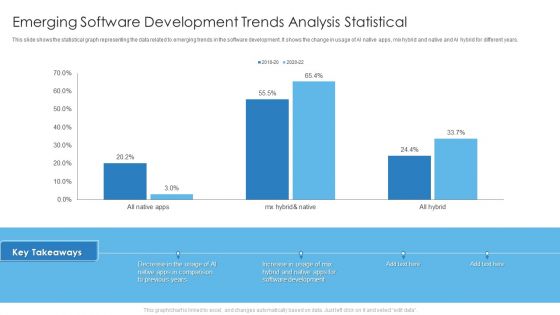
Emerging Software Development Trends Analysis Statistical Diagrams PDF
This slide shows the statistical graph representing the data related to emerging trends in the software development. It shows the change in usage of AI native apps, mix hybrid and native and AI hybrid for different years. Deliver and pitch your topic in the best possible manner with this Emerging Software Development Trends Analysis Statistical Diagrams PDF. Use them to share invaluable insights on Emerging Software Development, Trends Analysis Statistical and impress your audience. This template can be altered and modified as per your expectations. So, grab it now.
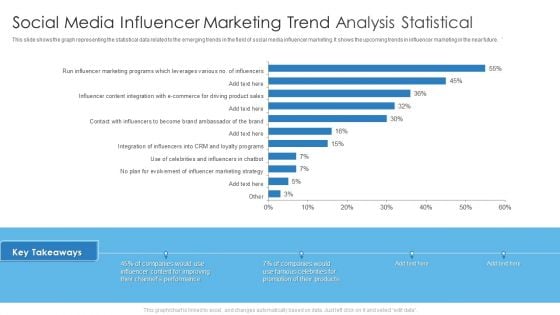
Social Media Influencer Marketing Trend Analysis Statistical Themes PDF
This slide shows the graph representing the statistical data related to the emerging trends in the field of social media influencer marketing. It shows the upcoming trends in influencer marketing in the near future. Deliver an awe inspiring pitch with this creative Social Media Influencer Marketing Trend Analysis Statistical Themes PDF bundle. Topics like Social Media Influencer, Marketing Trend Analysis Statistical can be discussed with this completely editable template. It is available for immediate download depending on the needs and requirements of the user.
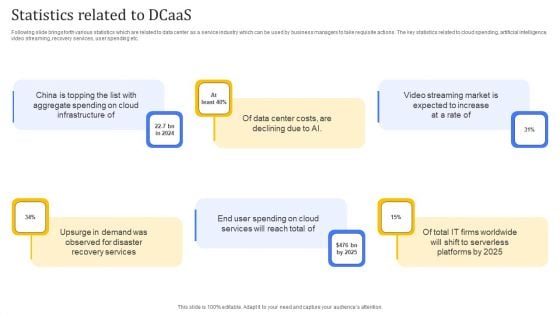
Statistics Related To Dcaas Summary PDF
Following slide brings forth various statistics which are related to data center as a service industry which can be used by business managers to take requisite actions. The key statistics related to cloud spending, artificial intelligence, video streaming, recovery services, user spending etc. Presenting Statistics Related To Dcaas Summary PDF to dispense important information. This template comprises six stages. It also presents valuable insights into the topics including Aggregate Spending, Streaming Market, Statistics Related. This is a completely customizable PowerPoint theme that can be put to use immediately. So, download it and address the topic impactfully.
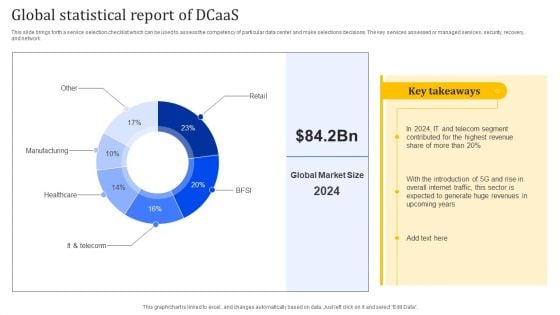
Global Statistical Report Of Dcaas Portrait PDF
This slide brings forth a service selection checklist which can be used to assess the competency of particular data center and make selections decisions. The key services assessed or managed services, security, recovery, and network. Showcasing this set of slides titled Global Statistical Report Of Dcaas Portrait PDF. The topics addressed in these templates are Manufacturing, Healthcare, Global Statistical. All the content presented in this PPT design is completely editable. Download it and make adjustments in color, background, font etc. as per your unique business setting.
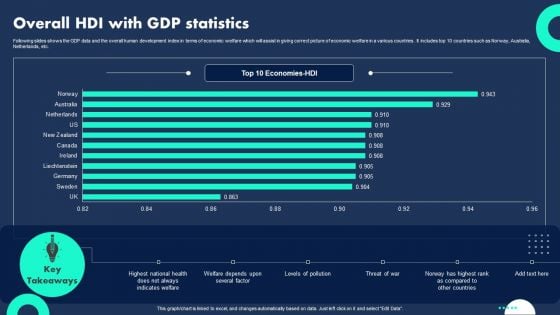
Overall HDI With Gdp Statistics Professional PDF
Following slides shows the GDP data and the overall human development index in terms of economic welfare which will assist in giving correct picture of economic welfare in a various countries . It includes top 10 countries such as Norway, Australia, Netherlands, etc. Showcasing this set of slides titled Overall HDI With Gdp Statistics Professional PDF. The topics addressed in these templates are Indicates Welfare, Welfare Depends, Levels Pollution. All the content presented in this PPT design is completely editable. Download it and make adjustments in color, background, font etc. as per your unique business setting.
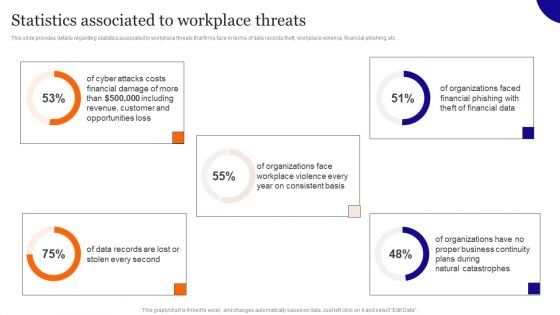
Statistics Associated To Workplace Threats Diagrams PDF
This slide provides details regarding statistics associated to workplace threats that firms face in terms of data records theft, workplace violence, financial phishing, etc. Get a simple yet stunning designed Statistics Associated To Workplace Threats Diagrams PDF. It is the best one to establish the tone in your meetings. It is an excellent way to make your presentations highly effective. So, download this PPT today from Slidegeeks and see the positive impacts. Our easy-to-edit Statistics Associated To Workplace Threats Diagrams PDF can be your go-to option for all upcoming conferences and meetings. So, what are you waiting for Grab this template today.

Mitigating Cybersecurity Threats And Vulnerabilities Statistics Associated Mockup PDF
This slide provides details regarding statistics associated to workplace threats that firms face in terms of data records theft, workplace violence, financial phishing, etc. This is a mitigating cybersecurity threats and vulnerabilities statistics associated mockup pdf template with various stages. Focus and dispense information on five stages using this creative set, that comes with editable features. It contains large content boxes to add your information on topics like statistics associated to workplace threats. You can also showcase facts, figures, and other relevant content using this PPT layout. Grab it now.
Creating Content Marketing Technique For Brand Promotions Content Marketing Strategy Performance Statistics Icons PDF
This slide mentions statistics that highlight the success rate of implementing content marketing strategy by businesses brands. It includes data mentioning lead generation, purchases, cost analysis, strategy and engagement. If your project calls for a presentation, then Slidegeeks is your go-to partner because we have professionally designed, easy-to-edit templates that are perfect for any presentation. After downloading, you can easily edit Creating Content Marketing Technique For Brand Promotions Content Marketing Strategy Performance Statistics Icons PDF and make the changes accordingly. You can rearrange slides or fill them with different images. Check out all the handy templates
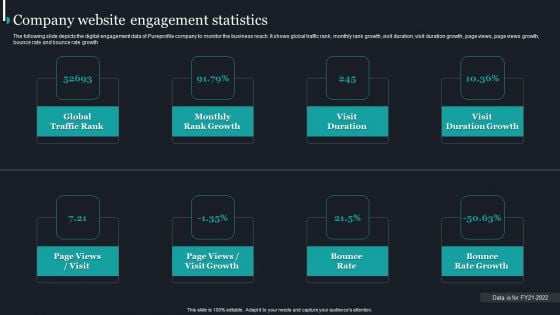
Pureprofile Business Overview Company Website Engagement Statistics Elements PDF
The following slide depicts the digital engagement data of Pureprofile company to monitor the business reach. It shows global traffic rank, monthly rank growth, visit duration, visit duration growth, page views, page views growth, bounce rate and bounce rate growthThis is a Pureprofile Business Overview Company Website Engagement Statistics Elements PDF template with various stages. Focus and dispense information on eight stages using this creative set, that comes with editable features. It contains large content boxes to add your information on topics like Global Traffic Rank, Monthly Rank Growth, Visit Duration. You can also showcase facts, figures, and other relevant content using this PPT layout. Grab it now.
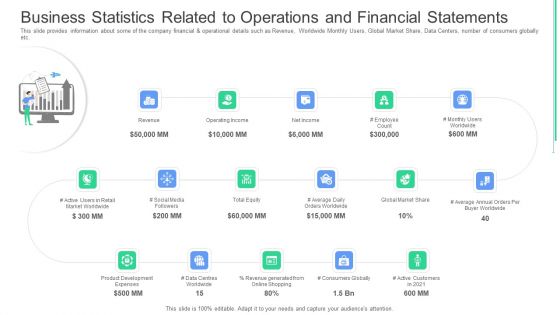
Business Statistics Related To Operations And Financial Statements Ppt Portfolio Designs Download PDF
This slide provides information about some of the company financial and operational details such as Revenue, Worldwide Monthly Users, Global Market Share, Data Centers, number of consumers globally etc. This is a business statistics related to operations and financial statements ppt portfolio designs download pdf. template with various stages. Focus and dispense information on one stages using this creative set, that comes with editable features. It contains large content boxes to add your information on topics like operating income, revenue, net income, total equity, global market share. You can also showcase facts, figures, and other relevant content using this PPT layout. Grab it now.
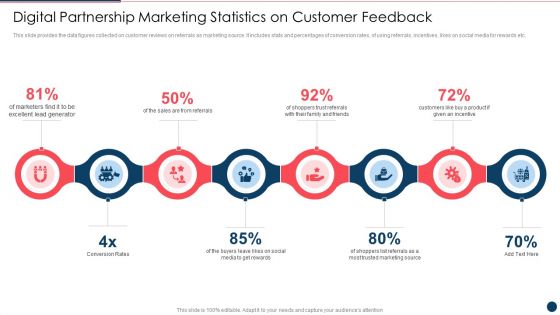
Digital Partnership Marketing Statistics On Customer Feedback Ppt PowerPoint Presentation File Background Image PDF
This slide provides the data figures collected on customer reviews on referrals as marketing source. It includes stats and percentages of conversion rates, of using referrals, incentives, likes on social media for rewards etc. Presenting digital partnership marketing statistics on customer feedback ppt powerpoint presentation file background image pdf to dispense important information. This template comprises seven stages. It also presents valuable insights into the topics including marketing, source, customers. This is a completely customizable PowerPoint theme that can be put to use immediately. So, download it and address the topic impactfully.
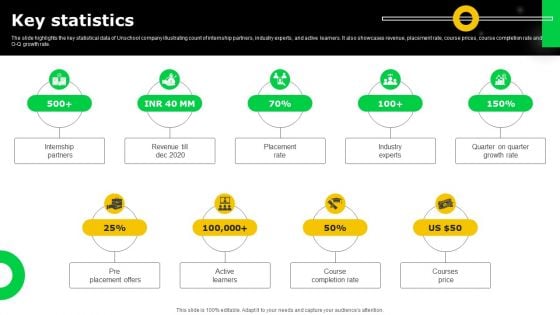
Electronic Certification Company Key Statistics Ppt Portfolio Background Designs PDF
The slide highlights the key statistical data of Unschool company illustrating count of internship partners, industry experts, and active learners. It also showcases revenue, placement rate, course prices, course completion rate and Q-O-Q growth rate. There are so many reasons you need a Electronic Certification Company Key Statistics Ppt Portfolio Background Designs PDF. The first reason is you can not spend time making everything from scratch, Thus, Slidegeeks has made presentation templates for you too. You can easily download these templates from our website easily.
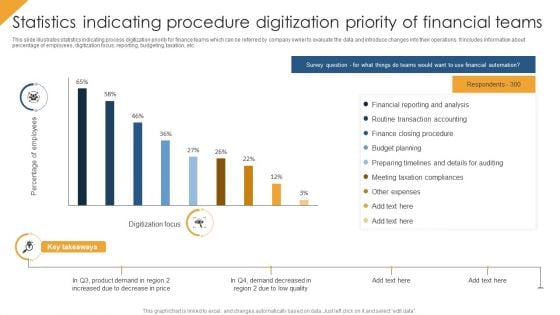
Statistics Indicating Procedure Digitization Priority Of Financial Teams Themes PDF
This slide illustrates statistics indicating process digitization priority for finance teams which can be referred by company owner to evaluate the data and introduce changes into their operations. It includes information about percentage of employees, digitization focus, reporting, budgeting, taxation, etc. Showcasing this set of slides titled Statistics Indicating Procedure Digitization Priority Of Financial Teams Themes PDF. The topics addressed in these templates are Budget Planning, Financial Reporting And Analysis, Other Expenses. All the content presented in this PPT design is completely editable. Download it and make adjustments in color, background, font etc. as per your unique business setting.
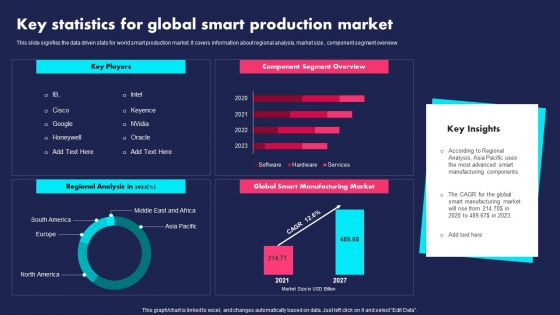
Key Statistics For Global Smart Production Market Ppt PowerPoint Presentation File Slides PDF
This slide signifies the data driven stats for world smart production market. It covers information about regional analysis, market size, component segment overview. Pitch your topic with ease and precision using this Key Statistics For Global Smart Production Market Ppt PowerPoint Presentation File Slides PDF. This layout presents information on Key Players, Component Segment Overview, Regional Analysis. It is also available for immediate download and adjustment. So, changes can be made in the color, design, graphics or any other component to create a unique layout.
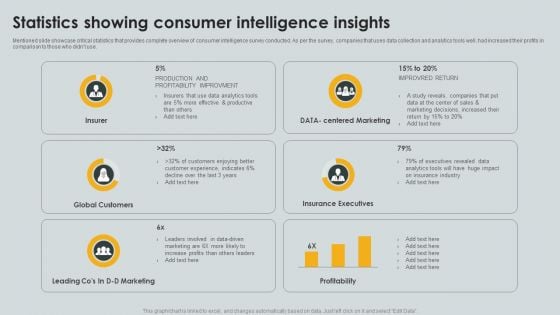
Statistics Showing Consumer Intelligence Insights Ppt PowerPoint Presentation Gallery Information PDF
Mentioned slide showcase critical statistics that provides complete overview of consumer intelligence survey conducted. As per the survey, companies that uses data collection and analytics tools well, had increased their profits in comparison to those who didnt use. Showcasing this set of slides titled Statistics Showing Consumer Intelligence Insights Ppt PowerPoint Presentation Gallery Information PDF. The topics addressed in these templates are Insurer, Global Customers, Insurance Executives. All the content presented in this PPT design is completely editable. Download it and make adjustments in color, background, font etc. as per your unique business setting.
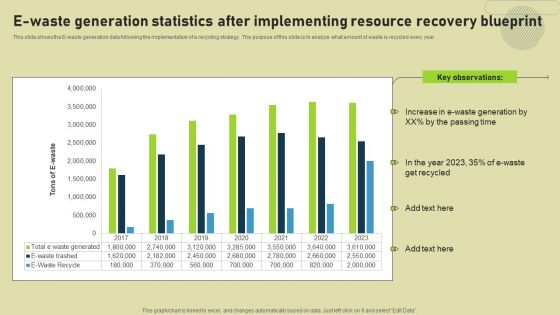
E Waste Generation Statistics After Implementing Resource Recovery Blueprint Information PDF
This slide shows the E-waste generation data following the implementation of a recycling strategy. The purpose of this slide is to analyze what amount of waste is recycled every year. Showcasing this set of slides titled E Waste Generation Statistics After Implementing Resource Recovery Blueprint Information PDF. The topics addressed in these templates are E Waste Generation Statistics, Implementing Resource Recovery Blueprint. All the content presented in this PPT design is completely editable. Download it and make adjustments in color, background, font etc. as per your unique business setting.
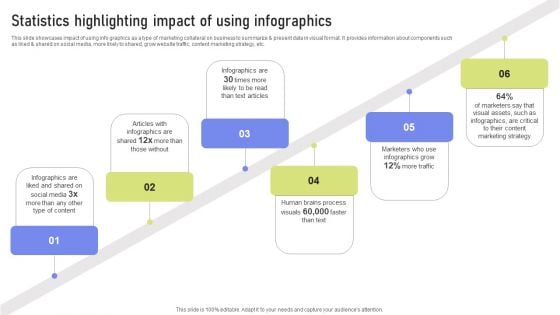
Statistics Highlighting Impact Of Using Infographics Ppt PowerPoint Presentation File Styles PDF
This slide showcases impact of using info graphics as a type of marketing collateral on business to summarize and present data in visual format. It provides information about components such as liked and shared on social media, more likely to shared, grow website traffic, content marketing strategy, etc. There are so many reasons you need a Statistics Highlighting Impact Of Using Infographics Ppt PowerPoint Presentation File Styles PDF. The first reason is you cannot spend time making everything from scratch, Thus, Slidegeeks has made presentation templates for you too. You can easily download these templates from our website easily.
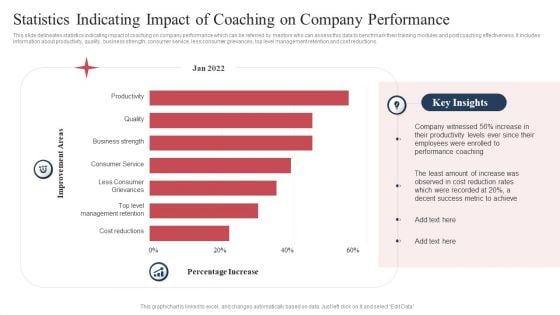
Statistics Indicating Impact Of Coaching On Company Performance Formats PDF
This slide delineates statistics indicating impact of coaching on company performance which can be referred by mentors who can assess this data to benchmark their training modules and post coaching effectiveness. It includes information about productivity, quality, business strength, consumer service, less consumer grievances, top level management retention and cost reductions. Pitch your topic with ease and precision using this Statistics Indicating Impact Of Coaching On Company Performance Formats PDF. This layout presents information on Productivity, Quality, Business Strength. It is also available for immediate download and adjustment. So, changes can be made in the color, design, graphics or any other component to create a unique layout.
Robotic Process Automation Metrics Tracker With Work Item Statistics Information PDF
This slide covers the RPA dashboard for analysing process data status. It also includes process details such as run success rate, inputs, processing, fail, output, robotic run minutes, total value generated, work items processed. Pitch your topic with ease and precision using this Robotic Process Automation Metrics Tracker With Work Item Statistics Information PDF. This layout presents information on Robotic Process Automation, Metrics Tracker, Work Item Statistics. It is also available for immediate download and adjustment. So, changes can be made in the color, design, graphics or any other component to create a unique layout.
CSR Report On Employees Statistics During Pandemic Icons PDF
This slide illustrates data related to CSR human resources of a corporation. It includes global employees, dough-nut chart of North American employees, global employees by age etc. Showcasing this set of slides titled CSR Report On Employees Statistics During Pandemic Icons PDF. The topics addressed in these templates are Global Employees, Supporting Workforce Transformation, Employees Statistics During Pandemic. All the content presented in this PPT design is completely editable. Download it and make adjustments in color, background, font etc. as per your unique business setting.


 Continue with Email

 Home
Home


