Deliverable Icon
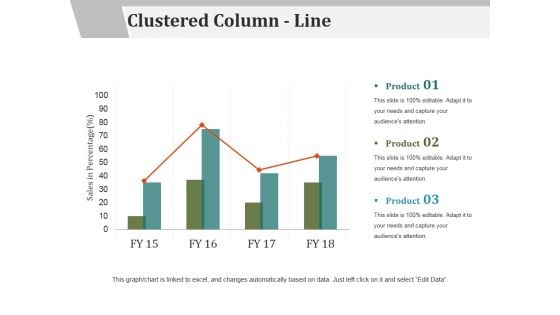
Clustered Column Line Ppt PowerPoint Presentation File Examples
This is a clustered column line ppt powerpoint presentation file examples. This is a three stage process. The stages in this process are sales in percentage, product, business, marketing, success.
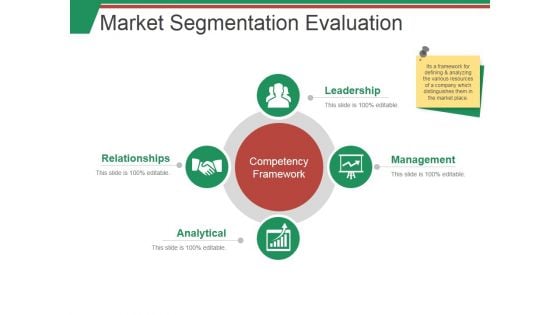
Market Segmentation Evaluation Template 1 Ppt PowerPoint Presentation Summary Smartart
This is a market segmentation evaluation template 1 ppt powerpoint presentation summary smartart. This is a two stage process. The stages in this process are market sales, net profit, beverages, milk product, nutrition.
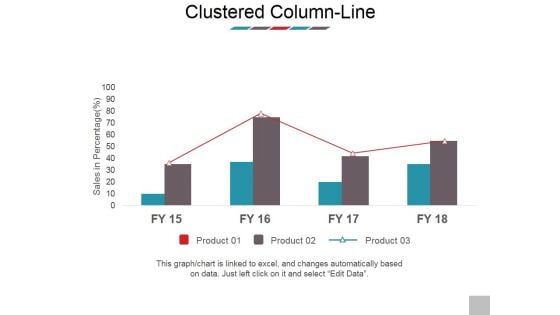
Clustered Column Line Ppt PowerPoint Presentation Model Images
This is a clustered column line ppt powerpoint presentation model images. This is a four stage process. The stages in this process are sales in percentage, product, business, marketing, bar graph.
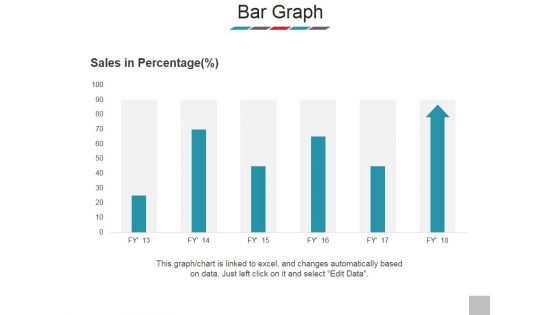
Bar Graph Ppt PowerPoint Presentation Model Clipart
This is a bar graph ppt powerpoint presentation model clipart. This is a six stage process. The stages in this process are sales in percentage, product, bar graph, business, marketing.
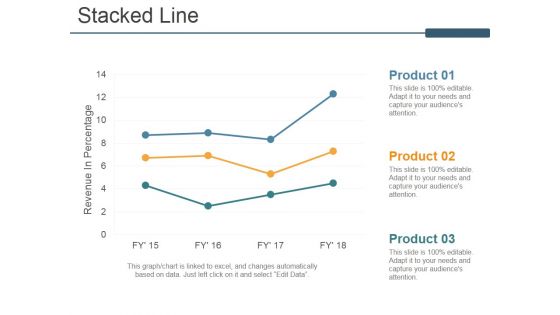
Stacked Line Ppt PowerPoint Presentation Ideas Model
This is a stacked line ppt powerpoint presentation ideas model. This is a three stage process. The stages in this process are revenue in percentage, stacked line, product, business, marketing.
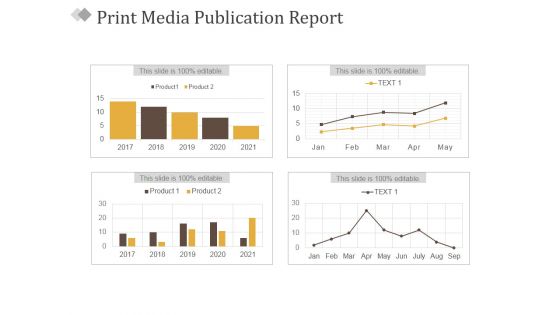
Print Media Publication Report Ppt PowerPoint Presentation Summary Information
This is a print media publication report ppt powerpoint presentation summary information. This is a four stage process. The stages in this process are business, product, marketing, management, success.
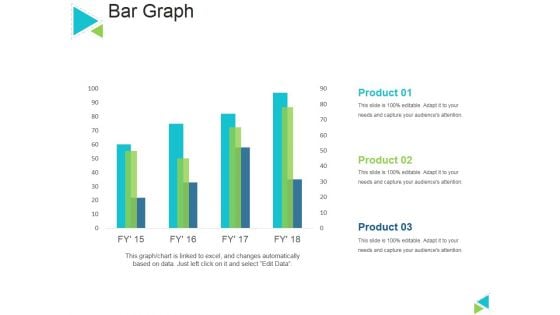
Bar Graph Ppt PowerPoint Presentation Outline Layout
This is a bar graph ppt powerpoint presentation outline layout. This is a four stage process. The stages in this process are sales in percentage, product, bar graph, business, marketing.
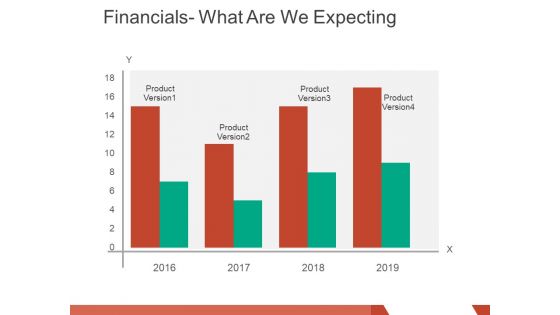
financials what are we expecting ppt powerpoint presentation layouts graphics pictures
This is a financials what are we expecting ppt powerpoint presentation layouts graphics pictures. This is a four stage process. The stages in this process are product version, business, marketing, finance, graph.
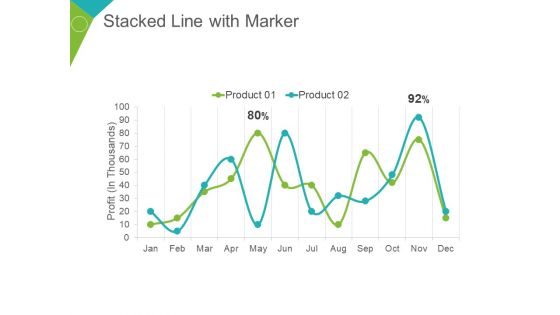
Stacked Line With Marker Ppt PowerPoint Presentation Summary Demonstration
This is a stacked line with marker ppt powerpoint presentation summary demonstration. This is a two stage process. The stages in this process are profit in thousands, product, percentage, finance, business.
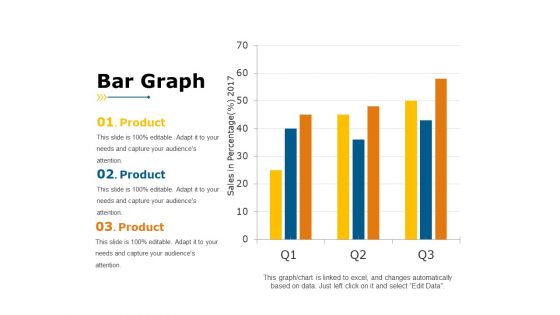
Bar Graph Ppt PowerPoint Presentation Portfolio Example
This is a bar graph ppt powerpoint presentation portfolio example. This is a three stage process. The stages in this process are sales in percentage, year, business, product, business, graph.
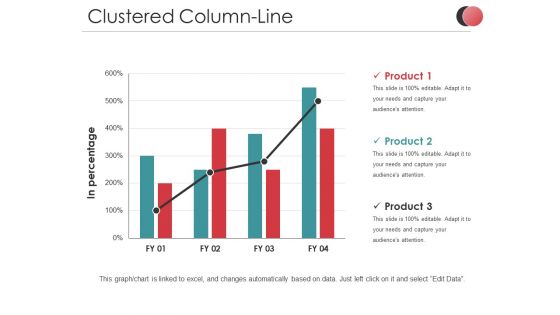
Clustered Column Line Ppt PowerPoint Presentation Infographics Templates
This is a clustered column line ppt powerpoint presentation infographics templates. This is a three stage process. The stages in this process are in percentage, business, marketing, product, finance, graph.
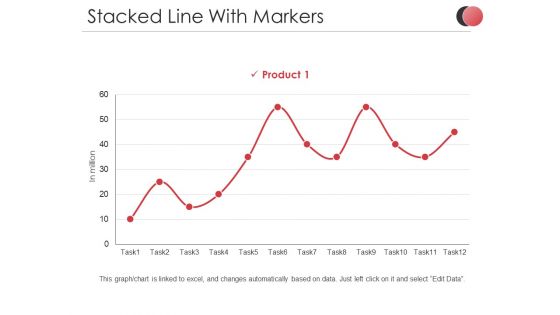
Stacked Line With Markers Ppt PowerPoint Presentation Slides Demonstration
This is a stacked line with markers ppt powerpoint presentation slides demonstration. This is a one stage process. The stages in this process are in million, product, percentage, business, marketing, finance.
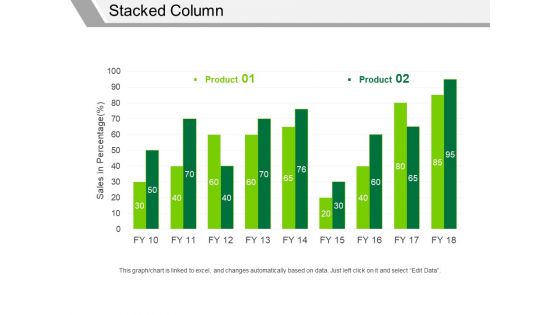
Stacked Column Ppt PowerPoint Presentation Infographics Samples
This is a stacked column ppt powerpoint presentation infographics samples. This is a two stage process. The stages in this process are product, sales in percentage, business, marketing, graph.
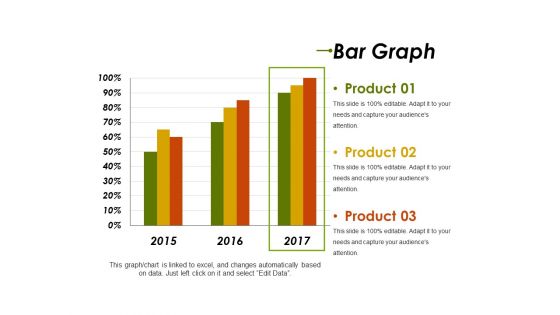
Bar Graph Template 1 Ppt PowerPoint Presentation Slides Format Ideas
This is a bar graph template 1 ppt powerpoint presentation slides format ideas. This is a three stage process. The stages in this process are product, years, bar graph, business, marketing.
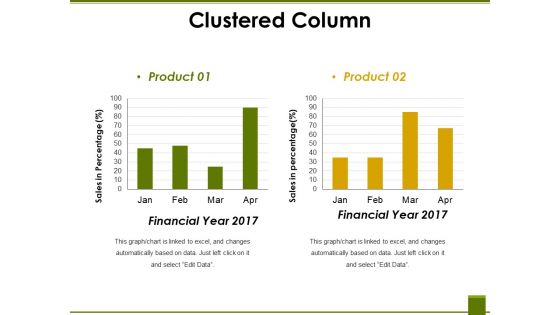
Clustered Column Ppt PowerPoint Presentation Ideas Graphic Tips
This is a clustered column ppt powerpoint presentation ideas graphic tips. This is a two stage process. The stages in this process are financial year, sales in percentage, product, graph, business.
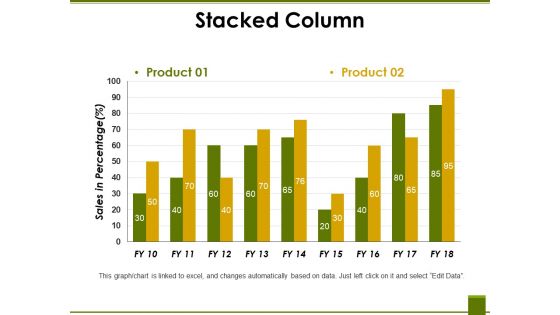
Stacked Column Ppt PowerPoint Presentation Professional Vector
This is a stacked column ppt powerpoint presentation professional vector. This is a two stage process. The stages in this process are product, sales in percentage, business, marketing, graph.
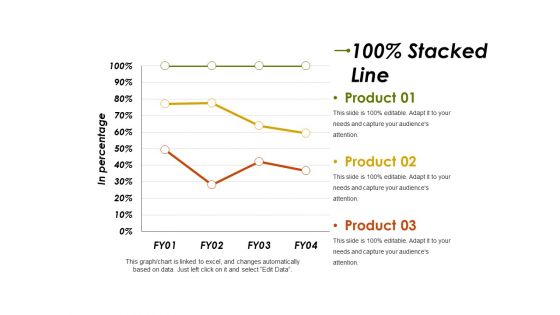
Stacked Line Ppt PowerPoint Presentation Infographic Template Graphics Template
This is a stacked line ppt powerpoint presentation infographic template graphics template. This is a three stage process. The stages in this process are product, in percentage, business, marketing, finance.
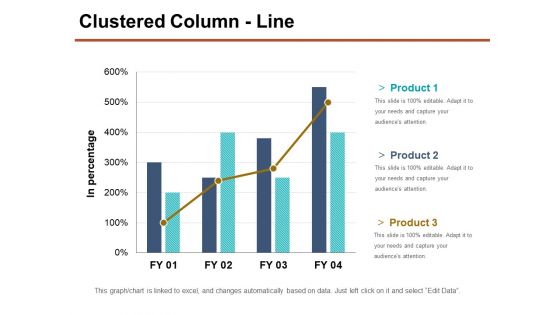
Clustered Column Line Ppt PowerPoint Presentation Inspiration Layouts
This is a clustered column line ppt powerpoint presentation inspiration layouts. This is a four stage process. The stages in this process are in percentage, product, business, strategy, graph.
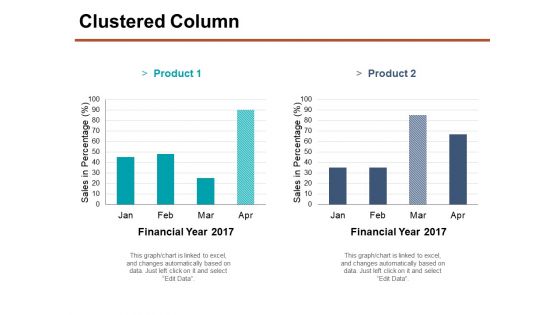
Clustered Column Ppt PowerPoint Presentation Portfolio Smartart
This is a clustered column ppt powerpoint presentation portfolio smartart. This is a two stage process. The stages in this process are financial year, product, sales in percentage, finance, business, graph.
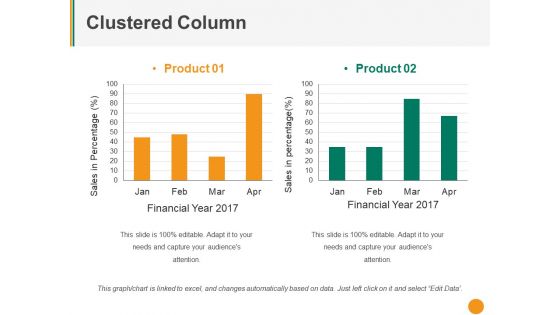
Clustered Column Ppt PowerPoint Presentation Pictures Mockup
This is a clustered column ppt powerpoint presentation pictures mockup. This is a two stage process. The stages in this process are product, sales in percentage, financial year, graph, business.
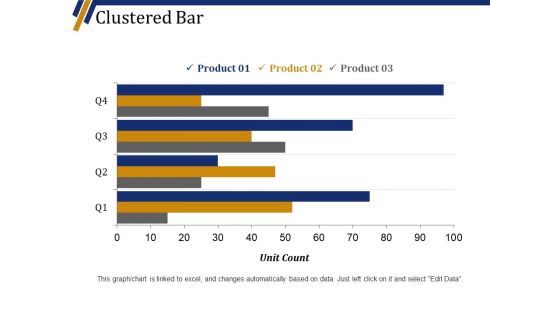
Clustered Bar Ppt PowerPoint Presentation Show Slide Portrait
This is a clustered bar ppt powerpoint presentation show slide portrait. This is a four stage process. The stages in this process are product, unit count, graph, business, marketing.
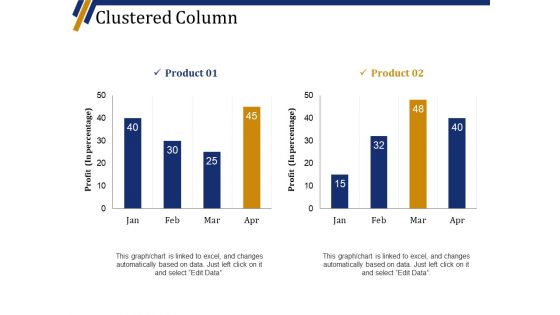
Clustered Column Ppt PowerPoint Presentation Professional Graphic Tips
This is a clustered column ppt powerpoint presentation professional graphic tips. This is a two stage process. The stages in this process are product, profit in percentage, graph, business, marketing.
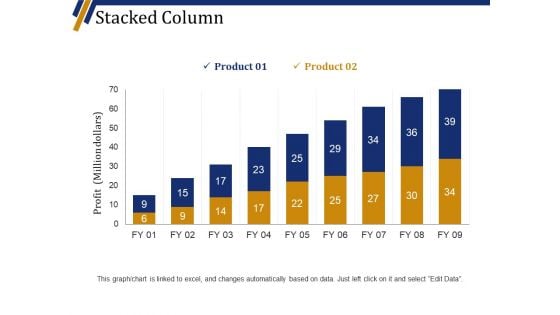
Stacked Column Ppt PowerPoint Presentation Professional Template
This is a stacked column ppt powerpoint presentation professional template. This is a nine stage process. The stages in this process are product, profit million dollars, business, marketing, graph.
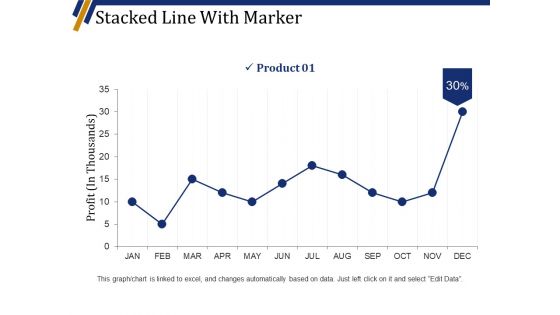
Stacked Line With Marker Ppt PowerPoint Presentation Professional Pictures
This is a stacked line with marker ppt powerpoint presentation professional pictures. This is a twelve stage process. The stages in this process are product, profit in thousands, business, graph, marketing.
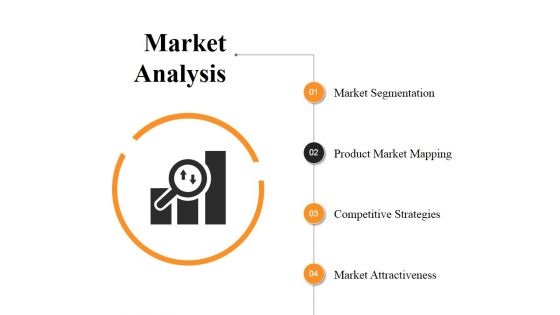
Market Analysis Ppt PowerPoint Presentation Show Design Inspiration
This is a market analysis ppt powerpoint presentation show design inspiration. This is a four stage process. The stages in this process are market segmentation, product market mapping, competitive strategies, market attractiveness.
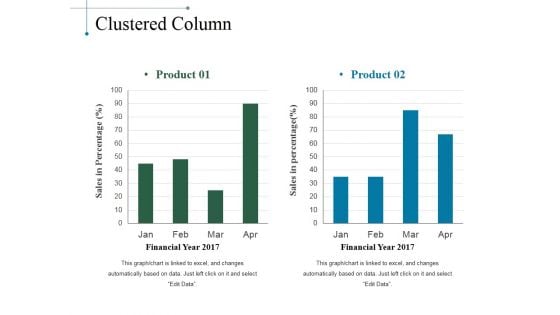
Clustered Column Ppt PowerPoint Presentation Slides Smartart
This is a clustered column ppt powerpoint presentation slides smartart. This is a two stage process. The stages in this process are product, sales in percentage, financial year, bar graph.
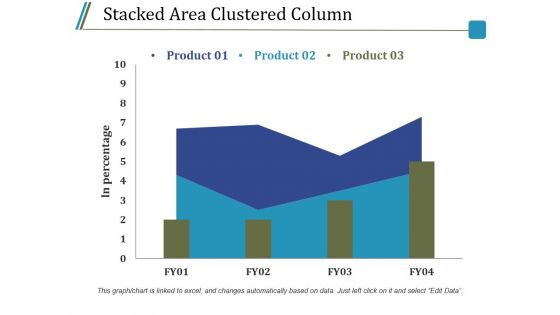
Stacked Area Clustered Column Ppt PowerPoint Presentation Model Guidelines
This is a stacked area clustered column ppt powerpoint presentation model guidelines. This is a three stage process. The stages in this process are product, in percentage, bar graph, growth, success.
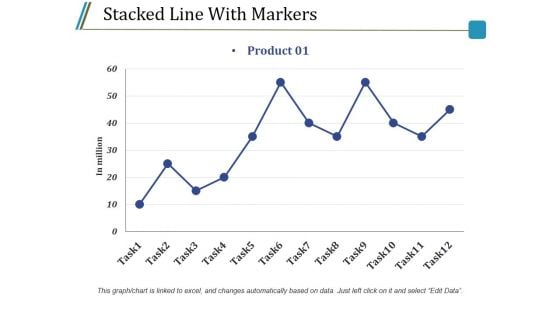
Stacked Line With Markers Ppt PowerPoint Presentation Infographic Template Graphics Example
This is a stacked line with markers ppt powerpoint presentation infographic template graphics example. This is a one stage process. The stages in this process are in million, task, product, finance, line graph.
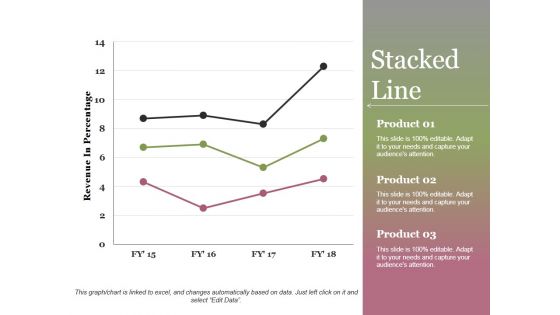
Stacked Line Ppt PowerPoint Presentation Show
This is a stacked line ppt powerpoint presentation show. This is a three stage process. The stages in this process are revenue in percentage, product, stacked line, growth, success.
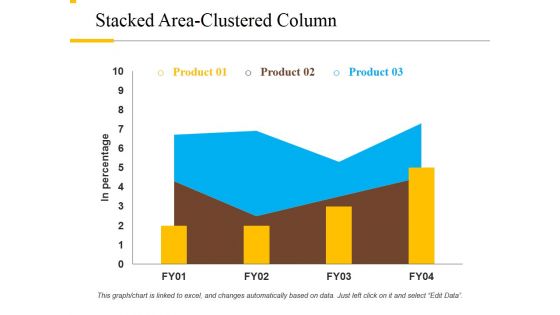
Stacked Area Clustered Column Ppt PowerPoint Presentation File Background Designs
This is a stacked area clustered column ppt powerpoint presentation file background designs. This is a three stage process. The stages in this process are product, in percentage, growth, success, bar graph.
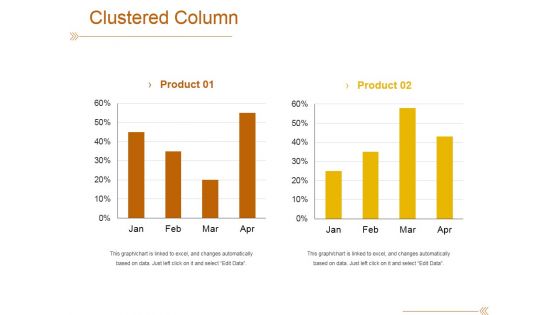
Clustered Column Template 1 Ppt PowerPoint Presentation Outline File Formats
This is a clustered column template 1 ppt powerpoint presentation outline file formats. This is a two stage process. The stages in this process are product, bar graph, success, growth, finance.
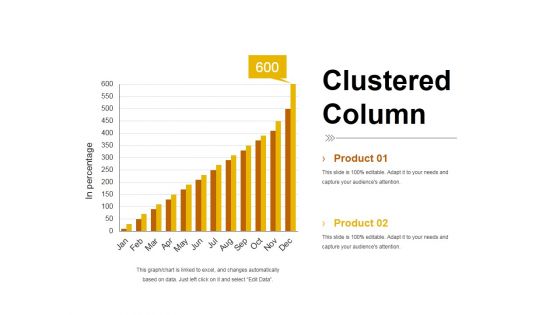
Clustered Column Template 2 Ppt PowerPoint Presentation Summary Smartart
This is a clustered column template 2 ppt powerpoint presentation summary smartart. This is a two stage process. The stages in this process are product, bar graph, in percentage, clustered column, growth.
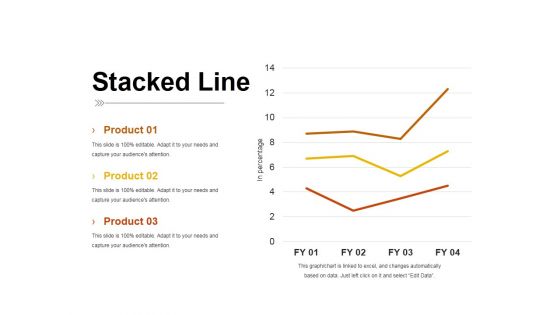
Stacked Line Ppt PowerPoint Presentation Inspiration Pictures
This is a stacked line ppt powerpoint presentation inspiration pictures. This is a three stage process. The stages in this process are product, stacked line, in percentage, business, growth.
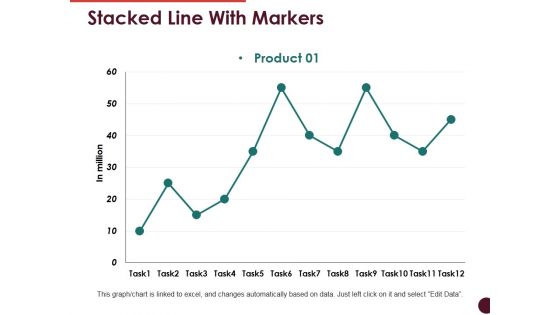
Stacked Line With Markers Ppt PowerPoint Presentation Show Templates
This is a stacked line with markers ppt powerpoint presentation show templates. This is a one stage process. The stages in this process are product, bar graph, growth, success, business.
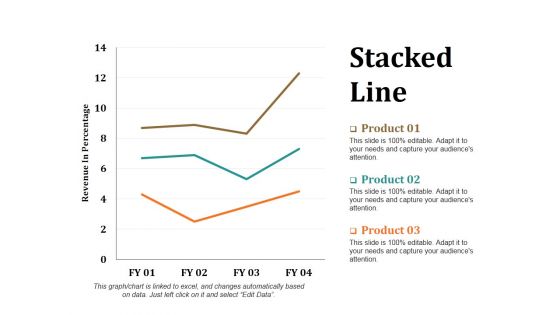
Stacked Line Ppt PowerPoint Presentation Layouts Portrait
This is a stacked line ppt powerpoint presentation layouts portrait. This is a three stage process. The stages in this process are revenue in percentage, stacked line, product, growth, success.
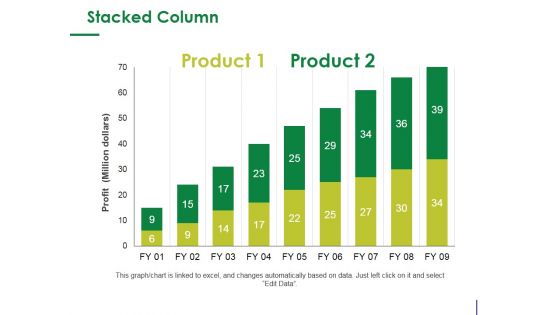
Stacked Column Ppt PowerPoint Presentation Infographic Template Design Ideas
This is a stacked column ppt powerpoint presentation infographic template design ideas. This is a two stage process. The stages in this process are product, profit, bar graph, growth, success.
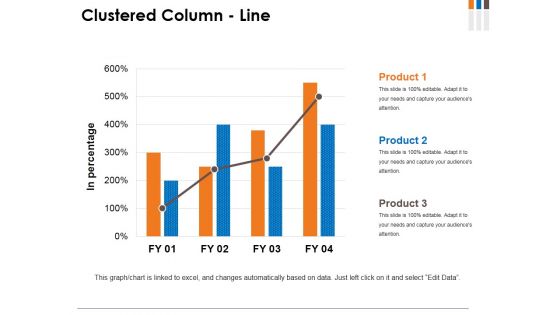
Clustered Column Line Ppt PowerPoint Presentation Summary Background Image
This is a clustered column line ppt powerpoint presentation summary background image. This is a four stage process. The stages in this process are in percentage, product, graph, growth, success.
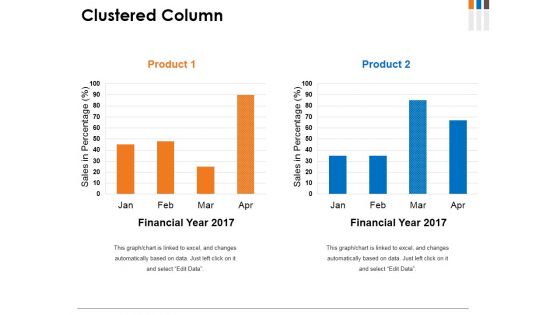
Clustered Column Ppt PowerPoint Presentation File Graphics
This is a clustered column ppt powerpoint presentation file graphics. This is a two stage process. The stages in this process are product, financial year, sales in percentage, graph, growth.

Sales Kpi Performance Summary Ppt PowerPoint Presentation Infographic Template Infographics
This is a sales kpi performance summary ppt powerpoint presentation infographic template infographics. This is a seven stage process. The stages in this process are revenue comparison, quantity comparison, product sales mix, regional sales mix.
Sales Kpi Tracker Ppt PowerPoint Presentation Visual Aids Files
This is a sales kpi tracker ppt powerpoint presentation visual aids files. This is a six stage process. The stages in this process are leads created, sales ratio, opportunities won, top products in revenue, open deals vs last yr.

Sales Kpi Performance Summary Ppt PowerPoint Presentation Ideas Graphics Template
This is a sales kpi performance summary ppt powerpoint presentation ideas graphics template. This is a seven stage process. The stages in this process are revenue comparison, quantity comparison, product sales mix, regional sales mix.
Sales Kpi Tracker Ppt PowerPoint Presentation Pictures Designs
This is a sales kpi tracker ppt powerpoint presentation pictures designs. This is a two stage process. The stages in this process are leads created, sales ratio, opportunities won, top products in revenue, win ratio vs last yr.
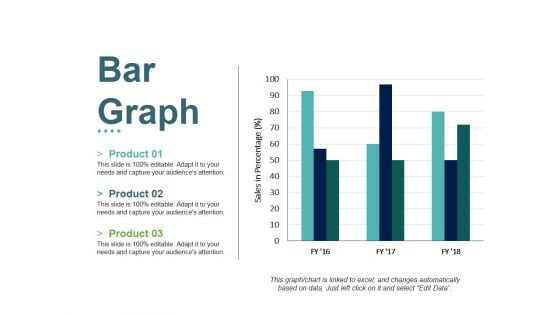
Bar Graph Ppt PowerPoint Presentation File Slides
This is a bar graph ppt powerpoint presentation file slides. This is a three stage process. The stages in this process are product, sales in percentage, bar graph, growth, success.
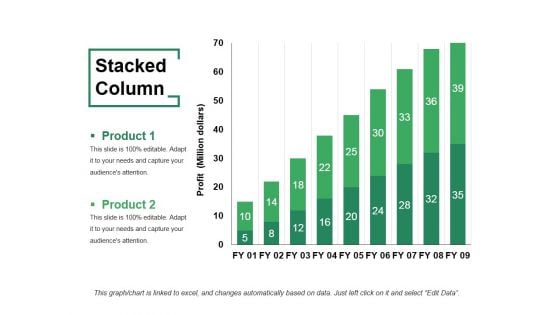
Stacked Column Ppt PowerPoint Presentation Layouts Example
This is a stacked column ppt powerpoint presentation layouts example. This is a two stage process. The stages in this process are product, stacked column, bar graph, growth, success.
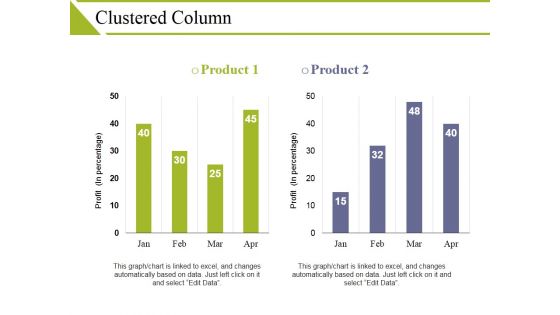
Clustered Column Ppt PowerPoint Presentation Visual Aids Show
This is a clustered column ppt powerpoint presentation visual aids show. This is a two stage process. The stages in this process are product, profit, business, bar graph, finance.
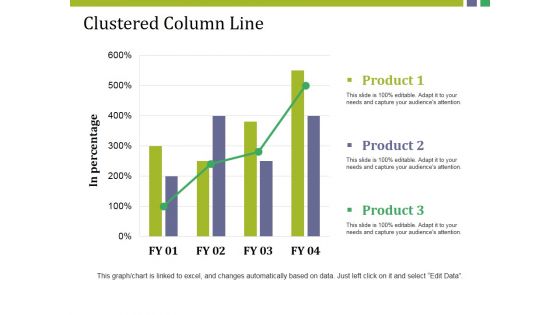
Clustered Column Line Ppt PowerPoint Presentation Pictures Example
This is a clustered column line ppt powerpoint presentation pictures example. This is a three stage process. The stages in this process are product, in percentage, bar graph, growth, success.
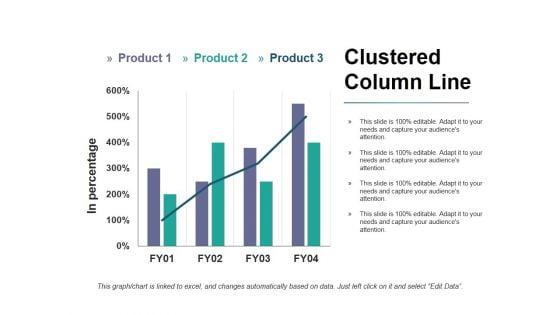
Clustered Column Line Ppt PowerPoint Presentation Infographic Template Pictures
This is a clustered column line ppt powerpoint presentation infographic template pictures. This is a three stage process. The stages in this process are product, in percentage, bar graph, growth, success.
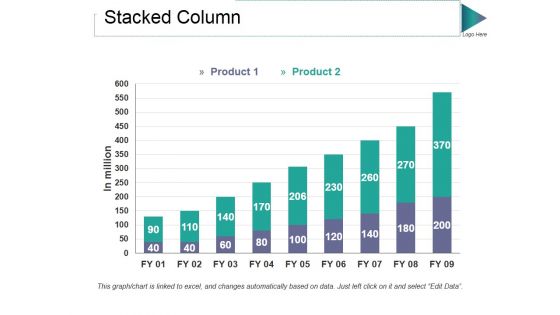
Stacked Column Ppt PowerPoint Presentation Styles Graphic Tips
This is a stacked column ppt powerpoint presentation styles graphic tips. This is a two stage process. The stages in this process are product, in million, bar graph, growth, success.
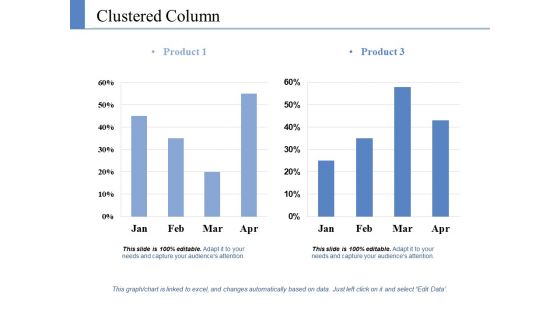
Clustered Column Ppt PowerPoint Presentation Pictures Graphics Template
This is a clustered column ppt powerpoint presentation pictures graphics template. This is a two stage process. The stages in this process are product, growth, success, business, bar graph.
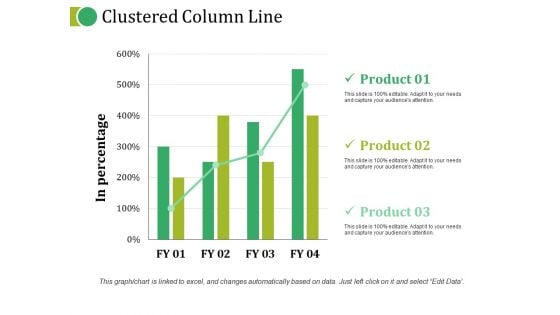
Clustered Column Line Ppt PowerPoint Presentation Topics
This is a clustered column line ppt powerpoint presentation topics. This is a three stage process. The stages in this process are product, in percentage, growth, bar graph, business.
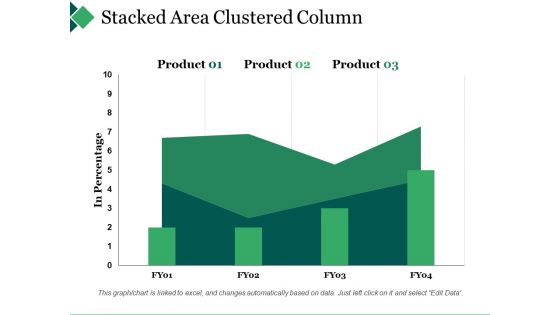
Stacked Area Clustered Column Ppt PowerPoint Presentation Gallery Gridlines
This is a stacked area clustered column ppt powerpoint presentation gallery gridlines. This is a three stage process. The stages in this process are bar graph, product, in percentage.
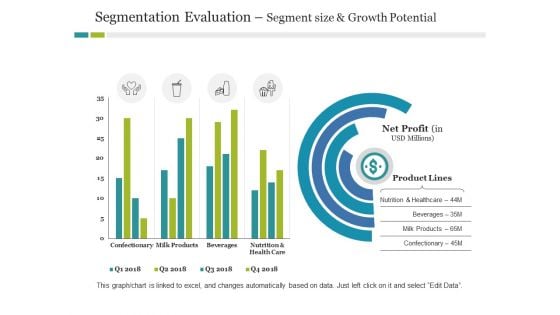
Segmentation Evaluation Segment Size And Growth Potential Ppt PowerPoint Presentation Infographic Template Outline
This is a segmentation evaluation segment size and growth potential ppt powerpoint presentation infographic template outline. This is a two stage process. The stages in this process are business, product lines, finance, marketing, strategy.
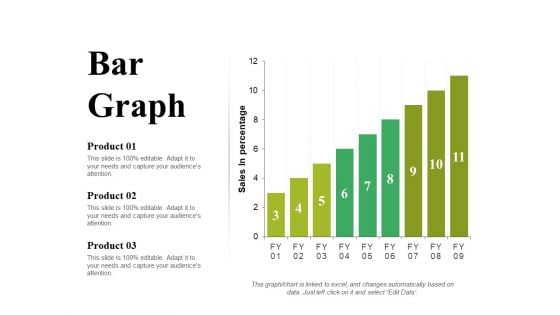
Bar Graph Ppt PowerPoint Presentation Portfolio Slide Portrait
This is a bar graph ppt powerpoint presentation portfolio slide portrait. This is a three stage process. The stages in this process are product, sales in percentage, bar graph, growth, success.
Sales Kpi Tracker Ppt PowerPoint Presentation Pictures Layout Ideas
This is a sales kpi tracker ppt powerpoint presentation pictures layout ideas. This is a four stage process. The stages in this process are opportunities won, top products in revenue, leads created, win ratio vs last yr, open deals vs.
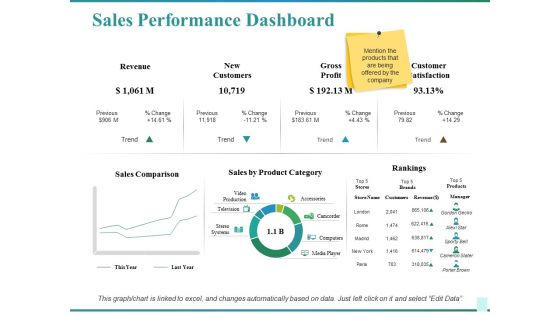
Sales Performance Dashboard Ppt PowerPoint Presentation Show Graphics Design
This is a sales performance dashboard ppt powerpoint presentation show graphics design. This is a two stage process. The stages in this process are sales comparison, sales by product category, rankings, customer satisfaction, revenue.
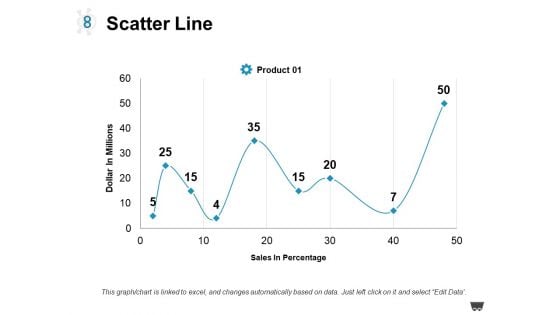
Scatter Line Ppt PowerPoint Presentation Styles Graphics Pictures
This is a scatter line ppt powerpoint presentation styles graphics pictures. This is a one stage process. The stages in this process are product, dollar in millions, sales in percentage.
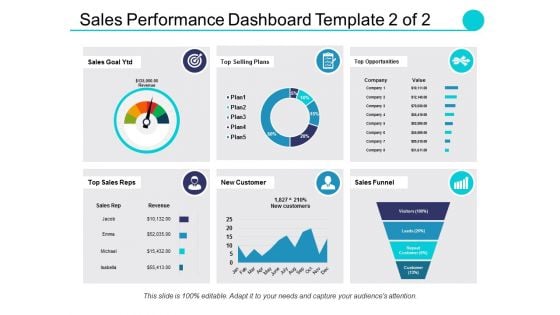
Sales Performance Dashboard Template Ppt PowerPoint Presentation Professional Elements
This is a sales performance dashboard template ppt powerpoint presentation professional elements. This is a eight stage process. The stages in this process are sales comparison, sales by product category, sales by month, brand profitability, revenue.
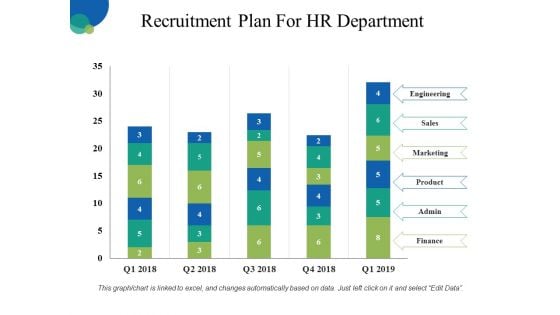
Recruitment Plan For HR Department Ppt PowerPoint Presentation Inspiration Layout Ideas
This is a recruitment plan for hr department ppt powerpoint presentation inspiration layout ideas. This is a five stage process. The stages in this process are engineering, sales, marketing, product, finance.
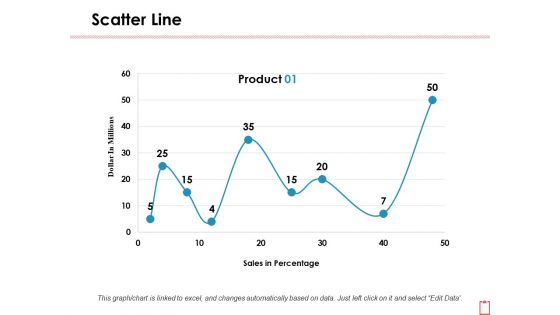
Scatter Line Ppt PowerPoint Presentation Infographics Background Images
This is a scatter line ppt powerpoint presentation infographics background images. This is a one stage process. The stages in this process are dollar in millions, product, sales in percentage.
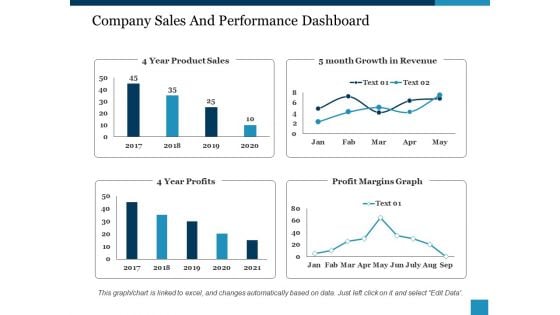
Company Sales And Performance Dashboard Ppt PowerPoint Presentation Show Structure
This is a company sales and performance dashboard ppt powerpoint presentation show structure. This is a four stage process. The stages in this process are year product sales, month growth in revenue, profit margins graph, year profits.

 Home
Home