Deliverables And Outcomes

Get The Knowledge From Books PowerPoint Templates Ppt Backgrounds For Slides 0713
Generate camaradarie with our Get The Knowledge From Books PowerPoint Templates PPT Backgrounds For Slides. Performance evaluation is easier with our Get The Knowledge From Books PowerPoint Templates Ppt Backgrounds For Slides 0713. They help you assess results accurately.
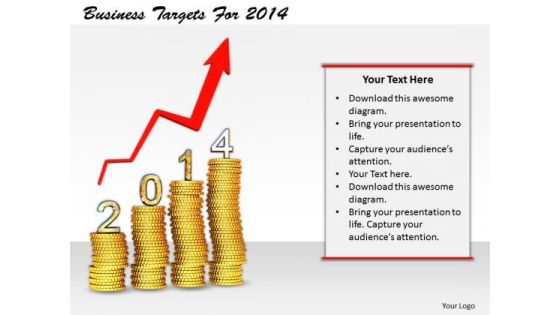
Stock Photo Business Management Strategy Targets For 2014 Image
Anticipate Contingencies With Our stock photo business management strategy targets for 2014 image. Draw Up Foolproof Answers For Any Eventuality. With Our arrows You Will Land On Your Feet. Your Efforts Will Achieve Favorable Results.
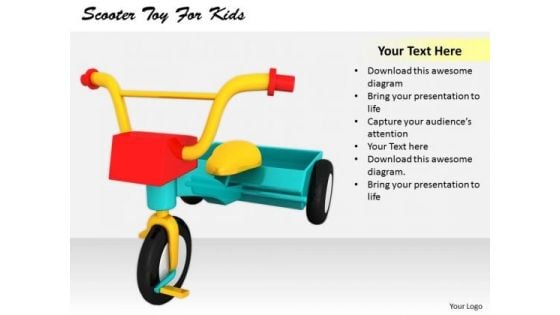
Stock Photo Developing Business Strategy Scooter Toy For Kids Clipart
Anticipate contingencies with our stock photo developing business strategy scooter toy for kids clipart. Draw up foolproof answers for any eventuality. With our transportation you will land on your feet. Your efforts will achieve favourable results.
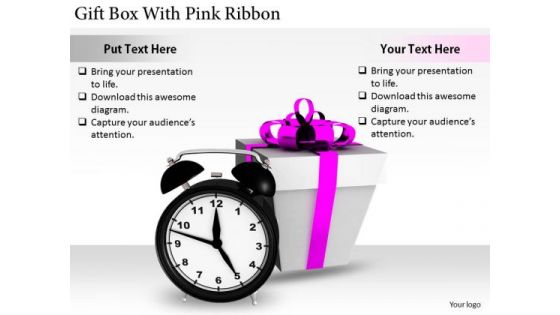
Stock Photo International Marketing Concepts Gift Box With Pink Ribbon Stock Photo Business Photos
Anticipate Contingencies With Our stock photo international marketing concepts gift box with pink ribbon stock photo business photos. Draw Up Foolproof Answers For Any Eventuality. With Our Boxes You Will Land On Your Feet. Your Efforts Will Achieve Favorable Results.

Stock Photo Arrow Try To Jump Over A Wall PowerPoint Slide
This innovative image has design of progressive arrow trying to jump over a wall. Use this image in business presentations to display concepts like success and growth. Highlight the results of you thought process using this image.
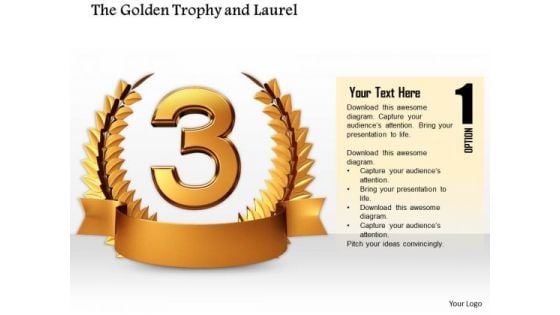
Stock Photo Copper Laurel Trophy For Winner PowerPoint Slide
The above image has been designed with laurel trophy for winner. This professional image of laurel trophy is well designed to display concept of win, success and victory. Highlight the results of you thought process using this image.

Stock Photo Blue Arrow Breaking Wall Leadership PowerPoint Slide
This innovative image has design of progressive arrow crossing the wall and leading other arrows. Use this image in business presentations to display concepts like leadership, success etc. Highlight the results of you thought process using this image.
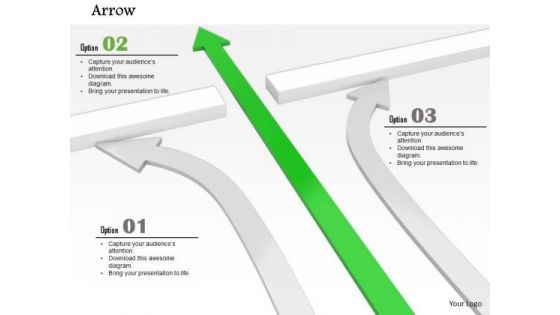
Stock Photo Green Arrow Leading And Breaking Wall Leadership Concept PowerPoint Slide
This innovative image has design of progressive arrow crossing the wall and leading other arrows. Use this image in business presentations to display concepts like leadership, success etc. Highlight the results of you thought process using this image.

Stock Photo Red And White Arrows With Leadership PowerPoint Slide
This innovative image has design of progressive arrow crossing the wall and leading other arrows. Use this image in business presentations to display concepts like leadership, success etc. Highlight the results of you thought process using this image.
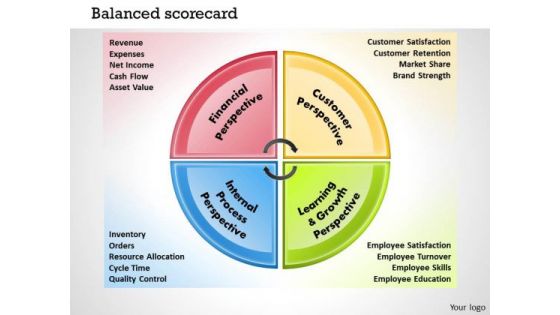
Business Framework Balanced Scorecard PowerPoint Presentation
This power point diagram slide has been crafted with graphic of four staged balance card. This diagram is professionally designed for explaining various scores for business results. Use this diagram slide for business and marketing presentations.
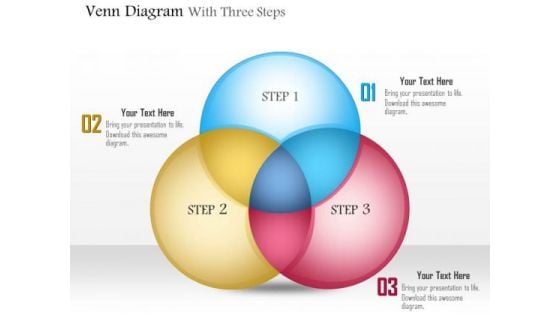
Business Diagram Venn Diagram With Three Steps Presentation Template
This slide displays Venn diagram with three steps presentation template. This power point template has been designed with graphic of Venn diagram. Use this Venn diagram for business result analysis. Build business presentations with analysis practices with this Venn diagram.
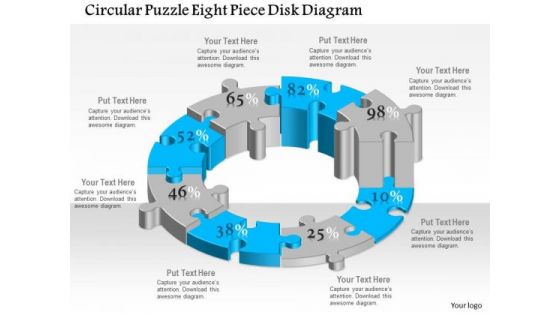
Business Diagram Circular Puzzle Eight Piece Disk Diagram Presentation Template
This business plan power point template has been designed with six staged circular puzzle diagram. This diagram template contains the concept of business process flow and result analysis representation. Use this diagram in your presentation and show these concepts.
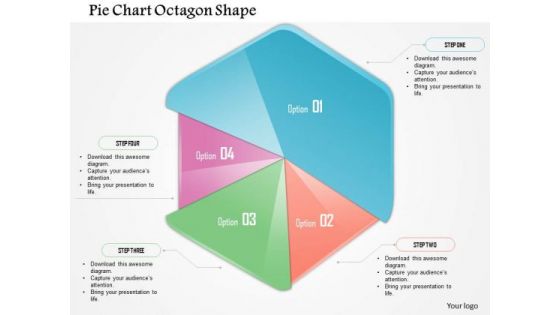
Business Diagram Pie Chart Octagon Shape Presentation Template
This business plan power point template has been designed with pie chart in octagon shape. This PPT contains the concept of result analysis for any business process. Use this PPT for business and sales related presentations.

Business Framework Business Brand Anchor PowerPoint Presentation
Explain the concept of new idea generation with this exclusive PPT slide. This PPT contain the graphic of two bulbs making a Venn diagram. This PPT can be used for any business presentation to representation result analysis.
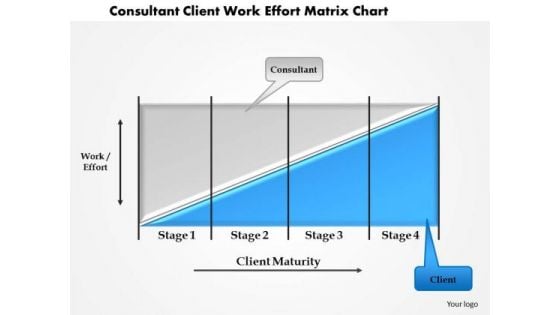
Business Framework Consultant Client Work Effort Matrix Chart PowerPoint Presentation
This business power point template slide has been crafted with graphic of bar graph. This bar graph is called as coase theorem. Use this professional diagram for your result analysis related presentation.
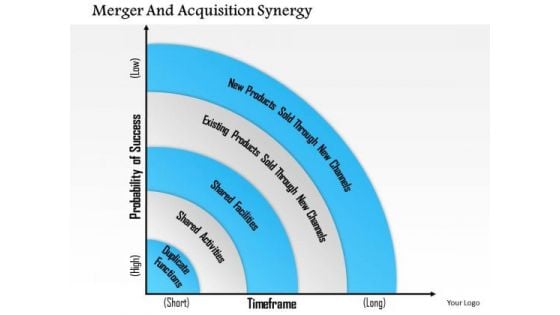
Business Framework Merger And Acquisition Synergy PowerPoint Presentation
This Power Point template slide has been designed with graphic of semicircular design for result display on graph. This design can be used for merger and acquisition for synergy. Use this PPT slide for your business presentation.
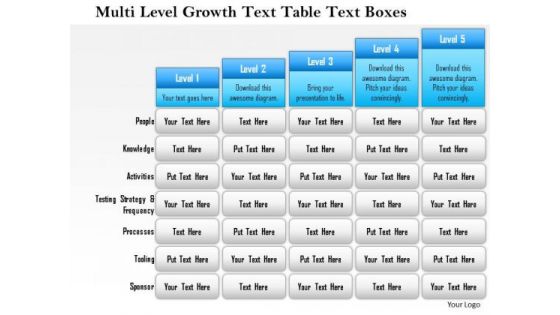
Business Framework Multi Level Growth Text Table Text Boxes 2 PowerPoint Presentation
Five staged text box style chart in bar graph design has been used to decorate this power point template slide. This diagram slide contains the multilevel growth concept. Use this PPT slide for financial growth and result analysis related topics.
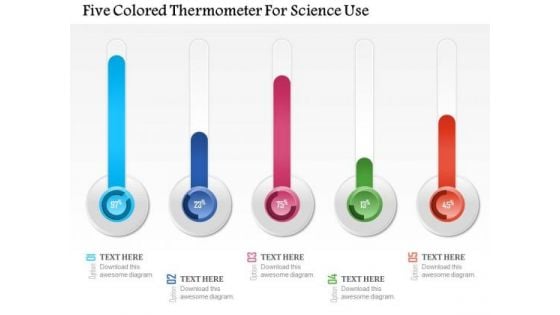
Business Diagram Five Colored Thermometer For Science Use Presentation Template
This PPT slide is dedicated for science related presentations. This PPT slide has been crafted with graphic of five colored thermometer. Explain any temperature related ratings and results in your presentation by using this PPT slide.
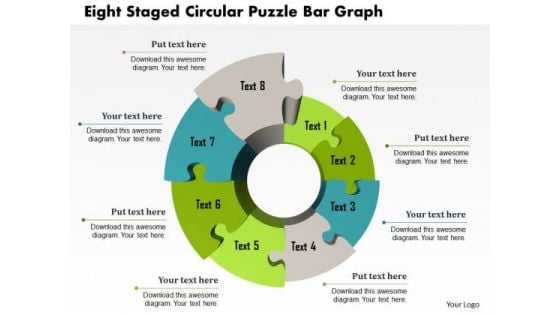
Business Diagram Eight Staged Circular Puzzle Bar Graph Presentation Template
This Power Point template has been crafted with graphic of eight staged circular puzzle and bar graph. This PPT contains the financial result analysis related concept. Use this PPT for your business and success related presentations.
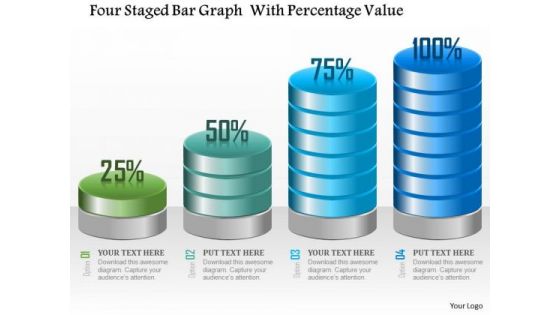
Business Diagram Four Staged Bar Graph With Percentage Value Presentation Template
Four staged bar graph with percentage value has been used to craft this power point template. This PPT contains the concept of making financial timeline and result analysis. This PPT can be used for business and finance related presentations.
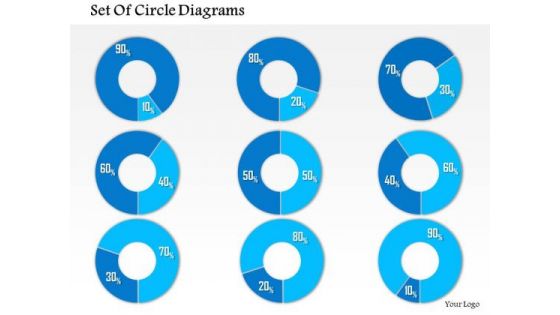
Business Framework 10 Percent To 90 Percent PowerPoint Presentation
This business diagram has been designed with graphic of multiple pie graphs. This diagram slide contains the concept of result analysis with percentage values. Use this diagram to present and compare data in an impressive manner
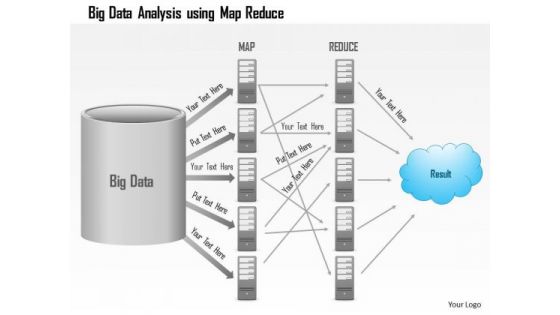
Business Diagram Big Data Analysis Using Map Reduce Batch Processing Ppt Slide
This PowerPoint template has been designed with graphic of server and data transfer network. This slide contains the steps of big data, map, reduce and result. Use this editable diagram for data technology related presentations.
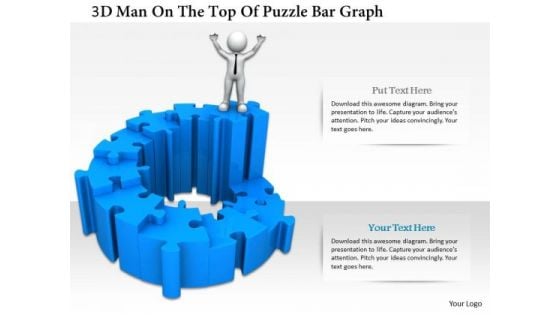
3d Man On The Top Of Puzzle Bar Graph
This PPT has been designed with graphic of 3d man and puzzle are graph. This PPT displays the concept of result analysis and financial growth. Use this PPT for your business and finance related presentations.
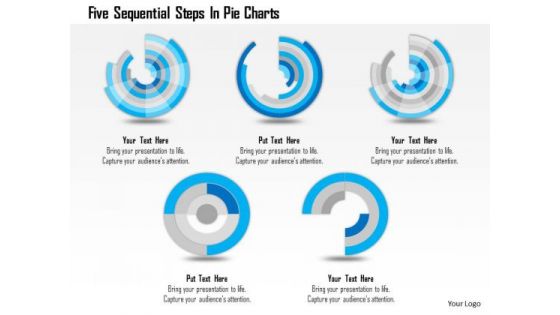
Business Diagram Five Sequential Steps In Pie Charts Presentation Template
Five sequential pie charts are used to craft this power point template. This PPT contains the concept of process flow and result analysis. Use this PPT for your business and sales related presentations and build quality presentation for your viewers.
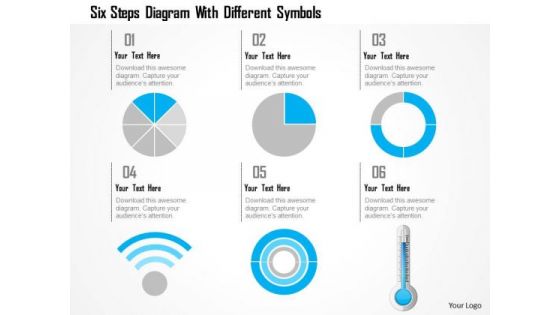
Business Diagram Six Steps Diagram With Different Symbols Presentation Template
This power point template has been crafted with graphic of 3d pie charts with Wi-Fi symbol and thermometer. This PPT contains the concept of calculation and result analysis. Use this PPT for your business and science related presentations.
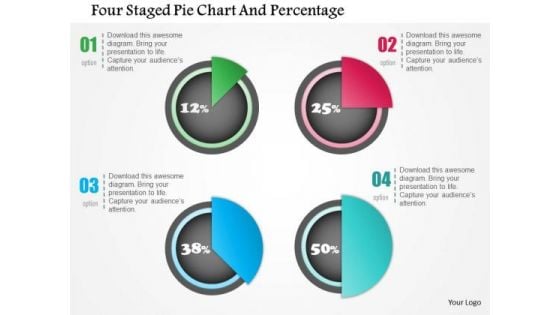
Business Diagram Four Staged Pie Chart And Percentage Presentation Template
Four staged pie chart and percentage values has been used to design this power point template. This PPT contains the concept of financial result analysis. Use this PPT for business and marketing related presentations.
Business Diagram Human Icon Bar Graph For Business Presentation Template
Graphic of human icons and bar graph has been used to decorate this power point template. This PPT contains the concept of business communication and result analysis. Use this PPT for business and marketing related presentations.
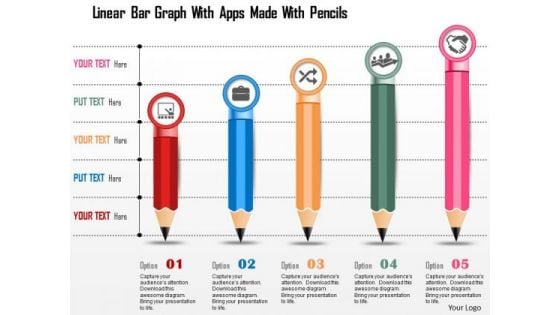
Business Diagram Linear Bar Graph With Apps Made With Pencils Presentation Template
This power point template has been crafted with graphic of linear bar graph and apps made with pencils. This PPT diagram can be used for business growth analysis and result analysis. Use this PPT for business and marketing related presentations.
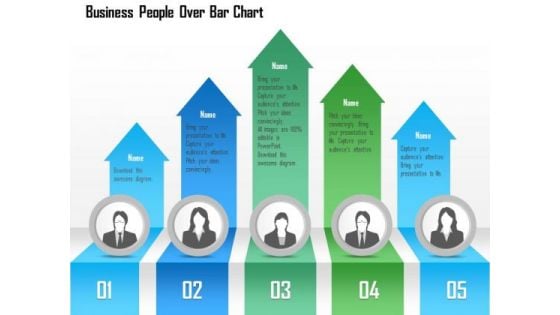
Business Diagram Business People Over Bar Chart PowerPoint Template
This Power Point template has been designed with graphic of business people and bar chart. This PPT contains the concept of result analysis and business data display. Use this PPT slide for your business and marketing related presentations.
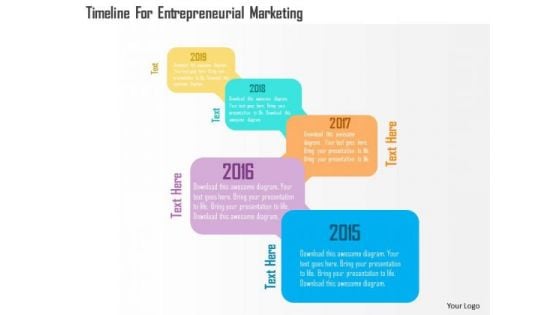
Timeline For Entrepreneurial Marketing Presentation Template
This PowerPoint template has been designed with text boxes and timeline graphics. Use this image in business presentations to display planning and timeline. Highlight the results of you thought process using this template.
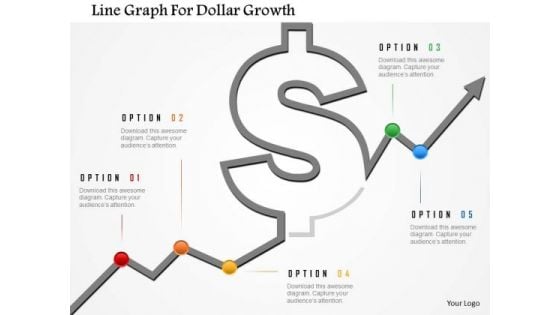
Business Diagram Line Graph For Dollar Growth Presentation Template
Graphic of dollar symbol and growth arrow has been used to design this power point template. This diagram contains the concept of financial result analysis. Use this business diagram for finance related presentations
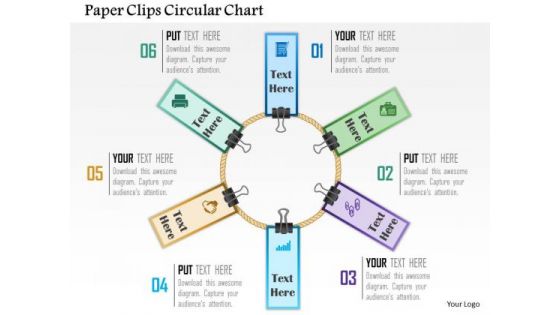
Business Diagram Paper Clips Circular Chart Presentation Template
This power point template has been designed with graphic of circular chart made with paper clips. These business icons are used to display the concept of business result analysis and meeting. Use this diagram for business and marketing presentations.
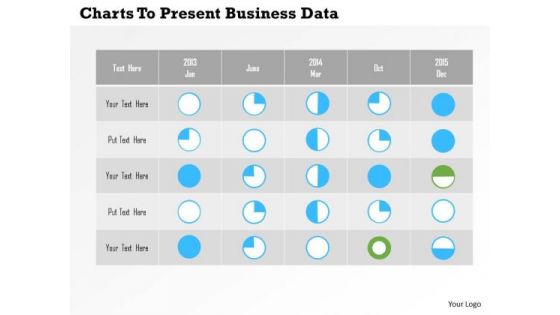
Business Diagram Charts To Present Business Data PowerPoint Templates
Table of pie graphs has been used in this power point diagram. This business diagram contains the concept of result analysis. The template offers an excellent background to build up the various stages of your business process.
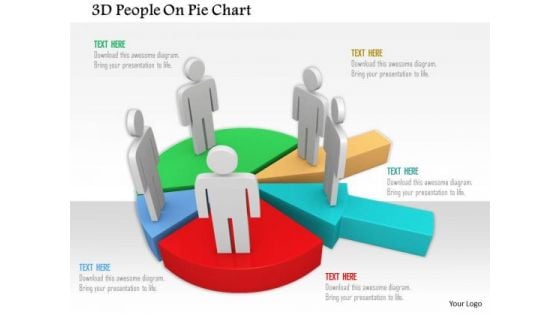
3d People On Pie Chart PowerPoint Templates
This power point diagram has been crafted with graphic of 3d team members on pie chart. This 3d diagram contains the concept of team management and result analysis. Use this diagram to create an impact on your viewers.
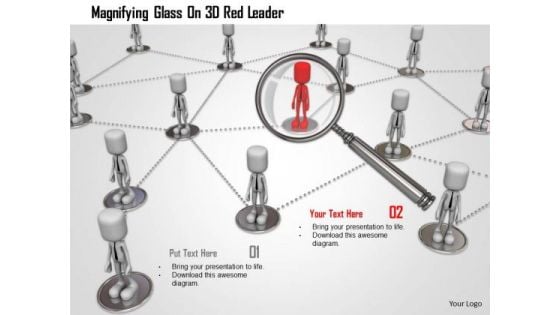
Magnifying Glass On 3d Red Leader PowerPoint Templates
Graphic of persons with magnifier has been used to design this power point template. This 3d diagram contains the concept of right people selection. You have identified the key result areas. Focus on each through this slide.

Magnifying Glass On Blue Person PowerPoint Templates
Graphic of persons with magnifier has been used to design this power point template. This 3d diagram contains the concept of right people selection. You have identified the key result areas. Focus on each through this slide.
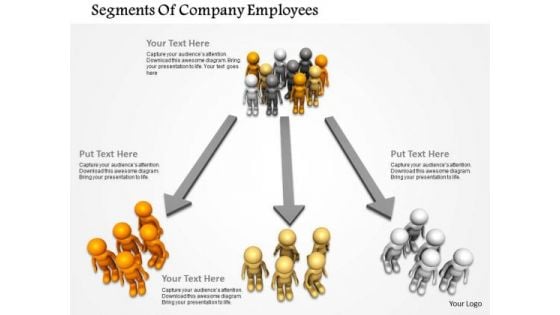
Segments Of Company Employees PowerPoint Templates
Concept of three way customer segmentation has been defined in this power point template. This 3d diagram contains the graphic of customers group and way. You have identified the key result areas. Focus on each through this slide.
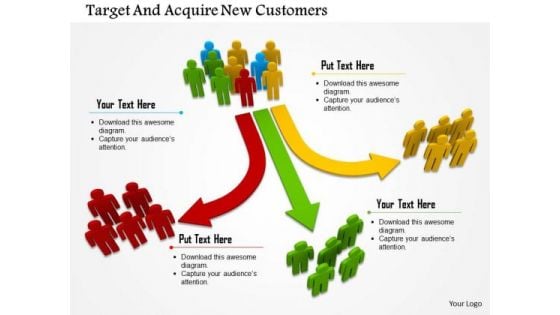
Target And Acquire New Customers PowerPoint Templates
Concept of three way customer segmentation has been defined in this power point template. This 3d diagram contains the graphic of customers group and way. You have identified the key result areas. Focus on each through this slide.
Three Steps Venn Diagram With Icons Powerpoint Slides
This power point template has been designed with graphic of Venn diagram. Use this Venn diagram for business result analysis. Illustrate your ideas and imprint them in the minds of your team with this template.
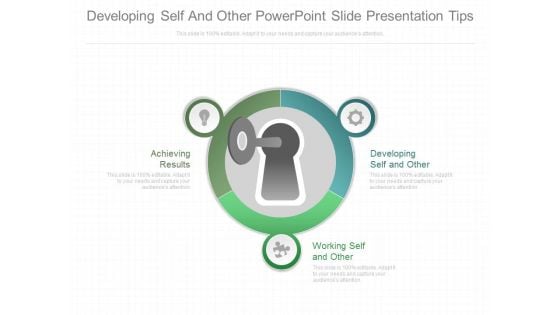
Developing Self And Other Powerpoint Slide Presentation Tips
This is a developing self and other powerpoint slide presentation tips. This is a one stage process. The stages in this process are achieving results, developing self and other, working self and other.
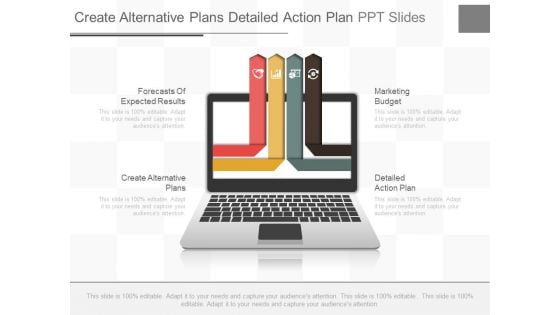
Create Alternative Plans Detailed Action Plan Ppt Slides
This is a create alternative plans detailed action plan ppt slides. This is a four stage process. The stages in this process are forecasts of expected results, marketing budget, create alternative plans, detailed action plan.
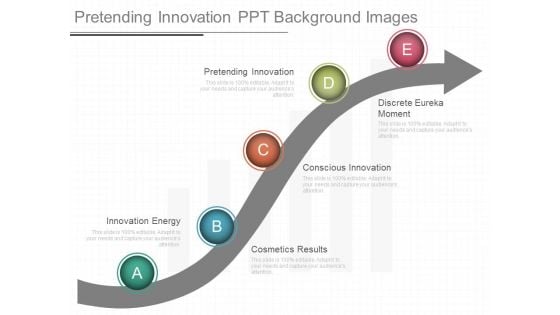
Pretending Innovation Ppt Background Images
This is a pretending innovation ppt background images. This is a five stage process. The stages in this process are innovation energy, pretending innovation, cosmetics results, conscious innovation, discrete eureka moment.

Statistical Analysis Presentation Powerpoint Example
This is a statistical analysis presentation powerpoint example. This is a seven stage process. The stages in this process are map results, external agents, statistical analysis, clean data, system boundary, analyze data, major function.
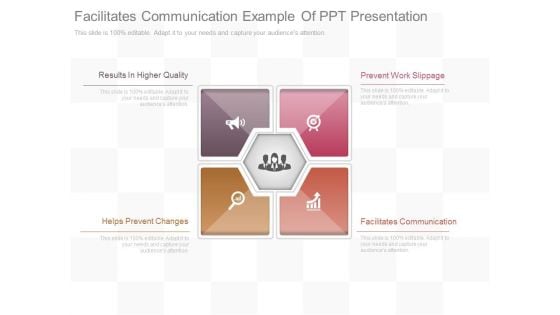
Facilitates Communication Example Of Ppt Presentation
This is a facilitates communication example of ppt presentation. This is a four stage process. The stages in this process are results in higher quality, prevent work slippage, helps prevent changes, facilitates communication.
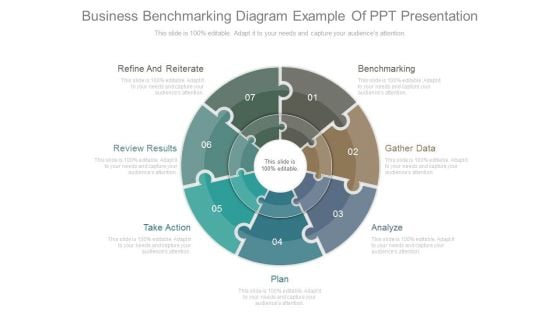
Business Benchmarking Diagram Example Of Ppt Presentation
This is a business benchmarking diagram example of ppt presentation. This is a seven stage process. The stages in this process are refine and reiterate, review results, take action, plan, analyze, gather data, benchmarking.
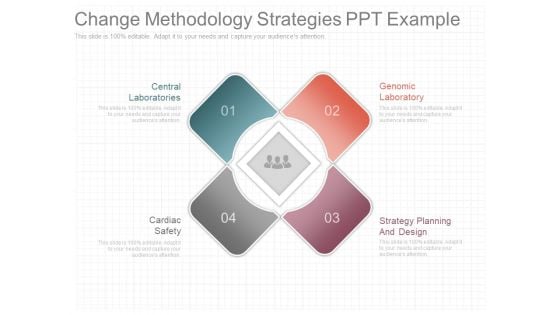
Change Methodology Strategies Ppt Example
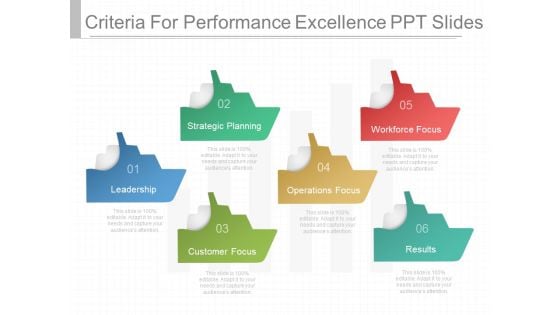
Criteria For Performance Excellence Ppt Slides
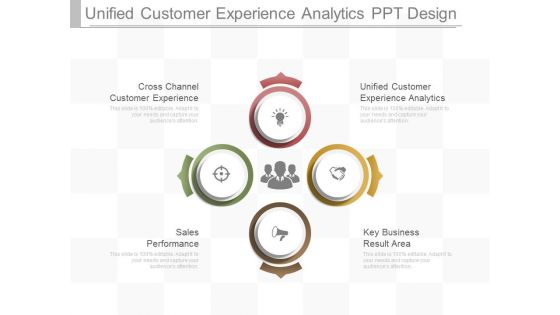
Unified Customer Experience Analytics Ppt Design
This is a unified customer experience analytics ppt design. This is a four stage process. The stages in this process are cross channel customer experience, unified customer experience analytics, sales, performance, key business result area.
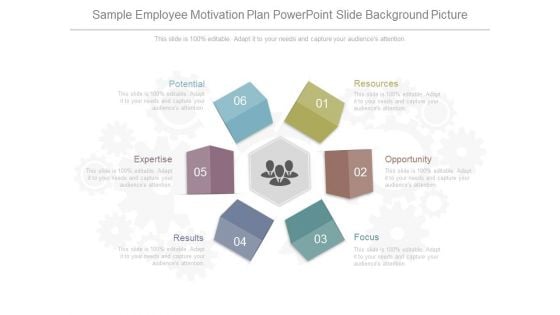
Sample Employee Motivation Plan Powerpoint Slide Background Picture
This is a sample employee motivation plan powerpoint slide background picture. This is a six stage process. The stages in this process are potential, expertise, results, resources, opportunity, focus.
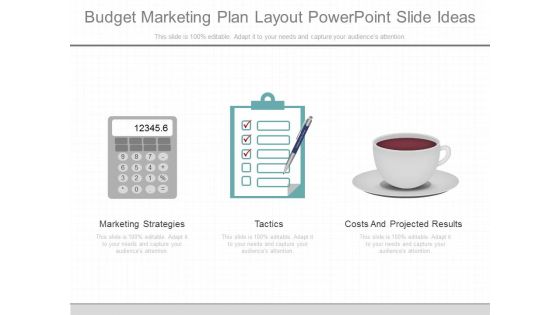
Budget Marketing Plan Layout Powerpoint Slide Ideas
This is a budget marketing plan layout powerpoint slide ideas. This is a three stage process. The stages in this process are marketing strategies, tactics, costs and projected results.
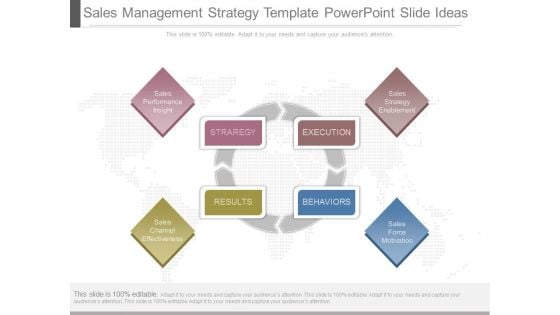
Sales Management Strategy Template Powerpoint Slide Ideas
This is a sales management strategy template powerpoint slide ideas. This is a four stage process. The stages in this process are sales performance insight, sales channel effectiveness, strategy, results, execution, behaviors, sales strategy enablement, sales force motivation.
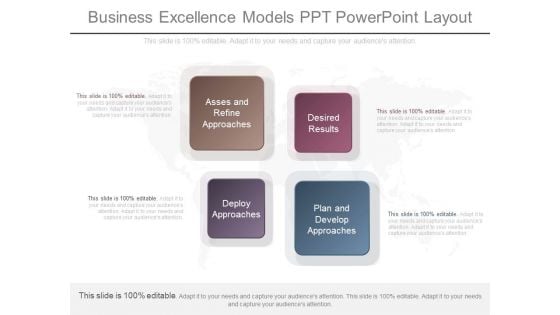
Business Excellence Models Ppt Powerpoint Layout
This is a business excellence models ppt powerpoint layout. This is a four stage process. The stages in this process are assess and refine approaches, desired results, deploy approaches, plan and develop approaches.
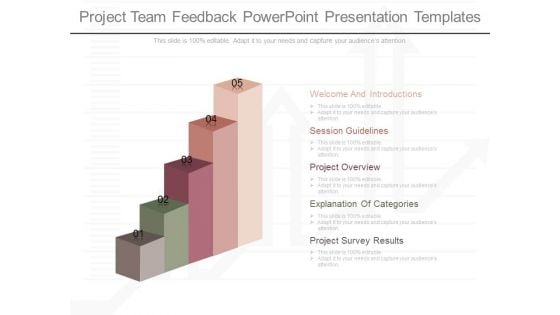
Project Team Feedback Powerpoint Presentation Templates
This is a project team feedback powerpoint presentation templates. This is a five stage process. The stages in this process are welcome and introductions, session guidelines, project overview, explanation of categories, project survey results.
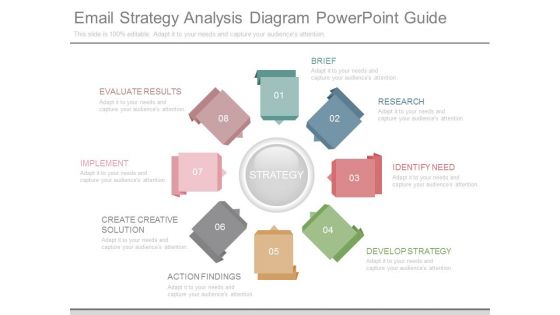
Email Strategy Analysis Diagram Powerpoint Guide
This is a email strategy analysis diagram powerpoint guide. This is a eight stage process. The stages in this process are evaluate results, implement, create creative solution, action findings, strategy, brief, research, identify need, develop strategy.
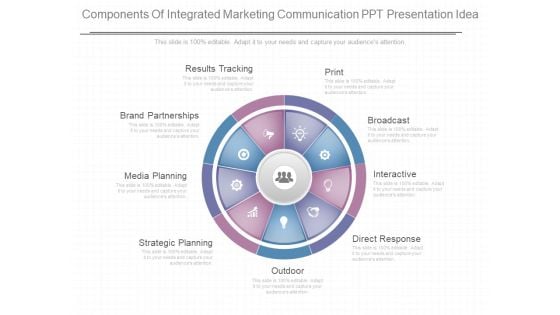
Components Of Integrated Marketing Communication Ppt Presentation Idea
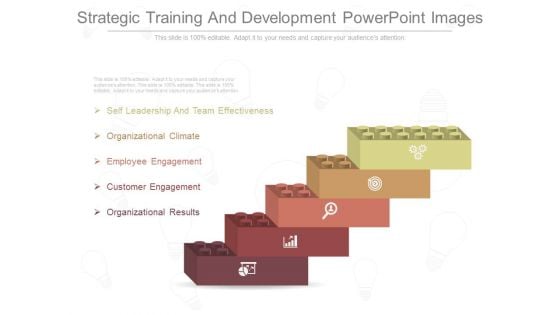
Strategic Training And Development Powerpoint Images
This is a strategic training and development powerpoint images. This is a five stage process. The stages in this process are self leadership and team effectiveness, organizational climate, employee engagement, customer engagement, organizational results.
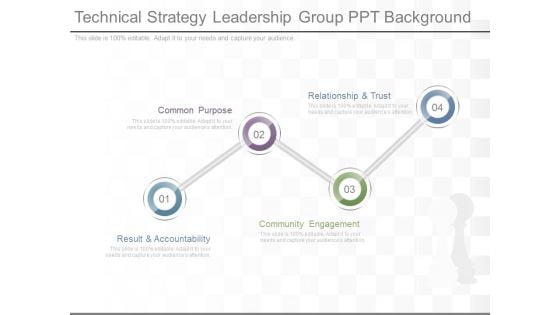
Technical Strategy Leadership Group Ppt Background
This is a technical strategy leadership group ppt background. This is a four stage process. The stages in this process are result and accountability, common purpose, community engagement, relationship and trust.
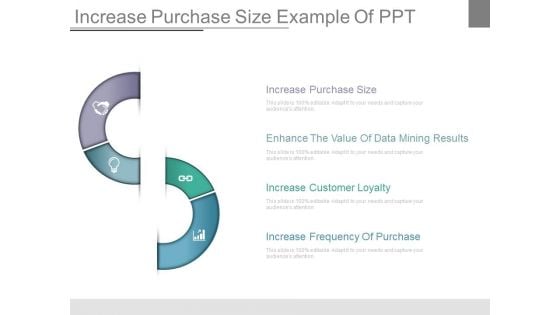
Increase Purchase Size Example Of Ppt
This is a increase purchase size example of ppt. This is a four stage process. The stages in this process are increase purchase size, enhance the value of data mining results, increase customer loyalty, increase frequency of purchase.
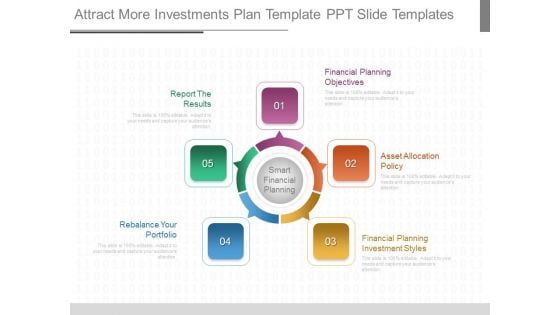
Attract More Investments Plan Template Ppt Slide Templates
This is a attract more investments plan template ppt slide templates. This is a five stage process. The stages in this process are financial planning objectives, asset allocation policy, financial planning investment styles, rebalance your portfolio, report the results.
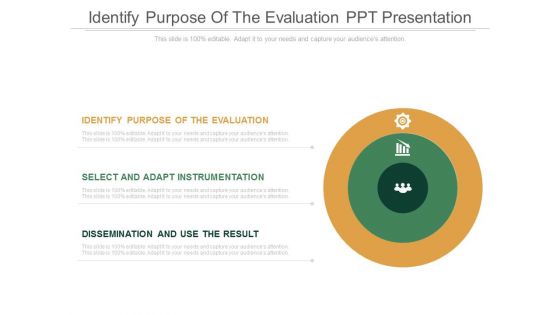
Identify Purpose Of The Evaluation Ppt Presentation
This is a identify purpose of the evaluation ppt presentation. This is a three stage process. The stages in this process are identify purpose of the evaluation, select and adapt instrumentation, dissemination and use the result.


 Continue with Email

 Home
Home


