Devops Metrics
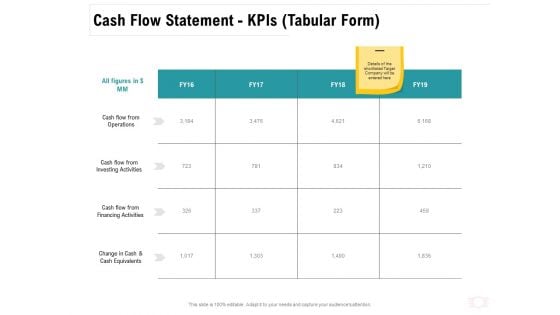
Company Amalgamation Cash Flow Statement Kpis Target Ppt Infographic Template Background Designs PDF
Presenting this set of slides with name company amalgamation cash flow statement kpis target ppt infographic template background designs pdf. The topics discussed in these slides are cash flow, investing activities, financing activities, cash equivalents. This is a completely editable PowerPoint presentation and is available for immediate download. Download now and impress your audience.
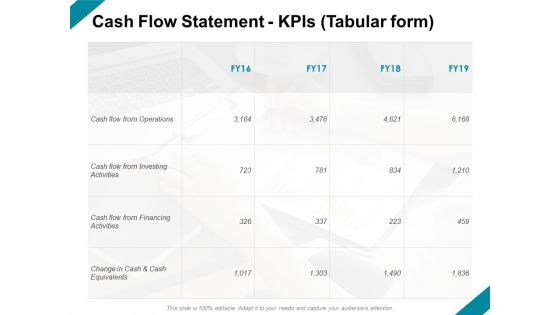
Cash Flow Statement Kpis Tabular Form Ppt PowerPoint Presentation Infographics Designs Download
Presenting this set of slides with name cash flow statement kpis tabular form ppt powerpoint presentation infographics designs download. The topics discussed in these slides are financial, marketing, management, investment, analysis. This is a completely editable PowerPoint presentation and is available for immediate download. Download now and impress your audience.
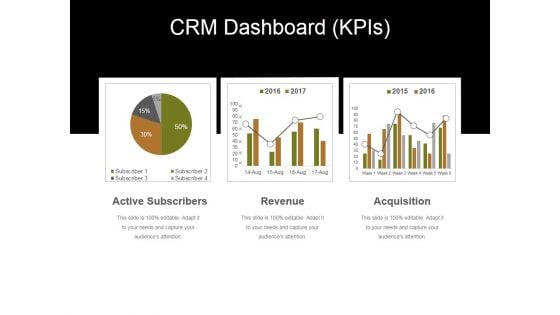
Crm Dashboard Kpis Ppt PowerPoint Presentation Infographic Template Designs
This is a crm dashboard kpis ppt powerpoint presentation infographic template designs. This is a three stage process. The stages in this process are active subscribers, acquisition, revenue.
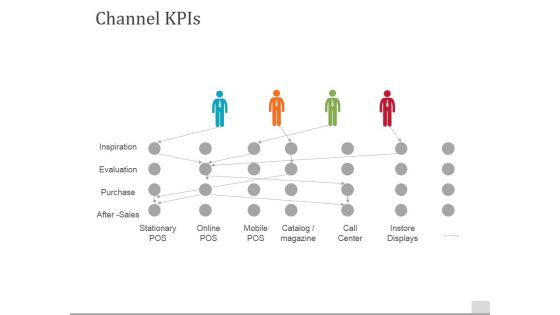
Channel Kpis Template 2 Ppt PowerPoint Presentation Show Designs
This is a channel kpis template 2 ppt powerpoint presentation show designs. This is a four stage process. The stages in this process are channel kpis, inspiration, evaluation, purchase, stationary pos.
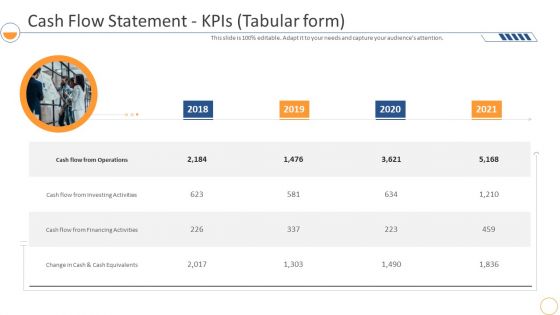
Monthly Company Performance Analysiscash Flow Statement Kpis Tabular Form Designs PDF
This is a monthly company performance analysiscash flow statement kpis tabular form designs pdf template with various stages. Focus and dispense information on one stages using this creative set, that comes with editable features. It contains large content boxes to add your information on topics like financing, equivalents, investing. You can also showcase facts, figures, and other relevant content using this PPT layout. Grab it now.
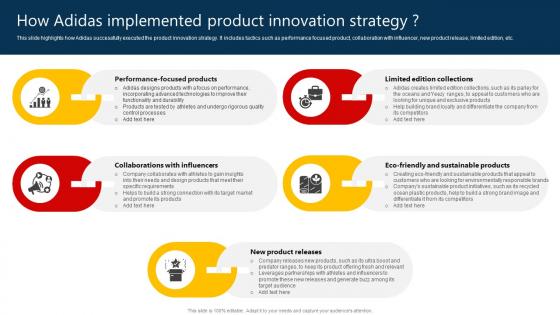
How Adidas Implemented Product Innovation Strategy SS V
This slide highlights how Adidas successfully executed the product innovation strategy. It includes tactics such as performance focused product, collaboration with influencer, new product release, limited edition, etc. If you are looking for a format to display your unique thoughts, then the professionally designed How Adidas Implemented Product Innovation Strategy SS V is the one for you. You can use it as a Google Slides template or a PowerPoint template. Incorporate impressive visuals, symbols, images, and other charts. Modify or reorganize the text boxes as you desire. Experiment with shade schemes and font pairings. Alter, share or cooperate with other people on your work. Download How Adidas Implemented Product Innovation Strategy SS V and find out how to give a successful presentation. Present a perfect display to your team and make your presentation unforgettable. This slide highlights how Adidas successfully executed the product innovation strategy. It includes tactics such as performance focused product, collaboration with influencer, new product release, limited edition, etc.
Tracking The Actual Sales Developing Extensive Sales And Operations Strategy Designs Pdf
This slide provides glimpse about dashboard analysis that can help the business to track the performance of the sales team. It includes kpis such as revenues, profit, orders placed, conversion placed, conversion rate, customers, etc. There are so many reasons you need a Tracking The Actual Sales Developing Extensive Sales And Operations Strategy Designs Pdf. The first reason is you can not spend time making everything from scratch, Thus, Slidegeeks has made presentation templates for you too. You can easily download these templates from our website easily. This slide provides glimpse about dashboard analysis that can help the business to track the performance of the sales team. It includes kpis such as revenues, profit, orders placed, conversion placed, conversion rate, customers, etc.
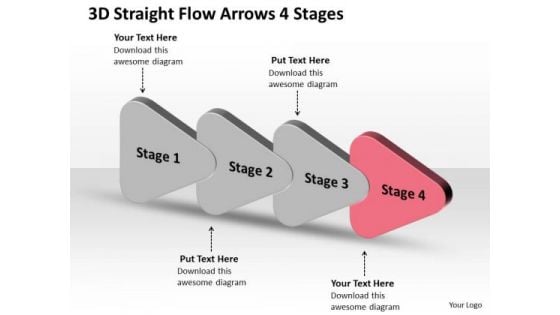
3d Straight Flow Arrows 4 Stages Make Chart PowerPoint Templates
We present our 3d straight flow arrows 4 stages make chart PowerPoint templates. Use our Business PowerPoint Templates because, Marketing Strategy Business Template: - Maximizing sales of your product is the intended destination. Use our Design PowerPoint Templates because, you know the path so show the way. Use our Signs PowerPoint Templates because, Different people with differing ideas and priorities perform together to score. Use our Shapes PowerPoint Templates because, There are different paths to gain the necessary knowledge to achieve it. Use our Process and Flows PowerPoint Templates because, are the Tools of the Trade. Use these PowerPoint slides for presentations relating to abstract, arrow, arrows, business, chart, design, development, diagram, direction, element, flow, flowchart, graph, linear, management, model, motion, organization, plan, process, program, section, segment, set, sign, solution, strategy, symbol, technology. The prominent colors used in the PowerPoint template are Red, Gray, and Black Make your brainstorming effective with our 3d Straight Flow Arrows 4 Stages Make Chart PowerPoint Templates. Churn out ideas to act upon.

Product Performance Testing And Analysis Ppt Design
This is a product performance testing and analysis ppt design. This is a eight stage process. The stages in this process are analysis of results, stakeholder management, stress testing, volume testing, results management summary, define and evidence requirements, spike testing, load testing.
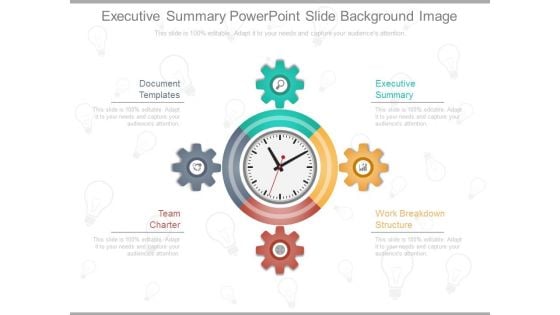
Executive Summary Powerpoint Slide Background Image
This is an executive summary powerpoint slide background image. This is a four stage process. The stages in this process are document templates, executive summary, team charter, work breakdown structure.
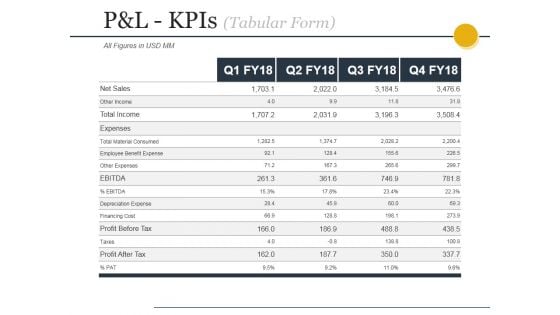
Pandl Kpis Tabular Form Ppt PowerPoint Presentation File Design Templates
This is a pandl kpis tabular form ppt powerpoint presentation file design templates. This is a four stage process. The stages in this process are revenue, cogs, operating profit, net profit.
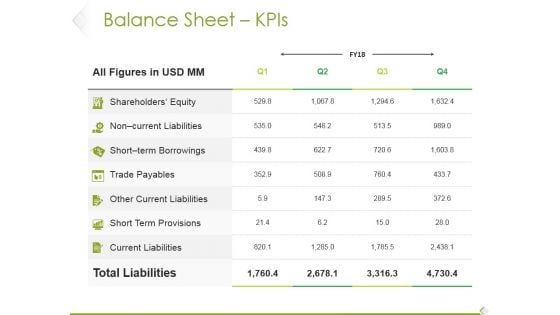
Balance Sheet Kpis Ppt PowerPoint Presentation Show Designs
This is a balance sheet kpis ppt powerpoint presentation show designs. This is a four stage process. The stages in this process are shareholders equity, non current liabilities, trade payables, total liabilities.
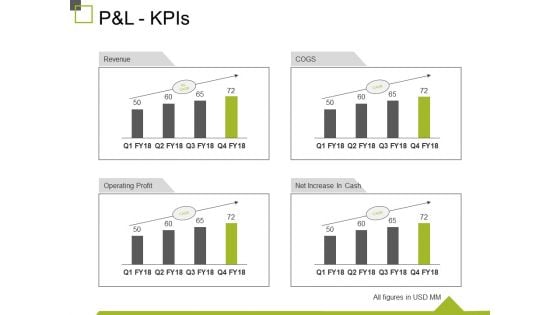
P And L Kpis Ppt PowerPoint Presentation Show Design Inspiration
This is a p and l kpis ppt powerpoint presentation show design inspiration. This is a four stage process. The stages in this process are revenue, operating profit, cogs, net increase in cash, business.
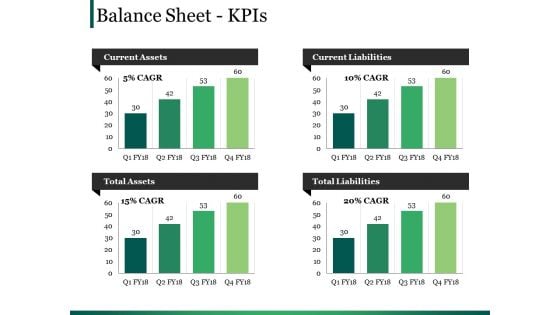
Balance Sheet Kpis Ppt PowerPoint Presentation Layouts Design Ideas
This is a balance sheet kpis ppt powerpoint presentation layouts design ideas. This is a four stage process. The stages in this process are current assets, current liabilities, total assets, total liabilities.
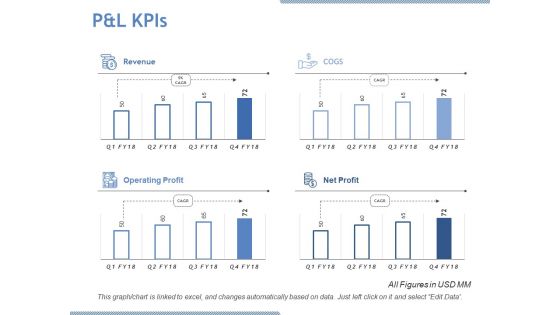
P And L Kpis Ppt PowerPoint Presentation Designs Download
This is a p and l kpis ppt powerpoint presentation designs download. This is a four stage process. The stages in this process are revenue, cogs, operating profit, net profit.
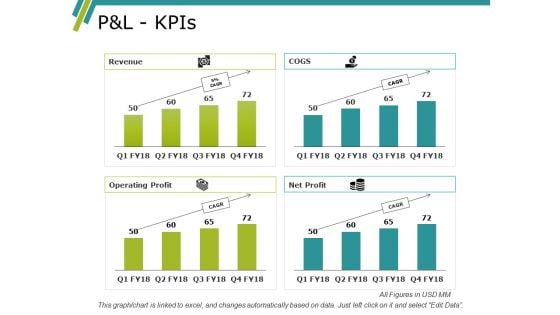
Pandl Kpis Ppt PowerPoint Presentation Slides Designs Download
This is a pandl kpis ppt powerpoint presentation slides designs download. This is a four stage process. The stages in this process are net sales, table, planning, cost, management.
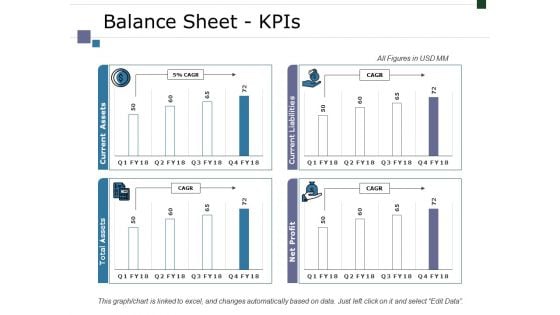
Balance Sheet Kpis Ppt PowerPoint Presentation Infographic Template Designs
This is a balance sheet kpis ppt powerpoint presentation infographic template designs. This is a four stage process. The stages in this process are business, marketing, finance, graph, strategy.
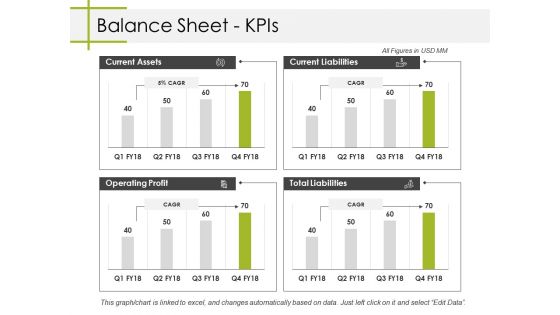
Balance Sheet Kpis Ppt PowerPoint Presentation Summary Designs Download
This is a balance sheet kpis ppt powerpoint presentation summary designs download. This is a four stage process. The stages in this process are current assets, current liabilities, total liabilities, operating profit, business.

Dashboard And Kpis Ppt PowerPoint Presentation Layouts Graphics Design
This is a dashboard and kpis ppt powerpoint presentation layouts graphics design. This is a one stage process. The stages in this process are marketing, business, management, planning, strategy.
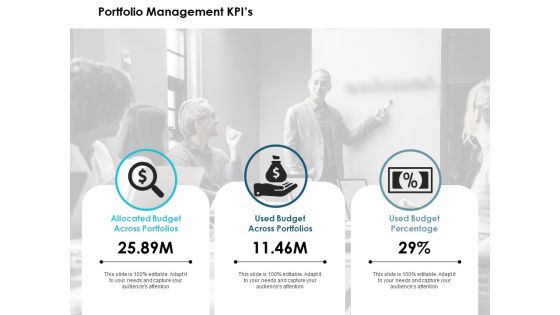
Portfolio Management Kpis Ppt PowerPoint Presentation Pictures Design Inspiration
This is a portfolio management kpis ppt powerpoint presentation pictures design inspiration. This is a three stage process. The stages in this process are management, marketing, business, strategy, planning.

Developing Excellence In Logistics Operations Kpis To Track Transportation Management System Performance Clipart PDF
This slide focuses on key performance indicators to track transportation management system performance which includes freight cost for each unit shipped, outbound and inbound freight costs, etc.Deliver and pitch your topic in the best possible manner with this Developing Excellence In Logistics Operations Kpis To Track Transportation Management System Performance Clipart PDF Use them to share invaluable insights on Inbound Freight, Transportation Time, Freight Billing and impress your audience. This template can be altered and modified as per your expectations. So, grab it now.
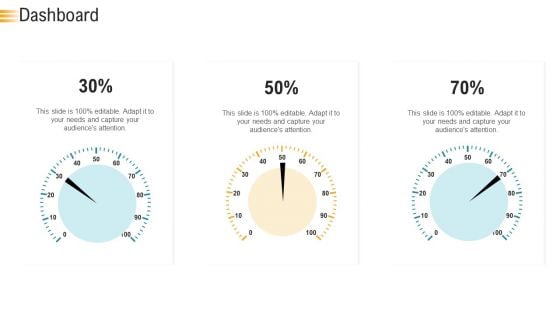
Establishing An Efficient Integrated Marketing Communication Process Dashboard Ppt Professional Ideas PDF
Presenting establishing an efficient integrated marketing communication process dashboard ppt professional ideas pdf to provide visual cues and insights. Share and navigate important information on three stages that need your due attention. This template can be used to pitch topics like dashboard. In addtion, this PPT design contains high resolution images, graphics, etc, that are easily editable and available for immediate download.
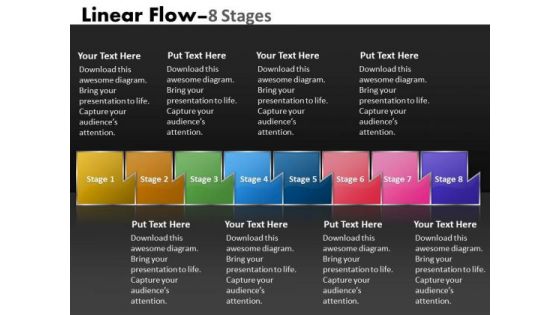
Ppt Multicolored Sequential Flow Process Charts Network Diagram PowerPoint Template 1 Graphic
We present our PPT multicolored Sequential flow process charts network diagram PowerPoint template 1 Graphic. Use our Design PowerPoint Templates because, coincidentally it always points to the top. Use our Shapes PowerPoint Templates because, your foot is on the pedal and your company is purring along smoothly. Use our Business PowerPoint Templates because, Harness these opportunities, celebrate your performance till date and focus on greater growth and expansion in coming years. Use our Process and Flows PowerPoint Templates because, There are different paths to gain the necessary knowledge to achieve it. Use our Signs PowerPoint Templates because, Signpost your preferred roadmap to your eager co- travelers and demonstrate clearly how you intend to navigate them towards the desired corporate goal. Use these PowerPoint slides for presentations relating to abstract, algorithm, arrow, arrow chart, diagram, business, chart, connection, design, development, diagram, direction, element, flow diagram, diagram, linear diagram, management, organization, process, process arrows, process, process diagram, sign, solution, strategy, symbol, vector, vibrant . The prominent colors used in the PowerPoint template are Red, Green, and Pink Equip your thoughts with all accessories. Add on our Ppt Multicolored Sequential Flow Process Charts Network Diagram PowerPoint Template 1 Graphic for good measure.
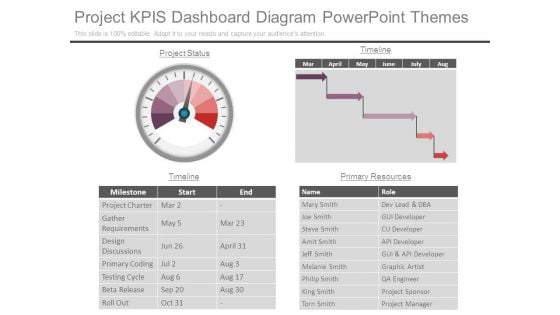
Project Kpis Dashboard Diagram Powerpoint Themes
This is a project kpis dashboard diagram powerpoint themes. This is a one stage process. The stages in this process are project status, timeline, name, role, milestone, start, end, primary resources, project charter, gather requirements, design discussions, primary coding, testing cycle, beta release, roll out, mary smith, joe smith, steve smith, amit smith, jeff smith, melanie smith, philip smith, king smith, torn smith, dev lead and dba, gui developer, cu developer, api developer, gui and api developer, graphic artist, qa engineer, project sponsor, project manager.
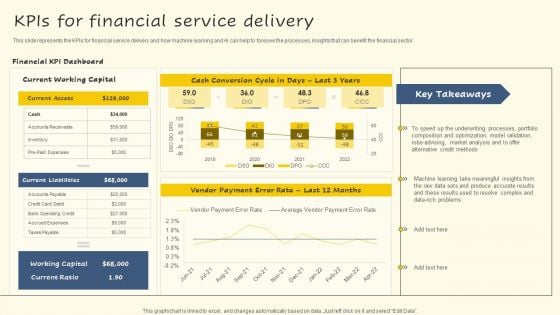
Kpis For Financial Service Delivery Background PDF
This slide represents the KPIs for financial service delivery and how machine learning and AI can help to foresee the processes, insights that can benefit the financial sector. If you are looking for a format to display your unique thoughts, then the professionally designed Kpis For Financial Service Delivery Background PDF is the one for you. You can use it as a Google Slides template or a PowerPoint template. Incorporate impressive visuals, symbols, images, and other charts. Modify or reorganize the text boxes as you desire. Experiment with shade schemes and font pairings. Alter, share or cooperate with other people on your work. Download Kpis For Financial Service Delivery Background PDF and find out how to give a successful presentation. Present a perfect display to your team and make your presentation unforgettable.
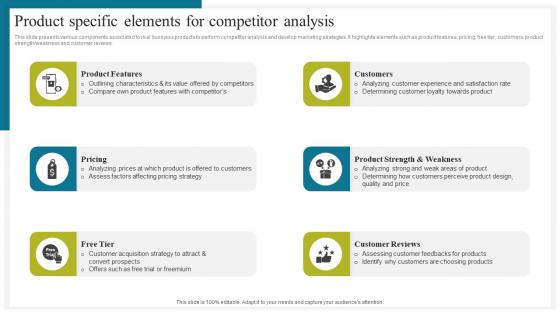
Product Specific Elements For How To Conduct Competitive Assessment Professional Pdf
This slide presents various components associated to rival business products to perform competitor analysis and develop marketing strategies. It highlights elements such as product features, pricing, free tier, customers, product strength weakness and customer reviews. Slidegeeks is here to make your presentations a breeze with Product Specific Elements For How To Conduct Competitive Assessment Professional Pdf With our easy to use and customizable templates, you can focus on delivering your ideas rather than worrying about formatting. With a variety of designs to choose from, you are sure to find one that suits your needs. And with animations and unique photos, illustrations, and fonts, you can make your presentation pop. So whether you are giving a sales pitch or presenting to the board, make sure to check out Slidegeeks first. This slide presents various components associated to rival business products to perform competitor analysis and develop marketing strategies. It highlights elements such as product features, pricing, free tier, customers, product strength weakness and customer reviews.
PowerPoint Layout Strategy Measuring Growth Ppt Templates
PowerPoint Layout Strategy Measuring Growth PPT Templates-These high quality powerpoint pre-designed slides and powerpoint templates have been carefully created by our professional team to help you impress your audience. All slides have been created and are 100% editable in powerpoint. Each and every property of any graphic - color, size, orientation, shading, outline etc. can be modified to help you build an effective powerpoint presentation. Any text can be entered at any point in the powerpoint template or slide. Simply DOWNLOAD, TYPE and PRESENT! Say goodbye to any fears with our PowerPoint Layout Strategy Measuring Growth Ppt Templates. They add on to your courage of conviction.
PowerPoint Process Success Measuring Growth Ppt Process
PowerPoint Process Success Measuring Growth PPT Process-These high quality powerpoint pre-designed slides and powerpoint templates have been carefully created by our professional team to help you impress your audience. All slides have been created and are 100% editable in powerpoint. Each and every property of any graphic - color, size, orientation, shading, outline etc. can be modified to help you build an effective powerpoint presentation. Any text can be entered at any point in the powerpoint template or slide. Simply DOWNLOAD, TYPE and PRESENT! Process feedback with our PowerPoint Process Success Measuring Growth Ppt Process. Download without worries with our money back guaranteee.
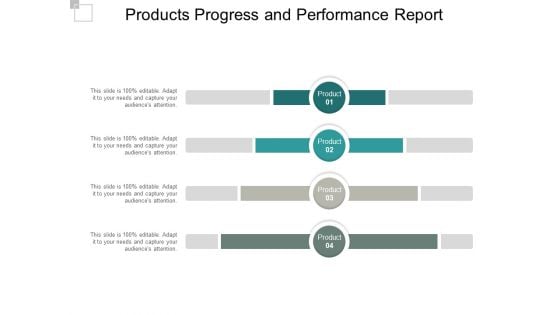
Products Progress And Performance Report Ppt PowerPoint Presentation Inspiration Display
This is a products progress and performance report ppt powerpoint presentation inspiration display. This is a four stage process. The stages in this process are progress report, growth report, improvement report.

Financial Measures Powerpoint Slides Background Designs
This is a financial measures powerpoint slides background designs. This is a five stage process. The stages in this process are traditional strategic management, internal processes, customer relationship, learning and growth, financial measures.
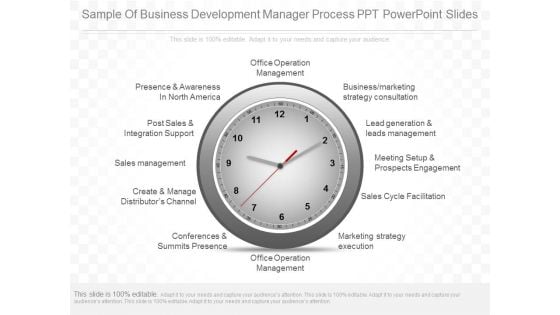
Sample Of Business Development Manager Process Ppt Powerpoint Slides
This is a sample of business development manager process ppt powerpoint slides. This is a one stage process. The stages in this process are presence and awareness in north america, post sales and integration support, sales management, create and manage distributor channel, conferences and summits presence, office operation management, marketing strategy execution, sales cycle facilitation, meeting setup and prospects engagement, lead generation and leads management, business marketing strategy consultation, office operation management.
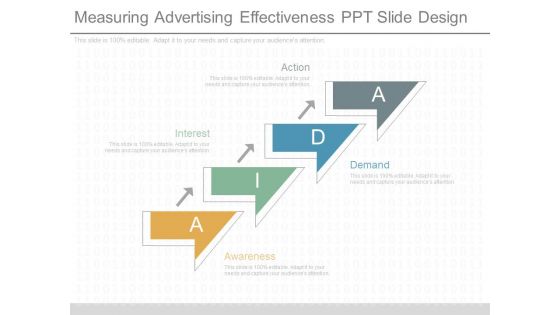
Measuring Advertising Effectiveness Ppt Slide Design
This is a measuring advertising effectiveness ppt slide design. This is a four stage process. The stages in this process are action, interest, demand, awareness.
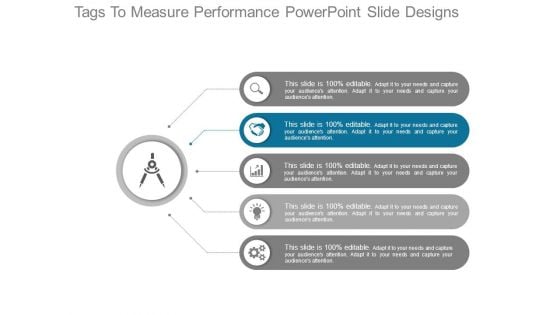
Tags To Measure Performance Powerpoint Slide Designs
This is a tags to measure performance powerpoint slide designs. This is a five stage process. The stages in this process are icons, marketing, business, strategy.
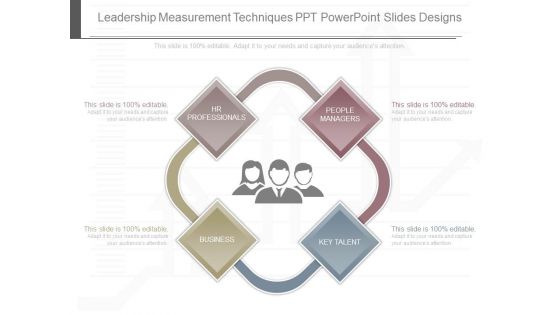
Leadership Measurement Techniques Ppt Powerpoint Slides Designs
This is a leadership measurement techniques ppt powerpoint slides designs. This is a four stage process. The stages in this process are hr professionals, people managers, key talent, business.
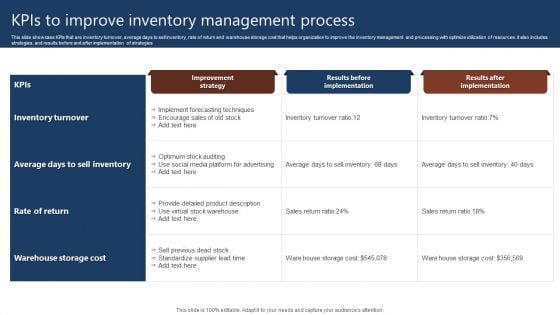
Kpis To Improve Inventory Management Process Diagrams PDF
This slide showcase KPIs that are inventory turnover, average days to sell inventory, rate of return and warehouse storage cost that helps organization to improve the inventory management and processing with optimize utilization of resources. It also includes strategies, and results before and after implementation of strategies. Showcasing this set of slides titled Kpis To Improve Inventory Management Process Diagrams PDF. The topics addressed in these templates are Inventory Turnover, Results Before Implementation, Improvement Strategy. All the content presented in this PPT design is completely editable. Download it and make adjustments in color, background, font etc. as per your unique business setting.
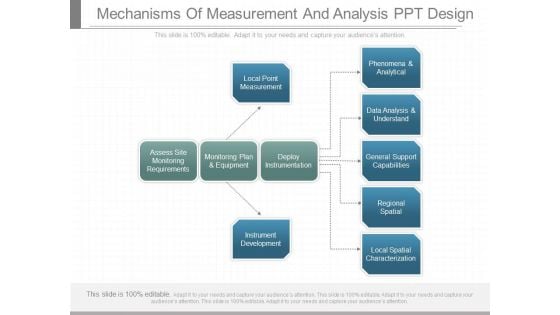
Mechanisms Of Measurement And Analysis Ppt Design
This is a mechanisms of measurement and analysis ppt design. This is a ten stage process. The stages in this process are phenomena and analytical, data analysis and understand, general support capabilities, regional spatial, local spatial characterization, local point measurement, assess site monitoring requirements, monitoring plan and equipment, deploy instrumentation, instrument development.
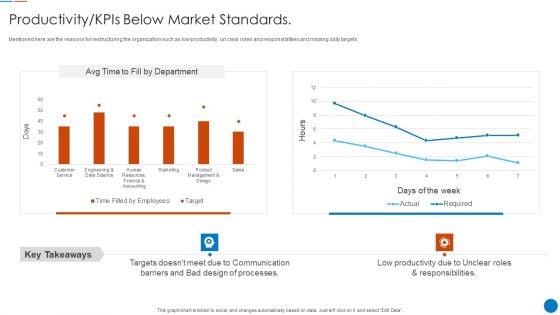
Organizational Restructuring Process Productivity Kpis Below Market Standards Information PDF
Mentioned here are the reasons for restructuring the organization such as low productivity, un clear roles and responsibilities and missing daily targets Deliver an awe inspiring pitch with this creative Organizational Restructuring Process Productivity Kpis Below Market Standards Information PDF bundle. Topics like Low Productivity, Roles And Responsibilities, Barriers And Bad Design can be discussed with this completely editable template. It is available for immediate download depending on the needs and requirements of the user.
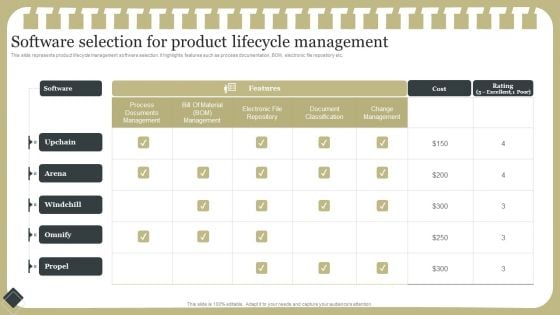
Effective Product Development Strategy Software Selection For Product Lifecycle Management Mockup PDF
This slide represents product lifecycle management software selection. It highlights features such as process documentation, BOM, electronic file repository etc.This Effective Product Development Strategy Software Selection For Product Lifecycle Management Mockup PDF from Slidegeeks makes it easy to present information on your topic with precision. It provides customization options, so you can make changes to the colors, design, graphics, or any other component to create a unique layout. It is also available for immediate download, so you can begin using it right away. Slidegeeks has done good research to ensure that you have everything you need to make your presentation stand out. Make a name out there for a brilliant performance.
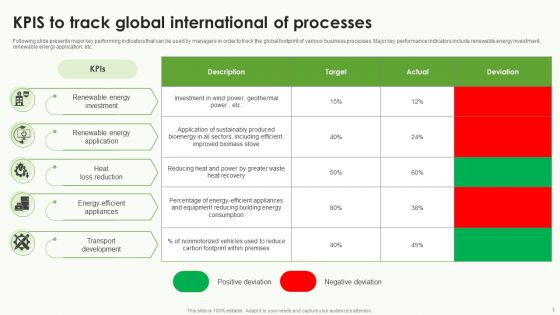
Kpis To Track Global International Of Processes Summary PDF
Following slide presents major key performing indicators that can be used by managers in order to track the global footprint of various business processes. Major key performance indicators include renewable energy investment, renewable energy application, etc. Showcasing this set of slides titled Kpis To Track Global International Of Processes Summary PDF. The topics addressed in these templates are Renewable Energy Investment, Renewable Energy Application, Heat Loss Reduction . All the content presented in this PPT design is completely editable. Download it and make adjustments in color, background, font etc. as per your unique business setting.
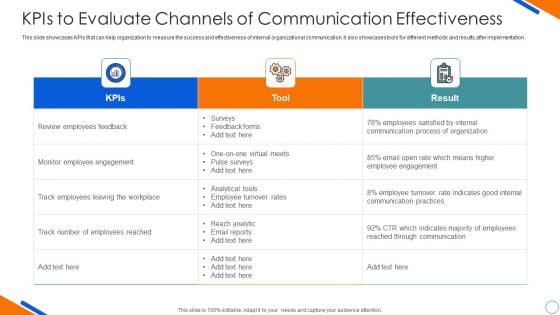
Kpis To Evaluate Channels Of Communication Effectiveness Microsoft PDF
This slide showcases KPIs that can help organization to measure the success and effectiveness of internal organizational communication. It also showcases tools for different methods and results after implementation. Showcasing this set of slides titled kpis to evaluate channels of communication effectiveness microsoft pdf. The topics addressed in these templates are review employees feedback, monitor employee engagement, communication process. All the content presented in this PPT design is completely editable. Download it and make adjustments in color, background, font etc. as per your unique business setting.
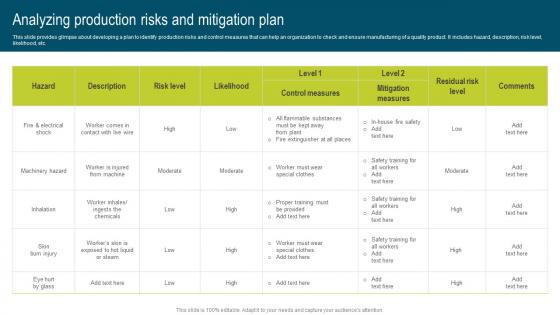
Analyzing Production Risks And Mitigation Developing Extensive Plan For Operational Pictures Pdf
This slide provides glimpse about developing a plan to identify production risks and control measures that can help an organization to check and ensure manufacturing of a quality product. It includes hazard, description, risk level, likelihood, etc. Do you have to make sure that everyone on your team knows about any specific topic I yes, then you should give PRODUCT NAME a try. Our experts have put a lot of knowledge and effort into creating this impeccable Analyzing Production Risks And Mitigation Developing Extensive Plan For Operational Pictures Pdf. You can use this template for your upcoming presentations, as the slides are perfect to represent even the tiniest detail. You can download these templates from the Slidegeeks website and these are easy to edit. So grab these today. This slide provides glimpse about developing a plan to identify production risks and control measures that can help an organization to check and ensure manufacturing of a quality product. It includes hazard, description, risk level, likelihood, etc.
Balance Scorecard Strategy Map To Enhance Better Management Icons PDF
This slide covers business balanced scorecard strategy map. It involves four perspective such as financial perspective, customer, internal, learning and growth perspective.Pitch your topic with ease and precision using this Balance Scorecard Strategy Map To Enhance Better Management Icons PDF. This layout presents information on Productivity Strategy, Management Processes, Manager Processes. It is also available for immediate download and adjustment. So, changes can be made in the color, design, graphics or any other component to create a unique layout.
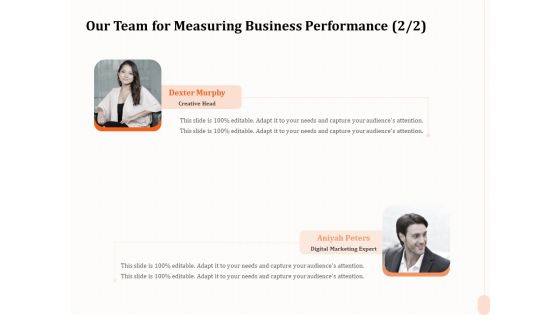
Business Process Performance Measurement Our Team For Measuring Business Performance Designs PDF
Presenting this set of slides with name business process performance measurement our team for measuring business performance designs pdf. This is a three stage process. The stages in this process are our team, measuring, business, performance. This is a completely editable PowerPoint presentation and is available for immediate download. Download now and impress your audience.
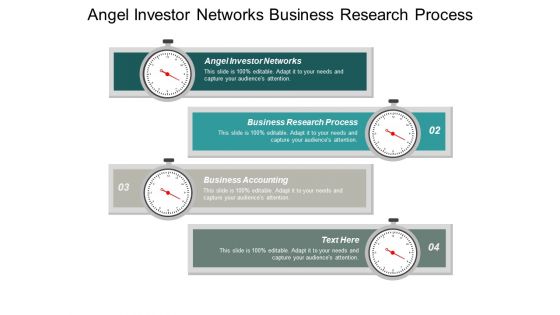
Angel Investor Networks Business Research Process Business Accounting Ppt PowerPoint Presentation File Designs Download Cpb
This is a angel investor networks business research process business accounting ppt powerpoint presentation file designs download cpb. This is a four stage process. The stages in this process are angel investor networks, business research process, business accounting.
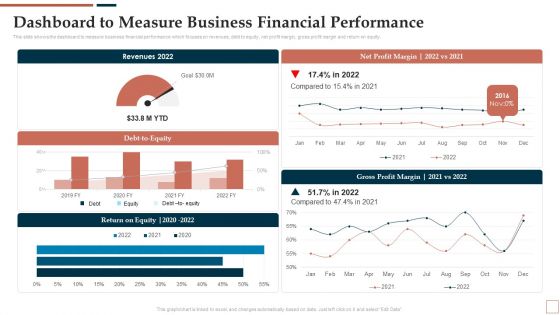
BPR To Develop Operational Effectiveness Dashboard To Measure Business Financial Performance Elements PDF
This slide shows the dashboard to measure business financial performance which focuses on revenues, debt to equity, net profit margin, gross profit margin and return on equity. Coming up with a presentation necessitates that the majority of the effort goes into the content and the message you intend to convey. The visuals of a PowerPoint presentation can only be effective if it supplements and supports the story that is being told. Keeping this in mind our experts created BPR To Develop Operational Effectiveness Dashboard To Measure Business Financial Performance Elements PDF to reduce the time that goes into designing the presentation. This way, you can concentrate on the message while our designers take care of providing you with the right template for the situation.
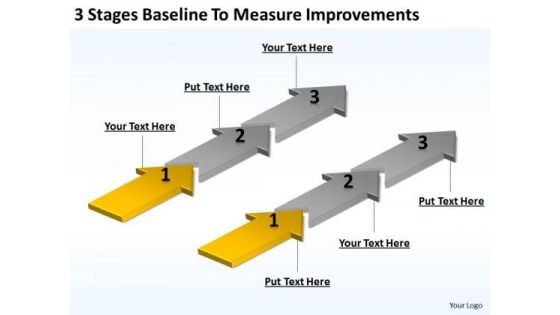
Arrows For Ppt To Measure Improvements PowerPoint Templates Backgrounds Slides
We present our arrows for ppt to measure improvements PowerPoint templates backgrounds slides.Present our Business PowerPoint Templates because Our PowerPoint Templates and Slides are designed to help you succeed. They have all the ingredients you need. Download and present our Arrows PowerPoint Templates because Your audience will believe you are the cats whiskers. Download our Process and Flows PowerPoint Templates because You can Connect the dots. Fan expectations as the whole picture emerges. Present our Shapes PowerPoint Templates because Our PowerPoint Templates and Slides are the chords of your song. String them along and provide the lilt to your views. Download our Flow Charts PowerPoint Templates because Our PowerPoint Templates and Slides will let you Leave a lasting impression to your audiences. They possess an inherent longstanding recall factor.Use these PowerPoint slides for presentations relating to Advertising, arrow, background, banner, yellow, concept, creative, design, direction, flow, illustration, info graphic, layout, manual, marketing, process, product, promotion, special, step, symbol, template, version, website. The prominent colors used in the PowerPoint template are Yellow, Gray, Black. People tell us our arrows for ppt to measure improvements PowerPoint templates backgrounds slides are incredible easy to use. Presenters tell us our concept PowerPoint templates and PPT Slides will make the presenter look like a pro even if they are not computer savvy. Customers tell us our arrows for ppt to measure improvements PowerPoint templates backgrounds slides are designed to make your presentations professional. Customers tell us our background PowerPoint templates and PPT Slides will generate and maintain the level of interest you desire. They will create the impression you want to imprint on your audience. Professionals tell us our arrows for ppt to measure improvements PowerPoint templates backgrounds slides are the best it can get when it comes to presenting. Use our banner PowerPoint templates and PPT Slides effectively help you save your valuable time. Increase viewership with our Arrows For Ppt To Measure Improvements PowerPoint Templates Backgrounds Slides. Make sure your presentation gets the attention it deserves.
Business Performance Measures Powerpoint Slide
This is a business performance measures powerpoint slide designs. This is a three stage process. The stages in this process are business, marketing, performance, presentation, management.
Employee Competency Management With Kpis Icon Slides PDF
Persuade your audience using this employee competency management with kpis icon slides pdf. This PPT design covers four stages, thus making it a great tool to use. It also caters to a variety of topics including employee competency management with kpis icon. Download this PPT design now to present a convincing pitch that not only emphasizes the topic but also showcases your presentation skills.
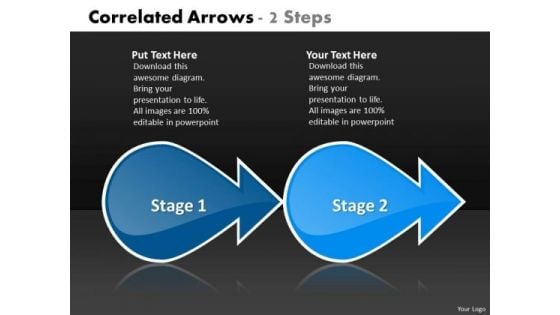
Correlated Arrows 2 Steps Technical Flow Chart PowerPoint Templates
We present our correlated arrows 2 steps technical flow chart PowerPoint templates.Use our Business PowerPoint Templates because, Infrastructure growth is an obvious requirement of today.Inform your group on how exactly this potential is tailor made for you Use our Arrows PowerPoint Templates because,This PPT slide helps you to measure key aspects of the current process and collect relevant data Use our Shapes PowerPoint Templates because,You have the ideas, you have got a brainwave. Use our Design PowerPoint Templates because,firing the arrows to emblazon the desired path will let you achieve anticipated results. Use our Abstract PowerPoint Templates because,Leading from the front is your preferred style. Use these PowerPoint slides for presentations relating to abstract, arrow, arrows, business, chart, design, development, diagram, direction, element, flow, flowchart, graph, linear, management, model, motion, organization, plan, process, program, section, segment, set, sign, solution, strategy, symbol, technology. The prominent colors used in the PowerPoint template are Blue, Blue navy, White. People tell us our correlated arrows 2 steps technical flow chart PowerPoint templates are Fantastic. The feedback we get is that our business PowerPoint templates and PPT Slides are Fabulous. People tell us our correlated arrows 2 steps technical flow chart PowerPoint templates are Playful. Presenters tell us our arrows PowerPoint templates and PPT Slides are Pretty. The feedback we get is that our correlated arrows 2 steps technical flow chart PowerPoint templates are Fashionable. Professionals tell us our chart PowerPoint templates and PPT Slides are aesthetically designed to attract attention. We guarantee that they will grab all the eyeballs you need. Compile it on our Correlated Arrows 2 Steps Technical Flow Chart PowerPoint Templates. Give your thoughts exclusive exposure.
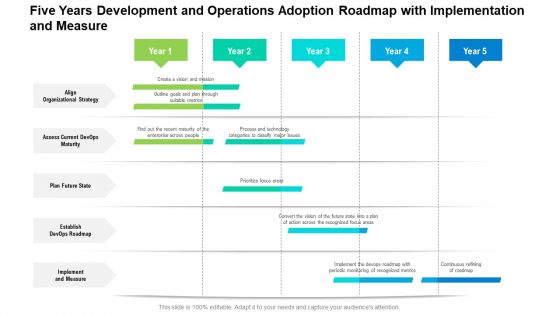
Five Years Development And Operations Adoption Roadmap With Implementation And Measure Sample
We present our five years development and operations adoption roadmap with implementation and measure sample. This PowerPoint layout is easy to edit so you can change the font size, font type, color, and shape conveniently. In addition to this, the PowerPoint layout is Google Slides compatible, so you can share it with your audience and give them access to edit it. Therefore, download and save this well researched five years development and operations adoption roadmap with implementation and measure sample in different formats like PDF, PNG, and JPG to smoothly execute your business plan.
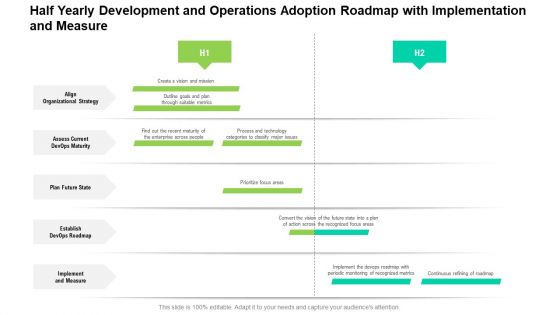
Half Yearly Development And Operations Adoption Roadmap With Implementation And Measure Sample
We present our half yearly development and operations adoption roadmap with implementation and measure sample. This PowerPoint layout is easy to edit so you can change the font size, font type, color, and shape conveniently. In addition to this, the PowerPoint layout is Google Slides compatible, so you can share it with your audience and give them access to edit it. Therefore, download and save this well researched half yearly development and operations adoption roadmap with implementation and measure sample in different formats like PDF, PNG, and JPG to smoothly execute your business plan.
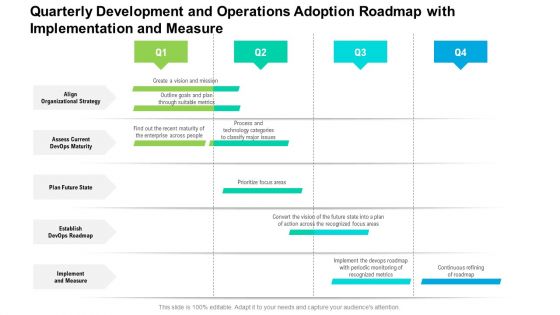
Quarterly Development And Operations Adoption Roadmap With Implementation And Measure Download
We present our quarterly development and operations adoption roadmap with implementation and measure download. This PowerPoint layout is easy to edit so you can change the font size, font type, color, and shape conveniently. In addition to this, the PowerPoint layout is Google Slides compatible, so you can share it with your audience and give them access to edit it. Therefore, download and save this well researched quarterly development and operations adoption roadmap with implementation and measure download in different formats like PDF, PNG, and JPG to smoothly execute your business plan.
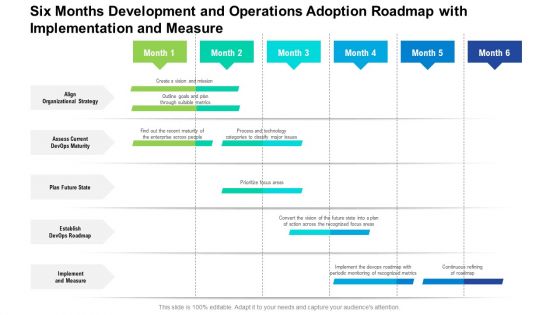
Six Months Development And Operations Adoption Roadmap With Implementation And Measure Template
We present our six months development and operations adoption roadmap with implementation and measure template. This PowerPoint layout is easy to edit so you can change the font size, font type, color, and shape conveniently. In addition to this, the PowerPoint layout is Google Slides compatible, so you can share it with your audience and give them access to edit it. Therefore, download and save this well researched six months development and operations adoption roadmap with implementation and measure template in different formats like PDF, PNG, and JPG to smoothly execute your business plan.
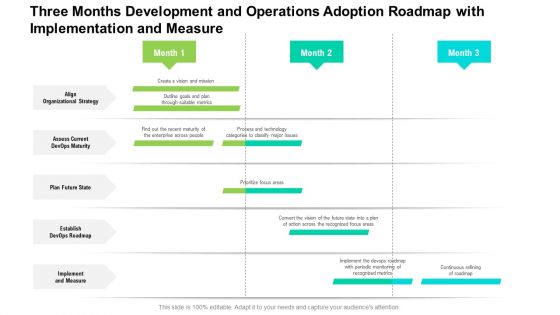
Three Months Development And Operations Adoption Roadmap With Implementation And Measure Rules
We present our three months development and operations adoption roadmap with implementation and measure rules. This PowerPoint layout is easy to edit so you can change the font size, font type, color, and shape conveniently. In addition to this, the PowerPoint layout is Google Slides compatible, so you can share it with your audience and give them access to edit it. Therefore, download and save this well researched three months development and operations adoption roadmap with implementation and measure rules in different formats like PDF, PNG, and JPG to smoothly execute your business plan.
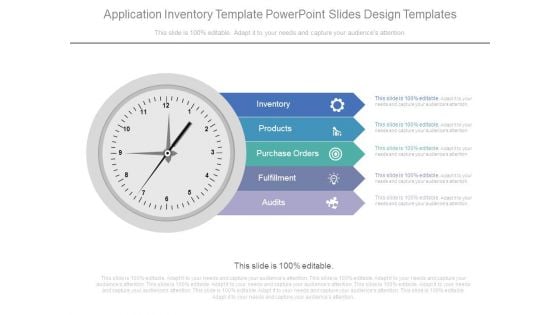
Application Inventory Template Powerpoint Slides Design Templates
This is a application inventory template powerpoint slides design templates. This is a five stage process. The stages in this process are inventory, products, purchase orders, fulfillment, audits.
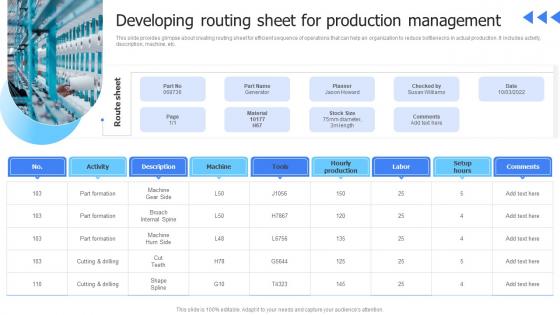
Leveraging Advanced Manufacturing Developing Routing Sheet For Production Clipart Pdf
This slide provides glimpse about creating routing sheet for efficient sequence of operations that can help an organization to reduce bottlenecks in actual production. It includes activity, description, machine, etc. From laying roadmaps to briefing everything in detail, our templates are perfect for you. You can set the stage with your presentation slides. All you have to do is download these easy-to-edit and customizable templates. Leveraging Advanced Manufacturing Developing Routing Sheet For Production Clipart Pdf will help you deliver an outstanding performance that everyone would remember and praise you for. Do download this presentation today. This slide provides glimpse about creating routing sheet for efficient sequence of operations that can help an organization to reduce bottlenecks in actual production. It includes activity, description, machine, etc.
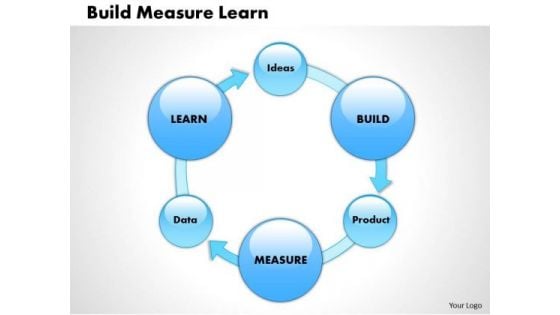
Business Framework Build Measure Learn PowerPoint Presentation
This business power point diagram slide has been designed with build measure learn. This is used in lean manufacturing system where you have to show continuous deployment and minimal viable production. Use this PPT slide in your production related presentations.
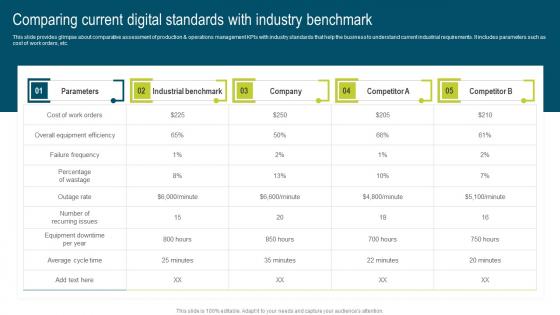
Comparing Current Digital Standards Developing Extensive Plan For Operational Infographics Pdf
This slide provides glimpse about comparative assessment of production and operations management KPIs with industry standards that help the business to understand current industrial requirements. It includes parameters such as cost of work orders, etc. Slidegeeks is here to make your presentations a breeze with Comparing Current Digital Standards Developing Extensive Plan For Operational Infographics Pdf With our easy-to-use and customizable templates, you can focus on delivering your ideas rather than worrying about formatting. With a variety of designs to choose from, you are sure to find one that suits your needs. And with animations and unique photos, illustrations, and fonts, you can make your presentation pop. So whether you are giving a sales pitch or presenting to the board, make sure to check out Slidegeeks first. This slide provides glimpse about comparative assessment of production and operations management KPIs with industry standards that help the business to understand current industrial requirements. It includes parameters such as cost of work orders, etc.
Strategy Measuring Beakers PowerPoint Slides And Ppt Diagram Templates
Strategy Measuring Beakers PowerPoint Slides And PPT Diagram Templates-These high quality powerpoint pre-designed slides and powerpoint templates have been carefully created by our professional team to help you impress your audience. All slides have been created and are 100% editable in powerpoint. Each and every property of any graphic - color, size, orientation, shading, outline etc. can be modified to help you build an effective powerpoint presentation. Any text can be entered at any point in the powerpoint template or slide. Simply DOWNLOAD, TYPE and PRESENT! Your audience will be absolutely attentive. Fascinate them with our Strategy Measuring Beakers PowerPoint Slides And Ppt Diagram Templates.
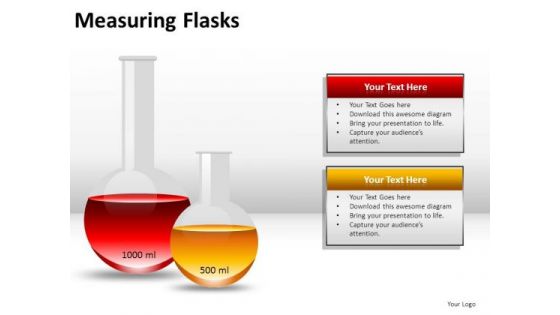
Chemicals Measuring Flasks PowerPoint Slides And Ppt Diagram Templates
Chemicals Measuring Flasks PowerPoint Slides And PPT Diagram Templates-These high quality powerpoint pre-designed slides and powerpoint templates have been carefully created by our professional team to help you impress your audience. All slides have been created and are 100% editable in powerpoint. Each and every property of any graphic - color, size, orientation, shading, outline etc. can be modified to help you build an effective powerpoint presentation. Any text can be entered at any point in the powerpoint template or slide. Simply DOWNLOAD, TYPE and PRESENT! Our Chemicals Measuring Flasks PowerPoint Slides And Ppt Diagram Templates are high fidelity. They accurately convey your thoughts to your listeners.


 Continue with Email

 Home
Home


