Devops Metrics
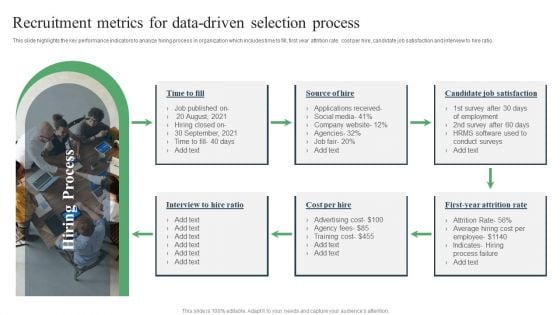
Recruitment Metrics For Data Driven Selection Process Ppt PowerPoint Presentation Inspiration Graphics Download PDF
This slide highlights the key performance indicators to analyze hiring process in organization which includes time to fill, first year attrition rate, cost per hire, candidate job satisfaction and interview to hire ratio. Persuade your audience using this Recruitment Metrics For Data-Driven Selection Process Ppt PowerPoint Presentation Inspiration Graphics Download PDF. This PPT design covers one stage, thus making it a great tool to use. It also caters to a variety of topics including Candidate Job, Satisfaction, Attrition Rate. Download this PPT design now to present a convincing pitch that not only emphasizes the topic but also showcases your presentation skills.
On Time Delivery Shipping Tracking Metrics Report With Process Flowchart Information PDF
This slide displays the order delivery chart for tracking average delivery duration and reasons for shipment delays. It also includes order details such as order ID, date of the order, delivery date, and key highlights of the delivery process. Showcasing this set of slides titled On Time Delivery Shipping Tracking Metrics Report With Process Flowchart Information PDF. The topics addressed in these templates are Our Delivery Process, Begin Production, Production Process. All the content presented in this PPT design is completely editable. Download it and make adjustments in color, background, font etc. as per your unique business setting.
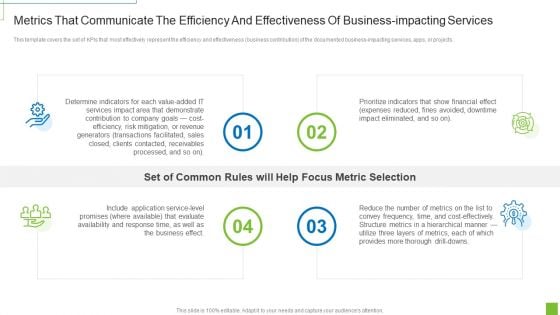
Metrics That Communicate The Efficiency And Effectiveness Of Business Impacting Services Ppt Ideas Grid PDF
This template covers the set of KPIs that most effectively represent the efficiency and effectiveness business contribution of the documented business impacting services, apps, or projects. Presenting metrics that communicate the efficiency and effectiveness of business impacting services ppt ideas grid pdf to provide visual cues and insights. Share and navigate important information on four stages that need your due attention. This template can be used to pitch topics like service level, application, revenue, cost efficiency, risk. In addtion, this PPT design contains high resolution images, graphics, etc, that are easily editable and available for immediate download.
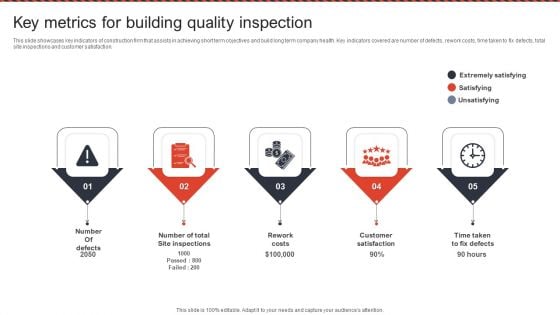
Key Metrics For Building Quality Inspection Ppt PowerPoint Presentation File Outline PDF
This slide showcases key indicators of construction firm that assists in achieving short term objectives and build long term company health. Key indicators covered are number of defects, rework costs, time taken to fix defects, total site inspections and customer satisfaction. Persuade your audience using this Key Metrics For Building Quality Inspection Ppt PowerPoint Presentation File Outline PDF. This PPT design covers five stages, thus making it a great tool to use. It also caters to a variety of topics including Extremely Satisfying, Satisfying, Unsatisfying. Download this PPT design now to present a convincing pitch that not only emphasizes the topic but also showcases your presentation skills.
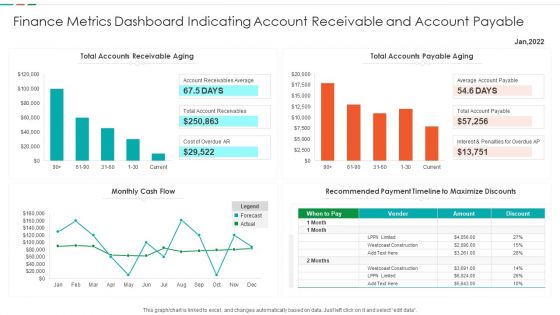
Finance Metrics Dashboard Indicating Account Receivable And Account Payable Demonstration PDF
This graph or chart is linked to excel, and changes automatically based on data. Just left click on it and select edit data. Showcasing this set of slides titled Finance Metrics Dashboard Indicating Account Receivable And Account Payable Demonstration PDF. The topics addressed in these templates are Total Accounts Receivable, Total Accounts Payable, Recommended Payment Timeline, Monthly Cash Flow. All the content presented in this PPT design is completely editable. Download it and make adjustments in color, background, font etc. as per your unique business setting.

Robotic Process Automation Metrics Ppt PowerPoint Presentation Complete Deck With Slides
This Robotic Process Automation Metrics Ppt PowerPoint Presentation Complete Deck With Slides acts as backup support for your ideas, vision, thoughts, etc. Use it to present a thorough understanding of the topic. This PPT slideshow can be utilized for both in-house and outside presentations depending upon your needs and business demands. Entailing seventeen slides with a consistent design and theme, this template will make a solid use case. As it is intuitively designed, it suits every business vertical and industry. All you have to do is make a few tweaks in the content or any other component to design unique presentations. The biggest advantage of this complete deck is that it can be personalized multiple times once downloaded. The color, design, shapes, and other elements are free to modify to add personal touches. You can also insert your logo design in this PPT layout. Therefore a well-thought and crafted presentation can be delivered with ease and precision by downloading this Robotic Process Automation Metrics Ppt PowerPoint Presentation Complete Deck With Slides PPT slideshow.

Agile Product Life Process Management Metrics To Measure Product Success By Balancing Innovation And Evolution Portrait PDF
This slide focuses on metrics to measure product success by balancing innovation and evolution such as return on investment, active users, sessions per user, net profit, revenue growth rate, bounce rate, etc. Presenting agile product life process management metrics to measure product success by balancing innovation and evolution portrait pdf to provide visual cues and insights. Share and navigate important information on one stages that need your due attention. This template can be used to pitch topics like metrics to measure product success by balancing innovation and evolution . In addtion, this PPT design contains high resolution images, graphics, etc, that are easily editable and available for immediate download.
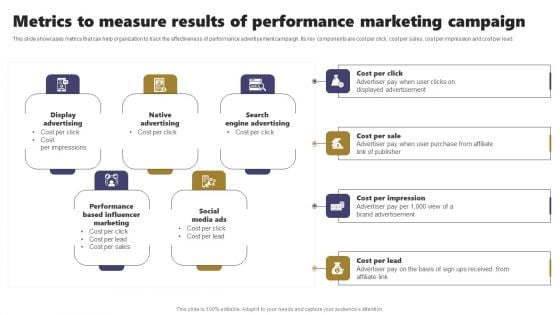
Acquiring Clients Through Search Engine And Native Ads Metrics To Measure Results Of Performance Marketing Structure PDF
This slide showcases metrics that can help organization to track the effectiveness of performance advertisement campaign. Its key components are cost per click, cost per sales, cost per impression and cost per lead. Formulating a presentation can take up a lot of effort and time, so the content and message should always be the primary focus. The visuals of the PowerPoint can enhance the presenters message, so our Acquiring Clients Through Search Engine And Native Ads Metrics To Measure Results Of Performance Marketing Structure PDF was created to help save time. Instead of worrying about the design, the presenter can concentrate on the message while our designers work on creating the ideal templates for whatever situation is needed. Slidegeeks has experts for everything from amazing designs to valuable content, we have put everything into Acquiring Clients Through Search Engine And Native Ads Metrics To Measure Results Of Performance Marketing Structure PDF
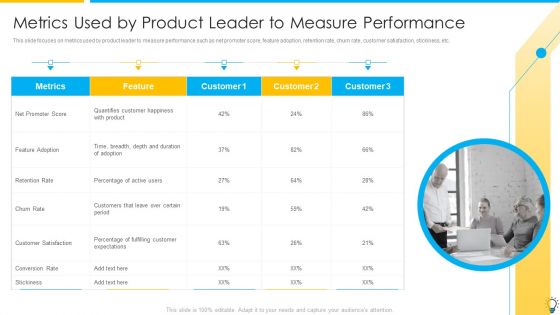
Assuring Management In Product Innovation To Enhance Processes Metrics Used By Product Leader To Measure Performance Diagrams PDF
This slide focuses on metrics used by product leader to measure performance such as net promoter score, feature adoption, retention rate, churn rate, customer satisfaction, stickiness, etc.Presenting assuring management in product innovation to enhance processes metrics used by product leader to measure performance diagrams pdf to provide visual cues and insights. Share and navigate important information on one stage that need your due attention. This template can be used to pitch topics like percentage of fulfilling, customers that leave, quantifies customer happiness In addtion, this PPT design contains high resolution images, graphics, etc, that are easily editable and available for immediate download.
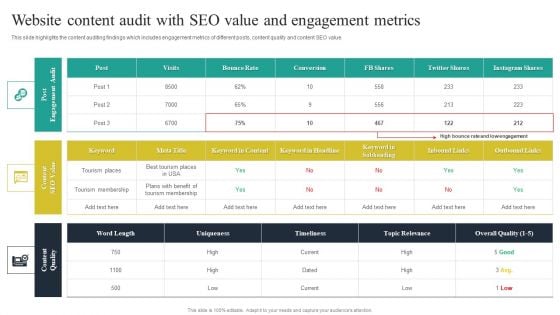
Website Audit To Increase Conversion Rate Website Content Audit With SEO Value And Engagement Metrics Diagrams PDF
This slide highlights the content auditing findings which includes engagement metrics of different posts, content quality and content SEO value. Do you have an important presentation coming up Are you looking for something that will make your presentation stand out from the rest Look no further than Website Audit To Increase Conversion Rate Website Content Audit With SEO Value And Engagement Metrics Diagrams PDF. With our professional designs, you can trust that your presentation will pop and make delivering it a smooth process. And with Slidegeeks, you can trust that your presentation will be unique and memorable. So why wait Grab Website Audit To Increase Conversion Rate Website Content Audit With SEO Value And Engagement Metrics Diagrams PDF today and make your presentation stand out from the rest.
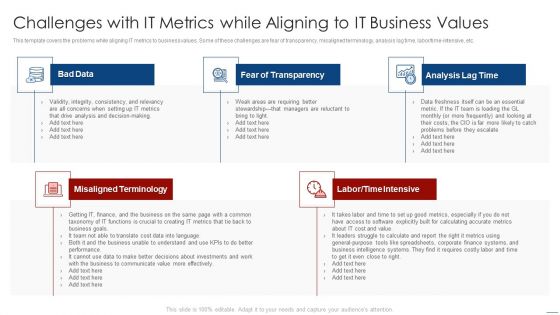
How To Evaluate And Develop The Organizational Value Of IT Service Challenges With IT Metrics While Information PDF
This template covers the problems while aligning IT metrics to business values. Some of these challenges are fear of transparency, misaligned terminology, analysis lag time, labor or time-intensive, etc. Presenting how to evaluate and develop the organizational value of it service challenges with it metrics while information pdf to provide visual cues and insights. Share and navigate important information on five stages that need your due attention. This template can be used to pitch topics like bad data, misaligned terminology, fear of transparency, analysis lag time, labor or time intensive. In addtion, this PPT design contains high resolution images, graphics, etc, that are easily editable and available for immediate download.
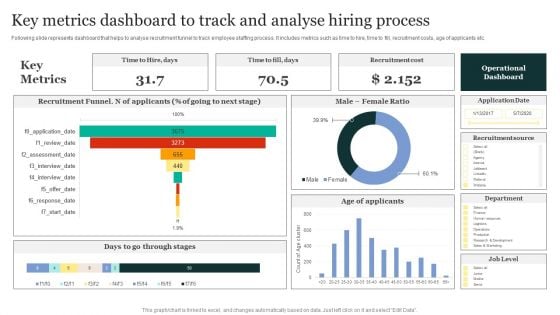
Strategic Approaches To Efficient Candidate Selection Key Metrics Dashboard To Track And Analyse Hiring Process Template PDF
Following slide represents dashboard that helps to analyse recruitment funnel to track employee staffing process. It includes metrics such as time to hire, time to fill, recruitment costs, age of applicants etc. Welcome to our selection of the Strategic Approaches To Efficient Candidate Selection Key Metrics Dashboard To Track And Analyse Hiring Process Template PDF. These are designed to help you showcase your creativity and bring your sphere to life. Planning and Innovation are essential for any business that is just starting out. This collection contains the designs that you need for your everyday presentations. All of our PowerPoints are 100 percent editable, so you can customize them to suit your needs. This multi-purpose template can be used in various situations. Grab these presentation templates today
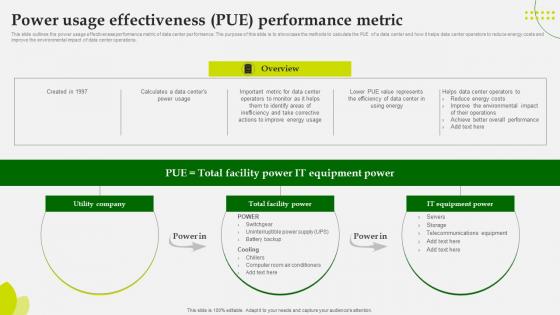
Green Computing Power Usage Effectiveness Pue Performance Metric
This slide outlines the power usage effectiveness performance metric of data center performance. The purpose of this slide is to showcase the methods to calculate the PUE of a data center and how it helps data center operators to reduce energy costs and improve the environmental impact of data center operations. Create an editable Green Computing Power Usage Effectiveness Pue Performance Metric that communicates your idea and engages your audience. Whether you are presenting a business or an educational presentation, pre-designed presentation templates help save time. Green Computing Power Usage Effectiveness Pue Performance Metric is highly customizable and very easy to edit, covering many different styles from creative to business presentations. Slidegeeks has creative team members who have crafted amazing templates. So, go and get them without any delay. This slide outlines the power usage effectiveness performance metric of data center performance. The purpose of this slide is to showcase the methods to calculate the PUE of a data center and how it helps data center operators to reduce energy costs and improve the environmental impact of data center operations.
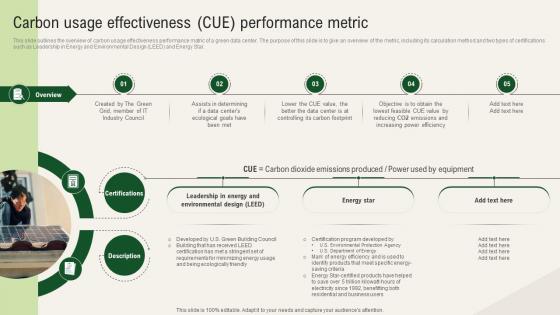
Solar Computing IT Carbon Usage Effectiveness Cue Performance Metric
This slide outlines the overview of carbon usage effectiveness performance matric of a green data center. The purpose of this slide is to give an overview of the metric, including its calculation method and two types of certifications such as Leadership in Energy and Environmental Design LEED and Energy Star. Slidegeeks is one of the best resources for PowerPoint templates. You can download easily and regulate Solar Computing IT Carbon Usage Effectiveness Cue Performance Metric for your personal presentations from our wonderful collection. A few clicks is all it takes to discover and get the most relevant and appropriate templates. Use our Templates to add a unique zing and appeal to your presentation and meetings. All the slides are easy to edit and you can use them even for advertisement purposes. This slide outlines the overview of carbon usage effectiveness performance matric of a green data center. The purpose of this slide is to give an overview of the metric, including its calculation method and two types of certifications such as Leadership in Energy and Environmental Design LEED and Energy Star.
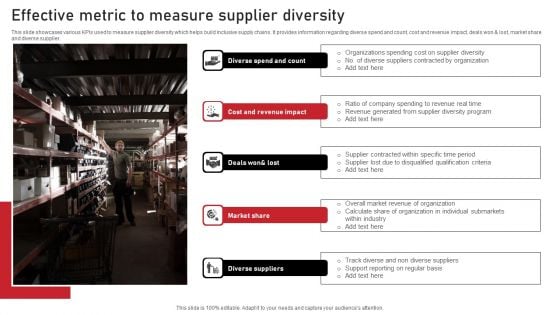
Effective Metric To Measure Supplier Diversity Themes PDF
This slide showcases various KPIs used to measure supplier diversity which helps build inclusive supply chains. It provides information regarding diverse spend and count, cost and revenue impact, deals won and lost, market share and diverse supplier. Persuade your audience using this Effective Metric To Measure Supplier Diversity Themes PDF. This PPT design covers five stages, thus making it a great tool to use. It also caters to a variety of topics including Market Share, Diverse Suppliers, Impact. Download this PPT design now to present a convincing pitch that not only emphasizes the topic but also showcases your presentation skills.
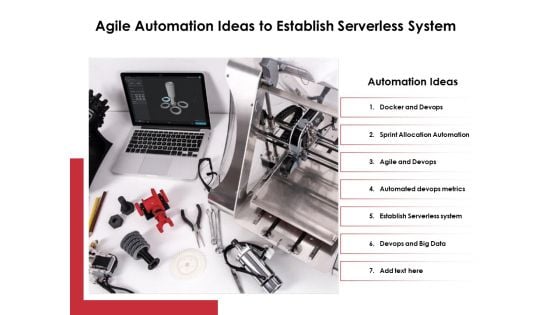
Agile Automation Ideas To Establish Serverless System Ppt PowerPoint Presentation Inspiration Show PDF
Presenting this set of slides with name agile automation ideas to establish serverless system ppt powerpoint presentation inspiration show pdf. This is a seen stage process. The stages in this process are docker and devops, sprint allocation automation, agile and devops, automated devops metrics, establish serverless system, devops and big data. This is a completely editable PowerPoint presentation and is available for immediate download. Download now and impress your audience.
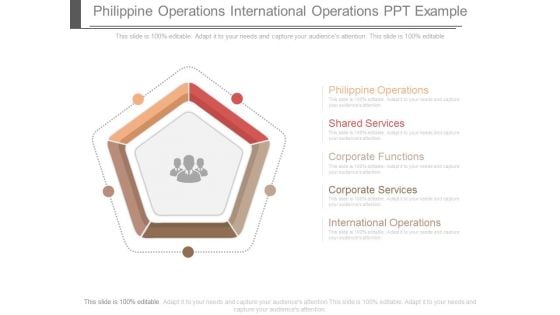
Philippine Operations International Operations Ppt Example
This is a philippine operations international operations ppt example. This is a five stage process. The stages in this process are shapes, marketing, business.
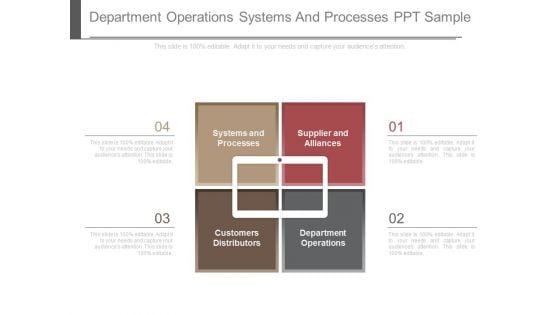
Department Operations Systems And Processes Ppt Sample
This is a department operations systems and processes ppt sample. This is a four stage process. The stages in this process are business, marketing.
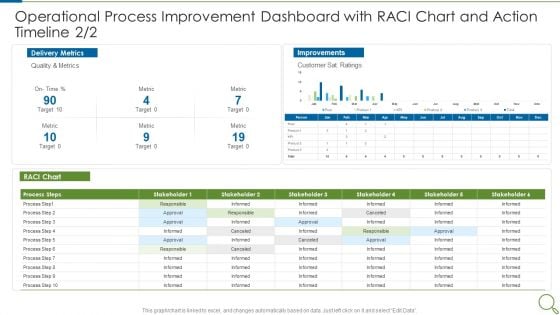
Operational Process Improvement Dashboard With RACI Chart And Action Timeline Metric Designs PDF
Deliver an awe inspiring pitch with this creative operational process improvement dashboard with raci chart and action timeline metric designs pdf bundle. Topics like metric, target, quality, customer can be discussed with this completely editable template. It is available for immediate download depending on the needs and requirements of the user.
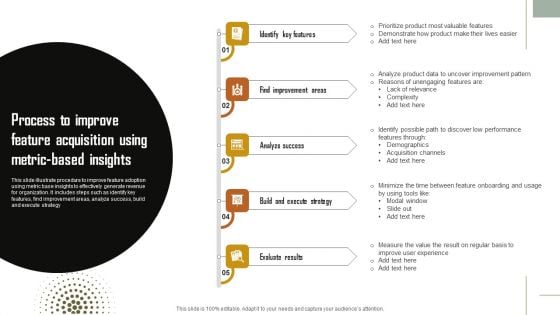
Process To Improve Feature Acquisition Using Metric Based Insights Topics PDF
This slide illustrate procedure to improve feature adoption using metric base insights to effectively generate revenue for organization. It includes steps such as identify key features, find improvement areas, analyze success, build and execute strategy. Persuade your audience using this Process To Improve Feature Acquisition Using Metric Based Insights Topics PDF. This PPT design covers five stages, thus making it a great tool to use. It also caters to a variety of topics including Analyze Success, Build And Execute Strategy, Evaluate Results. Download this PPT design now to present a convincing pitch that not only emphasizes the topic but also showcases your presentation skills.
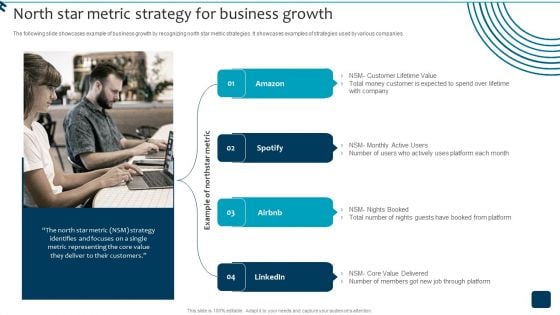
Strategic Brand Growth Plan For Market Leadership North Star Metric Strategy Rules PDF
The following slide showcases example of business growth by recognizing north star metric strategies. It showcases examples of strategies used by various companies. Do you have an important presentation coming up Are you looking for something that will make your presentation stand out from the rest Look no further than Strategic Brand Growth Plan For Market Leadership North Star Metric Strategy Rules PDF. With our professional designs, you can trust that your presentation will pop and make delivering it a smooth process. And with Slidegeeks, you can trust that your presentation will be unique and memorable. So why wait Grab Strategic Brand Growth Plan For Market Leadership North Star Metric Strategy Rules PDF today and make your presentation stand out from the rest.
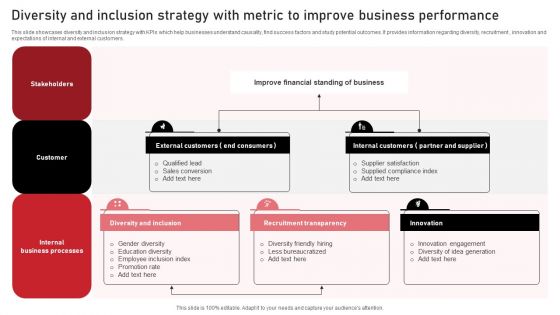
Diversity And Inclusion Strategy With Metric To Improve Business Performance Information PDF
This slide showcases diversity and inclusion strategy with KPIs which help businesses understand causality, find success factors and study potential outcomes. It provides information regarding diversity, recruitment , innovation and expectations of internal and external customers. Pitch your topic with ease and precision using this Diversity And Inclusion Strategy With Metric To Improve Business Performance Information PDF. This layout presents information on Stakeholders, Customer, Business Processes. It is also available for immediate download and adjustment. So, changes can be made in the color, design, graphics or any other component to create a unique layout.
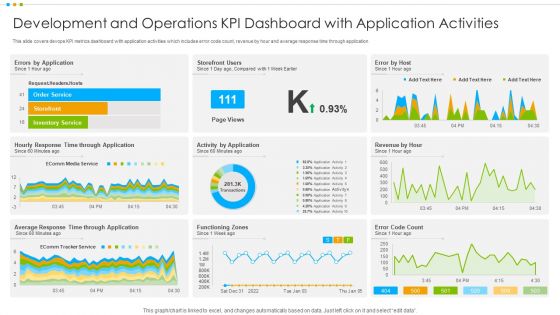
Development And Operations KPI Dashboard With Application Activities Information PDF
This slide covers devops KPI metrics dashboard with application activities which includes error code count, revenue by hour and average response time through application.Pitch your topic with ease and precision using this Development And Operations KPI Dashboard With Application Activities Information PDF This layout presents information on Development Operations Kpi Dashboard, Application Activities It is also available for immediate download and adjustment. So, changes can be made in the color, design, graphics or any other component to create a unique layout.
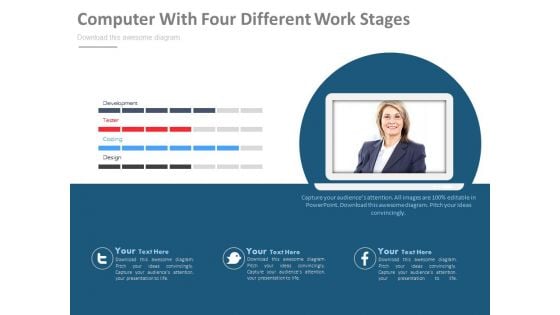
Web Conferencing And Video Chat Software Development Powerpoint Template
This PPT slide has been designed with graphics of laptop with team pictures. Download this PowerPoint to depict web conferencing and video chat services. Imprint your concepts with this professional slide in your presentations.?
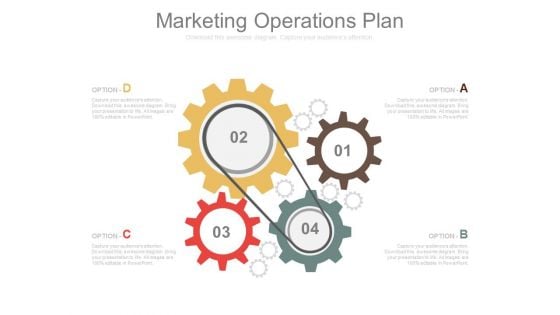
Marketing Operations Plan Ppt Slides
This is a marketing operations plan ppt slides. This is a four stage process. The stages in this process are gear wheels, technology.
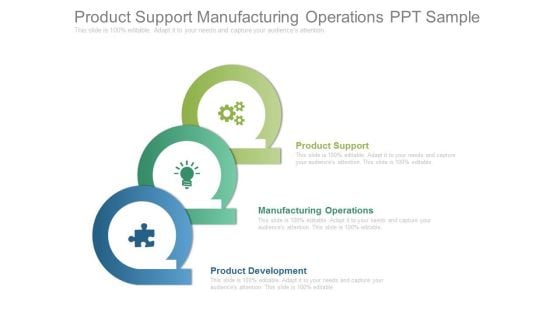
Product Support Manufacturing Operations Ppt Sample
This is a product support manufacturing operations ppt sample. This is a three stage process. The stages in this process are marketing, success, business.
Development And Operations KPI Dashboard With Central Processing Unit Statistics Icons PDF
This slide covers devops KPI metrics dashboard with central processing unit statistics about input output statistics , network traffic volume under during recorded sessions. Further, this template includes numbers of sessions with waiting time.Showcasing this set of slides titled Development And Operations KPI Dashboard With Central Processing Unit Statistics Icons PDF The topics addressed in these templates are Central Processing, Output Statistics, Resource Limits All the content presented in this PPT design is completely editable. Download it and make adjustments in color, background, font etc. as per your unique business setting.
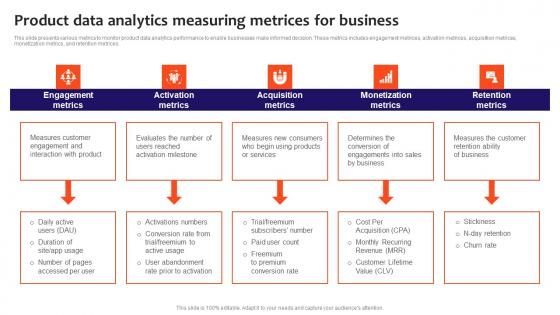
Product Data Analytics Measuring Metrices For Business Ideas Pdf
This slide presents various metrics to monitor product data analytics performance to enable businesses make informed decision. These metrics includes engagement metrices, activation metrices, acquisition metrices, monetization metrics, and retention metrices. Showcasing this set of slides titled Product Data Analytics Measuring Metrices For Business Ideas Pdf. The topics addressed in these templates are Engagement Metrics, Activation Metrics, Acquisition Metrics. All the content presented in this PPT design is completely editable. Download it and make adjustments in color, background, font etc. as per your unique business setting. This slide presents various metrics to monitor product data analytics performance to enable businesses make informed decision. These metrics includes engagement metrices, activation metrices, acquisition metrices, monetization metrics, and retention metrices.

Balanced Scorecard For Service Marketing With Multiple Metrices Infographics PDF
Presenting balanced scorecard for service marketing with multiple metrices infographics pdf to provide visual cues and insights. Share and navigate important information on three stages that need your due attention. This template can be used to pitch topics like average marketing, average customer acquisition, employee competency In addtion, this PPT design contains high resolution images, graphics, etc, that are easily editable and available for immediate download.

Cloud Computing Project Analysis Diagram Powerpoint Template
Our above PPT slide contains graphics of cloud with technology icons. This PowerPoint template may be used for project related to cloud computing. Use this diagram to impart more clarity to data and to create more sound impact on viewers.
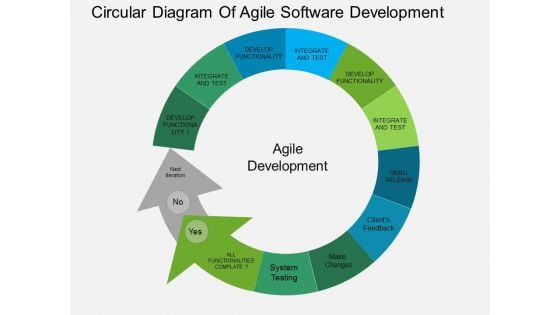
Circular Diagram Of Agile Software Development Powerpoint Templates
This PowerPoint template has been designed with circular diagram This diagram is a data visualization tool that gives you a simple way to present statistical information. This slide helps your audience examine and interpret the data you present.
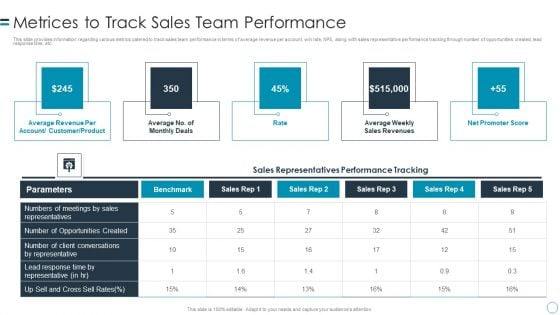
B2B Customers Journey Playbook Metrices To Track Sales Team Performance Professional PDF
This slide provides information regarding various metrics catered to track sales team performance in terms of average revenue per account, win rate, NPS, along with sales representative performance tracking through number of opportunities created, lead response time, etc. Presenting b2b customers journey playbook metrices to track sales team performance professional pdf to provide visual cues and insights. Share and navigate important information on fivestages that need your due attention. This template can be used to pitch topics like metrices to track sales team performance. In addtion, this PPT design contains high resolution images, graphics, etc, that are easily editable and available for immediate download.

B2B Sales Techniques Playbook Metrices To Track Sales Team Performance Formats PDF
This slide provides information regarding various metrics catered to track sales team performance in terms of average revenue per account, win rate, NPS, along with sales representative performance tracking through number of opportunities created, lead response time, etc. Presenting B2B Sales Techniques Playbook Metrices To Track Sales Team Performance Formats PDF to provide visual cues and insights. Share and navigate important information on four stages that need your due attention. This template can be used to pitch topics like Conversations Representative, Opportunities Created, Sales Revenues. In addtion, this PPT design contains high resolution images, graphics, etc, that are easily editable and available for immediate download.
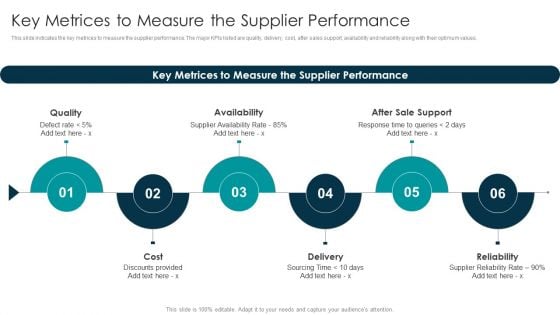
Tactical Approach For Vendor Reskilling Key Metrices To Measure The Supplier Performance Designs PDF
This slide indicates the key metrices to measure the supplier performance. The major KPIs listed are quality, delivery, cost, after sales support, availability and reliability along with their optimum values. Slidegeeks is here to make your presentations a breeze with Tactical Approach For Vendor Reskilling Key Metrices To Measure The Supplier Performance Designs PDF With our easy to use and customizable templates, you can focus on delivering your ideas rather than worrying about formatting. With a variety of designs to choose from, you are sure to find one that suits your needs. And with animations and unique photos, illustrations, and fonts, you can make your presentation pop. So whether you are giving a sales pitch or presenting to the board, make sure to check out Slidegeeks first.
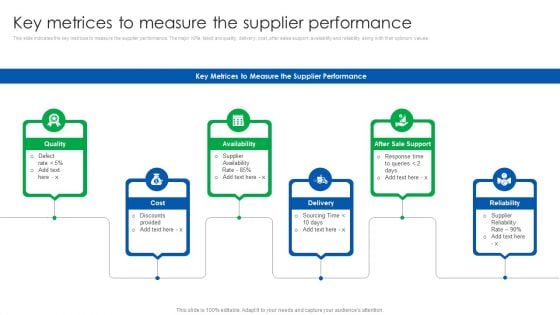
Vendor Relationship Management Strategic Plan Key Metrices To Measure The Supplier Performance Formats PDF
This slide indicates the key metrices to measure the supplier performance. The major KPIs listed are quality, delivery, cost, after sales support, availability and reliability along with their optimum values. Slidegeeks is here to make your presentations a breeze with Vendor Relationship Management Strategic Plan Key Metrices To Measure The Supplier Performance Formats PDF With our easy to use and customizable templates, you can focus on delivering your ideas rather than worrying about formatting. With a variety of designs to choose from, you are sure to find one that suits your needs. And with animations and unique photos, illustrations, and fonts, you can make your presentation pop. So whether you are giving a sales pitch or presenting to the board, make sure to check out Slidegeeks first.

ALM Optimizing The Profit Generated By Your Assets Key Metrices For Asset Procurement Clipart PDF
The following slide shows various KPIs like procurement cost, administrative cost , purchase order lifecycle and lead time for measuring the effectiveness of your procurement process for the year 2018 and 2019. Presenting alm optimizing the profit generated by your assets key metrices for asset procurement clipart pdf to provide visual cues and insights. Share and navigate important information on six stages that need your due attention. This template can be used to pitch topics like procurement cost, administrative cost, purchase order lifecycle, lead time. In addtion, this PPT design contains high resolution images, graphics, etc, that are easily editable and available for immediate download.
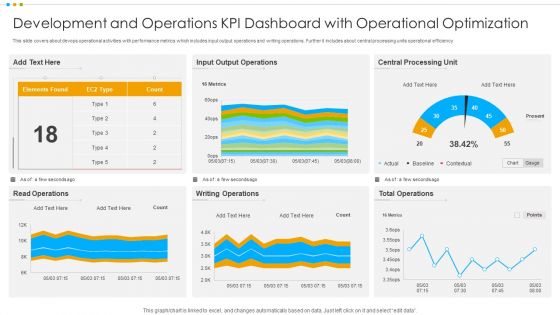
Development And Operations KPI Dashboard With Operational Optimization Pictures PDF
This slide covers about devops operational activities with performance metrics which includes input output operations and writing operations. Further it includes about central processing units operational efficiency.Pitch your topic with ease and precision using this Development And Operations KPI Dashboard With Operational Optimization Pictures PDF This layout presents information on Output Operations, Central Processing, Total Operations It is also available for immediate download and adjustment. So, changes can be made in the color, design, graphics or any other component to create a unique layout.
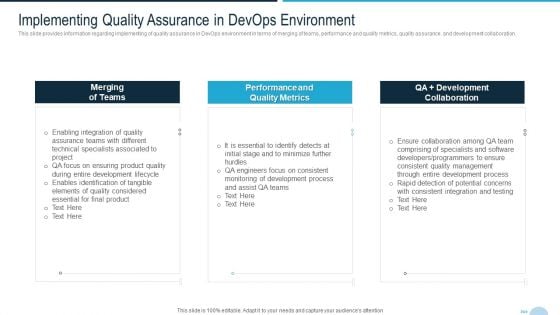
Development And Operations Quality Assurance And Validation IT Implementing Quality Assurance Professional PDF
This slide provides information regarding implementing of quality assurance in DevOps environment in terms of merging of teams, performance and quality metrics, quality assurance. and development collaboration. This is a development and operations quality assurance and validation it implementing quality assurance professional pdf template with various stages. Focus and dispense information on three stages using this creative set, that comes with editable features. It contains large content boxes to add your information on topics like merging of teams, performance and quality metrics, development collaboration You can also showcase facts, figures, and other relevant content using this PPT layout. Grab it now.
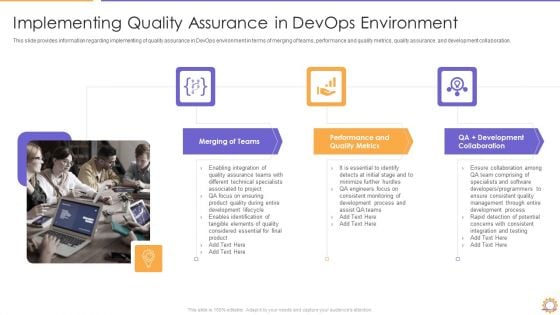
E2E Quality Assurance And Testing In Developer Operations IT Implementing Rules PDF Elements PDF
This slide provides information regarding implementing of quality assurance in DevOps environment in terms of merging of teams, performance and quality metrics, quality assurance. and development collaboration. This is a e2e quality assurance and testing in developer operations it implementing rules pdf elements pdf template with various stages. Focus and dispense information on three stages using this creative set, that comes with editable features. It contains large content boxes to add your information on topics like infrastructure code, test scripts and data, configuration server You can also showcase facts, figures, and other relevant content using this PPT layout. Grab it now.
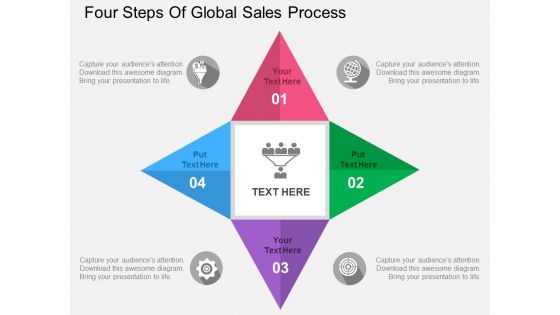
Four Steps Of Global Sales Process Powerpoint Templates
The above PPT slide contains four steps infographic layout. This PPT slide helps to portray steps of global sales process. Download this slide to make professional presentations.
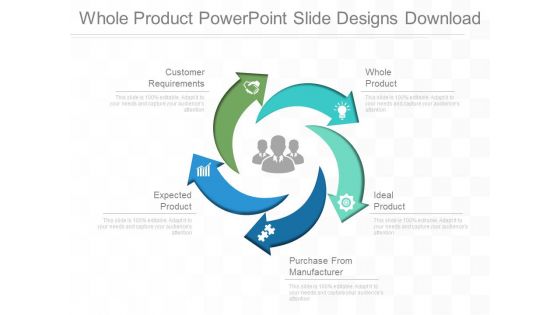
Whole Product Powerpoint Slide Designs Download
This is a whole product powerpoint slide designs download. This is a five stage process. The stages in this process are customer requirements, whole product, expected product, ideal product, purchase from manufacturer.
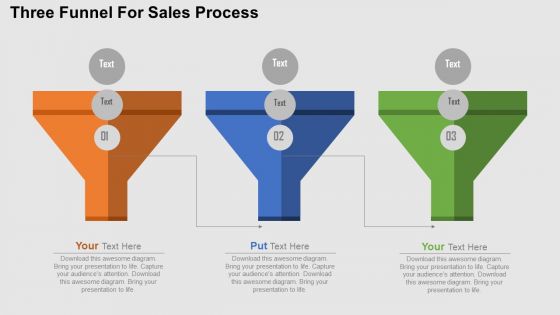
Three Funnel For Sales Process PowerPoint Templates
This multi colored creative slide has been created by our top designers and is one of the most downloaded slides. The three funnels have appropriate markings to describe the input, output and the steps involved in a process and its flow. The diagram can be effectively used to different kind of advertisements or sales strategies and the expected or received results. The PPT template can be included in the presentation to show a filtration process of some kind. It can be an effective slide in demonstrating the work of different departments as well. The slide can be edited easily to show the raw data that is received by each department, the processing done by that unit and the output produced by that unit.
Funnel Diagram With Icons For Sales Process Powerpoint Templates
Funnel diagram with icons have been displayed in this business slide. This business diagram slide helps to exhibit sales process. Use this diagram to build an exclusive presentation.
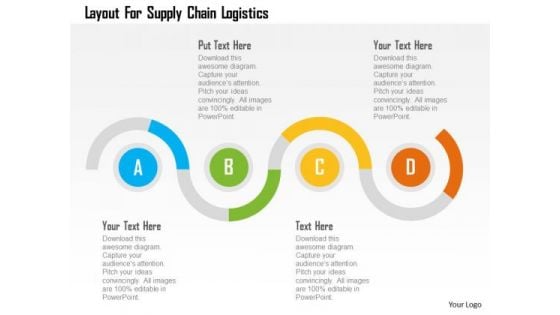
Business Diagram Layout For Supply Chain Logistics Presentation Template
This slide illustrates diagram of zigzag graphics. You may use it to represent concept of supply chain logistics. This diagram is suitable to display business information and also helps to keep your audience interested till the end of your presentation.
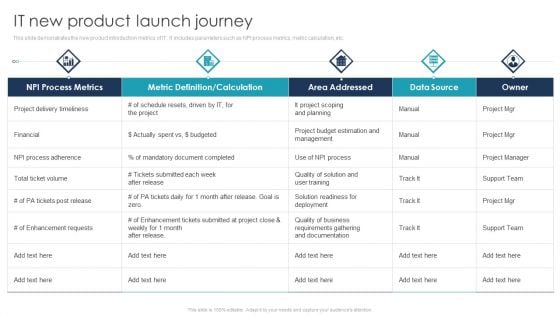
IT New Product Launch Journey Structure PDF
This slide demonstrates the new product introduction metrics of IT. It includes parameters such as NPI process metrics, metric calculation, etc. Pitch your topic with ease and precision using this IT New Product Launch Journey Structure PDF. This layout presents information on NPI Process Metrics, Project Delivery Timeliness, Data Source. It is also available for immediate download and adjustment. So, changes can be made in the color, design, graphics or any other component to create a unique layout.
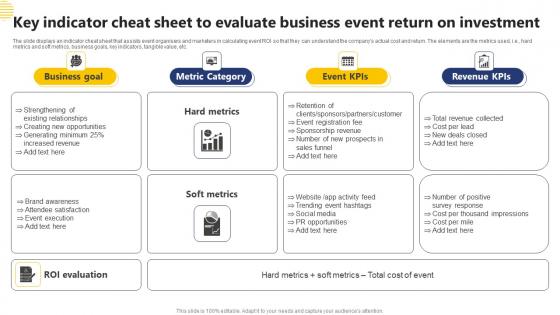
Key Indicator Cheat Sheet To Evaluate Business Event Return On Investment Template Pdf
The slide displays an indicator cheat sheet that assists event organisers and marketers in calculating event ROI so that they can understand the companys actual cost and return. The elements are the metrics used, i.e., hard metrics and soft metrics, business goals, key indicators, tangible value, etc. Showcasing this set of slides titled Key Indicator Cheat Sheet To Evaluate Business Event Return On Investment Template Pdf The topics addressed in these templates are Business Goal, Metric Category, Revenue KPIS All the content presented in this PPT design is completely editable. Download it and make adjustments in color, background, font etc. as per your unique business setting. The slide displays an indicator cheat sheet that assists event organisers and marketers in calculating event ROI so that they can understand the companys actual cost and return. The elements are the metrics used, i.e., hard metrics and soft metrics, business goals, key indicators, tangible value, etc.
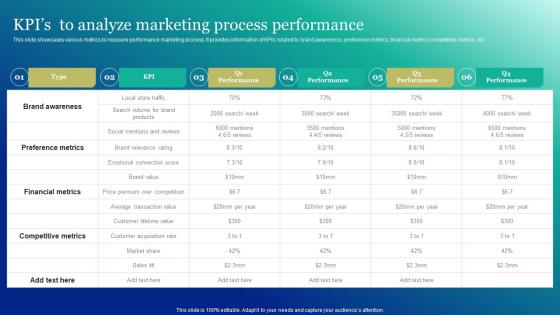
Kpis To Analyze Marketing Process Performance Marketing And Promotion Automation Graphics Pdf
This slide showcases various metrics to measure performance marketing process. It provides information of KPIs related to brand awareness, preference metrics, financial metrics competitive metrics, etc.This Kpis To Analyze Marketing Process Performance Marketing And Promotion Automation Graphics Pdf is perfect for any presentation, be it in front of clients or colleagues. It is a versatile and stylish solution for organizing your meetings. The Kpis To Analyze Marketing Process Performance Marketing And Promotion Automation Graphics Pdf features a modern design for your presentation meetings. The adjustable and customizable slides provide unlimited possibilities for acing up your presentation. Slidegeeks has done all the homework before launching the product for you. So, do not wait, grab the presentation templates today This slide showcases various metrics to measure performance marketing process. It provides information of KPIs related to brand awareness, preference metrics, financial metrics competitive metrics, etc.
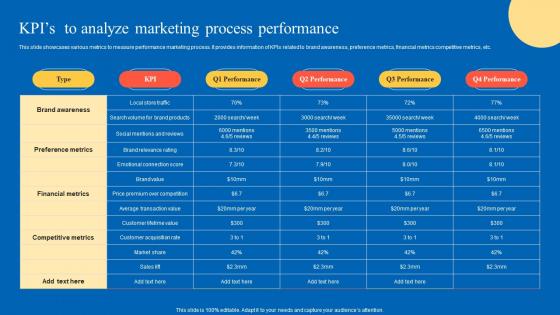
KPIs To Analyze Marketing Strategic Guide For Marketing Program Background Pdf
This slide showcases various metrics to measure performance marketing process. It provides information of KPIs related to brand awareness, preference metrics, financial metrics competitive metrics, etc. This KPIs To Analyze Marketing Strategic Guide For Marketing Program Background Pdf is perfect for any presentation, be it in front of clients or colleagues. It is a versatile and stylish solution for organizing your meetings. The KPIs To Analyze Marketing Strategic Guide For Marketing Program Background Pdf features a modern design for your presentation meetings. The adjustable and customizable slides provide unlimited possibilities for acing up your presentation. Slidegeeks has done all the homework before launching the product for you. So, do not wait, grab the presentation templates today This slide showcases various metrics to measure performance marketing process. It provides information of KPIs related to brand awareness, preference metrics, financial metrics competitive metrics, etc.
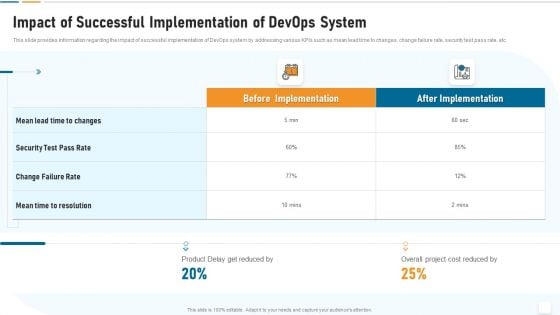
Strategic Development And Operations Execution IT Impact Of Successful Implementation Download PDF
This slide provides information regarding the impact of successful implementation of DevOps system by addressing various KPIs such as mean lead time to changes, change failure rate, security test pass rate, etc. Deliver and pitch your topic in the best possible manner with this strategic development and operations execution it impact of successful implementation download pdf. Use them to share invaluable insights on impact of successful implementation of devops system and impress your audience. This template can be altered and modified as per your expectations. So, grab it now.
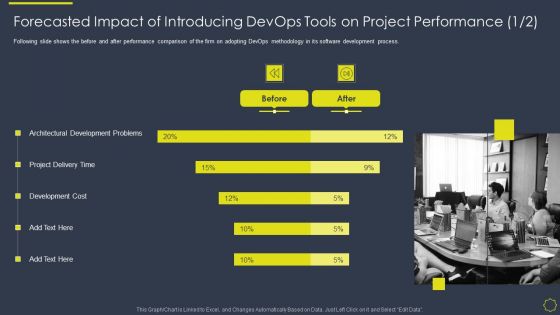
Implementing Development And Operations Platforms For In Time Product Launch IT Forecasted Impact Of Introducing Slides PDF
Following slide shows the before and after performance comparison of the firm on adopting DevOps methodology in its software development process. Deliver and pitch your topic in the best possible manner with this implementing development and operations platforms for in time product launch it forecasted impact of introducing slides pdf. Use them to share invaluable insights on development cost, development, project and impress your audience. This template can be altered and modified as per your expectations. So, grab it now.

E2E Quality Assurance And Testing In Developer Operations IT Impleme Environment Contd Microsoft PDF Graphics PDF
This slide provides information regarding implementing of quality assurance in DevOps environment in terms of quality assurance and operations collaboration, parallel testing. Presenting e2e quality assurance and testing in developer operations it impleme environment contd microsoft pdf graphics pdf to provide visual cues and insights. Share and navigate important information on two stages that need your due attention. This template can be used to pitch topics like merging of teams, performance and quality metrics, development collaboration In addtion, this PPT design contains high resolution images, graphics, etc, that are easily editable and available for immediate download.
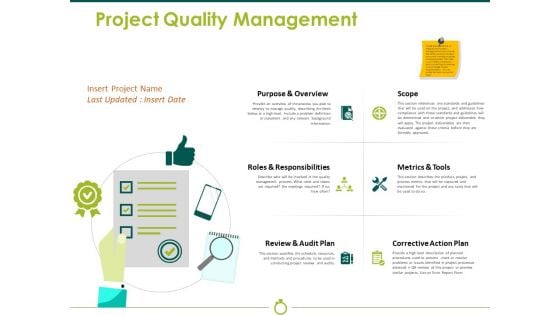
Project Quality Management Ppt PowerPoint Presentation Ideas Microsoft
This is a project quality management ppt powerpoint presentation ideas microsoft. This is a six stage process. The stages in this process are scope, metrics and tools, corrective action plan, review and audit plan, roles and responsibilities.
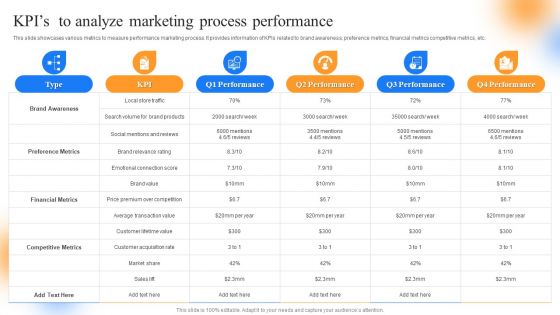
Strategic Guide To Perform Marketing Kpis To Analyze Marketing Process Performance Brochure PDF
This slide showcases various metrics to measure performance marketing process. It provides information of KPIs related to brand awareness, preference metrics, financial metrics competitive metrics, etc. Get a simple yet stunning designed Strategic Guide To Perform Marketing Kpis To Analyze Marketing Process Performance Brochure PDF. It is the best one to establish the tone in your meetings. It is an excellent way to make your presentations highly effective. So, download this PPT today from Slidegeeks and see the positive impacts. Our easy to edit Strategic Guide To Perform Marketing Kpis To Analyze Marketing Process Performance Brochure PDF can be your go to option for all upcoming conferences and meetings. So, what are you waiting for Grab this template today.
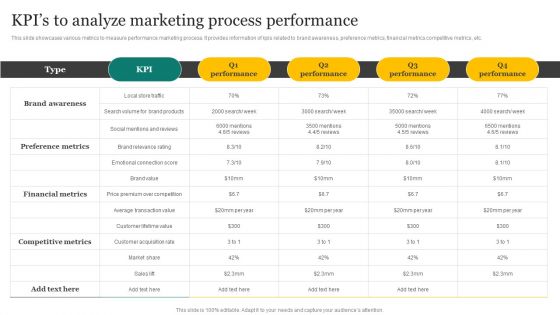
Strategic Promotion Plan Development Stages Kpis To Analyze Marketing Process Performance Guidelines PDF
This slide showcases various metrics to measure performance marketing process. It provides information of kpis related to brand awareness, preference metrics, financial metrics competitive metrics, etc. Get a simple yet stunning designed Strategic Promotion Plan Development Stages Kpis To Analyze Marketing Process Performance Guidelines PDF. It is the best one to establish the tone in your meetings. It is an excellent way to make your presentations highly effective. So, download this PPT today from Slidegeeks and see the positive impacts. Our easy to edit Strategic Promotion Plan Development Stages Kpis To Analyze Marketing Process Performance Guidelines PDF can be your go to option for all upcoming conferences and meetings. So, what are you waiting for Grab this template today.
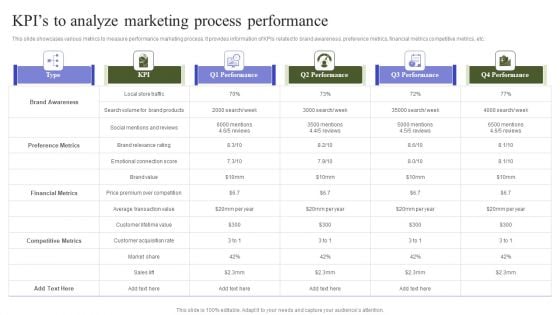
Marketing Mix Strategy Handbook Kpis To Analyze Marketing Process Performance Diagrams PDF
This slide showcases various metrics to measure performance marketing process. It provides information of KPIs related to brand awareness, preference metrics, financial metrics competitive metrics, etc. If you are looking for a format to display your unique thoughts, then the professionally designed Marketing Mix Strategy Handbook Kpis To Analyze Marketing Process Performance Diagrams PDF is the one for you. You can use it as a Google Slides template or a PowerPoint template. Incorporate impressive visuals, symbols, images, and other charts. Modify or reorganize the text boxes as you desire. Experiment with shade schemes and font pairings. Alter, share or cooperate with other people on your work. Download Marketing Mix Strategy Handbook Kpis To Analyze Marketing Process Performance Diagrams PDF and find out how to give a successful presentation. Present a perfect display to your team and make your presentation unforgettable.
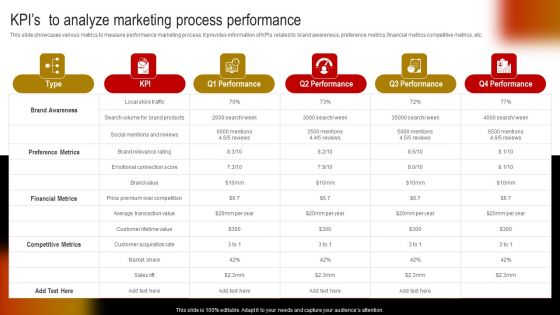
Comprehensive Guide To Build Marketing Strategy Kpis To Analyze Marketing Process Introduction PDF
This slide showcases various metrics to measure performance marketing process. It provides information of KPIs related to brand awareness, preference metrics, financial metrics competitive metrics, etc. This Comprehensive Guide To Build Marketing Strategy Kpis To Analyze Marketing Process Introduction PDF from Slidegeeks makes it easy to present information on your topic with precision. It provides customization options, so you can make changes to the colors, design, graphics, or any other component to create a unique layout. It is also available for immediate download, so you can begin using it right away. Slidegeeks has done good research to ensure that you have everything you need to make your presentation stand out. Make a name out there for a brilliant performance.
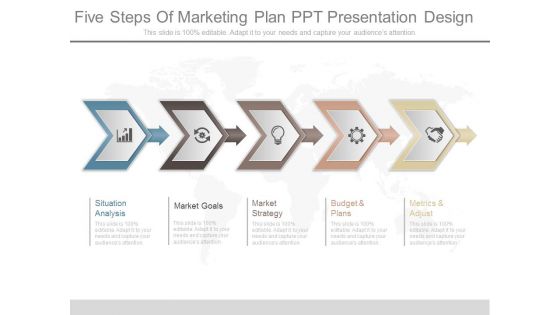
Five Steps Of Marketing Plan Ppt Presentation Design
This is a five steps of marketing plan ppt presentation design. This is a five stage process. The stages in this process are situation analysis, market goals, market strategy, budget and plans, metrics and adjust.\n\n
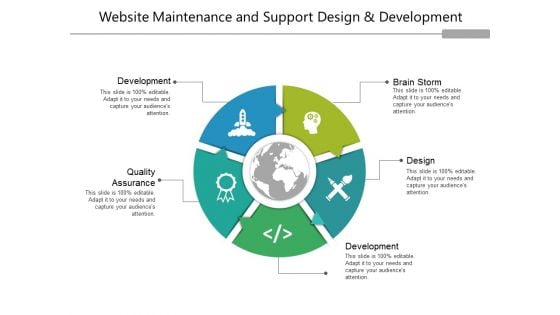
Website Maintenance And Support Design And Development Ppt PowerPoint Presentation Inspiration Outfit
This is a website maintenance and support design and development ppt powerpoint presentation inspiration outfit. This is a five stage process. The stages in this process are metrics icon, kpis icon, statistics icon.
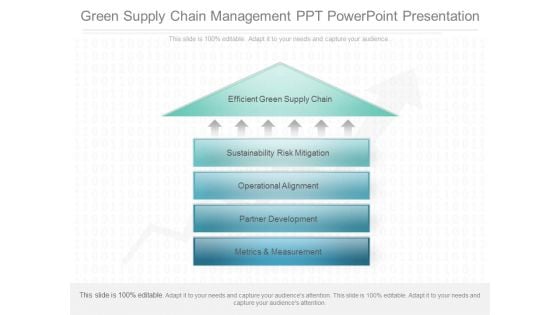
Green Supply Chain Management Ppt Powerpoint Presentation
This is a green supply chain management ppt powerpoint presentation. This is a five stage process. The stages in this process are efficient green supply chain, sustainability risk mitigation, operational alignment, partner development, metrics and measurement.\n\n\n

Before Vs After Implementing Tokenization In Data Security PPT Template
This slide showcases the comparative analysis of the before versus after tokenization. The purpose of this slide is to showcase the different performance metrics and how tokenization has improved these metrics. Find a pre-designed and impeccable Before Vs After Implementing Tokenization In Data Security PPT Template. The templates can ace your presentation without additional effort. You can download these easy-to-edit presentation templates to make your presentation stand out from others. So, what are you waiting for Download the template from Slidegeeks today and give a unique touch to your presentation. This slide showcases the comparative analysis of the before versus after tokenization. The purpose of this slide is to showcase the different performance metrics and how tokenization has improved these metrics.


 Continue with Email

 Home
Home


