Dna Icon
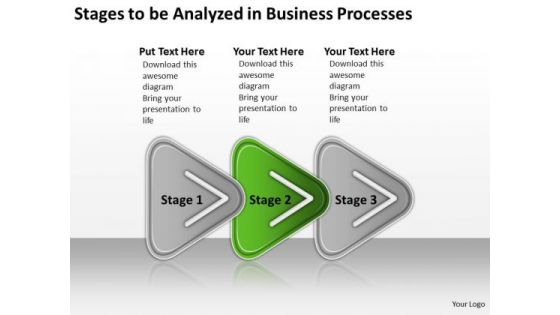
Analyzed In Business PowerPoint Theme Processes Written Plan Templates
We present our analyzed in business powerpoint theme processes written plan templates.Download our Arrows PowerPoint Templates because this template contains the material to highlight the key issues of your presentation. Download and present our Signs PowerPoint Templates because you can Take your team along by explaining your plans. Use our Shapes PowerPoint Templates because this is an amazing graphic to pin-point the manner and processes for them to follow in order to interconnect with each other. Download our Business PowerPoint Templates because this template helps you to grab the attention of your listeners. Download and present our Flow Charts PowerPoint Templates because they will Amplify your plans to have dedicated sub groups working on related but distinct tasks.Use these PowerPoint slides for presentations relating to advice, analysis, analyze, business, buyers, chart, competition, concept, customer, diagram, draw, economic, education, entrant, industrial, industry, management, model, plan, potential, potential entrants, presentation, showing, strategy, substitute, suppliers, technology. The prominent colors used in the PowerPoint template are Green, Gray, White. PowerPoint presentation experts tell us our analyzed in business powerpoint theme processes written plan templates are Fun. The feedback we get is that our chart PowerPoint templates and PPT Slides are Tranquil. We assure you our analyzed in business powerpoint theme processes written plan templates are Elegant. We assure you our customer PowerPoint templates and PPT Slides are Exuberant. You can be sure our analyzed in business powerpoint theme processes written plan templates are No-nonsense. The feedback we get is that our business PowerPoint templates and PPT Slides are readymade to fit into any presentation structure. Create your domain with our Analyzed In Business PowerPoint Theme Processes Written Plan Templates. Give your thoughts a distinct abode.
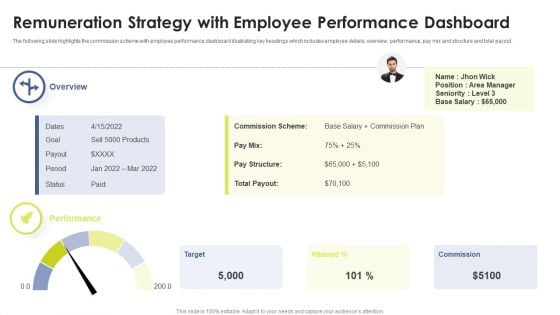
Remuneration Strategy With Employee Performance Dashboard Ppt Styles Themes PDF
The following slide highlights the commission scheme with employee performance dashboard illustrating key headings which includes employee details, overview, performance, pay mix and structure and total payout. Persuade your audience using this Remuneration Strategy With Employee Performance Dashboard Ppt Styles Themes PDF. This PPT design covers one stages, thus making it a great tool to use. It also caters to a variety of topics including Target, Attained, Commission. Download this PPT design now to present a convincing pitch that not only emphasizes the topic but also showcases your presentation skills.
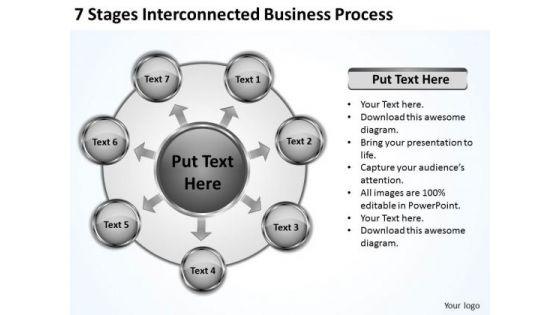
Business Strategy Consulting 7 Stages Interconnected Process Ppt PowerPoint
We present our business strategy consulting 7 stages interconnected process ppt Powerpoint.Download and present our Marketing PowerPoint Templates because You can Inspire your team with our PowerPoint Templates and Slides. Let the force of your ideas flow into their minds. Use our Business PowerPoint Templates because Your success is our commitment. Our PowerPoint Templates and Slides will ensure you reach your goal. Use our Arrows PowerPoint Templates because Our PowerPoint Templates and Slides will Activate the energies of your audience. Get their creative juices flowing with your words. Download our Circle Charts PowerPoint Templates because You can Be the star of the show with our PowerPoint Templates and Slides. Rock the stage with your ideas. Present our Shapes PowerPoint Templates because Our PowerPoint Templates and Slides will let you Illuminate the road ahead to Pinpoint the important landmarks along the way.Use these PowerPoint slides for presentations relating to 3d, Analysis, Brainstorming, Business, Chart, Circle, Circular, Classroom, Concept, Conference, Curving, Cycle, Design, Diagram, Direction, Element, Financial, Flow, Flowchart, Formula, Future, Goal, Graphic, Idea, Management, Market, Marketing, Mind, Mind Map, Motion, Movement, Organization, Organize, Plan, Presentation, Process, Product, Questions, Render, Solutions, Solve, Strategy, Success, Symbol, Target. The prominent colors used in the PowerPoint template are White, Gray, Black. You have fathereda great idea. Baptise it with our Business Strategy Consulting 7 Stages Interconnected Process Ppt PowerPoint.
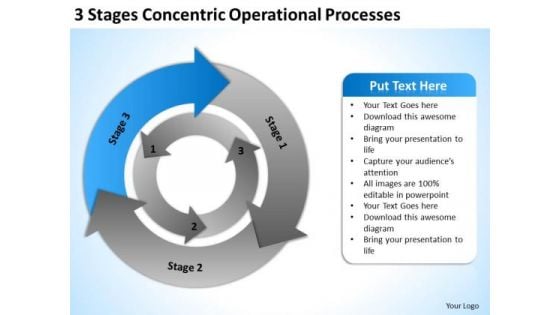
3 Stages Concentric Operational Processes Ppt Business Plan Downloads PowerPoint Templates
We present our 3 stages concentric operational processes ppt business plan downloads PowerPoint templates.Download our Finance PowerPoint Templates because You can Be the star of the show with our PowerPoint Templates and Slides. Rock the stage with your ideas. Download and present our Communication PowerPoint Templates because Our PowerPoint Templates and Slides will fulfill your every need. Use them and effectively satisfy the desires of your audience. Download our Arrows PowerPoint Templates because you should once Tap the ingenuity of our PowerPoint Templates and Slides. They are programmed to succeed. Use our Business PowerPoint Templates because Our PowerPoint Templates and Slides are a sure bet. Gauranteed to win against all odds. Use our Circle Charts PowerPoint Templates because Our PowerPoint Templates and Slides will provide you the cutting edge. Slice through the doubts in the minds of your listeners.Use these PowerPoint slides for presentations relating to Advertise, around, arrow, brand, business, chart, circle, collective, communication, concentric, concept, diagram, direction, financial, flow, flowchart, graphic element, grunge, loop, motion, movement, object, old, operation, organization, pie, presentation, process, production, relationship, repetitive, rotation, round, sequence, step, system, teamwork, wheel. The prominent colors used in the PowerPoint template are Blue, Gray, Black. Enact plans with our 3 Stages Concentric Operational Processes Ppt Business Plan Downloads PowerPoint Templates. Download without worries with our money back guaranteee.
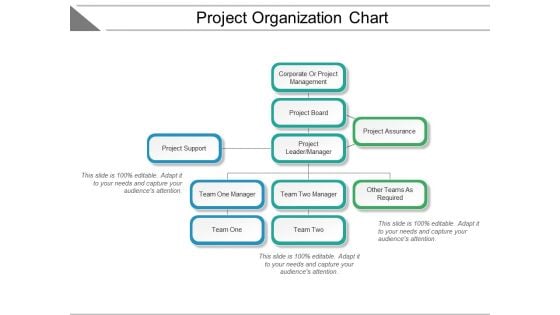
Project Organization Chart Ppt PowerPoint Presentation Summary Elements
This is a project organization chart ppt powerpoint presentation summary elements. This is a three stage process. The stages in this process are project governance, governance structure, project structure.
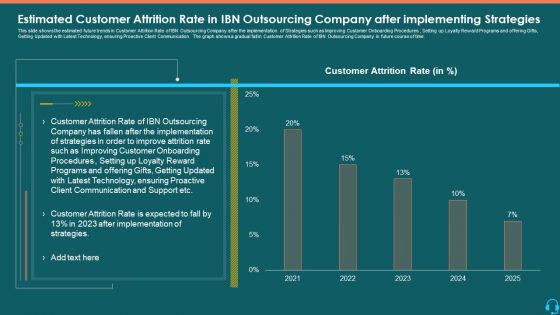
Estimated Customer Attrition Rate In IBN Outsourcing Company After Implementing Strategies Structure PDF
This slide shows the estimated future trends in Customer Attrition Rate of IBN Outsourcing Company after the implementation of Strategies such as Improving Customer Onboarding Procedures, Setting up Loyalty Reward Programs and offering Gifts, Getting Updated with Latest Technology, ensuring Proactive Client Communication. The graph shows a gradual fall in Customer Attrition Rate of IBN Outsourcing Company in future course of time. Deliver an awe-inspiring pitch with this creative estimated customer attrition rate in ibn outsourcing company after implementing strategies structure pdf bundle. Topics like customer attrition rate, client communication, technology, implementation, strategies can be discussed with this completely editable template. It is available for immediate download depending on the needs and requirements of the user.
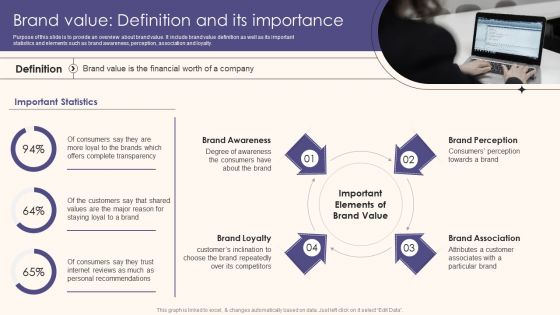
Brand Value Definition And Its Importance Guide To Understand Evaluate And Enhance Structure PDF
Purpose of this slide is to provide an overview about brand value. It include brand value definition as well as its important statistics and elements such as brand awareness, perception, association and loyalty.This Brand Value Definition And Its Importance Guide To Understand Evaluate And Enhance Structure PDF from Slidegeeks makes it easy to present information on your topic with precision. It provides customization options, so you can make changes to the colors, design, graphics, or any other component to create a unique layout. It is also available for immediate download, so you can begin using it right away. Slidegeeks has done good research to ensure that you have everything you need to make your presentation stand out. Make a name out there for a brilliant performance.
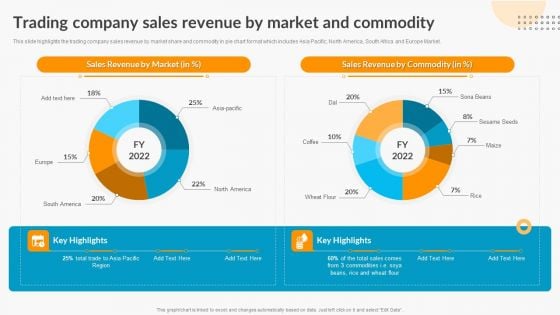
Trading Company Sales Revenue By Market And Commodity Export Trade Business Profile Structure PDF
This slide highlights the trading company history timeline which showcases company started business with African market to cater middle eastern region, then expand storage, food procurement and cold storage facility. This Trading Company Sales Revenue By Market And Commodity Export Trade Business Profile Structure PDF from Slidegeeks makes it easy to present information on your topic with precision. It provides customization options, so you can make changes to the colors, design, graphics, or any other component to create a unique layout. It is also available for immediate download, so you can begin using it right away. Slidegeeks has done good research to ensure that you have everything you need to make your presentation stand out. Make a name out there for a brilliant performance.
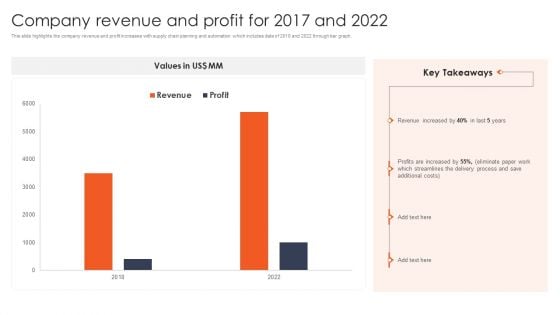
International Design And Architecture Firm Company Revenue And Profit For 2017 And 2022 Structure PDF
This slide highlights the company revenue and profit increases with supply chain planning and automation which includes data of 2018 and 2022 through bar graph. This modern and well-arranged International Design And Architecture Firm Company Revenue And Profit For 2017 And 2022 Structure PDF provides lots of creative possibilities. It is very simple to customize and edit with the Powerpoint Software. Just drag and drop your pictures into the shapes. All facets of this template can be edited with Powerpoint, no extra software is necessary. Add your own material, put your images in the places assigned for them, adjust the colors, and then you can show your slides to the world, with an animated slide included.
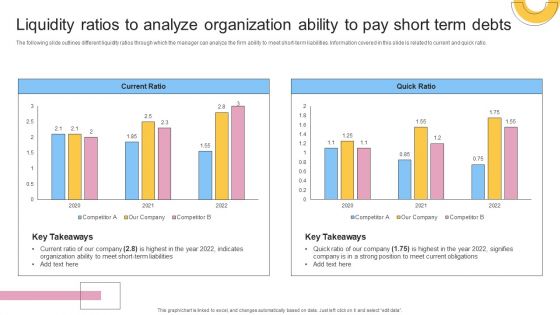
Liquidity Ratios To Analyze Organization Ability To Pay Short Term Debts Structure PDF
The following slide outlines different liquidity ratios through which the manager can analyze the firm ability to meet short term liabilities. Information covered in this slide is related to current and quick ratio. Present like a pro with Liquidity Ratios To Analyze Organization Ability To Pay Short Term Debts Structure PDF Create beautiful presentations together with your team, using our easy to use presentation slides. Share your ideas in real time and make changes on the fly by downloading our templates. So whether you are in the office, on the go, or in a remote location, you can stay in sync with your team and present your ideas with confidence. With Slidegeeks presentation got a whole lot easier. Grab these presentations today.
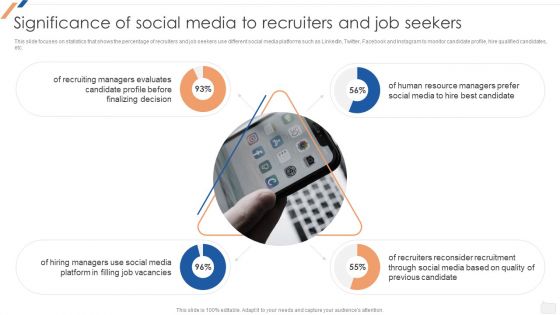
Significance Of Social Media To Recruiters And Job Seekers Enhancing Social Media Recruitment Process Structure PDF
This slide illustrates the recommendations for social media recruitment posts which includes advice-focused posts, involve executives, highlight perks and benefits and engage with network.This modern and well-arranged Significance Of Social Media To Recruiters And Job Seekers Enhancing Social Media Recruitment Process Structure PDF provides lots of creative possibilities. It is very simple to customize and edit with the Powerpoint Software. Just drag and drop your pictures into the shapes. All facets of this template can be edited with Powerpoint no extra software is necessary. Add your own material, put your images in the places assigned for them, adjust the colors, and then you can show your slides to the world, with an animated slide included.
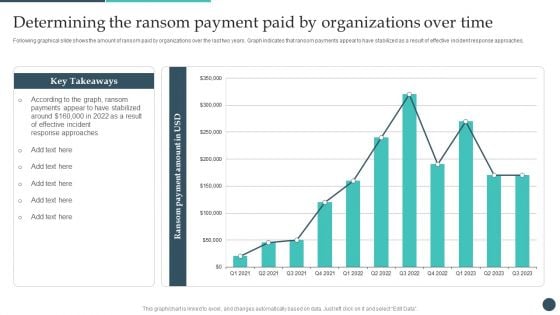
Safety Breach Response Playbook Determining The Ransom Payment Paid Structure PDF
Following graphical slide shows the amount of ransom paid by organizations over the last two years. Graph indicates that ransom payments appear to have stabilized as a result of effective incident response approaches. Slidegeeks is one of the best resources for PowerPoint templates. You can download easily and regulate Safety Breach Response Playbook Determining The Ransom Payment Paid Structure PDF for your personal presentations from our wonderful collection. A few clicks is all it takes to discover and get the most relevant and appropriate templates. Use our Templates to add a unique zing and appeal to your presentation and meetings. All the slides are easy to edit and you can use them even for advertisement purposes.
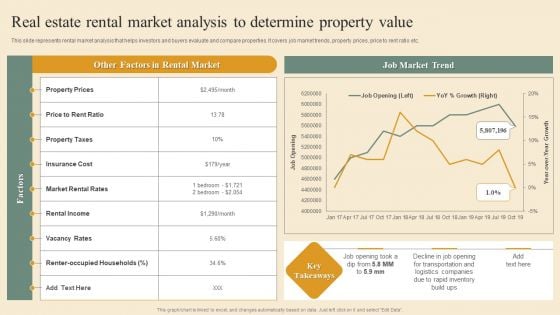
Deploying House Flipping Business Plan Real Estate Rental Market Analysis To Determine Property Value Structure PDF
This slide represents rental market analysis that helps investors and buyers evaluate and compare properties. It covers job market trends, property prices, price to rent ratio etc. Present like a pro with Deploying House Flipping Business Plan Real Estate Rental Market Analysis To Determine Property Value Structure PDF Create beautiful presentations together with your team, using our easy to use presentation slides. Share your ideas in real time and make changes on the fly by downloading our templates. So whether you are in the office, on the go, or in a remote location, you can stay in sync with your team and present your ideas with confidence. With Slidegeeks presentation got a whole lot easier. Grab these presentations today.
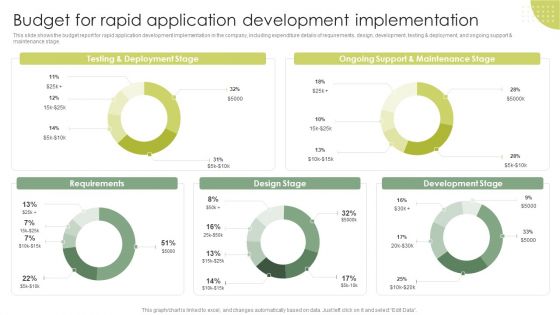
Budget For Rapid Application Development Implementation Rapid Application Building RAB Model Structure PDF
This slide shows the budget report for rapid application development implementation in the company, including expenditure details of requirements, design, development, testing and deployment, and ongoing support maintenance stage. Slidegeeks is one of the best resources for PowerPoint templates. You can download easily and regulate Budget For Rapid Application Development Implementation Rapid Application Building RAB Model Structure PDF for your personal presentations from our wonderful collection. A few clicks is all it takes to discover and get the most relevant and appropriate templates. Use our Templates to add a unique zing and appeal to your presentation and meetings. All the slides are easy to edit and you can use them even for advertisement purposes.
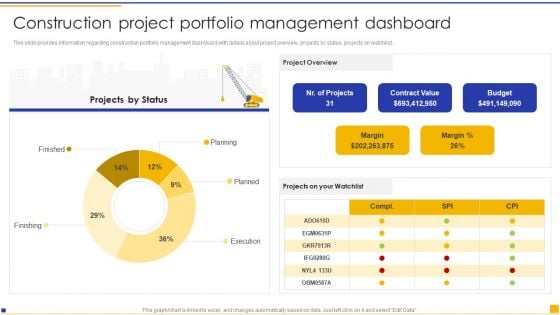
Construction Project Instructions Playbook Construction Project Portfolio Management Dashboard Structure PDF
This slide provides information regarding construction portfolio management dashboard with details about project overview, projects by status, projects on watchlist. Are you in need of a template that can accommodate all of your creative concepts This one is crafted professionally and can be altered to fit any style. Use it with Google Slides or PowerPoint. Include striking photographs, symbols, depictions, and other visuals. Fill, move around, or remove text boxes as desired. Test out color palettes and font mixtures. Edit and save your work, or work with colleagues. Download Construction Project Instructions Playbook Construction Project Portfolio Management Dashboard Structure PDF and observe how to make your presentation outstanding. Give an impeccable presentation to your group and make your presentation unforgettable.
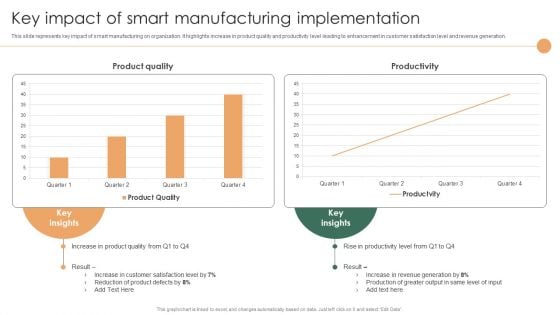
Smart Manufacturing Deployment Improve Production Procedures Key Impact Of Smart Manufacturing Implementation Structure PDF
This slide represents key impact of smart manufacturing on organization. It highlights increase in product quality and productivity level leading to enhancement in customer satisfaction level and revenue generation.Welcome to our selection of the Smart Manufacturing Deployment Improve Production Procedures Key Impact Of Smart Manufacturing Implementation Structure PDF. These are designed to help you showcase your creativity and bring your sphere to life. Planning and Innovation are essential for any business that is just starting out. This collection contains the designs that you need for your everyday presentations. All of our PowerPoints are 100 precent editable, so you can customize them to suit your needs. This multi-purpose template can be used in various situations. Grab these presentation templates today.

Electric Vehicle Sales Growth In California And The Us Global Automotive Manufacturing Market Analysis Structure PDF
This slide covers a graphical representation of EV sales in the United States and California. It also includes key insights about Californias 2022 Q1 sales in comparison to 2021 Q4, increased fuel costs and large super bowl EV ad, etc. Welcome to our selection of the Electric Vehicle Sales Growth In California And The Us Global Automotive Manufacturing Market Analysis Structure PDF. These are designed to help you showcase your creativity and bring your sphere to life. Planning and Innovation are essential for any business that is just starting out. This collection contains the designs that you need for your everyday presentations. All of our PowerPoints are 100 parcent editable, so you can customize them to suit your needs. This multi-purpose template can be used in various situations. Grab these presentation templates today.
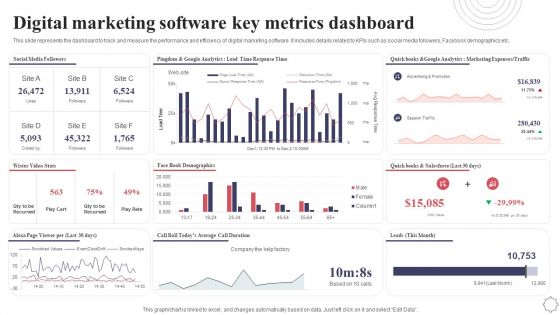
Digital Marketing Software Key Metrics Dashboard Application Deployment Project Plan Structure PDF
This slide represents the dashboard to track and measure the performance and efficiency of digital marketing software. It includes details related to KPIs such as social media followers, Facebook demographics etc. Slidegeeks is here to make your presentations a breeze with Digital Marketing Software Key Metrics Dashboard Application Deployment Project Plan Structure PDF With our easy to use and customizable templates, you can focus on delivering your ideas rather than worrying about formatting. With a variety of designs to choose from, you are sure to find one that suits your needs. And with animations and unique photos, illustrations, and fonts, you can make your presentation pop. So whether you are giving a sales pitch or presenting to the board, make sure to check out Slidegeeks first.
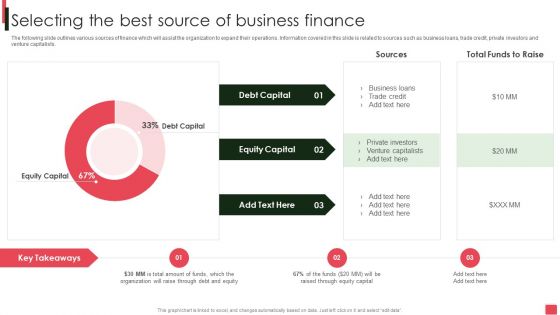
Overview Of Organizational Selecting The Best Source Of Business Finance Structure PDF
The following slide outlines various sources of finance which will assist the organization to expand their operations. Information covered in this slide is related to sources such as business loans, trade credit, private investors and venture capitalists. Slidegeeks has constructed Overview Of Organizational Selecting The Best Source Of Business Finance Structure PDF after conducting extensive research and examination. These presentation templates are constantly being generated and modified based on user preferences and critiques from editors. Here, you will find the most attractive templates for a range of purposes while taking into account ratings and remarks from users regarding the content. This is an excellent jumping-off point to explore our content and will give new users an insight into our top-notch PowerPoint Templates.
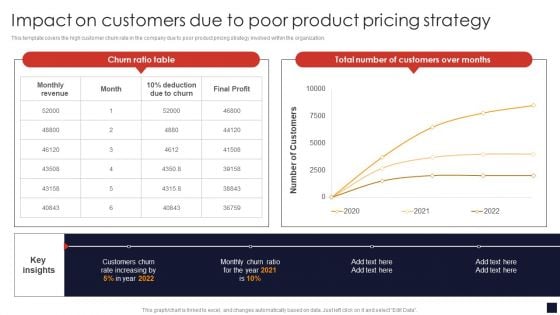
Impact On Customers Due To Poor Product Pricing Strategy Product Pricing Strategic Guide Structure PDF
This template covers the high customer churn rate in the company due to poor product pricing strategy involved within the organization.Slidegeeks is here to make your presentations a breeze with Impact On Customers Due To Poor Product Pricing Strategy Product Pricing Strategic Guide Structure PDF With our easy-to-use and customizable templates, you can focus on delivering your ideas rather than worrying about formatting. With a variety of designs to choose from, you are sure to find one that suits your needs. And with animations and unique photos, illustrations, and fonts, you can make your presentation pop. So whether you are giving a sales pitch or presenting to the board, make sure to check out Slidegeeks first.
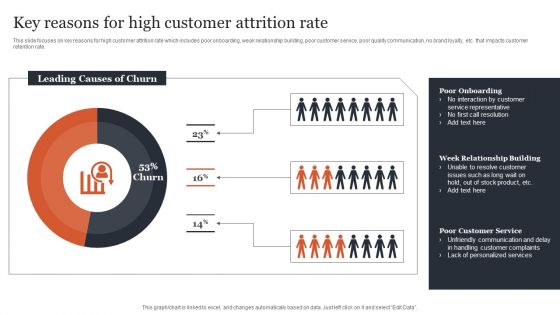
CRM Administration To Reduce Churn Rate Key Reasons For High Customer Attrition Rate Structure PDF
This slide focuses on key reasons for high customer attrition rate which includes poor onboarding, weak relationship building, poor customer service, poor quality communication, no brand loyalty, etc. that impacts customer retention rate. This modern and well arranged CRM Administration To Reduce Churn Rate Key Reasons For High Customer Attrition Rate Structure PDF provides lots of creative possibilities. It is very simple to customize and edit with the Powerpoint Software. Just drag and drop your pictures into the shapes. All facets of this template can be edited with Powerpoint no extra software is necessary. Add your own material, put your images in the places assigned for them, adjust the colors, and then you can show your slides to the world, with an animated slide included.
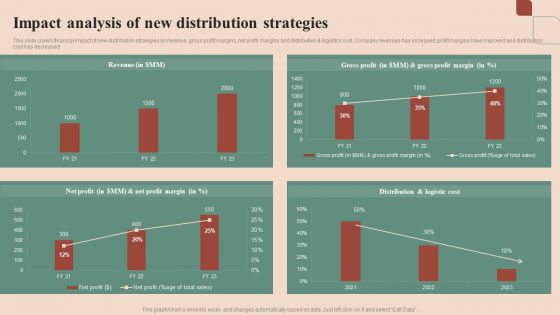
Maximizing Profit Returns With Right Distribution Source Impact Analysis Of New Distribution Strategies Structure PDF
This slide covers financial impact of new distribution strategies on revenue, gross profit margins, net profit margins and distribution and logistics cost. Company revenues has increased, profit margins have improved and distribution cost has decreased. This modern and well-arranged Maximizing Profit Returns With Right Distribution Source Impact Analysis Of New Distribution Strategies Structure PDF provides lots of creative possibilities. It is very simple to customize and edit with the Powerpoint Software. Just drag and drop your pictures into the shapes. All facets of this template can be edited with Powerpoint no extra software is necessary. Add your own material, put your images in the places assigned for them, adjust the colors, and then you can show your slides to the world, with an animated slide included.
Dashboard For Tracking Viral Posts Across Digital Channels Deploying Viral Marketing Strategies Structure PDF
This slide showcases dashboard which can help marketers track viral posts across multiple platforms. It provides details about viral views, seed views, direct, searh, referrer, network, Facebook, Twitter, etc. Welcome to our selection of the Dashboard For Tracking Viral Posts Across Digital Channels Deploying Viral Marketing Strategies Structure PDF. These are designed to help you showcase your creativity and bring your sphere to life. Planning and Innovation are essential for any business that is just starting out. This collection contains the designs that you need for your everyday presentations. All of our PowerPoints are 100 precent editable, so you can customize them to suit your needs. This multi-purpose template can be used in various situations. Grab these presentation templates today.
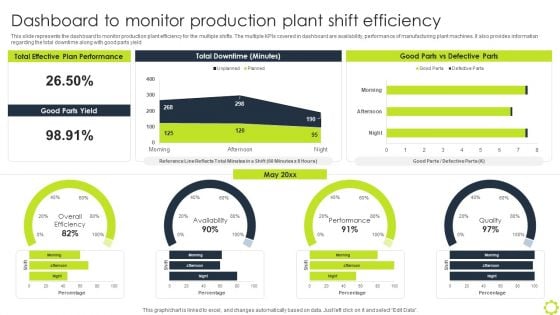
Machine Repairing And Servicing Dashboard To Monitor Production Plant Shift Structure PDF
This slide represents the dashboard to monitor production plant efficiency for the multiple shifts. The multiple KPIs covered in dashboard are availability, performance of manufacturing plant machines. It also provides information regarding the total downtime along with good parts yield. Slidegeeks is one of the best resources for PowerPoint templates. You can download easily and regulate Machine Repairing And Servicing Dashboard To Monitor Production Plant Shift Structure PDF for your personal presentations from our wonderful collection. A few clicks is all it takes to discover and get the most relevant and appropriate templates. Use our Templates to add a unique zing and appeal to your presentation and meetings. All the slides are easy to edit and you can use them even for advertisement purposes.
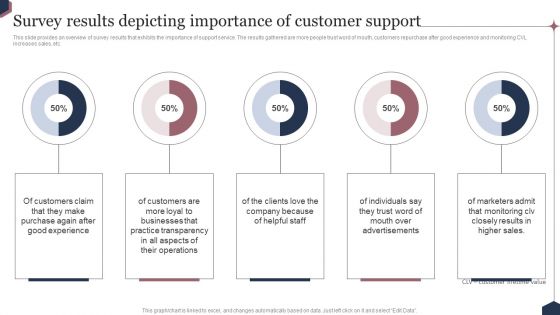
Enhance Customer Engagement Through After Sales Activities Survey Results Depicting Importance Structure PDF
This slide provides an overview of survey results that exhibits the importance of support service. The results gathered are more people trust word of mouth, customers repurchase after good experience and monitoring CVL increases sales, etc. Slidegeeks is one of the best resources for PowerPoint templates. You can download easily and regulate Enhance Customer Engagement Through After Sales Activities Survey Results Depicting Importance Structure PDF for your personal presentations from our wonderful collection. A few clicks is all it takes to discover and get the most relevant and appropriate templates. Use our Templates to add a unique zing and appeal to your presentation and meetings. All the slides are easy to edit and you can use them even for advertisement purposes.
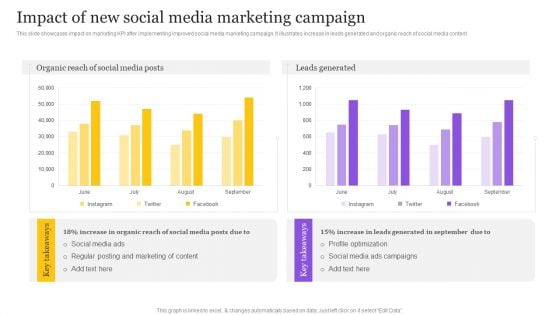
Digital Marketing Strategy Impact Of New Social Media Marketing Campaign Structure PDF
This slide showcases impact on marketing KPI after implementing improved social media marketing campaign. It illustrates increase in leads generated and organic reach of social media content. This Digital Marketing Strategy Impact Of New Social Media Marketing Campaign Structure PDF from Slidegeeks makes it easy to present information on your topic with precision. It provides customization options, so you can make changes to the colors, design, graphics, or any other component to create a unique layout. It is also available for immediate download, so you can begin using it right away. Slidegeeks has done good research to ensure that you have everything you need to make your presentation stand out. Make a name out there for a brilliant performance.
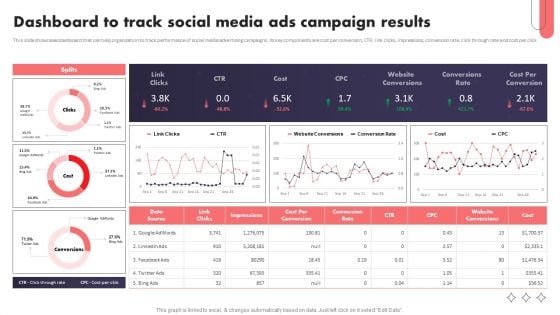
Social Media Promotional Technique Dashboard To Track Social Media Ads Campaign Structure PDF
This slide showcases dashboard that can help organization to track performance of social media advertising campaigns. Its key components are cost per conversion, CTR, link clicks, impressions, conversion rate, click through rate and cost per click. Slidegeeks is one of the best resources for PowerPoint templates. You can download easily and regulate Social Media Promotional Technique Dashboard To Track Social Media Ads Campaign Structure PDF for your personal presentations from our wonderful collection. A few clicks is all it takes to discover and get the most relevant and appropriate templates. Use our Templates to add a unique zing and appeal to your presentation and meetings. All the slides are easy to edit and you can use them even for advertisement purposes.
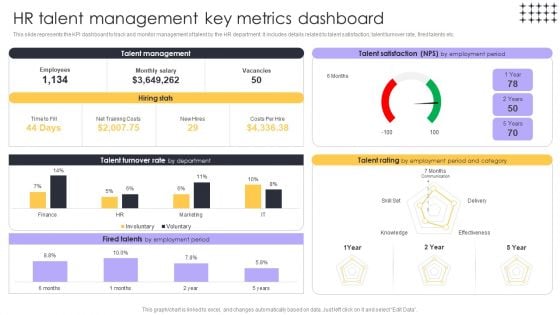
Tools For HR Business Analytics HR Talent Management Key Metrics Structure PDF
This slide represents the KPI dashboard to track and monitor management of talent by the HR department. It includes details related to talent satisfaction, talent turnover rate, fired talents etc. This modern and well-arranged Tools For HR Business Analytics HR Talent Management Key Metrics Structure PDF provides lots of creative possibilities. It is very simple to customize and edit with the Powerpoint Software. Just drag and drop your pictures into the shapes. All facets of this template can be edited with Powerpoint, no extra software is necessary. Add your own material, put your images in the places assigned for them, adjust the colors, and then you can show your slides to the world, with an animated slide included.
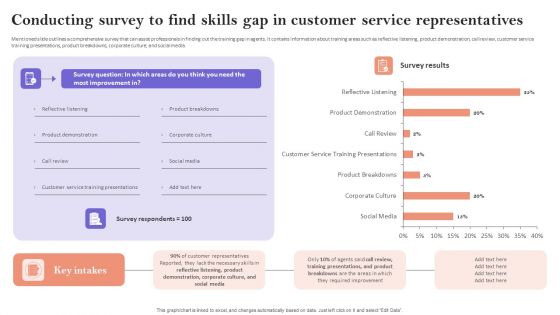
Conducting Survey To Find Skills Gap In Customer Service Representatives Structure PDF
Mentioned slide outlines a comprehensive survey that can assist professionals in finding out the training gap in agents. It contains information about training areas such as reflective listening, product demonstration, call review, customer service training presentations, product breakdowns, corporate culture, and social media. Present like a pro with Conducting Survey To Find Skills Gap In Customer Service Representatives Structure PDF Create beautiful presentations together with your team, using our easy to use presentation slides. Share your ideas in real time and make changes on the fly by downloading our templates. So whether you are in the office, on the go, or in a remote location, you can stay in sync with your team and present your ideas with confidence. With Slidegeeks presentation got a whole lot easier. Grab these presentations today.

Standard Approaches For Client Onboarding Journey Impact 2 Decreased Customer Structure PDF
This slide showcases the negative impact of customer onboarding challenges on the business. The challenges covered are decreased product adoption and customer response rate. This Standard Approaches For Client Onboarding Journey Impact 2 Decreased Customer Structure PDF from Slidegeeks makes it easy to present information on your topic with precision. It provides customization options, so you can make changes to the colors, design, graphics, or any other component to create a unique layout. It is also available for immediate download, so you can begin using it right away. Slidegeeks has done good research to ensure that you have everything you need to make your presentation stand out. Make a name out there for a brilliant performance.

Comprehensive Influencer Promotional Guide To Improve Brand Reputation Influencer Marketing Campaign Structure PDF
This slide represents the KPI dashboard to track and analyze the performance of influencer marketing campaign conducted by the organization. It includes details related to KPIs such as reads, unique clicks, reactions etc. Slidegeeks is one of the best resources for PowerPoint templates. You can download easily and regulate Comprehensive Influencer Promotional Guide To Improve Brand Reputation Influencer Marketing Campaign Structure PDF for your personal presentations from our wonderful collection. A few clicks is all it takes to discover and get the most relevant and appropriate templates. Use our Templates to add a unique zing and appeal to your presentation and meetings. All the slides are easy to edit and you can use them even for advertisement purposes.
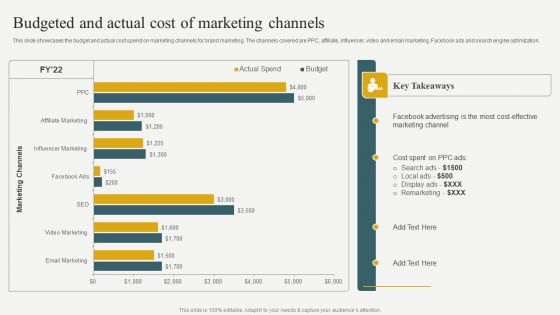
Evaluating Financial Position Of E Commerce Company Budgeted And Actual Cost Of Marketing Channels Structure PDF
This slide showcases the budget and actual cost spend on marketing channels for brand marketing. The channels covered are PPC, affiliate, influencer, video and email marketing, Facebook ads and search engine optimization. Boost your pitch with our creative Evaluating Financial Position Of E Commerce Company Budgeted And Actual Cost Of Marketing Channels Structure PDF. Deliver an awe-inspiring pitch that will mesmerize everyone. Using these presentation templates you will surely catch everyones attention. You can browse the ppts collection on our website. We have researchers who are experts at creating the right content for the templates. So you do not have to invest time in any additional work. Just grab the template now and use them.
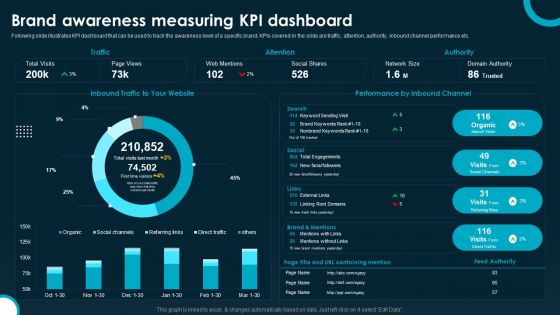
Creating And Implementing A Powerful Brand Leadership Strategy Brand Awareness Structure PDF
Following slide illustrates KPI dashboard that can be used to track the awareness level of a specific brand. KPIs covered in the slide are traffic, attention, authority, inbound channel performance etc. This Creating And Implementing A Powerful Brand Leadership Strategy Brand Awareness Structure PDF from Slidegeeks makes it easy to present information on your topic with precision. It provides customization options, so you can make changes to the colors, design, graphics, or any other component to create a unique layout. It is also available for immediate download, so you can begin using it right away. Slidegeeks has done good research to ensure that you have everything you need to make your presentation stand out. Make a name out there for a brilliant performance.
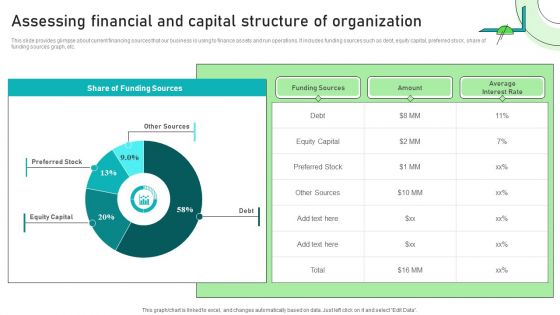
Adjusting Financial Strategies And Planning Assessing Financial And Capital Structure Of Organization Introduction PDF
This slide provides glimpse about current financing sources that our business is using to finance assets and run operations. It includes funding sources such as debt, equity capital, preferred stock, share of funding sources graph, etc. Coming up with a presentation necessitates that the majority of the effort goes into the content and the message you intend to convey. The visuals of a PowerPoint presentation can only be effective if it supplements and supports the story that is being told. Keeping this in mind our experts created Adjusting Financial Strategies And Planning Assessing Financial And Capital Structure Of Organization Introduction PDF to reduce the time that goes into designing the presentation. This way, you can concentrate on the message while our designers take care of providing you with the right template for the situation.
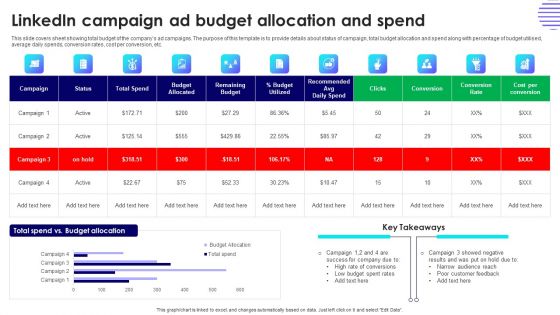
Effective Guide For Linkedin Promotion Strategies Linkedin Campaign Ad Budget Allocation And Spend Structure PDF
This slide covers sheet showing total budget of the companys ad campaigns. The purpose of this template is to provide details about status of campaign, total budget allocation and spend along with percentage of budget utilised, average daily spends, conversion rates, cost per conversion, etc. Slidegeeks is one of the best resources for PowerPoint templates. You can download easily and regulate Effective Guide For Linkedin Promotion Strategies Linkedin Campaign Ad Budget Allocation And Spend Structure PDF for your personal presentations from our wonderful collection. A few clicks is all it takes to discover and get the most relevant and appropriate templates. Use our Templates to add a unique zing and appeal to your presentation and meetings. All the slides are easy to edit and you can use them even for advertisement purposes.
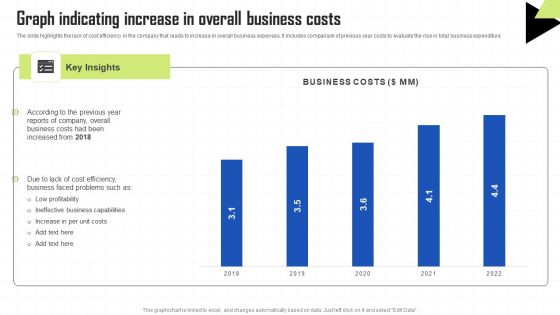
Key Techniques To Enhance Cost Efficiency Graph Indicating Increase In Overall Business Costs Structure PDF
The slide highlights the lack of cost efficiency in the company that leads to increase in overall business expenses. It includes comparison of previous year costs to evaluate the rise in total business expenditure Welcome to our selection of the Key Techniques To Enhance Cost Efficiency Graph Indicating Increase In Overall Business Costs Structure PDF. These are designed to help you showcase your creativity and bring your sphere to life. Planning and Innovation are essential for any business that is just starting out. This collection contains the designs that you need for your everyday presentations. All of our PowerPoints are 100 percent editable, so you can customize them to suit your needs. This multi purpose template can be used in various situations. Grab these presentation templates today.
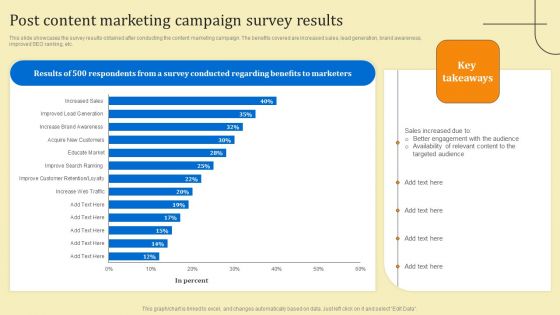
Business Sales Optimization Advertisement Campaign Post Content Marketing Campaign Survey Results Structure PDF
This slide showcases the survey results obtained after conducting the content marketing campaign. The benefits covered are increased sales, lead generation, brand awareness, improved SEO ranking, etc. Coming up with a presentation necessitates that the majority of the effort goes into the content and the message you intend to convey. The visuals of a PowerPoint presentation can only be effective if it supplements and supports the story that is being told. Keeping this in mind our experts created Business Sales Optimization Advertisement Campaign Post Content Marketing Campaign Survey Results Structure PDF to reduce the time that goes into designing the presentation. This way, you can concentrate on the message while our designers take care of providing you with the right template for the situation.
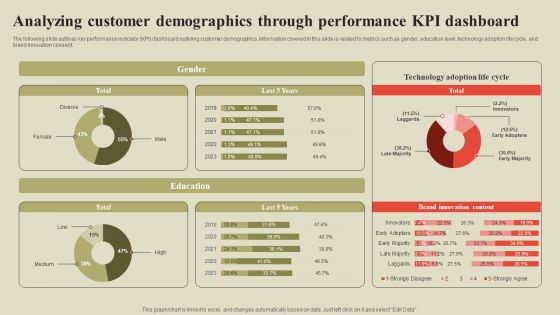
Steps To Effectively Conduct Market Research Analyzing Customer Demographics Through Performance Structure PDF
The following slide outlines key performance indicator KPI dashboard outlining customer demographics. Information covered in this slide is related to metrics such as gender, education level, technology adoption life cycle, and brand innovation consent. Slidegeeks is one of the best resources for PowerPoint templates. You can download easily and regulate Steps To Effectively Conduct Market Research Analyzing Customer Demographics Through Performance Structure PDF for your personal presentations from our wonderful collection. A few clicks is all it takes to discover and get the most relevant and appropriate templates. Use our Templates to add a unique zing and appeal to your presentation and meetings. All the slides are easy to edit and you can use them even for advertisement purposes.
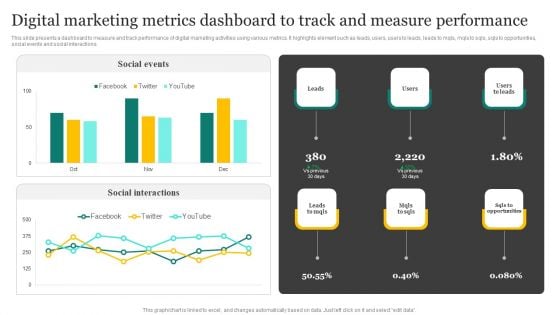
Strategic Promotion Plan Development Stages Digital Marketing Metrics Dashboard To Track Structure PDF
This slide presents a dashboard to measure and track performance of digital marketing activities using various metrics. It highlights element such as leads, users, users to leads, leads to mqls, mqls to sqls, sqls to opportunities, social events and social interactions. Are you in need of a template that can accommodate all of your creative concepts This one is crafted professionally and can be altered to fit any style. Use it with Google Slides or PowerPoint. Include striking photographs, symbols, depictions, and other visuals. Fill, move around, or remove text boxes as desired. Test out color palettes and font mixtures. Edit and save your work, or work with colleagues. Download Strategic Promotion Plan Development Stages Digital Marketing Metrics Dashboard To Track Structure PDF and observe how to make your presentation outstanding. Give an impeccable presentation to your group and make your presentation unforgettable.

Product Information Management System Business Benefits Of Effective PIM Solution Structure PDF
This slide represents the benefits of an effective solution which provides single place to collect, manage and enrich product information. It includes PIM benefits such as removes errors and mistakes etc. Slidegeeks is one of the best resources for PowerPoint templates. You can download easily and regulate Product Information Management System Business Benefits Of Effective PIM Solution Structure PDF for your personal presentations from our wonderful collection. A few clicks is all it takes to discover and get the most relevant and appropriate templates. Use our Templates to add a unique zing and appeal to your presentation and meetings. All the slides are easy to edit and you can use them even for advertisement purposes.
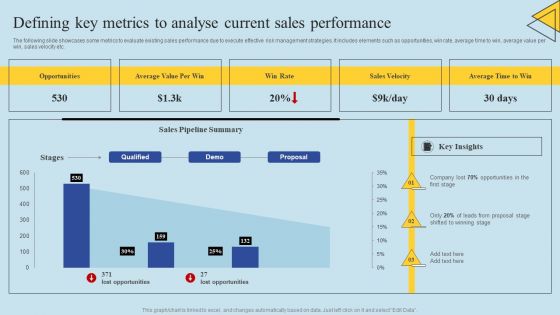
Determining Risks In Sales Administration Procedure Defining Key Metrics To Analyse Current Structure PDF
The following slide showcases some metrics to evaluate existing sales performance due to execute effective risk management strategies. It includes elements such as opportunities, win rate, average time to win, average value per win, sales velocity etc. Coming up with a presentation necessitates that the majority of the effort goes into the content and the message you intend to convey. The visuals of a PowerPoint presentation can only be effective if it supplements and supports the story that is being told. Keeping this in mind our experts created Determining Risks In Sales Administration Procedure Defining Key Metrics To Analyse Current Structure PDF to reduce the time that goes into designing the presentation. This way, you can concentrate on the message while our designers take care of providing you with the right template for the situation.
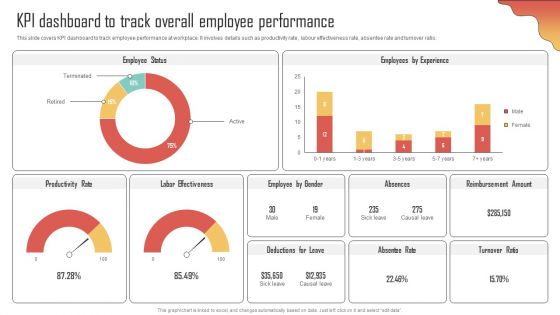
KPI Dashboard To Track Overall Employee Performance Enhancing Organization Productivity By Implementing Structure PDF
This slide covers KPI dashboard to track employee performance at workplace. It involves details such as productivity rate, labour effectiveness rate, absentee rate and turnover ratio. Are you in need of a template that can accommodate all of your creative concepts This one is crafted professionally and can be altered to fit any style. Use it with Google Slides or PowerPoint. Include striking photographs, symbols, depictions, and other visuals. Fill, move around, or remove text boxes as desired. Test out color palettes and font mixtures. Edit and save your work, or work with colleagues. Download KPI Dashboard To Track Overall Employee Performance Enhancing Organization Productivity By Implementing Structure PDF and observe how to make your presentation outstanding. Give an impeccable presentation to your group and make your presentation unforgettable.
Predictive Analytics Methods Predictive Analytics Model Performance Tracking Dashboard Structure PDF
This slide represents the predictive analytics model performance tracking dashboard, and it covers the details of total visitors, total buyers, total products added to the cart, filters by date and category, visitors to clients conversion rate, and so on. Want to ace your presentation in front of a live audience Our Predictive Analytics Methods Predictive Analytics Model Performance Tracking Dashboard Structure PDF can help you do that by engaging all the users towards you. Slidegeeks experts have put their efforts and expertise into creating these impeccable powerpoint presentations so that you can communicate your ideas clearly. Moreover, all the templates are customizable, and easy to edit and downloadable. Use these for both personal and commercial use.
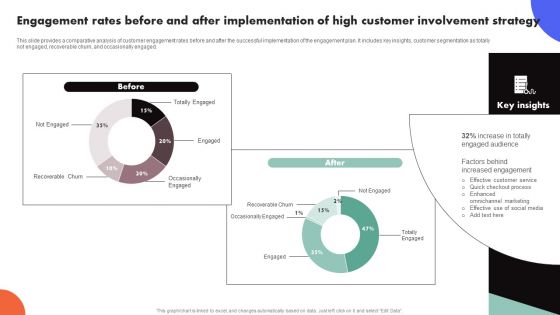
Improving Buyer Journey Through Strategic Customer Engagement Engagement Rates Before After Implementation Structure PDF
This slide provides a comparative analysis of customer engagement rates before and after the successful implementation of the engagement plan. It includes key insights, customer segmentation as totally engaged, engaged, not engaged, recoverable churn, and occasionally engaged. Coming up with a presentation necessitates that the majority of the effort goes into the content and the message you intend to convey. The visuals of a PowerPoint presentation can only be effective if it supplements and supports the story that is being told. Keeping this in mind our experts created Improving Buyer Journey Through Strategic Customer Engagement Engagement Rates Before After Implementation Structure PDF to reduce the time that goes into designing the presentation. This way, you can concentrate on the message while our designers take care of providing you with the right template for the situation.
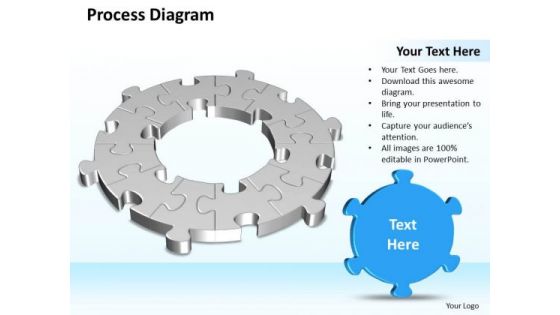
Ppt 3d Circular Puzzle Piece Process Diagram Business Power Point Stage PowerPoint Templates
PPT 3d circular puzzle piece process diagram Business power point stage PowerPoint Templates-This PowerPoint Diagram shows Interconnected puzzles arranged in circular manner from which center one is missing. It signifies business, buying, clearance, closeout, commerce, consuming, deal, enterprise, marketing, negotiation, purchase.-PPT 3d circular puzzle piece process diagram Business power point stage PowerPoint Templates Coach your organization with our Ppt 3d Circular Puzzle Piece Process Diagram Business Power Point Stage PowerPoint Templates. You will come out on top.
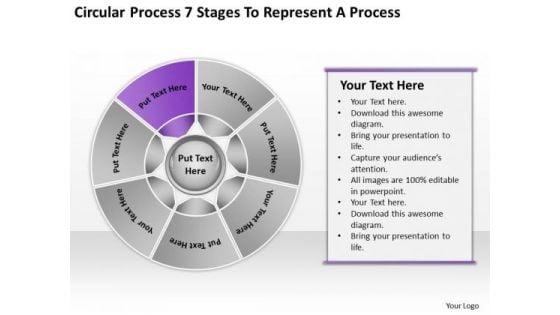
Process 7 Stages To Represent Business Plan Template PowerPoint Slides
We present our process 7 stages to represent business plan template PowerPoint Slides.Download our Process and Flows PowerPoint Templates because Our PowerPoint Templates and Slides will steer your racing mind. Hit the right buttons and spur on your audience. Use our Business PowerPoint Templates because Our PowerPoint Templates and Slides help you pinpoint your timelines. Highlight the reasons for your deadlines with their use. Download and present our Flow Charts PowerPoint Templates because you can Add colour to your speech with our PowerPoint Templates and Slides. Your presentation will leave your audience speechless. Present our Shapes PowerPoint Templates because Our PowerPoint Templates and Slides help you meet the demand of the Market. Just browse and pick the slides that appeal to your intuitive senses. Download our Circle Charts PowerPoint Templates because You can Double your output with our PowerPoint Templates and Slides. They make beating deadlines a piece of cake.Use these PowerPoint slides for presentations relating to Chart, pentagram, business, concept, website, speech, form, green, special, corporate, order, red, vector, sign, bright, symbol, template, star, usable, graphic,process, element, different, idea, shape, creative, illustration, piece, connection, strategy, place, web, solution, design, group, empty, banner, access, part, background, conceptual . The prominent colors used in the PowerPoint template are Purple, Gray, White. Increase the output of your factory. Explore avenues available with our Process 7 Stages To Represent Business Plan Template PowerPoint Slides.
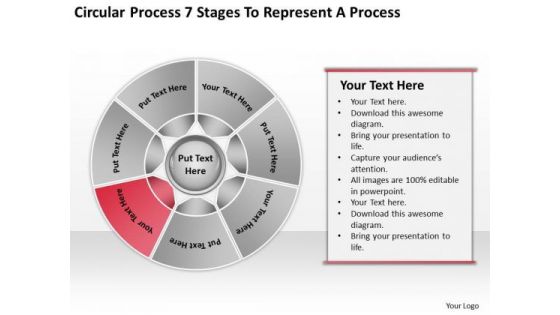
Process 7 Stages To Represent Creating Business Plan PowerPoint Slides
We present our process 7 stages to represent creating business plan PowerPoint Slides.Download and present our Process and Flows PowerPoint Templates because Our PowerPoint Templates and Slides will provide you a launch platform. Give a lift off to your ideas and send them into orbit. Download our Business PowerPoint Templates because Our PowerPoint Templates and Slides ensures Effective communication. They help you put across your views with precision and clarity. Download our Flow Charts PowerPoint Templates because Our PowerPoint Templates and Slides will let you Hit the target. Go the full distance with ease and elan. Present our Shapes PowerPoint Templates because Our PowerPoint Templates and Slides will fulfill your every need. Use them and effectively satisfy the desires of your audience. Download and present our Circle Charts PowerPoint Templates because you should once Tap the ingenuity of our PowerPoint Templates and Slides. They are programmed to succeed.Use these PowerPoint slides for presentations relating to Chart, pentagram, business, concept, website, speech, form, green, special, corporate, order, red, vector, sign, bright, symbol, template, star, usable, graphic,process, element, different, idea, shape, creative, illustration, piece, connection, strategy, place, web, solution, design, group, empty, banner, access, part, background, conceptual . The prominent colors used in the PowerPoint template are Red, Gray, White. Become the crowd favourite with our Process 7 Stages To Represent Creating Business Plan PowerPoint Slides. Get them all clamouring for you.
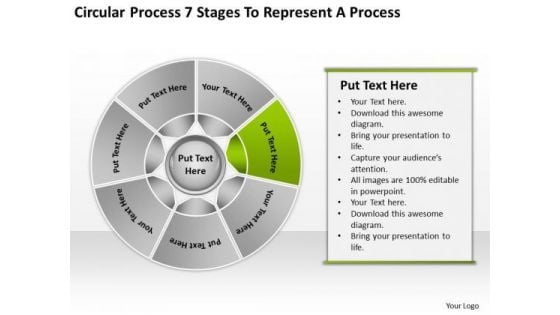
Process 7 Stages To Represent Sample Business Plan Template PowerPoint Templates
We present our process 7 stages to represent sample business plan template PowerPoint templates.Download our Process and Flows PowerPoint Templates because Our PowerPoint Templates and Slides will let you Hit the target. Go the full distance with ease and elan. Present our Business PowerPoint Templates because It can Conjure up grand ideas with our magical PowerPoint Templates and Slides. Leave everyone awestruck by the end of your presentation. Download our Flow Charts PowerPoint Templates because Our PowerPoint Templates and Slides will give good value for money. They also have respect for the value of your time. Use our Shapes PowerPoint Templates because Our PowerPoint Templates and Slides are conceived by a dedicated team. Use them and give form to your wondrous ideas. Download our Circle Charts PowerPoint Templates because you can Break through with our PowerPoint Templates and Slides. Bring down the mental barriers of your audience.Use these PowerPoint slides for presentations relating to Chart, pentagram, business, concept, website, speech, form, green, special, corporate, order, red, vector, sign, bright, symbol, template, star, usable, graphic,process, element, different, idea, shape, creative, illustration, piece, connection, strategy, place, web, solution, design, group, empty, banner, access, part, background, conceptual . The prominent colors used in the PowerPoint template are Green, Gray, White. Transform your organization with our Process 7 Stages To Represent Sample Business Plan Template PowerPoint Templates. Download without worries with our money back guaranteee.
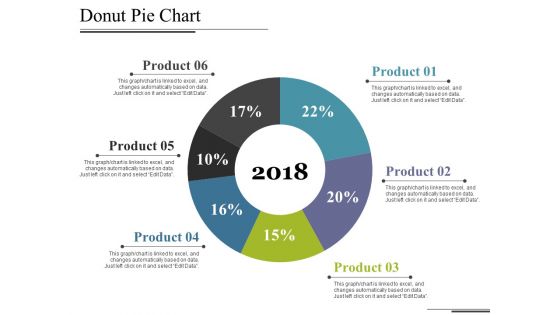
Donut Pie Chart Ppt PowerPoint Presentation Show Grid
This is a donut pie chart ppt powerpoint presentation show grid. This is a six stage process. The stages in this process are chart, years, percentage, business, management.
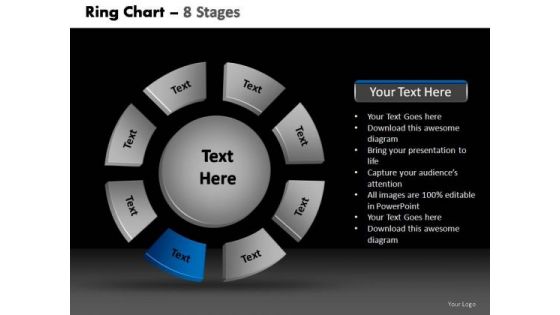
PowerPoint Layouts Chart Donut With Core Ppt Design
PowerPoint Layouts Chart Donut with Core PPT Design-These amazing PowerPoint pre-designed slides and PowerPoint templates have been carefully created by our team of experts to help you impress your audience. Our stunning collection of Powerpoint slides are 100% editable and can easily fit in any PowerPoint presentations. By using these animations and graphics in PowerPoint and you can easily make professional presentations. Any text can be entered at any point in the PowerPoint template or slide. Just DOWNLOAD our awesome PowerPoint templates and you are ready to go. Our designs are a colossal help. Maximize your gains with our PowerPoint Layouts Chart Donut With Core Ppt Design. Dont pass up this opportunity to shine.
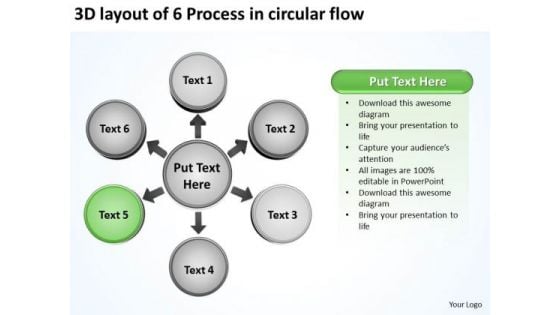
3d Layout Of 6 Process In Circular Flow Ppt Chart PowerPoint Templates
We present our 3d layout of 6 process in circular flow ppt Chart PowerPoint templates.Download and present our Circle Charts PowerPoint Templates because educate your staff on the means to provide the required support for speedy recovery. Use our Process and Flows PowerPoint Templates because our PowerPoint templates designed for your ideas to sell. Download and present our Success PowerPoint Templates because your quest has taken you well onto the path of success. Download and present our Business PowerPoint Templates because The foundation of the structure of your business is resilient and dependable. Convey this confidence to your colleagues and assure them of a great and enduring future. Present our Marketing PowerPoint Templates because educate your staff on the means to provide the required support for speedy recovery.Use these PowerPoint slides for presentations relating to Access, arrow, background, blue, bright, business, chart,circle, color, colorful, concept,conceptual, connection, corporate,creative, cycle, design, different, element,empty, flower, form, frame, graphic,green, group, idea, illustration, match,message, order, part, piece, place,process, red, shape, solution, special,speech, strategy, symbol. The prominent colors used in the PowerPoint template are Green dark , Gray, Black. The feedback we get is that our 3d layout of 6 process in circular flow ppt Chart PowerPoint templates are Amazing. The feedback we get is that our background PowerPoint templates and PPT Slides are Fashionable. Presenters tell us our 3d layout of 6 process in circular flow ppt Chart PowerPoint templates are Upbeat. The feedback we get is that our blue PowerPoint templates and PPT Slides are Stylish. PowerPoint presentation experts tell us our 3d layout of 6 process in circular flow ppt Chart PowerPoint templates are readymade to fit into any presentation structure. Customers tell us our background PowerPoint templates and PPT Slides are Clever. Collect feedback with our 3d Layout Of 6 Process In Circular Flow Ppt Chart PowerPoint Templates. Download without worries with our money back guaranteee.
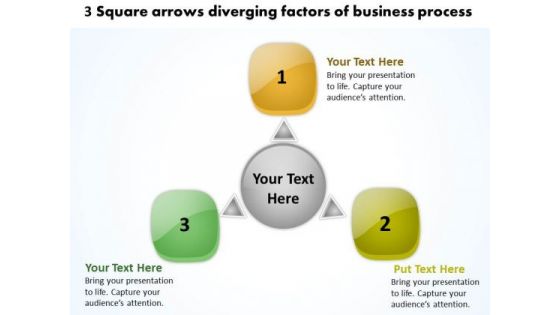
3 Square Arrows Diverging Factors Of Business Process Cycle Chart PowerPoint Templates
We present our 3 square arrows diverging factors of business process Cycle Chart PowerPoint templates.Present our Business PowerPoint Templates because you have churned your mind and come upwith solutions. Use our Boxes PowerPoint Templates because it helps you to satiate the brains of your team with a taste of the final product. Use our Arrows PowerPoint Templates because this diagram helps to reaffirm to your team your faith in maintaining the highest ethical standards. Use our Circle Charts PowerPoint Templates because it helps to anticipate the doubts and questions in the minds of your colleagues and enlighten them with your inspired strategy to garner desired success. Use our Flow Charts PowerPoint Templates because this diagram is designed to help your audience to develop their thoughts along the way.Use these PowerPoint slides for presentations relating to abstract, arrow, backdrop, background, banner, blank, blue, box, bright, brochure, business, chart, circle, color, colorful, concept, cube, description, design, diagram, element, empty, flyer, form, frame, graphic, illustration, item, management, marketing, message, modern, network, pink, place, presentation, purple, red, shape, sign, site, square, style, symbol, template, text, vector, web, website, yellow. The prominent colors used in the PowerPoint template are Yellow, Green lime , Green. Presenters tell us our 3 square arrows diverging factors of business process Cycle Chart PowerPoint templates are Whimsical. You can be sure our box PowerPoint templates and PPT Slides are Flirty. Professionals tell us our 3 square arrows diverging factors of business process Cycle Chart PowerPoint templates are Tasteful. People tell us our bright PowerPoint templates and PPT Slides are Fantastic. People tell us our 3 square arrows diverging factors of business process Cycle Chart PowerPoint templates are Wonderful. Professionals tell us our blank PowerPoint templates and PPT Slides are Tasteful. Create the appetite with our 3 Square Arrows Diverging Factors Of Business Process Cycle Chart PowerPoint Templates. Entice them with your thoughts.
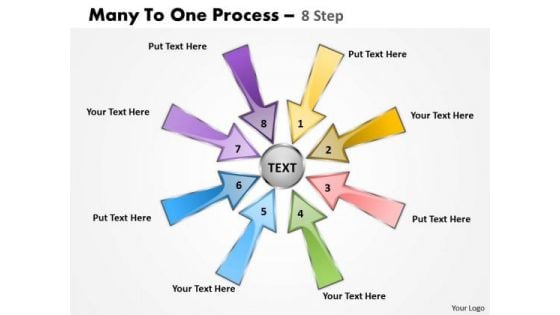
Sales Diagram Many To One Process 8 Business Cycle Diagram
Establish The Dominance Of Your Ideas. Our Mba Models And Frameworks Circle Process 8 Step Strategy Diagram Powerpoint Templates Will Put Them On Top.
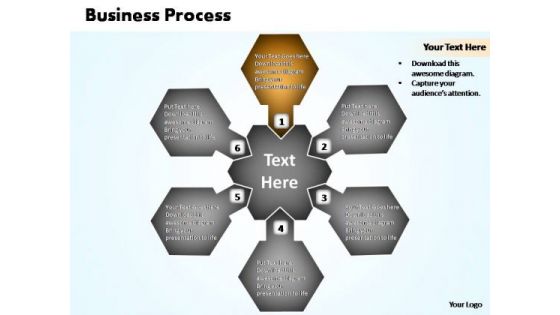
PowerPoint Backgrounds Sales Business Process Chart Ppt Slide Designs
PowerPoint Backgrounds Sales Business Process Chart PPT Slide Designs-Highlight the key components of your entire manufacturing/ business process. Illustrate how each element flows seamlessly onto the next stage. Emphasise on any critical or key factors within them. Demonstrate how they all combine to form the final product.-PowerPoint Backgrounds Sales Business Process Chart PPT Slide Designs Face the storm with our PowerPoint Backgrounds Sales Business Process Chart Ppt Slide Designs. Just download, type and present.
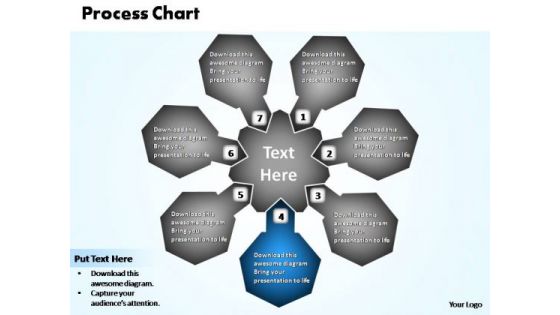
PowerPoint Design Graphic Business Process Chart Ppt Designs
PowerPoint Design Graphic Business Process Chart PPT Designs-Highlight the key components of your entire manufacturing/ business process. Illustrate how each element flows seamlessly onto the next stage. Emphasise on any critical or key factors within them. Demonstrate how they all combine to form the final product.-PowerPoint Design Graphic Business Process Chart PPT Designs Our PowerPoint Design Graphic Business Process Chart Ppt Designs team are great exponents of visual art. They have created some beauties for you.
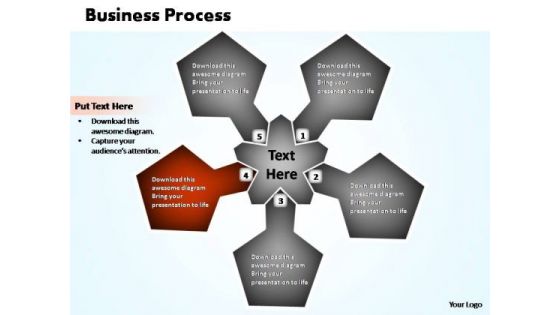
PowerPoint Slide Designs Graphic Business Process Chart Ppt Slide
PowerPoint Slide Designs Graphic Business Process Chart PPT Slide-Highlight the key components of your entire manufacturing/ business process. Illustrate how each element flows seamlessly onto the next stage. Emphasise on any critical or key factors within them. Demonstrate how they all combine to form the final product.-PowerPoint Slide Designs Graphic Business Process Chart PPT Slide Dive into the deep end with our PowerPoint Slide Designs Graphic Business Process Chart Ppt Slide. They assist you in staying afloat.
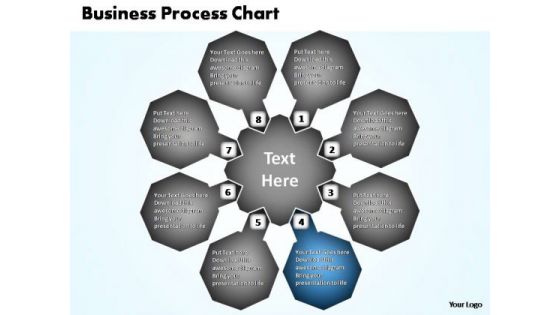
PowerPoint Template Global Business Process Chart Ppt Template
PowerPoint Template Global Business Process Chart PPT Template-Highlight the key components of your entire manufacturing/ business process. Illustrate how each element flows seamlessly onto the next stage. Emphasise on any critical or key factors within them. Demonstrate how they all combine to form the final product.-PowerPoint Template Global Business Process Chart PPT Template Make the boring bubbly with our PowerPoint Template Global Business Process Chart Ppt Template. Your thoughts will get them all agog and buzzing.
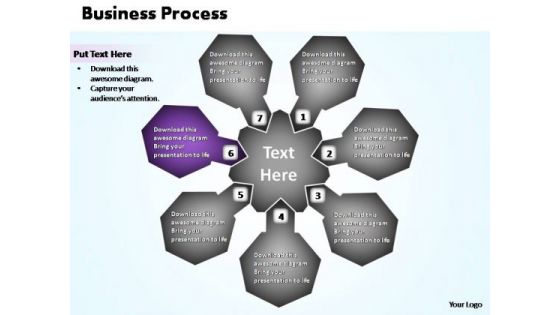
PowerPoint Backgrounds Leadership Business Process Chart Ppt Presentation
PowerPoint Backgrounds Leadership Business Process Chart PPT Presentation-Highlight the key components of your entire manufacturing/ business process. Illustrate how each element flows seamlessly onto the next stage. Emphasise on any critical or key factors within them. Demonstrate how they all combine to form the final product.-PowerPoint Backgrounds Leadership Business Process Chart PPT Presentation Arm yourself with our PowerPoint Backgrounds Leadership Business Process Chart Ppt Presentation. Carry your thoughts safely across.
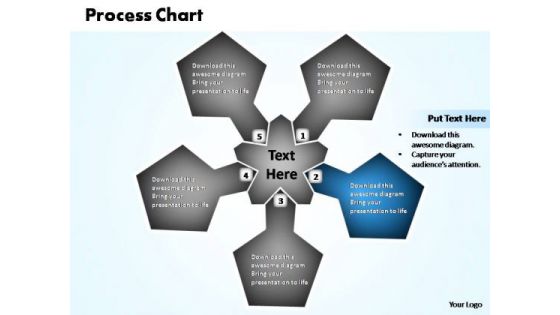
PowerPoint Design Download Business Process Chart Ppt Designs
PowerPoint Design Download Business Process Chart PPT Designs-Highlight the key components of your entire manufacturing/ business process. Illustrate how each element flows seamlessly onto the next stage. Emphasise on any critical or key factors within them. Demonstrate how they all combine to form the final product.-PowerPoint Design Download Business Process Chart PPT Designs Our PowerPoint Design Download Business Process Chart Ppt Designs are far from fictional. They are ardent admirers of actual facts.
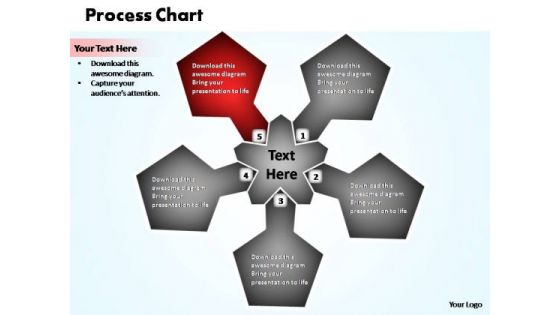
PowerPoint Presentation Leadership Business Process Chart Ppt Designs
PowerPoint Presentation Leadership Business Process Chart PPT Designs-Highlight the key components of your entire manufacturing/ business process. Illustrate how each element flows seamlessly onto the next stage. Emphasise on any critical or key factors within them. Demonstrate how they all combine to form the final product.-PowerPoint Presentation Leadership Business Process Chart PPT Designs Our PowerPoint Presentation Leadership Business Process Chart Ppt Designs help you think on your feet. They provide you with ready answers.

 Home
Home