Economics Template
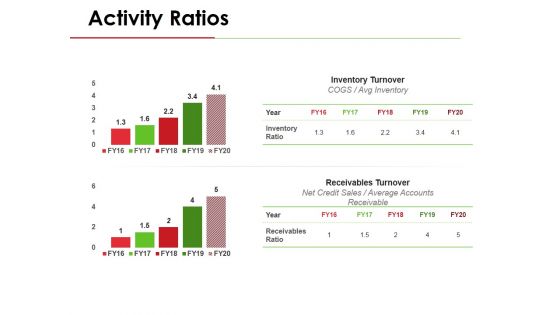
Activity Ratios Template 1 Ppt PowerPoint Presentation Pictures Graphics Example
This is a activity ratios template 1 ppt powerpoint presentation pictures graphics example. This is a two stage process. The stages in this process are inventory turnover, receivables turnover, avg inventory, net credit sales, average accounts receivable.
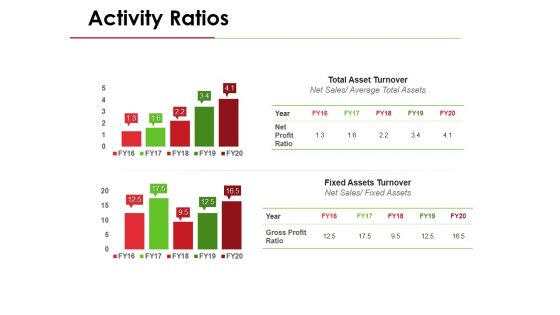
Activity Ratios Template 3 Ppt PowerPoint Presentation Inspiration Example File
This is a activity ratios template 3 ppt powerpoint presentation inspiration example file. This is a two stage process. The stages in this process are total asset turnover, net sales, average total assets, fixed assets turnover, fixed assets.
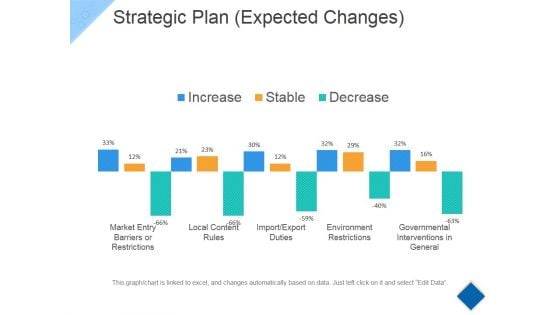
Strategic Plan Template 2 Ppt PowerPoint Presentation Summary Graphic Images
This is a strategic plan template 2 ppt powerpoint presentation summary graphic images. This is a ten stage process. The stages in this process are increase, decrease, stable, environment restrictions.
Solvency Ratios Template Ppt PowerPoint Presentation Inspiration Icons
This is a solvency ratios template ppt powerpoint presentation inspiration icons. This is a two stage process. The stages in this process are debt equity ratio, total liabilities total equity, time interest earned ratio, ebit interest expense.
Competitive Analysis Template 1 Ppt PowerPoint Presentation Icon Show
This is a competitive analysis template 1 ppt powerpoint presentation icon show. This is a six stage process. The stages in this process are competitive, analysis, business, marketing, bar graph.
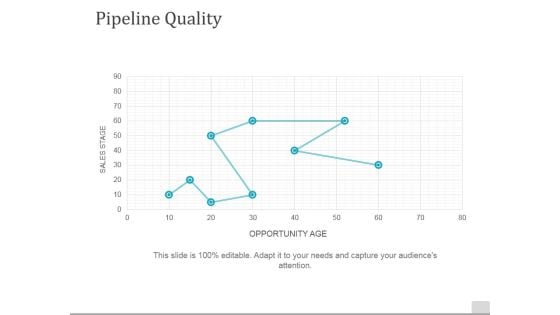
Pipeline Quality Template 2 Ppt PowerPoint Presentation Inspiration Show
This is a pipeline quality template 2 ppt powerpoint presentation inspiration show. This is a one stage process. The stages in this process are sales stage, opportunity age, pipeline, quality, line chart.
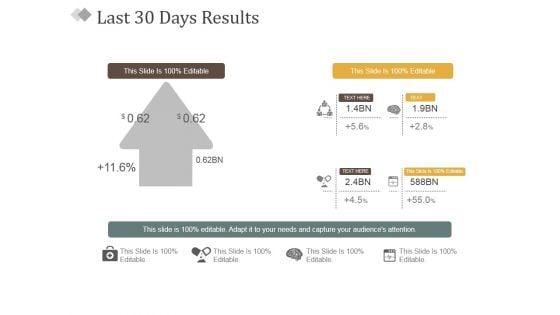
Last 30 Days Results Ppt PowerPoint Presentation Infographic Template Example
This is a last 30 days results ppt powerpoint presentation infographic template example. This is a two stage process. The stages in this process are results, business, presentation, marketing, success.
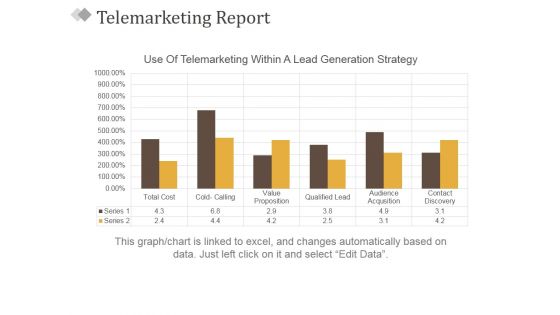
Telemarketing Report Template 2 Ppt PowerPoint Presentation Styles Model
This is a telemarketing report template 2 ppt powerpoint presentation styles model. This is a six stage process. The stages in this process are use of telemarketing within a lead generation strategy, business, bar graph, marketing, success.
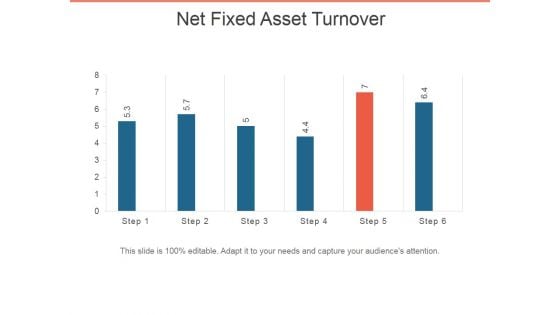
Net Fixed Asset Turnover Ppt PowerPoint Presentation Infographic Template Pictures
This is a net fixed asset turnover ppt powerpoint presentation infographic template pictures. This is a six stage process. The stages in this process are bar graph, business, marketing, presentation, success.
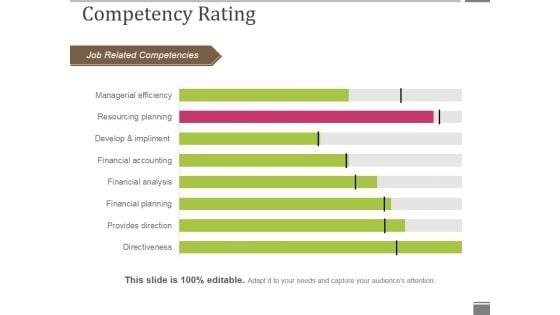
Competency Rating Template 1 Ppt PowerPoint Presentation Outline Smartart
This is a competency rating template 1 ppt powerpoint presentation outline smartart. This is a eight stage process. The stages in this process are job related competencies, competency rating, bar graph, business, marketing.
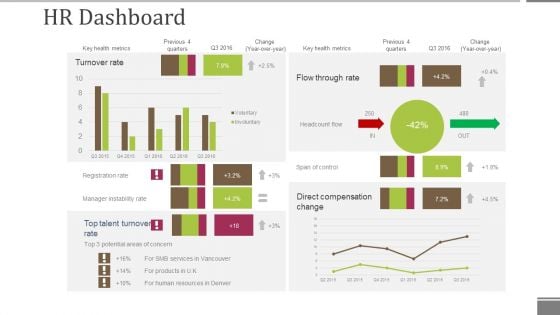
Hr Dashboard Template 2 Ppt PowerPoint Presentation File Grid
This is a hr dashboard template 2 ppt powerpoint presentation file grid. This is a four stage process. The stages in this process are turnover rate, direct compensation change, span of control, headcount flow, flow through rate.
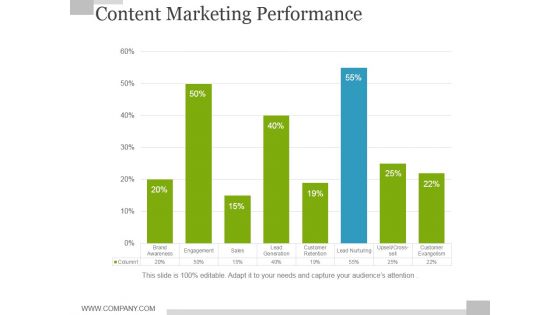
Content Marketing Performance Template 2 Ppt PowerPoint Presentation Outline Brochure
This is a content marketing performance template 2 ppt powerpoint presentation outline brochure. This is a eight stage process. The stages in this process are brand awareness, engagement, sales, lead generation, customer retention.
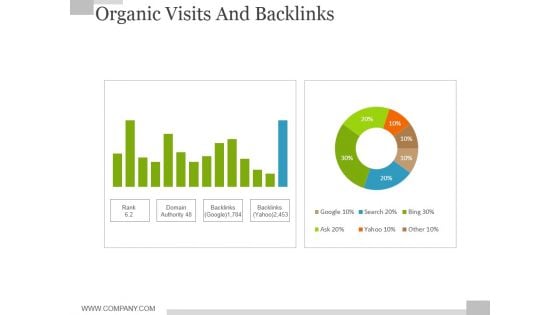
Organic Visits And Backlinks Ppt PowerPoint Presentation Infographic Template Model
This is a organic visits and backlinks ppt powerpoint presentation infographic template model. This is a two stage process. The stages in this process are rank, domain authority, backlinks, google, search.
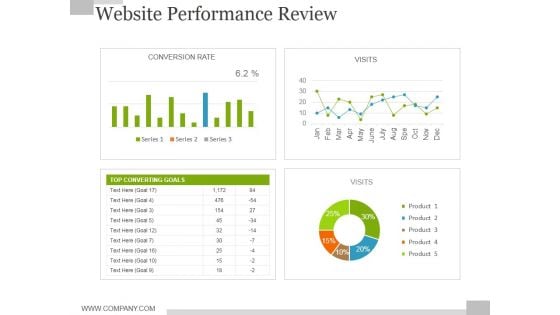
Website Performance Review Template 1 Ppt PowerPoint Presentation Inspiration Ideas
This is a website performance review template 1 ppt powerpoint presentation inspiration ideas. This is a four stage process. The stages in this process are conversion rate, visits, top converting goals, product.
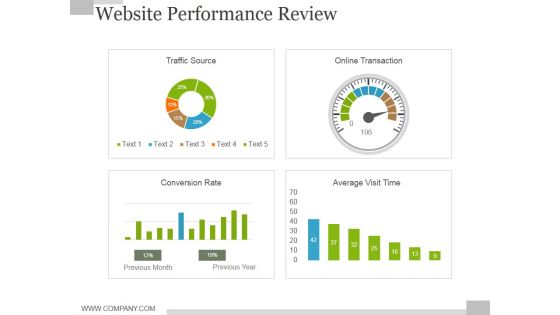
Website Performance Review Template 2 Ppt PowerPoint Presentation Professional Portrait
This is a website performance review template 2 ppt powerpoint presentation professional portrait. This is a four stage process. The stages in this process are traffic source, online transaction, conversion rate, previous month, previous year.
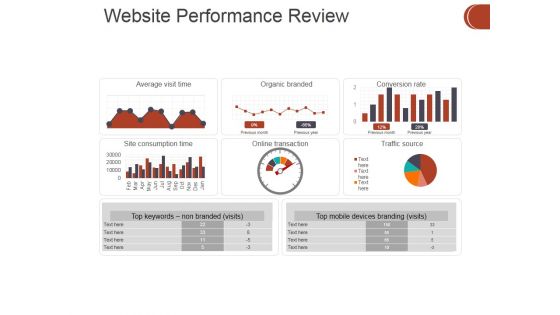
Website Performance Review Template 1 Ppt PowerPoint Presentation Ideas Samples
This is a website performance review template 1 ppt powerpoint presentation ideas samples. This is a six stage process. The stages in this process are average visit time, organic branded, conversion rate, site consumption time, online transaction, traffic source.
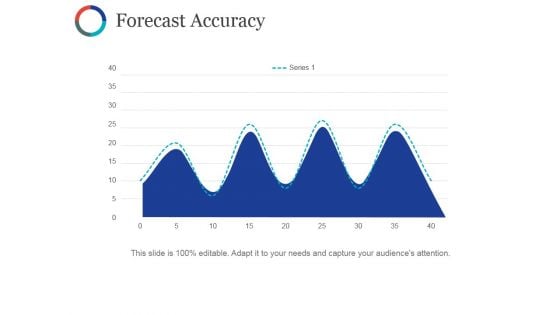
Forecast Accuracy Template Ppt PowerPoint Presentation Styles Format Ideas
This is a forecast accuracy template ppt powerpoint presentation styles format ideas. This is a four stage process. The stages in this process are business, marketing, strategy, graph, planning.
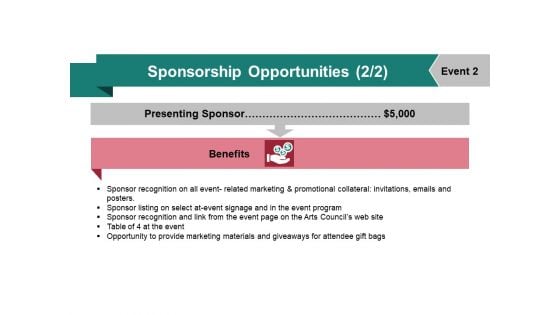
Sponsorship Opportunities Template 4 Ppt PowerPoint Presentation Design Ideas
This is a sponsorship opportunities template 4 ppt powerpoint presentation design ideas. This is a one stage process. The stages in this process are benefits, presenting sponsor, business, planning.
Activity Ratios Template 1 Ppt PowerPoint Presentation Outline Icons
This is a activity ratios template 1 ppt powerpoint presentation outline icons. This is a two stage process. The stages in this process are inventory turnover, receivables turnover, year, inventory ratio, category.
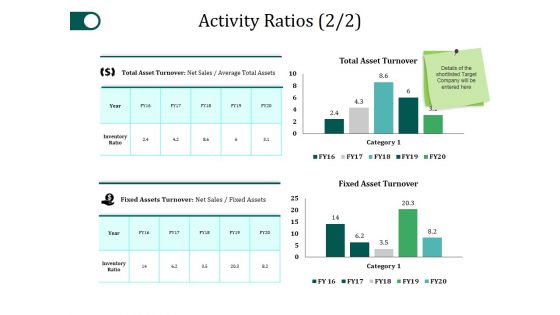
Activity Ratios Template 2 Ppt PowerPoint Presentation File Example File
This is a activity ratios template 2 ppt powerpoint presentation file example file. This is a two stage process. The stages in this process are total asset turnover, fixed asset turnover, category, table, business.
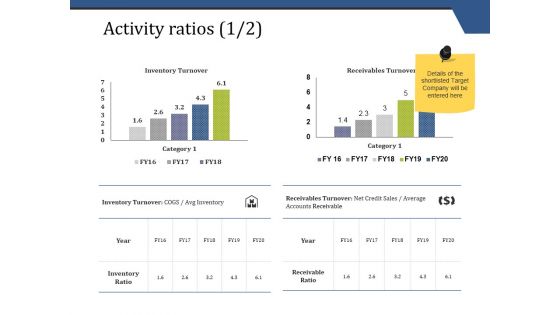
Activity Ratios Template 1 Ppt PowerPoint Presentation Show Graphics
This is a activity ratios template 1 ppt powerpoint presentation show graphics. This is a two stage process. The stages in this process are inventory turnover, receivables turnover, inventory ratio, receivable ratio.
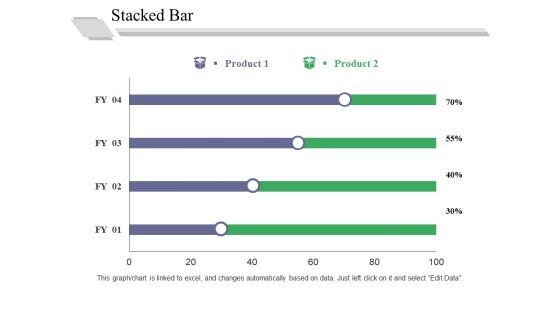
Stacked Bar Template 1 Ppt PowerPoint Presentation Outline Good
This is a stacked bar template 1 ppt powerpoint presentation outline good. This is a two stage process. The stages in this process are in percentage, business, marketing, graph, strategy.
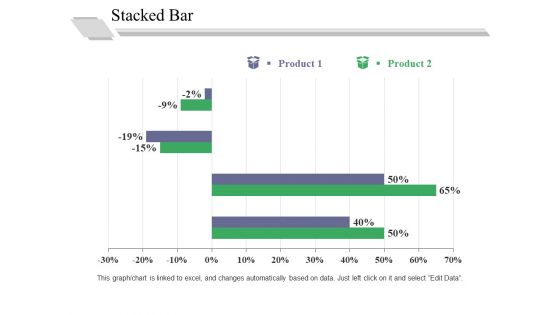
Stacked Bar Template 2 Ppt PowerPoint Presentation Professional Graphics Pictures
This is a stacked bar template 2 ppt powerpoint presentation professional graphics pictures. This is a two stage process. The stages in this process are in percentage, business, marketing, graph, strategy.

Pie Chart Ppt PowerPoint Presentation Infographic Template Summary
This is a pie chart ppt powerpoint presentation infographic template summary. This is a four stage process. The stages in this process are pie chart, marketing, strategy, analysis, business.
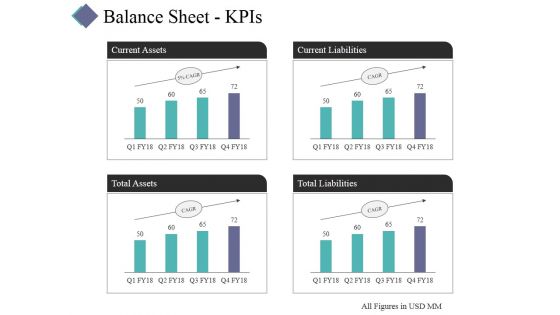
Balance Sheet Kpis Template 2 Ppt PowerPoint Presentation Ideas Show
This is a balance sheet kpis template 2 ppt powerpoint presentation ideas show. This is a four stage process. The stages in this process are current assets, total assets, total liabilities, current liabilities.

Market Sizing Template 1 Ppt PowerPoint Presentation Infographics Diagrams
This is a market sizing template 1 ppt powerpoint presentation infographics diagrams. This is a three stage process. The stages in this process are total available market, serviceable market, our market share.
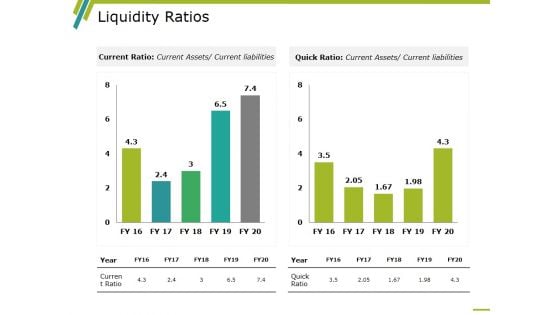
Liquidity Ratios Template 1 Ppt PowerPoint Presentation Styles Outline
This is a liquidity ratios template 1 ppt powerpoint presentation styles outline. This is a two stage process. The stages in this process are business, marketing, graph, year, current ratio, quick ratio.
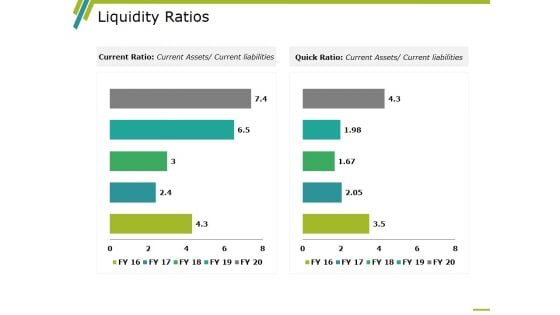
Liquidity Ratios Template 2 Ppt PowerPoint Presentation Ideas Microsoft
This is a liquidity ratios template 2 ppt powerpoint presentation ideas microsoft. This is a two stage process. The stages in this process are business, marketing, graph, year, current ratio, quick ratio.
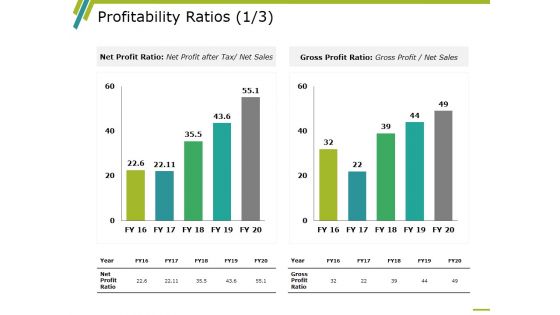
Profitability Ratios Template 2 Ppt PowerPoint Presentation Show Portfolio
This is a profitability ratios template 2 ppt powerpoint presentation show portfolio. This is a two stage process. The stages in this process are business, marketing, graph, net profit ratio, gross profit ratio, year.
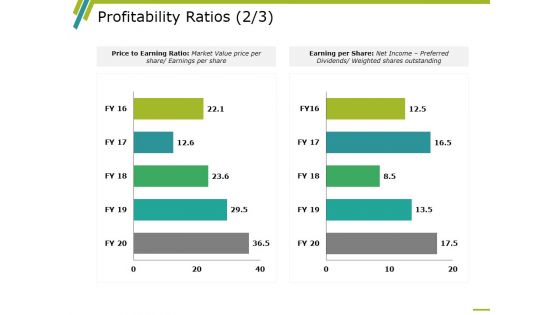
Profitability Ratios Template 3 Ppt PowerPoint Presentation Inspiration Backgrounds
This is a profitability ratios template 3 ppt powerpoint presentation inspiration backgrounds. This is a two stage process. The stages in this process are business, marketing, graph, price to earning ratio, earning per share.
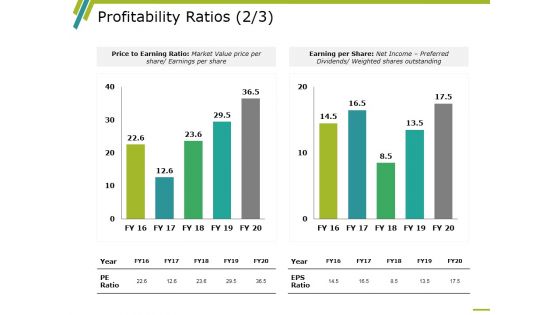
Profitability Ratios Template 4 Ppt PowerPoint Presentation Infographics Rules
This is a profitability ratios template 4 ppt powerpoint presentation infographics rules. This is a two stage process. The stages in this process are business, marketing, graph, price to earning ratio, earning per share.
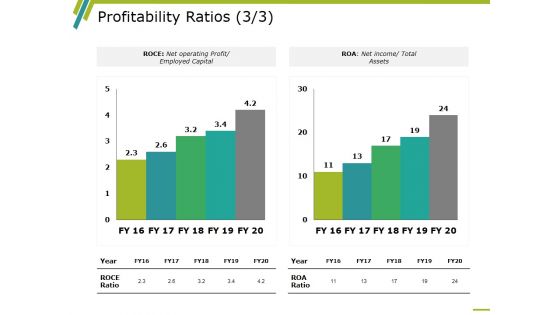
Profitability Ratios Template 6 Ppt PowerPoint Presentation Design Ideas
This is a profitability ratios template 6 ppt powerpoint presentation design ideas. This is a two stage process. The stages in this process are business, marketing, graph, roce, roa.
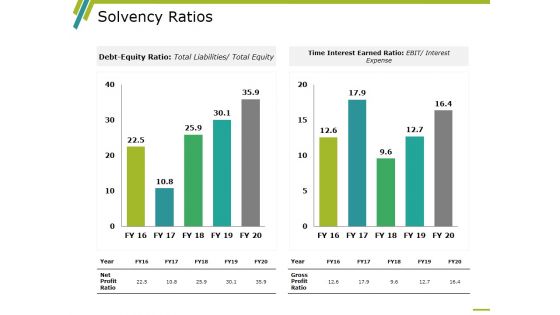
Solvency Ratios Template 1 Ppt PowerPoint Presentation Layouts Graphics Design
This is a solvency ratios template 1 ppt powerpoint presentation layouts graphics design. This is a two stage process. The stages in this process are time interest earned ratio, debt equity ratio, gross profit ratio, net profit ratio, year.
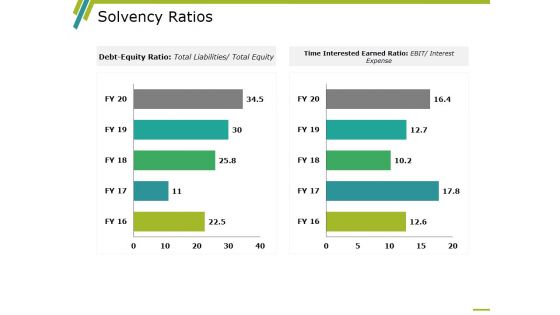
Solvency Ratios Template 2 Ppt PowerPoint Presentation Layouts Layouts
This is a solvency ratios template 2 ppt powerpoint presentation layouts layouts. This is a two stage process. The stages in this process are time interest earned ratio, debt equity ratio, gross profit ratio, net profit ratio, year.
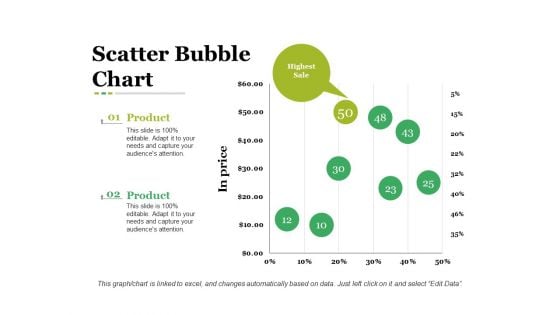
Scatter Bubble Chart Ppt PowerPoint Presentation Infographic Template Graphic Images
This is a scatter bubble chart ppt powerpoint presentation infographic template graphic images. This is a two stage process. The stages in this process are business, in price, bubble chart, marketing, strategy.
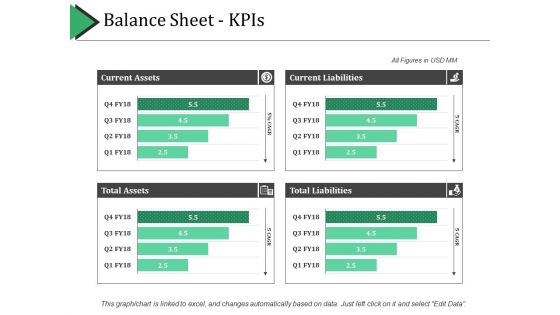
Balance Sheet Kpis Template 1 Ppt PowerPoint Presentation Pictures Grid
This is a balance sheet kpis template 1 ppt powerpoint presentation pictures grid. This is a four stage process. The stages in this process are current assets, current liabilities, total assets, total liabilities.
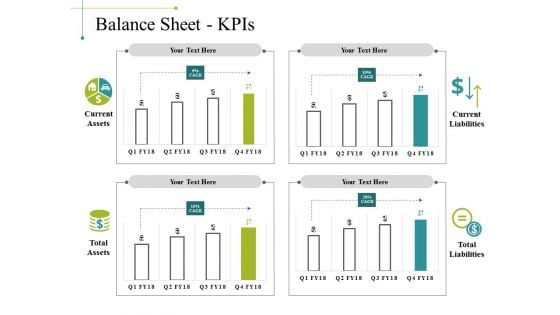
Balance Sheet Kpis Template 1 Ppt PowerPoint Presentation Show Inspiration
This is a balance sheet kpis template 1 ppt powerpoint presentation show inspiration. This is a four stage process. The stages in this process are business, marketing, graph, current liabilities, total liabilities.
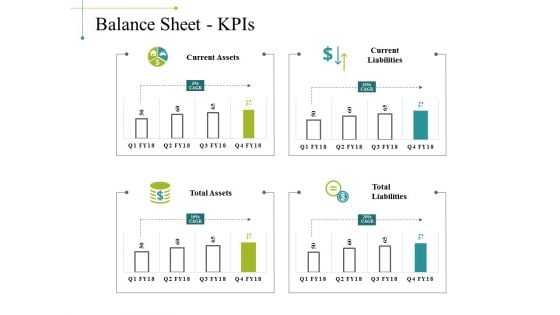
Balance Sheet Kpis Template 2 Ppt PowerPoint Presentation Gallery Example
This is a balance sheet kpis template 2 ppt powerpoint presentation gallery example. This is a four stage process. The stages in this process are business, marketing, graph, current liabilities, total liabilities.
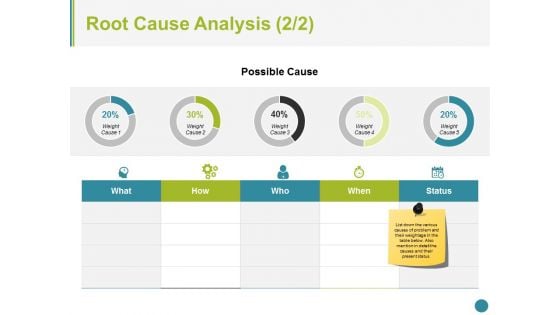
Root Cause Analysis Template 2 Ppt PowerPoint Presentation Styles Graphics
This is a root cause analysis template 2 ppt powerpoint presentation styles graphics. This is a five stage process. The stages in this process are business, icons, marketing, strategy, process.
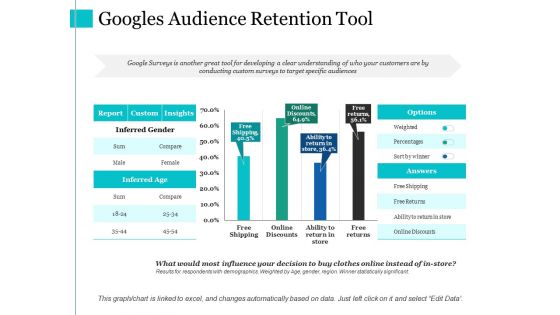
Googles Audience Retention Tool Ppt PowerPoint Presentation Infographic Template Infographics
This is a googles audience retention tool ppt powerpoint presentation infographic template infographics. This is a four stage process. The stages in this process are free shipping, online discounts, free returns, inferred age, custom.
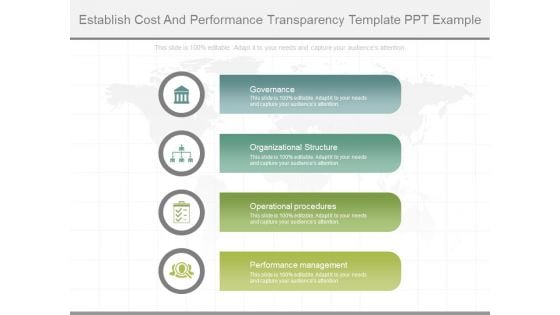
Establish Cost And Performance Transparency Template Ppt Example
This is a establish cost and performance transparency template ppt example. This is a four stage process. The stages in this process are governance, organizational structure, operational procedures, performance management.

Sample Of Cost Planning Ppt Template Example 2015
This is a sample of cost planning ppt template example 2015. This is a four stage process. The stages in this process are assess, value discovery, measure, value realization.
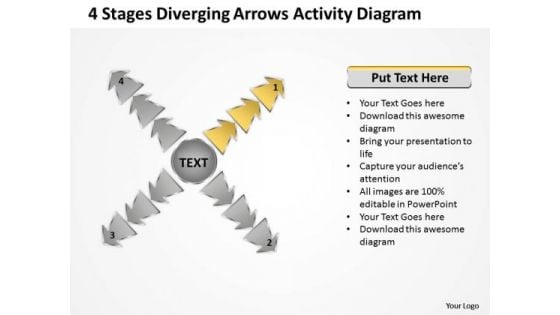
4 Stages Diverging Arrows Activity Diagram Cycle Chart PowerPoint Template
We present our 4 stages diverging arrows activity diagram Cycle Chart PowerPoint template.Download and present our Flow Charts PowerPoint Templates because you have the ideas, you have got a brainwave. Download our Business PowerPoint Templates because you have analysed many global markets and come up with possibilities. Highlight the pros and cons of other likely business oppurtunities. Use our Process and Flows PowerPoint Templates because health of the determines the quality of our lives. Download our Success PowerPoint Templates because the choices you make today will determine the future growth of your enterprise. Download our Arrows PowerPoint Templates because your business and plans for its growth consist of processes that are highly co-related.Use these PowerPoint slides for presentations relating to Business, Chart, Circle, Cyclic, Data, Diagram, Financial, Goal, Graph, Illustration, Info, Information, Marketing, Model, Option, Part, Pie, Presentation, Process, Result, Sphere, Statistics. The prominent colors used in the PowerPoint template are Yellow, Gray, White. People tell us our 4 stages diverging arrows activity diagram Cycle Chart PowerPoint template are Zippy. Customers tell us our Cyclic PowerPoint templates and PPT Slides are Beautiful. People tell us our 4 stages diverging arrows activity diagram Cycle Chart PowerPoint template are Whimsical. Professionals tell us our Cyclic PowerPoint templates and PPT Slides are Romantic. Customers tell us our 4 stages diverging arrows activity diagram Cycle Chart PowerPoint template help you meet deadlines which are an element of today's workplace. Just browse and pick the slides that appeal to your intuitive senses. Use our Financial PowerPoint templates and PPT Slides are Precious. Encourage teams with our 4 Stages Diverging Arrows Activity Diagram Cycle Chart PowerPoint Template. Download without worries with our money back guaranteee.
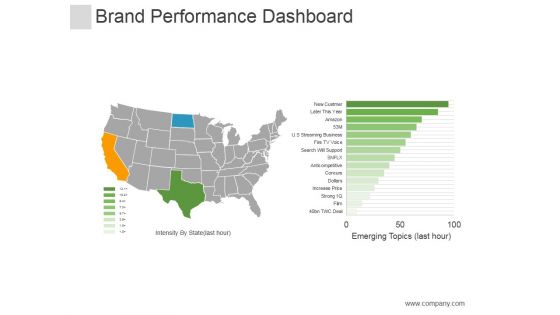
Brand Performance Dashboard Template Ppt PowerPoint Presentation Designs Download
This is a brand performance dashboard template ppt powerpoint presentation designs download. This is a five stage process. The stages in this process aresocial ,finance, icons, marketing.
About Us Template 2 Ppt PowerPoint Presentation Icon
This is a about us template 2 ppt powerpoint presentation icon. This is a four stage process. The stages in this process are ceo, manager, finance manager, accountant.
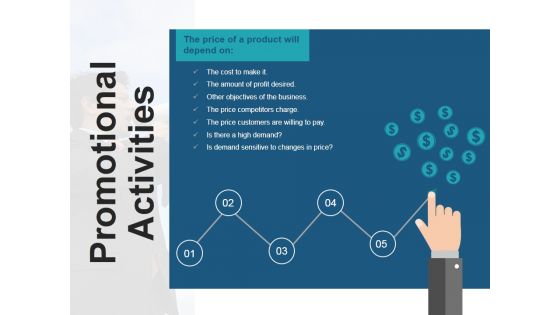
Promotional Activities Template 2 Ppt PowerPoint Presentation Gallery
This is a promotional activities template 2 ppt powerpoint presentation gallery. This is a five stage process. The stages in this process are dollar, symbol, business, finance, marketing.
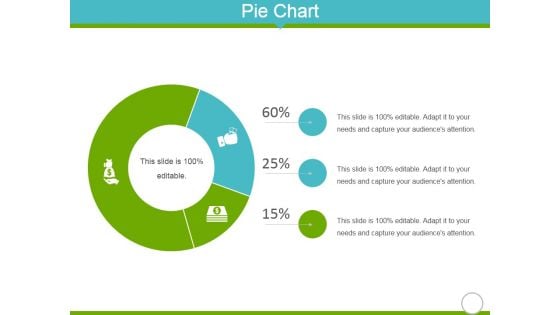
Pie Chart Ppt Powerpoint Presentation Infographic Template Diagrams
This is a pie chart ppt powerpoint presentation infographic template diagrams. This is a three stage process. The stages in this process are business, marketing, finance, icons, management.
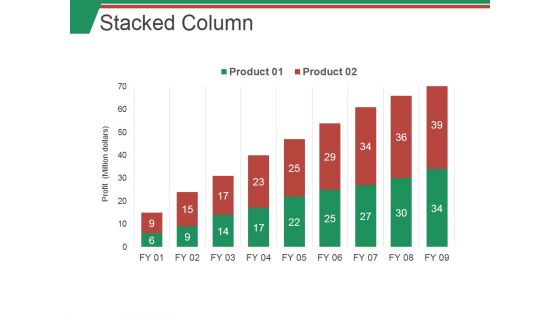
Stacked Column Ppt PowerPoint Presentation Infographic Template Graphics
This is a stacked column ppt powerpoint presentation infographic template graphics. This is a nine stage process. The stages in this process are business, marketing, finance, analysis, planning.
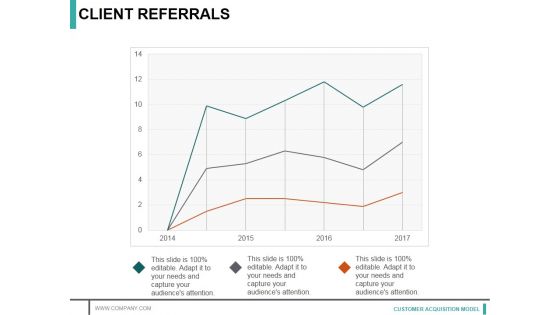
Client Referrals Ppt PowerPoint Presentation Infographic Template Maker
This is a client referrals ppt powerpoint presentation infographic template maker. This is a three stage process. The stages in this process are growth, graph, success, finance, business.

Market Survey Template Ppt PowerPoint Presentation File Microsoft
This is a market survey template ppt powerpoint presentation file microsoft. This is a five stage process. The stages in this process are business, marketing, finance, globe, communication.
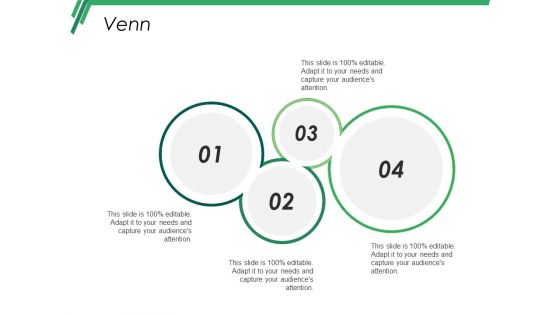
Venn Ppt PowerPoint Presentation Infographic Template Format Ideas
This is a venn ppt powerpoint presentation infographic template format ideas. This is a four stage process. The stages in this process are venn, marketing, strategy, finance, analysis.
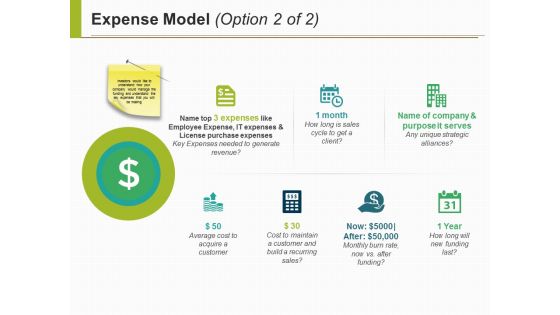
Expense Model Template Ppt PowerPoint Presentation File Formats
This is a expense model template ppt powerpoint presentation file formats. This is a seven stage process. The stages in this process are business, marketing, strategy, finance, planning.
Template 5 Ppt PowerPoint Presentation Outline Designs Download
This is a template 5 ppt powerpoint presentation outline designs download. This is a three stage process. The stages in this process are finance, business, strategy, marketing, planning.
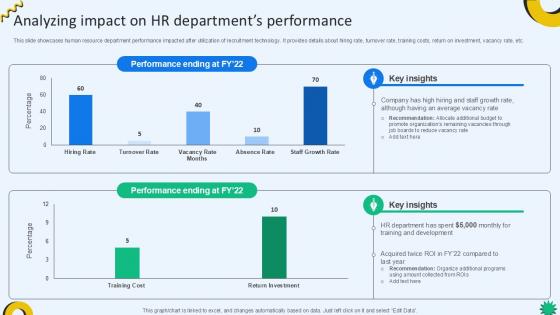
Analyzing Impact On HR Departments Cloud Recruiting Technologies PPT Template
This slide showcases human resource department performance impacted after utilization of recruitment technology. It provides details about hiring rate, turnover rate, training costs, return on investment, vacancy rate, etc. Boost your pitch with our creative Analyzing Impact On HR Departments Cloud Recruiting Technologies PPT Template. Deliver an awe-inspiring pitch that will mesmerize everyone. Using these presentation templates you will surely catch everyones attention. You can browse the ppts collection on our website. We have researchers who are experts at creating the right content for the templates. So you do not have to invest time in any additional work. Just grab the template now and use them. This slide showcases human resource department performance impacted after utilization of recruitment technology. It provides details about hiring rate, turnover rate, training costs, return on investment, vacancy rate, etc.
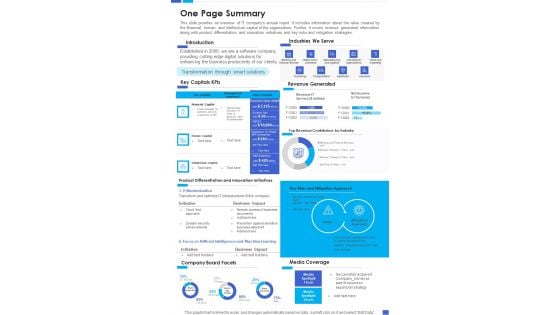
One Page Summary Template 162 One Pager Documents
This slide provides an overview of IT companys annual report. It includes information about the value created by the financial, human, and intellectual capital of the organization. Further, it covers revenue generated information along with product differentiation and innovation initiatives and key risks and mitigation strategies. Presenting you a fantastic One Page Summary Template 162 One Pager Documents. This piece is crafted on hours of research and professional design efforts to ensure you have the best resource. It is completely editable and its design allow you to rehash its elements to suit your needs. Get this One Page Summary Template 162 One Pager Documents A4 One-pager now.
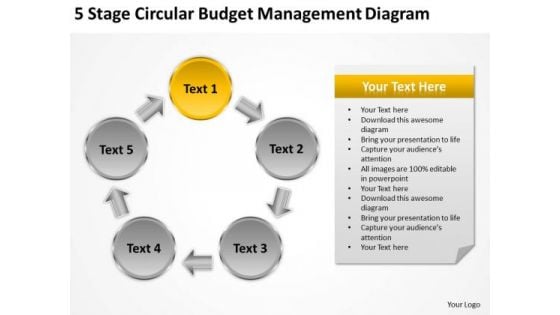
Circular Budget Management Diagram Catering Business Plan Template PowerPoint Slides
We present our circular budget management diagram catering business plan template PowerPoint Slides.Present our Circle Charts PowerPoint Templates because you should Whip up a frenzy with our PowerPoint Templates and Slides. They will fuel the excitement of your team. Present our Arrows PowerPoint Templates because You should Throw the gauntlet with our PowerPoint Templates and Slides. They are created to take up any challenge. Use our Process and Flows PowerPoint Templates because Our PowerPoint Templates and Slides help you meet the demand of the Market. Just browse and pick the slides that appeal to your intuitive senses. Download our Flow Charts PowerPoint Templates because It will mark the footprints of your journey. Illustrate how they will lead you to your desired destination. Download our Business PowerPoint Templates because You should Press the right buttons with our PowerPoint Templates and Slides. They will take your ideas down the perfect channel.Use these PowerPoint slides for presentations relating to Abstract, arrows, blank, business, central, centralized, chart, circle, circular, circulation, concept, conceptual, converging, design, diagram, executive, five,icon, idea, illustration, management, map, mapping, mba, model, numbers, organization, outwards, pointing, procedure, process, radial, radiating, relationship,resource, sequence, sequential, square, strategy. The prominent colors used in the PowerPoint template are Yellow, White, Gray. Our Circular Budget Management Diagram Catering Business Plan Template PowerPoint Slides cater for different factions. They assist in finding common ground.

Profitability Ratios Template 3 Ppt PowerPoint Presentation Styles Slide Download
This is a profitability ratios template 3 ppt powerpoint presentation styles slide download. This is a two stage process. The stages in this process are roce, roa, net operating profit, net income.
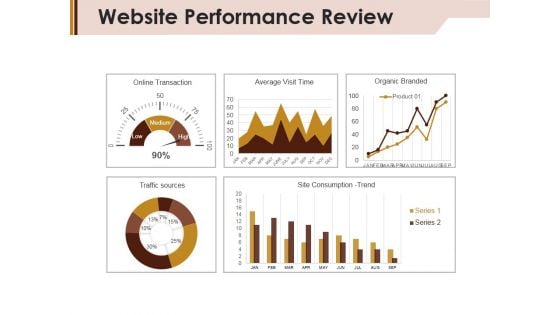
Website Performance Review Template 2 Ppt PowerPoint Presentation Slides Graphics
This is a website performance review template 2 ppt powerpoint presentation slides graphics. This is a five stage process. The stages in this process are online transaction, average visit time, organic branded, traffic sources.

The Octothorpe Design Elements Brand Strategy Playbook Template Clipart PDF
This template covers the best practices for the use of brand assets with useful examples. It also depicts that most sizes of the symbol are legible, and a miniature variant is given for micro applications. Presenting The Octothorpe Design Elements Brand Strategy Playbook Template Clipart PDF to provide visual cues and insights. Share and navigate important information on three stages that need your due attention. This template can be used to pitch topics like Designs, Applications. In addtion, this PPT design contains high resolution images, graphics, etc, that are easily editable and available for immediate download.
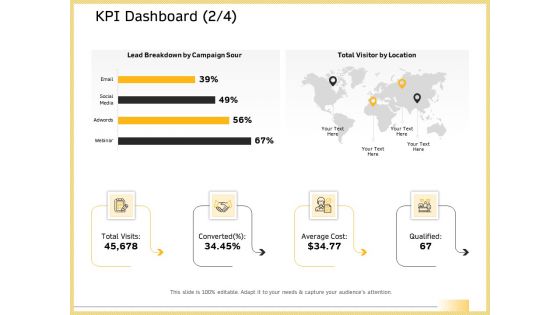
B2B Marketing KPI Dashboard Lead Breakdown Ppt File Template PDF
Deliver an awe-inspiring pitch with this creative b2b marketing kpi dashboard lead breakdown ppt file template pdf bundle. Topics like lead breakdown campaign sour, total visitor, converted, average cost, qualified can be discussed with this completely editable template. It is available for immediate download depending on the needs and requirements of the user.


 Continue with Email

 Home
Home


