Edge Icon
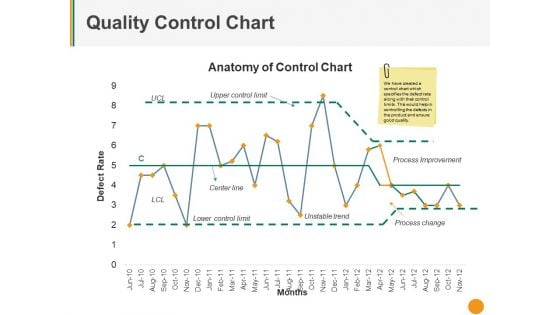
Quality Control Chart Ppt PowerPoint Presentation Pictures Deck
This is a quality control chart ppt powerpoint presentation pictures deck. This is a one stage process. The stages in this process are upper control limit, center line, unstable trend, process improvement, process change.
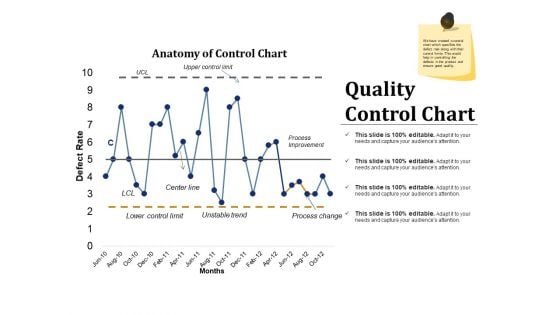
Quality Control Chart Ppt PowerPoint Presentation Inspiration Example Introduction
This is a quality control chart ppt powerpoint presentation inspiration example introduction. This is a two stage process. The stages in this process are process improvement, process change, unstable trend, lower control limit, center line.
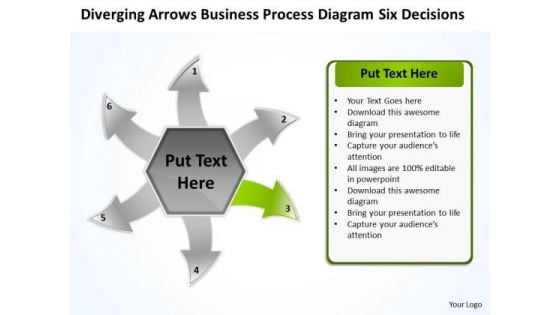
Business PowerPoint Theme Process Diagram Six Decisions Cycle Flow Network Slides
We present our business powerpoint theme process diagram six decisions Cycle Flow Network Slides.Use our Arrows PowerPoint Templates because it Draws the universal impact to highlight the similarities with your organizational structure and plans. Present our Flow Charts PowerPoint Templates because the structure of our templates allows you to effectively highlight the key issues concerning the growth of your business. Present our Process and Flows PowerPoint Templates because you can outline your targets to your team. Download our Business PowerPoint Templates because the NASA Space programme took mankind to the moon and so much more. Like them you too can look far beyond normal boundaries. Show them that in your mind the sky is certainly not the limit. Use our Marketing PowerPoint Templates because customer satisfaction is a mantra of the marketplace. Building a loyal client base is an essential element of your business.Use these PowerPoint slides for presentations relating to Abstract, arrow, background, buttons,circle, clean, communication, concept,conceptual, design, diagram, direction,elements, exchange, flow, flowchart, graph,graphic, icon, illustration, internet, precise, process, sign, symbol, arrows, flows, process, business. The prominent colors used in the PowerPoint template are Green, Black, White. Use our business powerpoint theme process diagram six decisions Cycle Flow Network Slides are Exuberant. Professionals tell us our clean PowerPoint templates and PPT Slides are Spiffy. Customers tell us our business powerpoint theme process diagram six decisions Cycle Flow Network Slides are Adorable. Presenters tell us our circle PowerPoint templates and PPT Slides are Fabulous. You can be sure our business powerpoint theme process diagram six decisions Cycle Flow Network Slides are Attractive. PowerPoint presentation experts tell us our communication PowerPoint templates and PPT Slides are Appealing. Give your audience a feel of your ability. Dole out a dose on our Business PowerPoint Theme Process Diagram Six Decisions Cycle Flow Network Slides.
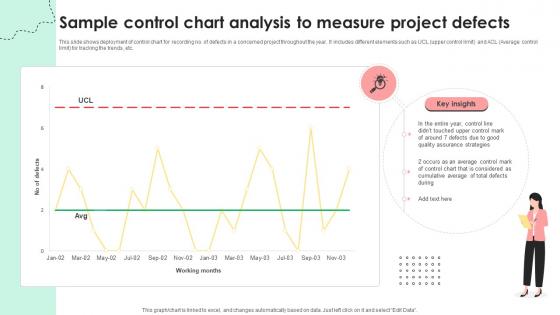
Administering Quality Assurance Sample Control Chart Analysis To Measure Project Defects PM SS V
This slide shows deployment of control chart for recording no. of defects in a concerned project throughout the year. It includes different elements such as UCL upper control limit and ACL Average control limit for tracking the trends, etc. From laying roadmaps to briefing everything in detail, our templates are perfect for you. You can set the stage with your presentation slides. All you have to do is download these easy-to-edit and customizable templates. Administering Quality Assurance Sample Control Chart Analysis To Measure Project Defects PM SS V will help you deliver an outstanding performance that everyone would remember and praise you for. Do download this presentation today. This slide shows deployment of control chart for recording no. of defects in a concerned project throughout the year. It includes different elements such as UCL upper control limit and ACL Average control limit for tracking the trends, etc.
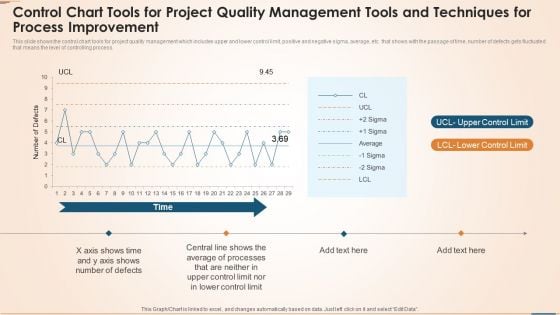
Control Chart Tools For Project Quality Management Tools And Techniques For Process Improvement Topics PDF
This slide shows the control chart tools for project quality management which includes upper and lower control limit, positive and negative sigma, average, etc. that shows with the passage of time, number of defects gets fluctuated that means the level of controlling process. Pitch your topic with ease and precision using this control chart tools for project quality management tools and techniques for process improvement topics pdf. This layout presents information on time, upper control limit, lower control limit. It is also available for immediate download and adjustment. So, changes can be made in the color, design, graphics or any other component to create a unique layout.
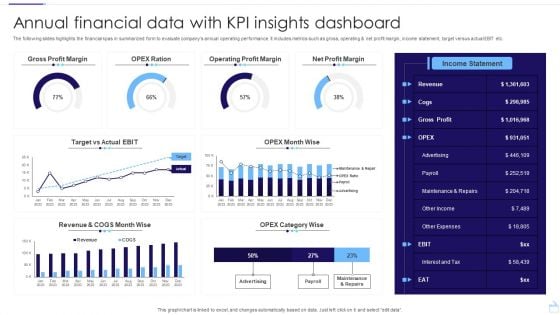
Annual Financial Data With KPI Insights Dashboard Structure PDF
The following slides highlights the financial kpas in summarized form to evaluate companys annual operating performance. It includes metrics such as gross, operating and net profit margin, income statement, target versus actual EBIT etc. Pitch your topic with ease and precision using this Annual Financial Data With KPI Insights Dashboard Structure PDF. This layout presents information on Gross Profit Margin, Operating Profit Margin, Net Profit Margin. It is also available for immediate download and adjustment. So, changes can be made in the color, design, graphics or any other component to create a unique layout.
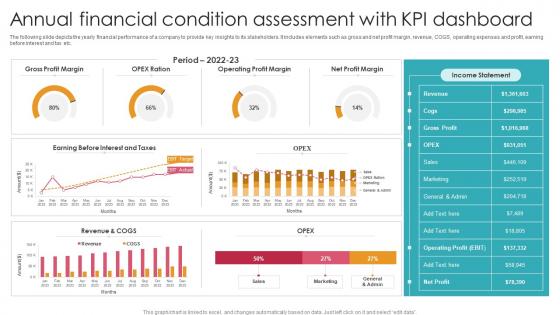
Annual Financial Condition Assessment With KPI Dashboard Ideas Pdf
The following slide depicts the yearly financial performance of a company to provide key insights to its stakeholders. It includes elements such as gross and net profit margin, revenue, COGS, operating expenses and profit, earning before interest and tax etc. Showcasing this set of slides titled Annual Financial Condition Assessment With KPI Dashboard Ideas Pdf. The topics addressed in these templates are Gross Profit Margin, Operating Profit Margin, Net Profit Margin. All the content presented in this PPT design is completely editable. Download it and make adjustments in color, background, font etc. as per your unique business setting. The following slide depicts the yearly financial performance of a company to provide key insights to its stakeholders. It includes elements such as gross and net profit margin, revenue, COGS, operating expenses and profit, earning before interest and tax etc.
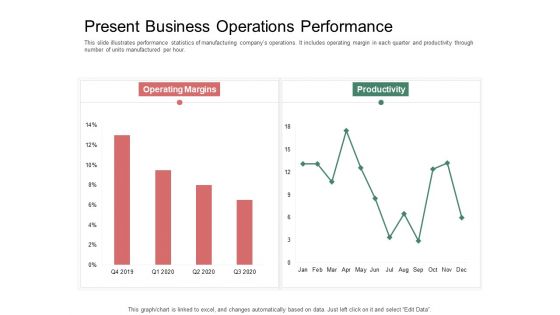
Organization Performance Evaluation Present Business Operations Performance Themes PDF
Deliver an awe inspiring pitch with this creative organization performance evaluation present business operations performance themes pdf bundle. Topics like operating margins, productivity can be discussed with this completely editable template. It is available for immediate download depending on the needs and requirements of the user.
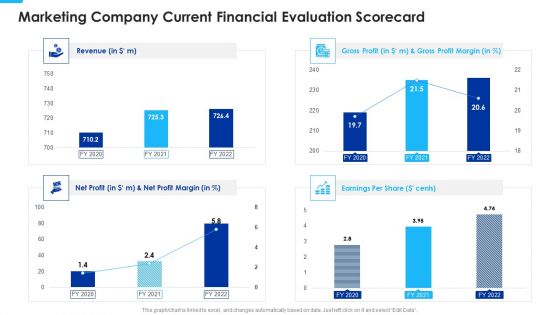
Marketing Company Current Financial Evaluation Scorecard Themes PDF
Deliver and pitch your topic in the best possible manner with this Marketing Company Current Financial Evaluation Scorecard Themes PDF Use them to share invaluable insights on Gross Profit, Earnings, Profit Margin and impress your audience. This template can be altered and modified as per your expectations. So, grab it now.
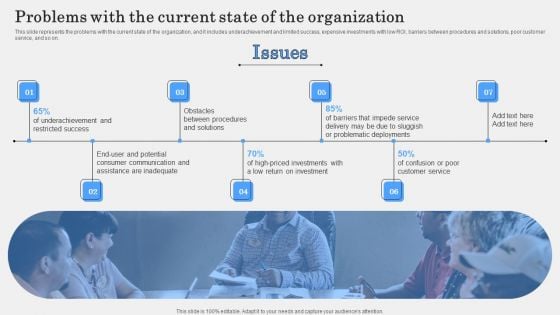
IT Alignment Phases In Business Problems With The Current State Of The Organization Themes PDF
This slide represents the problems with the current state of the organization, and it includes underachievement and limited success, expensive investments with low ROI, barriers between procedures and solutions, poor customer service, and so on. Slidegeeks is here to make your presentations a breeze with IT Alignment Phases In Business Problems With The Current State Of The Organization Themes PDF With our easy to use and customizable templates, you can focus on delivering your ideas rather than worrying about formatting. With a variety of designs to choose from, you are sure to find one that suits your needs. And with animations and unique photos, illustrations, and fonts, you can make your presentation pop. So whether you are giving a sales pitch or presenting to the board, make sure to check out Slidegeeks first.

Frog Animals PowerPoint Themes And PowerPoint Slides 0211
Microsoft PowerPoint Theme and Slide with frog sitting on green bamboo and looking with limited depth of field Hunt down problems with our Frog Animals PowerPoint Themes And PowerPoint Slides 0211. Make sure your presentation gets the attention it deserves.
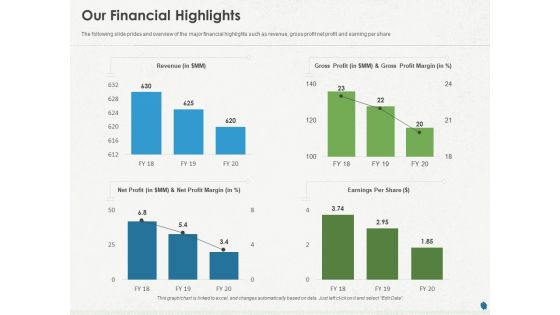
Distressed Debt Refinancing For Organizaton Our Financial Highlights Ppt PowerPoint Presentation Ideas Deck PDF
Presenting this set of slides with name tressed debt refinancing for organizaton our financial highlights ppt powerpoint presentation ideas deck pdf. The topics discussed in these slides are revenue, gross profit, gross profit margin, net profit net profit margin, earnings per share. This is a completely editable PowerPoint presentation and is available for immediate download. Download now and impress your audience.
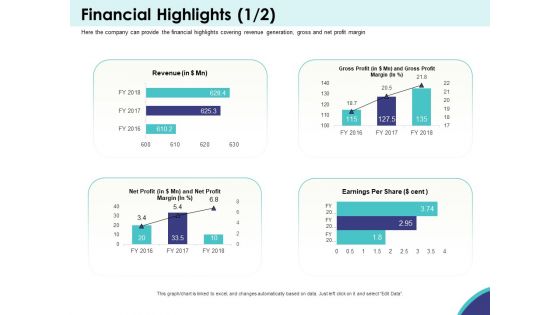
Expansion Oriented Strategic Plan Financial Highlights Revenue Ppt PowerPoint Presentation Portfolio Smartart PDF
Presenting this set of slides with name expansion oriented strategic plan financial highlights revenue ppt powerpoint presentation portfolio smartart pdf. The topics discussed in these slides are revenue, gross profit and gross profit margin, net profit and net profit margin, earnings per share. This is a completely editable PowerPoint presentation and is available for immediate download. Download now and impress your audience.
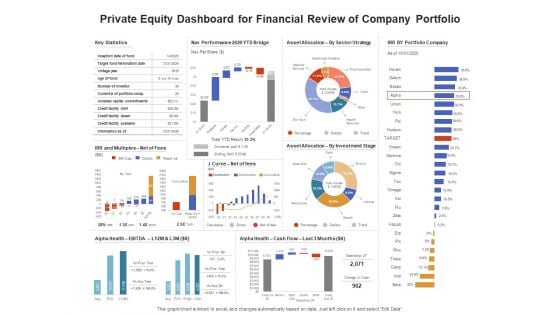
Venture Capitalist Control Board Private Equity Dashboard For Financial Review Of Company Portfolio Information PDF
Presenting this set of slides with name venture capitalist control board private equity dashboard for financial review of company portfolio information pdf. The topics discussed in these slides are contribution margin, margin analysis, income statement, dashboards controls. This is a completely editable PowerPoint presentation and is available for immediate download. Download now and impress your audience.
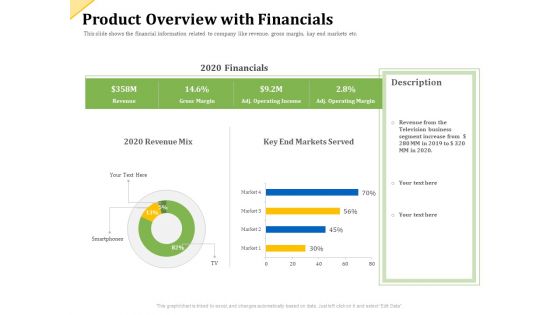
Investor Presentation For Raising Capital From Product Sponsorship Product Overview With Financials Ideas PDF
Deliver an awe-inspiring pitch with this creative investor presentation for raising capital from product sponsorship product overview with financials ideas pdf bundle. Topics like 2020 revenue mix, key end markets served, 2020 financials, revenue, gross margin, operating income, operating margin can be discussed with this completely editable template. It is available for immediate download depending on the needs and requirements of the user.
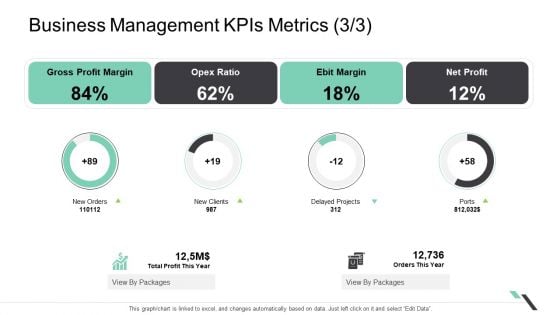
Business Management Kpis Metrics Delayed Projects Professional PDF
Deliver and pitch your topic in the best possible manner with this business management kpis metrics delayed projects professional pdf. Use them to share invaluable insights on gross profit margin, ebit margin, net profit and impress your audience. This template can be altered and modified as per your expectations. So, grab it now.
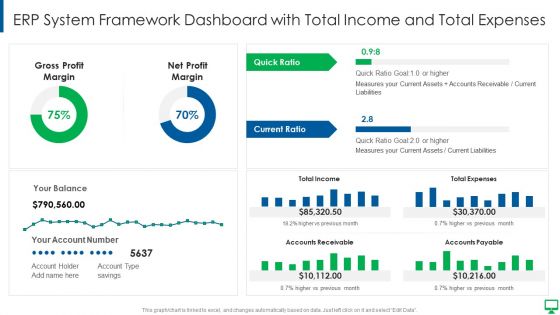
Execution Of ERP System To Enhance Business Effectiveness ERP System Framework Dashboard Pictures PDF
Deliver an awe inspiring pitch with this creative execution of erp system to enhance business effectiveness erp system framework dashboard pictures pdf bundle. Topics like gross profit margin, net profit margin, measures your current assets can be discussed with this completely editable template. It is available for immediate download depending on the needs and requirements of the user.
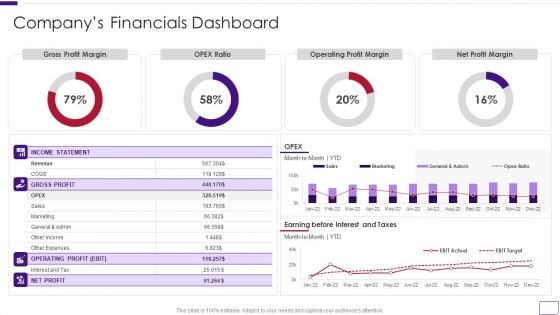
Business Overview Of A Technology Firm Companys Financials Dashboard Sample PDF
Deliver and pitch your topic in the best possible manner with this Business Overview Of A Technology Firm Companys Financials Dashboard Sample PDF. Use them to share invaluable insights on Financials Dashboard, Operating Profit Margin, Net Profit Margin and impress your audience. This template can be altered and modified as per your expectations. So, grab it now.
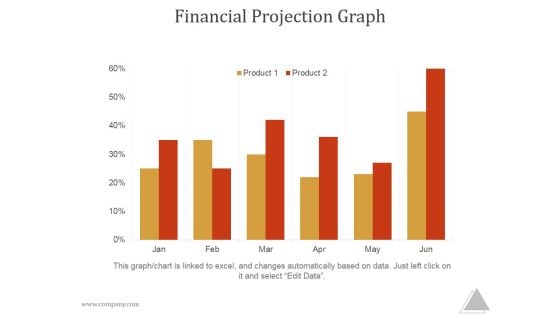
Financial Projection Graph Slide2 Ppt PowerPoint Presentation Themes
This is a financial projection graph slide2 ppt powerpoint presentation themes. This is a five stage process. The stages in this process are year, total sales, gross, margin, net income
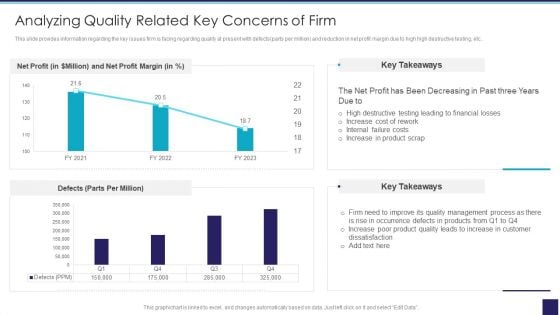
Organizational Issue Resolution Tool Analyzing Quality Related Key Concerns Of Firm Themes PDF
This slide provides information regarding the key issues firm is facing regarding quality at present with defects parts per million and reduction in net profit margin due to high high destructive testing, etc. Deliver and pitch your topic in the best possible manner with this Organizational Issue Resolution Tool Analyzing Quality Related Key Concerns Of Firm Themes PDF. Use them to share invaluable insights on Profit Margin, Financial Losses, Product Scrap and impress your audience. This template can be altered and modified as per your expectations. So, grab it now.
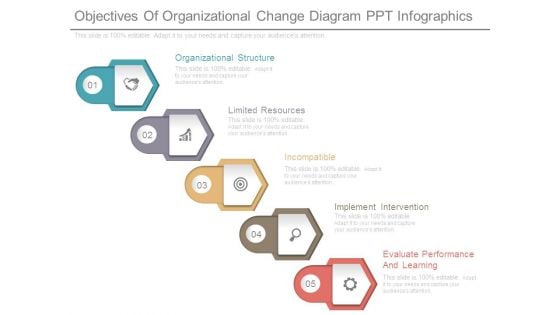
Objectives Of Organizational Change Diagram Ppt Infographics
This is a objectives of organizational change diagram ppt infographics. This is a five stage process. The stages in this process are organizational structure, limited resources, incompatible, implement intervention, evaluate performance and learning.
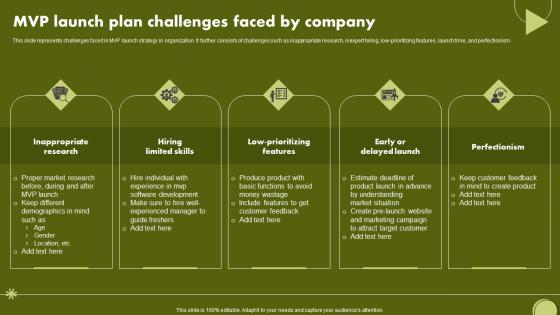
MVP Launch Plan Challenges Faced By Company Diagrams Pdf
This slide represents challenges faced in MVP launch strategy in organization. It further consists of challenges such as inappropriate research, inexpert hiring, low prioritizing features, launch time, and perfectionism Showcasing this set of slides titled MVP Launch Plan Challenges Faced By Company Diagrams Pdf. The topics addressed in these templates are Inappropriate Research, Hiring Limited Skills, Low Prioritizing Features. All the content presented in this PPT design is completely editable. Download it and make adjustments in color, background, font etc. as per your unique business setting. This slide represents challenges faced in MVP launch strategy in organization. It further consists of challenges such as inappropriate research, inexpert hiring, low prioritizing features, launch time, and perfectionism
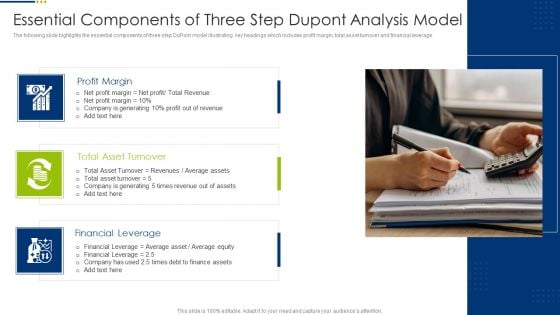
Essential Components Of Three Step Dupont Analysis Model Diagrams PDF
The following slide highlights the essential components of three step DuPont model illustrating key headings which includes profit margin, total asset turnover and financial leverage. Presenting Essential Components Of Three Step Dupont Analysis Model Diagrams PDF to dispense important information. This template comprises three stages. It also presents valuable insights into the topics including Profit Margin, Total Asset Turnover, Financial Leverage. This is a completely customizable PowerPoint theme that can be put to use immediately. So, download it and address the topic impactfully.
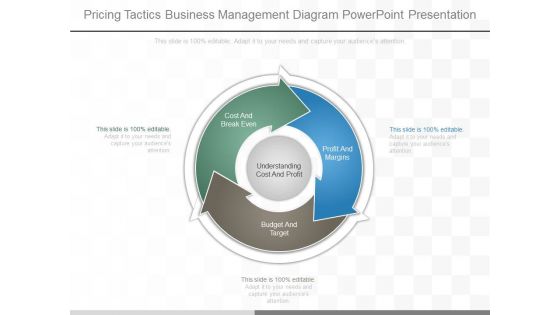
Pricing Tactics Business Management Diagram Powerpoint Presentation
This is a pricing tactics business management diagram powerpoint presentation. This is a three stage process. The stages in this process are understanding cost and profit, cost and break even, profit and margins, budget and target.
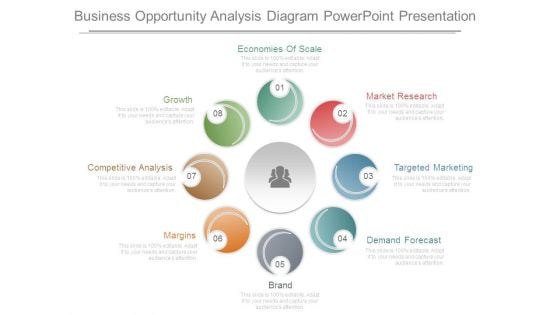
Business Opportunity Analysis Diagram Powerpoint Presentation
This is a business opportunity analysis diagram powerpoint presentation. This is a eight stage process. The stages in this process are economies of scale, market research, targeted marketing, demand forecast, brand, margins, competitive analysis, growth.
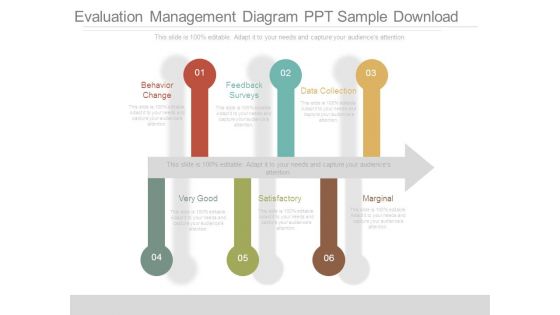
Evaluation Management Diagram Ppt Sample Download
This is a evaluation management diagram ppt sample download. This is a six stage process. The stages in this process are behavior change, feedback surveys, data collection, very good, satisfactory, marginal.
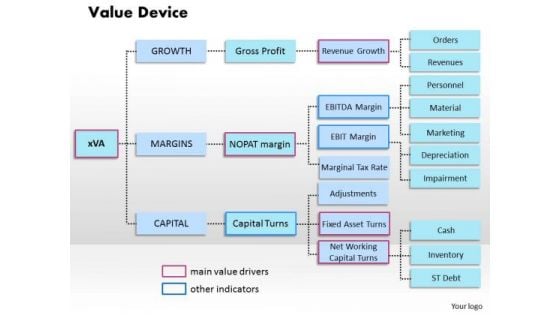
Business Framework Value Device PowerPoint Presentation
This business slide depicts framework of value device. It contains flow chart depicting activities related to growth margin and capital. Download this diagram as a tool for business presentations
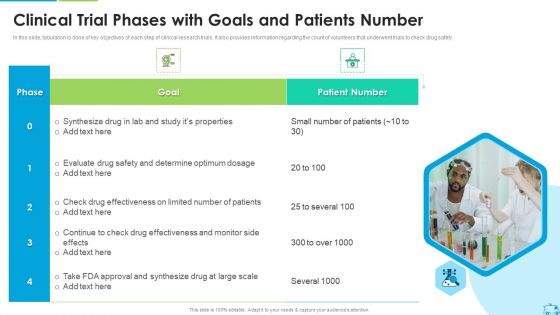
Clinical Trial Phases With Goals And Patients Number Topics PDF
In this slide, tabulation is done of key objectives of each step of clinical research trials. It also provides information regarding the count of volunteers that underwent trials to check drug safety.Deliver an awe inspiring pitch with this creative Clinical Trial Phases With Goals And Patients Number Topics PDF bundle. Topics like Evaluate Drug Safety, Determine Optimum Dosage, Effectiveness On Limited can be discussed with this completely editable template. It is available for immediate download depending on the needs and requirements of the user.
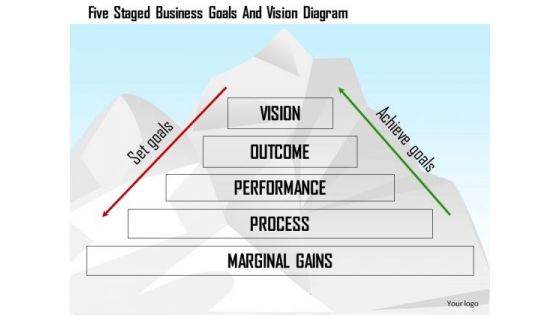
Business Diagram Five Staged Business Goals And Vision Diagram Presentation Template
This slide depicts diagram for set goals and achieve goals. It contains stages of vision, outcome. Performance, process and marginal gains. It will make your presentation look professional and keep your audience mesmerized.
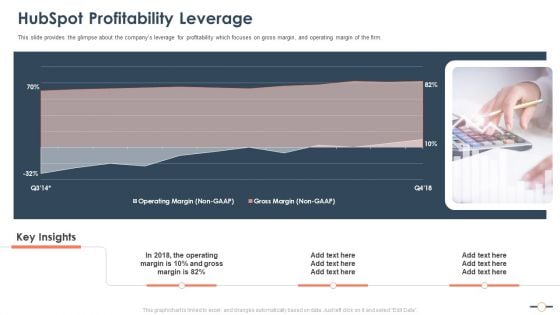
Hubspot Profitability Leverage Rules PDF
This slide provides the glimpse about the companys leverage for profitability which focuses on gross margin, and operating margin of the firm. Deliver an awe inspiring pitch with this creative hubspot profitability leverage rules pdf bundle. Topics like hubspot profitability leverage can be discussed with this completely editable template. It is available for immediate download depending on the needs and requirements of the user.
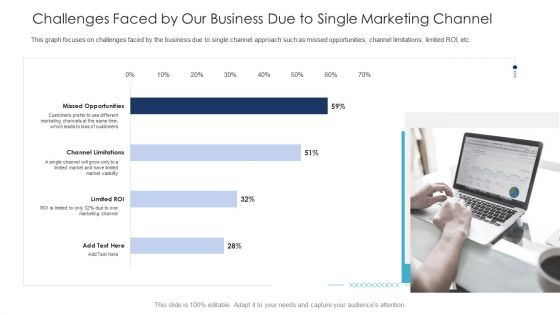
B2C Marketing Initiatives Strategies For Business Challenges Faced By Our Business Due To Single Marketing Channel Themes PDF
This graph focuses on challenges faced by the business due to single channel approach such as missed opportunities, channel limitations, limited ROI, etc. Deliver and pitch your topic in the best possible manner with this B2C marketing initiatives strategies for business challenges faced by our business due to single marketing channel themes pdf. Use them to share invaluable insights on opportunities, marketing channels, market visibility and impress your audience. This template can be altered and modified as per your expectations. So, grab it now.
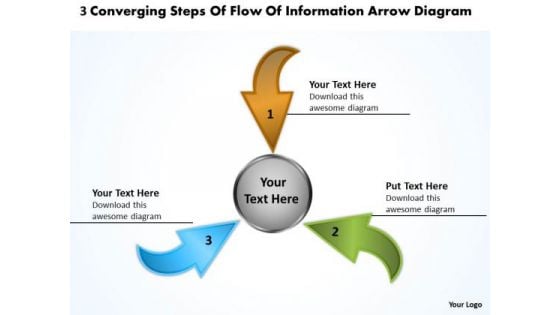
3 Converging Steps Of Flow Information Arrow Diagram Cycle Chart PowerPoint Templates
We present our 3 converging steps of flow information arrow diagram Cycle Chart PowerPoint templates.Present our Arrows PowerPoint Templates because the NASA Space programme took mankind to the moon and so much more. Like them you too can look far beyond normal boundaries. Show them that in your mind the sky is certainly not the limit. Present our Circle Charts PowerPoint Templates because this template project the knowledge gained to your colleagues to guide them along the way in days to come. Use our Shapes PowerPoint Templates because you have the ideas and plans on how to achieve success. Download and present our Business PowerPoint Templates because your ideas too are pinpointedly focused on you goals. Present our Flow Charts PowerPoint Templates because you can Transmit your passion via our creative templates.Use these PowerPoint slides for presentations relating to abstract, arrow, business, chart, circle, circular, collection, color, continuity, cycle, decoration, design, diagram, dimensional, direction, element, flow, glossy, graph, icon, illustration, isolated, modern, motion, movement, pattern, pie, recycling, repetition, report, ring, round, scheme, section, set, shape, shiny, sign, slice, spinning, symbol, turn, vector, web. The prominent colors used in the PowerPoint template are Brown, Green, Blue. Presenters tell us our 3 converging steps of flow information arrow diagram Cycle Chart PowerPoint templates are Stunning. You can be sure our color PowerPoint templates and PPT Slides are Bright. Professionals tell us our 3 converging steps of flow information arrow diagram Cycle Chart PowerPoint templates are Nice. People tell us our circular PowerPoint templates and PPT Slides are Dazzling. People tell us our 3 converging steps of flow information arrow diagram Cycle Chart PowerPoint templates are Dynamic. Professionals tell us our color PowerPoint templates and PPT Slides are Tasteful. Our graphice have been selected by professionals. Use them in your presentations with our 3 Converging Steps Of Flow Information Arrow Diagram Cycle Chart PowerPoint Templates. You'll always stay ahead of the game.
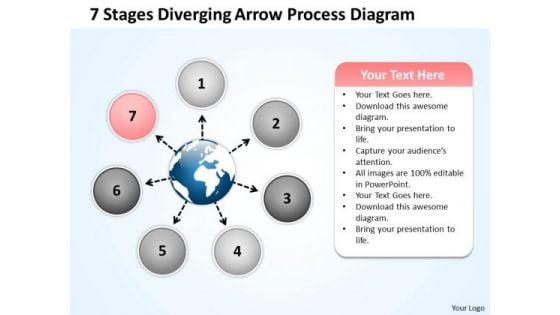
7 Stages Diverging Arrow Process Diagram Processs And PowerPoint Slides
We present our 7 stages diverging arrow process diagram Processs and PowerPoint Slides.Use our Globe PowerPoint Templates because by using this slide you can Heighten the anticipation of your audience listing . Present our Business PowerPoint Templates because it helps you to project your enthusiasm and single mindedness to your colleagues. Download and present our Arrows PowerPoint Templates because you have made significant headway in this field. Download and present our Spheres PowerPoint Templates because your quicksilver ideas are the arrows in your quiver. Download and present our Circle Charts PowerPoint Templates because the NASA Space programme took mankind to the moon and so much more. Like them you too can look far beyond normal boundaries. Show them that in your mind the sky is certainly not the limit.Use these PowerPoint slides for presentations relating to 3d, Arrow, Blue, Chart, Chevron, Circle, Circular, Colorful, Diagram, Flowchart, Globe, Graphic, Green, Hub, Icon, Illustration, Pieces, Process, Purple, Recycle, Recycling, Red, Segmented, Set, Sphere, Symbol, Vibrant, Wheel. The prominent colors used in the PowerPoint template are Blue, Pink, Gray. The feedback we get is that our 7 stages diverging arrow process diagram Processs and PowerPoint Slides are Youthful. People tell us our Colorful PowerPoint templates and PPT Slides are Fancy. Presenters tell us our 7 stages diverging arrow process diagram Processs and PowerPoint Slides are Nostalgic. Use our Circle PowerPoint templates and PPT Slides are Swanky. Use our 7 stages diverging arrow process diagram Processs and PowerPoint Slides are Great. Use our Chart PowerPoint templates and PPT Slides are Detailed. Assist the audience to comprehend with our 7 Stages Diverging Arrow Process Diagram Processs And PowerPoint Slides. They will always be in your debt.
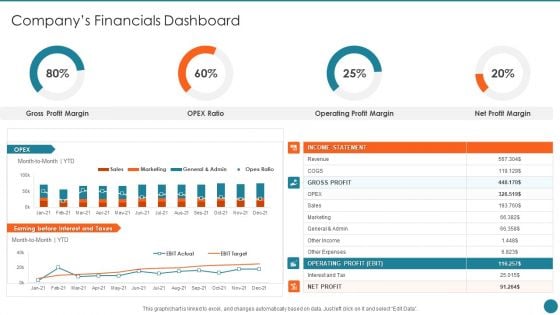
Business Overview Of An Information Technology Company Companys Financials Dashboard Themes PDF
Deliver an awe inspiring pitch with this creative Business Overview Of An Information Technology Company Companys Financials Dashboard Themes PDF bundle. Topics like Gross Profit, Operating Profit, Profit Margin can be discussed with this completely editable template. It is available for immediate download depending on the needs and requirements of the user.
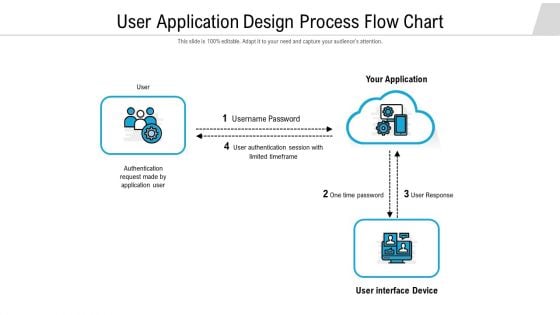
User Application Design Process Flow Chart Demonstration PDF
Presenting user application design process flow chart demonstration pdf to dispense important information. This template comprises four stages. It also presents valuable insights into the topics including authentication request made by application user, username password, authentication session with limited timeframe. This is a completely customizable PowerPoint theme that can be put to use immediately. So, download it and address the topic impactfully.
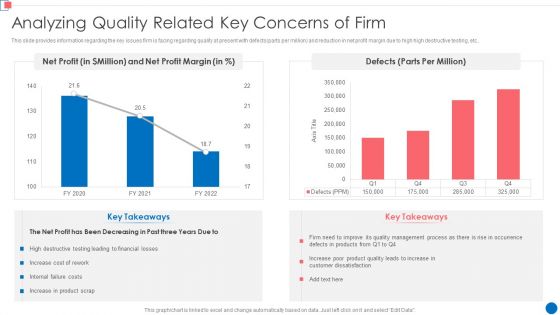
Optimize Enterprise Core Analyzing Quality Related Key Concerns Of Firm Diagrams PDF
This slide provides information regarding the key issues firm is facing regarding quality at present with defects parts per million and reduction in net profit margin due to high high destructive testing, etc. Deliver an awe inspiring pitch with this creative Optimize Enterprise Core Analyzing Quality Related Key Concerns Of Firm Diagrams PDF bundle. Topics like Net Profit, Net Profit Margin, 2020 To 2022 can be discussed with this completely editable template. It is available for immediate download depending on the needs and requirements of the user.
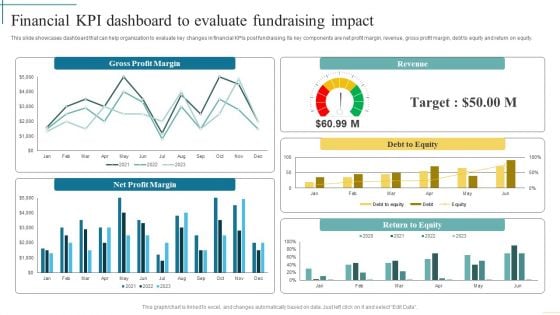
Financial Kpi Dashboard To Evaluate Fundraising Impact Developing Fundraising Techniques Diagrams PDF
This slide showcases dashboard that can help organization to evaluate key changes in financial KPIs post fundraising. Its key components are net profit margin, revenue, gross profit margin, debt to equity and return on equity. From laying roadmaps to briefing everything in detail, our templates are perfect for you. You can set the stage with your presentation slides. All you have to do is download these easy-to-edit and customizable templates. Financial Kpi Dashboard To Evaluate Fundraising Impact Developing Fundraising Techniques Diagrams PDF will help you deliver an outstanding performance that everyone would remember and praise you for. Do download this presentation today.
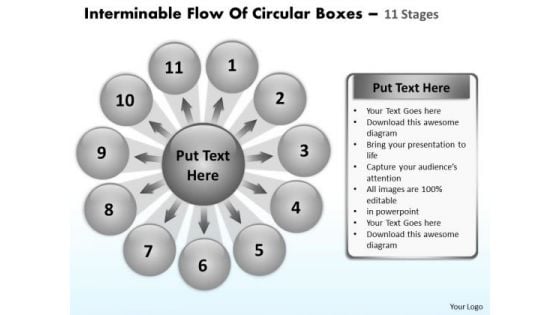
Flow Of Circular Boxes 11 Stages Ppt Relative Arrow Chart PowerPoint Templates
We present our flow of circular boxes 11 stages ppt Relative Arrow Chart PowerPoint templates.Use our Arrows PowerPoint Templates because you understand how each drives the next to motor the entire sequence. Use our Circle Charts PowerPoint Templates because this helps in epitomised the values of teamwork. Present our Process and Flows PowerPoint Templates because this is An innovative slide design depicting driving home the relevance of a steady rhythm. Use our Business PowerPoint Templates because the NASA Space programme took mankind to the moon and so much more. Like them you too can look far beyond normal boundaries. Show them that in your mind the sky is certainly not the limit. Present our Shapes PowerPoint Templates because it gives you really bright ideas.Use these PowerPoint slides for presentations relating to Arrows, Blank, Business, Central, Centralized, Chart, Circle, Circular, Circulation, Concept, Conceptual, Converging, Design, Diagram, Empty, Executive, Icon, Idea, Illustration, Management, Map, Mapping, Moa, Model, Numbers, Organization, Outwards, Pointing, Procedure, Process, Radial, Radiating, Relationship, Resource, Sequence, Sequential, Seven, Square, Strategy. The prominent colors used in the PowerPoint template are Black, Gray, White. Professionals tell us our flow of circular boxes 11 stages ppt Relative Arrow Chart PowerPoint templates are Appealing. You can be sure our Circle PowerPoint templates and PPT Slides are incredible easy to use. Customers tell us our flow of circular boxes 11 stages ppt Relative Arrow Chart PowerPoint templates are Fashionable. Professionals tell us our Centralized PowerPoint templates and PPT Slides are Colorful. People tell us our flow of circular boxes 11 stages ppt Relative Arrow Chart PowerPoint templates are Luxurious. People tell us our Circulation PowerPoint templates and PPT Slides will make the presenter look like a pro even if they are not computer savvy. Let your thoughts evolve. Our Flow Of Circular Boxes 11 Stages Ppt Relative Arrow Chart PowerPoint Templates will nurture their growth.
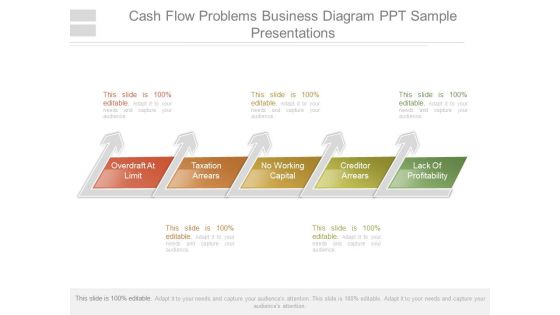
Cash Flow Problems Business Diagram Ppt Sample Presentations
This is a cash flow problems business diagram ppt sample presentations. This is a five stage process. The stages in this process are overdraft at limit, taxation arrears, no working capital, creditor arrears, lack of profitability.

Horizontal Illustration Of 5 Stages Business Order Process Flow Chart PowerPoint Slides
We present our horizontal illustration of 5 stages business order process flow chart PowerPoint Slides.Download and present our Arrows PowerPoint Templates because this slide brings grey areas to the table and explain in detail you assessment of the need for care to ensure continued smooth progress. Present our Shapes PowerPoint Templates because our template will illustrate what you want to say. Use our Business PowerPoint Templates because the NASA Space programme took mankind to the moon and so much more. Like them you too can look far beyond normal boundaries. Show them that in your mind the sky is certainly not the limit. Download and present our Signs PowerPoint Templates because so that you can Lead the way to spread good cheer to one and all. Use our Process and Flows PowerPoint Templates because getting it done may not be enough.Use these PowerPoint slides for presentations relating to abstract, arrow, blank, business, chart, circular, circulation, concept, conceptual, design, diagram, executive, flow, horizontal, icon, idea, illustration, management, model, numbers, organization, process, progression, resource, sequence, stages, steps, strategy. The prominent colors used in the PowerPoint template are Blue, Gray, White. The feedback we get is that our horizontal illustration of 5 stages business order process flow chart PowerPoint Slides are Elegant. PowerPoint presentation experts tell us our concept PowerPoint templates and PPT Slides are Elevated. People tell us our horizontal illustration of 5 stages business order process flow chart PowerPoint Slides are Spiffy. Professionals tell us our business PowerPoint templates and PPT Slides are effectively colour coded to prioritise your plans They automatically highlight the sequence of events you desire. You can be sure our horizontal illustration of 5 stages business order process flow chart PowerPoint Slides are Chic. We assure you our chart PowerPoint templates and PPT Slides are Multicolored. Fight for a cause with our Horizontal Illustration Of 5 Stages Business Order Process Flow Chart PowerPoint Slides. Try us out and see what a difference our templates make.
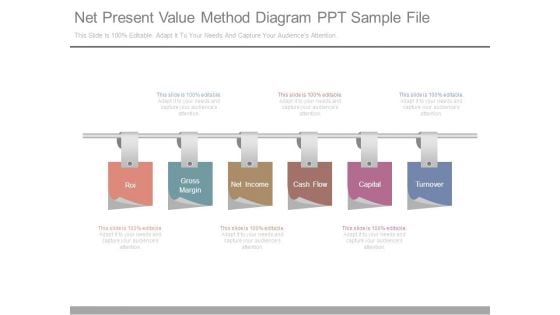
Net Present Value Method Diagram Ppt Sample File
This is a net present value method diagram ppt sample file. This is a six stage process. The stages in this process are roi, gross margin, net income, cash flow, capital, turnover.
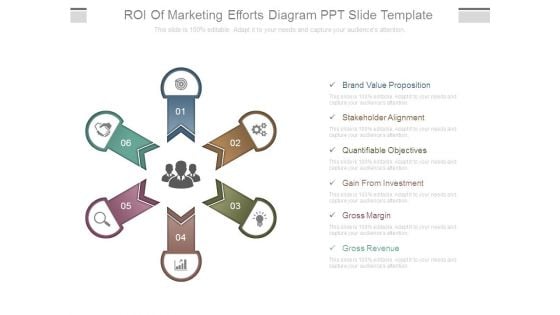
Roi Of Marketing Efforts Diagram Ppt Slide Template
This is a roi of marketing efforts diagram ppt slide template. This is a six stage process. The stages in this process are brand value proposition, stakeholder alignment, quantifiable objectives, gain from investment, gross margin, gross revenue.
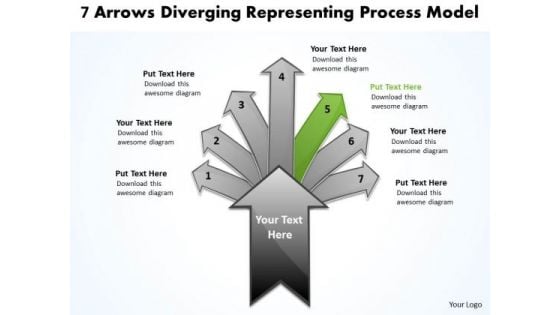
7 Arrows Diverging Representing Process Model Cycle Motion Chart PowerPoint Templates
We present our 7 arrows diverging representing process model Cycle Motion Chart PowerPoint templates.Use our Sale PowerPoint Templates because it illustrates the symbols of human growth. Present our Arrows PowerPoint Templates because you should go for Gold and not just silver. Download our Process and Flows PowerPoint Templates because they will Amplify your thoughts via our appropriate templates. Use our Business PowerPoint Templates because the NASA Space programme took mankind to the moon and so much more. Like them you too can look far beyond normal boundaries. Show them that in your mind the sky is certainly not the limit. Download and present our Shapes PowerPoint Templates because like your thoughts arrows are inherently precise and true.Use these PowerPoint slides for presentations relating to Abstract, Arrow, Art, Artistic, Background, Banner, Boost, Box, Business, Clip Art, Color, Colorful, Concept, Cover, Creative, Decide, Decision, Design, Direction, Finance, Futuristic, Graphic, Icon, Idea, Illustration, Increase, Info, Information, Journey, Label, Modern, Path, Pattern, Pop, Print, Process, Sale, Solution, Statistic, Sticker, Stylish, Template. The prominent colors used in the PowerPoint template are Green, Gray, Black. PowerPoint presentation experts tell us our 7 arrows diverging representing process model Cycle Motion Chart PowerPoint templates are Colorful. People tell us our Banner PowerPoint templates and PPT Slides are Clever. People tell us our 7 arrows diverging representing process model Cycle Motion Chart PowerPoint templates are Ritzy. Presenters tell us our Box PowerPoint templates and PPT Slides are Breathtaking. Customers tell us our 7 arrows diverging representing process model Cycle Motion Chart PowerPoint templates are Elevated. The feedback we get is that our Background PowerPoint templates and PPT Slides are Classic. Let our 7 Arrows Diverging Representing Process Model Cycle Motion Chart PowerPoint Templates figure in your plans. Appreciate the assistance they provide.
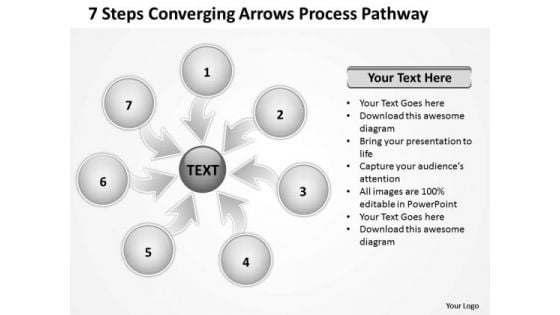
7 Steps Coverging Arrows Process Pathway Processs And PowerPoint Slides
We present our 7 steps coverging arrows process pathway Processs and PowerPoint Slides.Download and present our Flow Charts PowerPoint Templates because as a result we often end up with errors. Present our Process and Flows PowerPoint Templates because you have the entire picture in mind. Download and present our Business PowerPoint Templates because the NASA Space programme took mankind to the moon and so much more. Like them you too can look far beyond normal boundaries. Show them that in your mind the sky is certainly not the limit. Download our Marketing PowerPoint Templates because networking is an imperative in todays world. You need to access the views of others. Similarly you need to give access to them of your abilities. Download our Shapes PowerPoint Templates because this diagram depicts the essence of this chain reaction like sequence of events.Use these PowerPoint slides for presentations relating to Arrows, Business, Central, Centralized, Chart, Circle, Circular, Circulation, Design, Diagram, Executive, Icon, Idea, Illustration, Pointing, Procedure, Process, Resource, Sequence, Sequential, Seven, Square, Strategy, Template. The prominent colors used in the PowerPoint template are Black, Gray, White. PowerPoint presentation experts tell us our 7 steps coverging arrows process pathway Processs and PowerPoint Slides are Pretty. The feedback we get is that our Circle PowerPoint templates and PPT Slides are Fashionable. Presenters tell us our 7 steps coverging arrows process pathway Processs and PowerPoint Slides are Ultra. Presenters tell us our Central PowerPoint templates and PPT Slides are Energetic. Professionals tell us our 7 steps coverging arrows process pathway Processs and PowerPoint Slides are Wistful. The feedback we get is that our Design PowerPoint templates and PPT Slides will impress their bosses and teams. Make them feel up to it with our 7 Steps Coverging Arrows Process Pathway Processs And PowerPoint Slides. Assure them with your words.

Illustration Of 6 Data Processes And Flows Cycle Arrow PowerPoint Templates
We present our illustration of 6 data processes and flows Cycle Arrow PowerPoint templates.Present our Arrows PowerPoint Templates because knowledge is power goes the popular saying. Download our Process and Flows PowerPoint Templates because there is a crucial aspect that requires extra attention. Present our Business PowerPoint Templates because the NASA Space programme took mankind to the moon and so much more. Like them you too can look far beyond normal boundaries. Show them that in your mind the sky is certainly not the limit. Download and present our Shapes PowerPoint Templates because this template helps you to bring your audiences to the table. Present our Circle Charts PowerPoint Templates because let your words be the drops of wisdom spreading knowledge and peace like ripples through the expectant minds of your devoted followers.Use these PowerPoint slides for presentations relating to Arrows, Background, Blue, Chart, Circle, Circular, Circulation, Color, Connection, Continuity, Cycle, Cyclic, Diagram, Direction, Empty, Flow, Four, Dimensional, Graph, Icon, Presentation, Process, Progress, Reason, Recycle, Recycling, Repetition, Report, Result, Ring, Rotation, Round, Scheme, Section, Step, Symbol, Teamwork. The prominent colors used in the PowerPoint template are Yellow, Gray, White. Professionals tell us our illustration of 6 data processes and flows Cycle Arrow PowerPoint templates will impress their bosses and teams. You can be sure our Circulation PowerPoint templates and PPT Slides are Functional. Customers tell us our illustration of 6 data processes and flows Cycle Arrow PowerPoint templates are specially created by a professional team with vast experience. They diligently strive to come up with the right vehicle for your brilliant Ideas. Professionals tell us our Connection PowerPoint templates and PPT Slides are Graceful. People tell us our illustration of 6 data processes and flows Cycle Arrow PowerPoint templates are Awesome. People tell us our Connection PowerPoint templates and PPT Slides are Spiffy. Examine all possibilities with our Illustration Of 6 Data Processes And Flows Cycle Arrow PowerPoint Templates. Give every option a real close look.
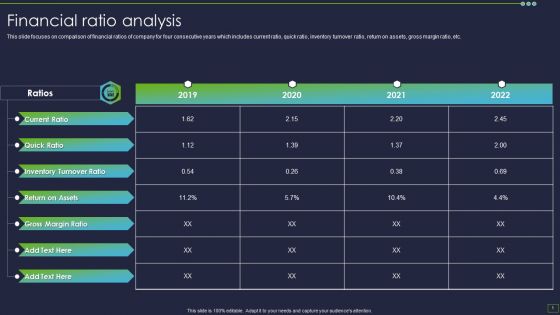
IT Consultancy Services Company Profile Financial Ratio Analysis Diagrams PDF
This slide focuses on comparison of financial ratios of company for four consecutive years which includes current ratio, quick ratio, inventory turnover ratio, return on assets, gross margin ratio, etc. Deliver an awe inspiring pitch with this creative IT Consultancy Services Company Profile Financial Ratio Analysis Diagrams PDF bundle. Topics like Inventory Turnover, Return On Assets, Gross Margin can be discussed with this completely editable template. It is available for immediate download depending on the needs and requirements of the user.
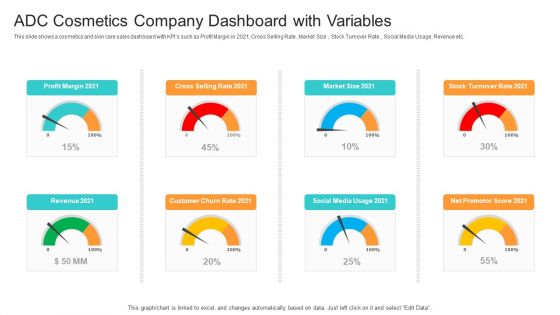
Utilization Of Current Techniques To Improve Efficiency Case Competition ADC Cosmetics Company Dashboard With Variables Diagrams PDF
This slide shows a cosmetics and skin care sales dashboard with KPIs such as Profit Margin in 2021, Cross Selling Rate , Market Size , Stock Turnover Rate , Social Media Usage, Revenue etc.Deliver and pitch your topic in the best possible manner with this utilization of current techniques to improve efficiency case competition adc cosmetics company dashboard with variables diagrams pdf. Use them to share invaluable insights on profit margin 2021, cross selling rate 2021, social media usage 2021 and impress your audience. This template can be altered and modified as per your expectations. So, grab it now.
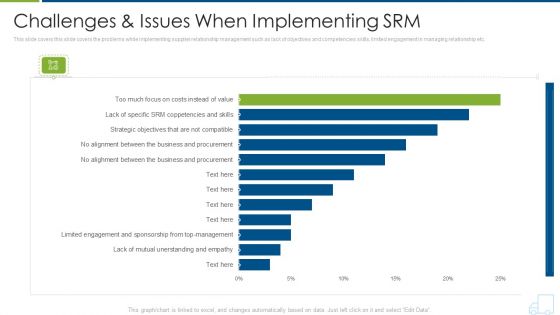
Distributor Strategy Challenges And Issues When Implementing Srm Themes PDF
This slide covers this slide covers the problems while implementing supplier relationship management such as lack of objectives and competencies skills, limited engagement in managing relationship etc. Deliver and pitch your topic in the best possible manner with this distributor strategy challenges and issues when implementing srm themes pdf. Use them to share invaluable insights on management, procurement, value, cost and impress your audience. This template can be altered and modified as per your expectations. So, grab it now.
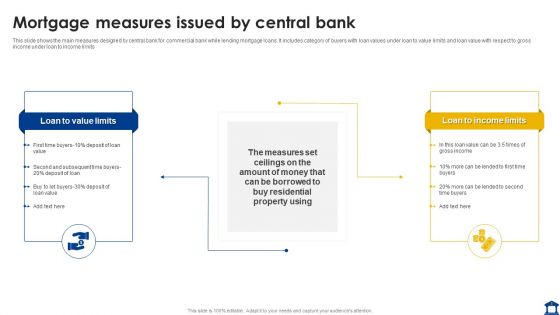
Mortgage Measures Issued By Central Bank Demonstration PDF
This slide shows the main measures designed by central bank for commercial bank while lending mortgage loans. It includes category of buyers with loan values under loan to value limits and loan value with respect to gross income under loan to income limits Presenting Mortgage Measures Issued By Central Bank Demonstration PDF to dispense important information. This template comprises two stages. It also presents valuable insights into the topics including Loan To Value Limits, Loan To Income Limits. This is a completely customizable PowerPoint theme that can be put to use immediately. So, download it and address the topic impactfully.
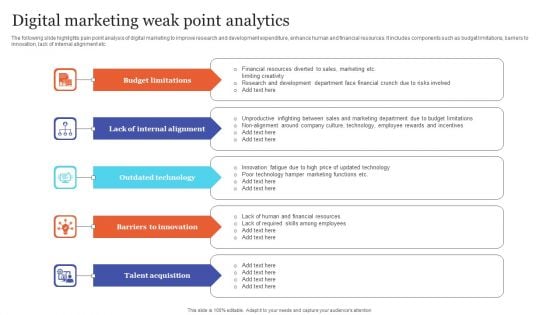
Digital Marketing Weak Point Analytics Themes PDF
The following slide highlights pain point analysis of digital marketing to improve research and development expenditure, enhance human and financial resources. It includes components such as budget limitations, barriers to innovation, lack of internal alignment etc. Presenting Digital Marketing Weak Point Analytics Themes PDF to dispense important information. This template comprises five stages. It also presents valuable insights into the topics including Budget Limitations, Outdated Technology, Talent Acquisition. This is a completely customizable PowerPoint theme that can be put to use immediately. So, download it and address the topic impactfully.
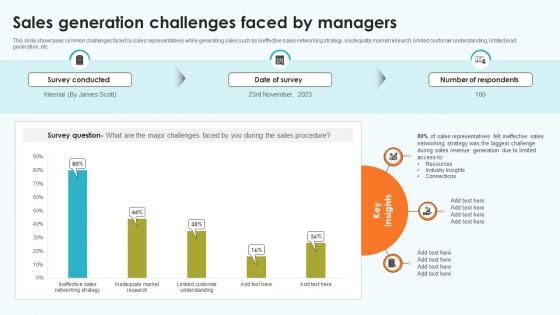
Elevating Sales Networks Sales Generation Challenges Faced By Managers SA SS V
This slide showcases common challenges faced by sales representatives while generating sales such as ineffective sales networking strategy, inadequate market research, limited customer understanding, limited lead generation, etc. Get a simple yet stunning designed Elevating Sales Networks Sales Generation Challenges Faced By Managers SA SS V. It is the best one to establish the tone in your meetings. It is an excellent way to make your presentations highly effective. So, download this PPT today from Slidegeeks and see the positive impacts. Our easy-to-edit Elevating Sales Networks Sales Generation Challenges Faced By Managers SA SS V can be your go-to option for all upcoming conferences and meetings. So, what are you waiting for Grab this template today. This slide showcases common challenges faced by sales representatives while generating sales such as ineffective sales networking strategy, inadequate market research, limited customer understanding, limited lead generation, etc.
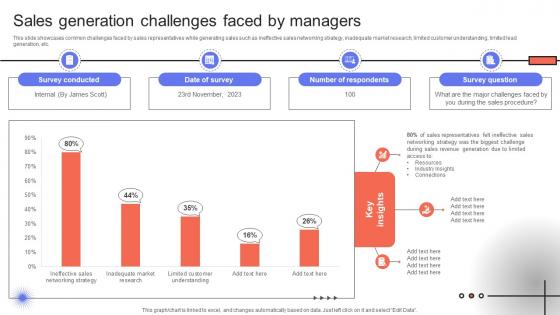
Trade Event Tactics To Boost Sales Generation Challenges Faced By Managers SA SS V
This slide showcases common challenges faced by sales representatives while generating sales such as ineffective sales networking strategy, inadequate market research, limited customer understanding, limited lead generation, etc. Slidegeeks is here to make your presentations a breeze with Trade Event Tactics To Boost Sales Generation Challenges Faced By Managers SA SS V With our easy-to-use and customizable templates, you can focus on delivering your ideas rather than worrying about formatting. With a variety of designs to choose from, you are sure to find one that suits your needs. And with animations and unique photos, illustrations, and fonts, you can make your presentation pop. So whether you are giving a sales pitch or presenting to the board, make sure to check out Slidegeeks first This slide showcases common challenges faced by sales representatives while generating sales such as ineffective sales networking strategy, inadequate market research, limited customer understanding, limited lead generation, etc.
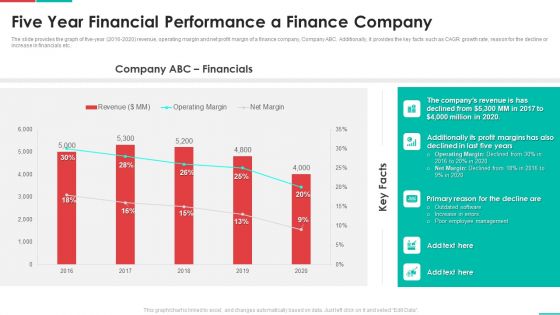
Roadmap For Financial Accounting Transformation Five Year Financial Performance A Finance Company Download PDF
The slide provides the graph of five-year 2016-2020 revenue, operating margin and net profit margin of a finance company, Company ABC. Additionally, it provides the key facts such as CAGR growth rate, reason for the decline or increase in financials etc. Deliver and pitch your topic in the best possible manner with this roadmap for financial accounting transformation five year financial performance a finance company download pdf. Use them to share invaluable insights on revenue, profit margins, management and impress your audience. This template can be altered and modified as per your expectations. So, grab it now.
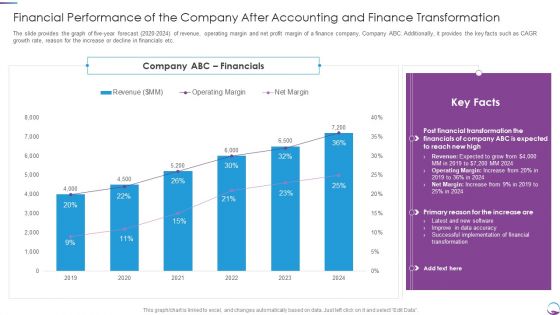
Financial Performance Of The Company After Accounting And Finance Transformation Mockup PDF
The slide provides the graph of five year forecast 2020 to 2024 of revenue, operating margin and net profit margin of a finance company, Company ABC. Additionally, it provides the key facts such as CAGR growth rate, reason for the increase or decline in financials etc. Deliver and pitch your topic in the best possible manner with this Financial Performance Of The Company After Accounting And Finance Transformation Mockup PDF. Use them to share invaluable insights on Financial, Revenue, Margin, Implementation and impress your audience. This template can be altered and modified as per your expectations. So, grab it now.
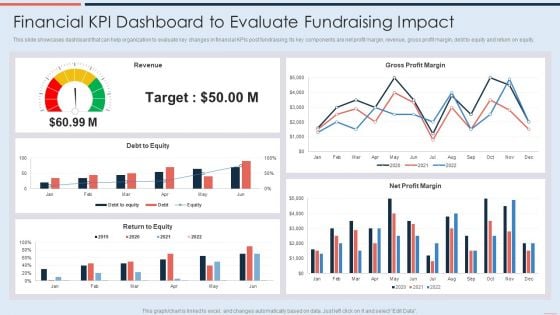
Financial Kpi Dashboard To Evaluate Fundraising Impact Demonstration PDF
This slide showcases dashboard that can help organization to evaluate key changes in financial KPIs post fundraising. Its key components are net profit margin, revenue, gross profit margin, debt to equity and return on equity. Deliver and pitch your topic in the best possible manner with this Financial Kpi Dashboard To Evaluate Fundraising Impact Demonstration PDF. Use them to share invaluable insights on Debt To Equity, Revenue, Gross Profit Margin and impress your audience. This template can be altered and modified as per your expectations. So, grab it now.
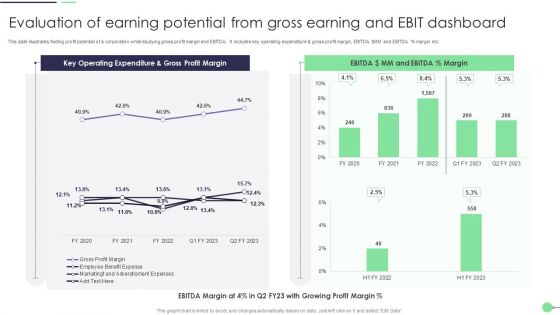
Evaluation Of Earning Potential From Gross Earning And Ebit Dashboard Professional PDF
This slide illustrates finding profit potential of a corporation while studying gross profit margin and EBITDA. It includes key operating expenditure and gross profit margin, EBITDA dollar MM and EBITDA percent margin etc. Showcasing this set of slides titled Evaluation Of Earning Potential From Gross Earning And Ebit Dashboard Professional PDF. The topics addressed in these templates are Evaluation Of Earning Potential, Gross Earning, Ebit Dashboard. All the content presented in this PPT design is completely editable. Download it and make adjustments in color, background, font etc. as per your unique business setting.
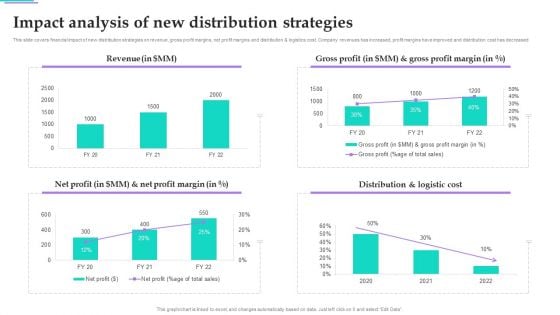
Distribution Strategies For Increasing Impact Analysis Of New Distribution Strategies Elements PDF
This slide covers financial impact of new distribution strategies on revenue, gross profit margins, net profit margins and distribution and logistics cost. Company revenues has increased, profit margins have improved and distribution cost has decreased. The best PPT templates are a great way to save time, energy, and resources. Slidegeeks have 100 percent editable powerpoint slides making them incredibly versatile. With these quality presentation templates, you can create a captivating and memorable presentation by combining visually appealing slides and effectively communicating your message. Download Distribution Strategies For Increasing Impact Analysis Of New Distribution Strategies Elements PDF from Slidegeeks and deliver a wonderful presentation.
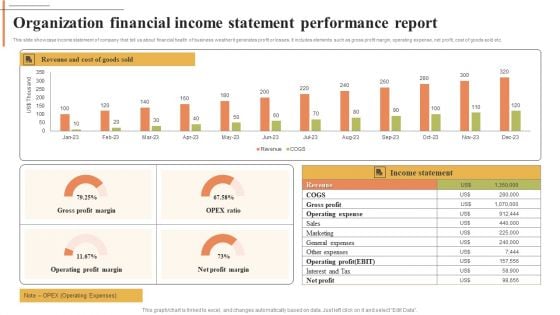
Organization Financial Income Statement Performance Report Structure PDF
This slide showcase income statement of company that tell us about financial health of business weather it generates profit or losses. It includes elements such as gross profit margin, operating expense, net profit, cost of goods sold etc. Showcasing this set of slides titled Organization Financial Income Statement Performance Report Structure PDF. The topics addressed in these templates are Gross Profit Margin, OPEX Ratio, Net Profit Margin. All the content presented in this PPT design is completely editable. Download it and make adjustments in color, background, font etc. as per your unique business setting.
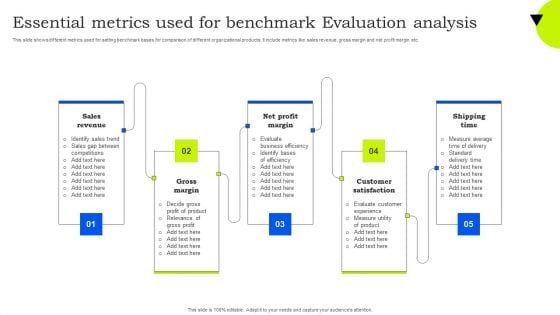
Essential Metrics Used For Benchmark Evaluation Analysis Ideas PDF
This slide shows different metrics used for setting benchmark bases for comparison of different organizational products. It include metrics like sales revenue, gross margin and net profit margin etc. Presenting Essential Metrics Used For Benchmark Evaluation Analysis Ideas PDF to dispense important information. This template comprises five stages. It also presents valuable insights into the topics including Sales Revenue, Gross Margin, Net Profit Margin. This is a completely customizable PowerPoint theme that can be put to use immediately. So, download it and address the topic impactfully.
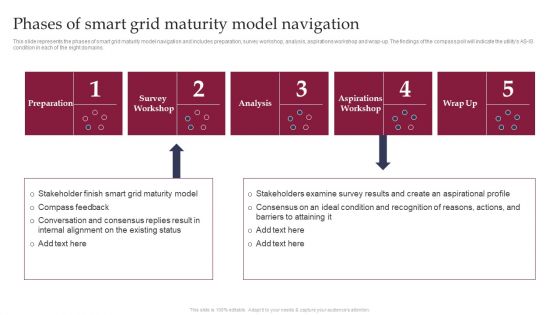
Smart Grid Technology Phases Of Smart Grid Maturity Model Navigation Template PDF

 Home
Home