Editable Icons

Key Components Of Credit Score For Card Approval Swipe Smartly A Practical Guide Fin SS V
This slide shows details about various components included in credit score which can be used by individuals to get more understanding about it. These components are payment history, credit utilization, length of credit history, etc. Presenting this PowerPoint presentation, titled Key Components Of Credit Score For Card Approval Swipe Smartly A Practical Guide Fin SS V, with topics curated by our researchers after extensive research. This editable presentation is available for immediate download and provides attractive features when used. Download now and captivate your audience. Presenting this Key Components Of Credit Score For Card Approval Swipe Smartly A Practical Guide Fin SS V. Our researchers have carefully researched and created these slides with all aspects taken into consideration. This is a completely customizable Key Components Of Credit Score For Card Approval Swipe Smartly A Practical Guide Fin SS V that is available for immediate downloading. Download now and make an impact on your audience. Highlight the attractive features available with our PPTs. This slide shows details about various components included in credit score which can be used by individuals to get more understanding about it. These components are payment history, credit utilization, length of credit history, etc.
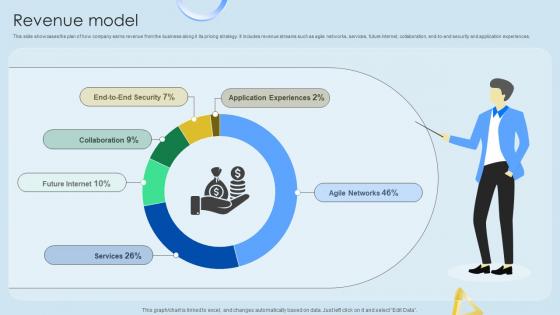
Revenue Model Cloud Networking Service Provider Business Model BMC SS V
This slide showcases the plan of how company earns revenue from the business along it its pricing strategy. It includes revenue streams such as agile networks, services, future internet, collaboration, end-to-end security and application experiences. Find highly impressive Revenue Model Cloud Networking Service Provider Business Model BMC SS V on Slidegeeks to deliver a meaningful presentation. You can save an ample amount of time using these presentation templates. No need to worry to prepare everything from scratch because Slidegeeks experts have already done a huge research and work for you. You need to download Revenue Model Cloud Networking Service Provider Business Model BMC SS V for your upcoming presentation. All the presentation templates are 100 percent editable and you can change the color and personalize the content accordingly. Download now This slide showcases the plan of how company earns revenue from the business along it its pricing strategy. It includes revenue streams such as agile networks, services, future internet, collaboration, end-to-end security and application experiences.

Digital Content Performance Assessment Top Of The Funnel Digital Content Strategy SS V
The following slide depicts key performance indicators of digital content marketing to monitor results. It includes elements such as page views, social shares, click through rate, blog subscribers, conversions, opportunities influenced, average time on page etc. Find highly impressive Digital Content Performance Assessment Top Of The Funnel Digital Content Strategy SS V on Slidegeeks to deliver a meaningful presentation. You can save an ample amount of time using these presentation templates. No need to worry to prepare everything from scratch because Slidegeeks experts have already done a huge research and work for you. You need to download Digital Content Performance Assessment Top Of The Funnel Digital Content Strategy SS V for your upcoming presentation. All the presentation templates are 100 percent editable and you can change the color and personalize the content accordingly. Download now The following slide depicts key performance indicators of digital content marketing to monitor results. It includes elements such as page views, social shares, click through rate, blog subscribers, conversions, opportunities influenced, average time on page etc.
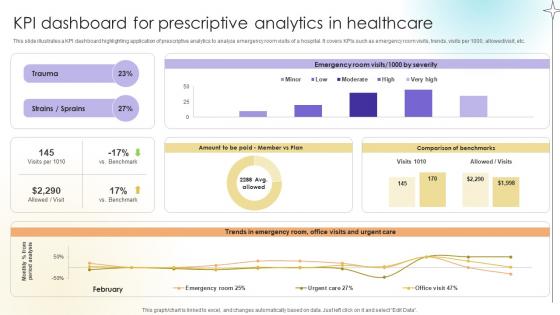
KPI Dashboard For Prescriptive Analytics In Healthcare Data Analytics SS V
This slide illustrates a KPI dashboard highlighting application of prescriptive analytics to analyze emergency room visits of a hospital. It covers KPIs such as emergency room visits, trends, visits per 1000, allowed or visit, etc. Find highly impressive KPI Dashboard For Prescriptive Analytics In Healthcare Data Analytics SS V on Slidegeeks to deliver a meaningful presentation. You can save an ample amount of time using these presentation templates. No need to worry to prepare everything from scratch because Slidegeeks experts have already done a huge research and work for you. You need to download KPI Dashboard For Prescriptive Analytics In Healthcare Data Analytics SS V for your upcoming presentation. All the presentation templates are 100 percent editable and you can change the color and personalize the content accordingly. Download now This slide illustrates a KPI dashboard highlighting application of prescriptive analytics to analyze emergency room visits of a hospital. It covers KPIs such as emergency room visits, trends, visits per 1000, allowed or visit, etc.
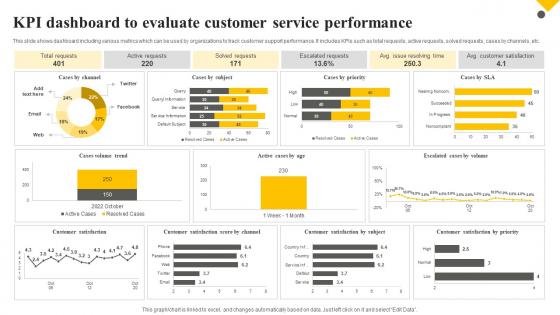
Client Support Plan To Increase Customer Kpi Dashboard To Evaluate Customer Service Performance Strategy SS V
This slide shows dashboard including various metrics which can be used by organizations to track customer support performance. It includes KPIs such as total requests, active requests, solved requests, cases by channels, etc. Find highly impressive Client Support Plan To Increase Customer Kpi Dashboard To Evaluate Customer Service Performance Strategy SS V on Slidegeeks to deliver a meaningful presentation. You can save an ample amount of time using these presentation templates. No need to worry to prepare everything from scratch because Slidegeeks experts have already done a huge research and work for you. You need to download Client Support Plan To Increase Customer Kpi Dashboard To Evaluate Customer Service Performance Strategy SS V for your upcoming presentation. All the presentation templates are 100 percent editable and you can change the color and personalize the content accordingly. Download now This slide shows dashboard including various metrics which can be used by organizations to track customer support performance. It includes KPIs such as total requests, active requests, solved requests, cases by channels, etc.
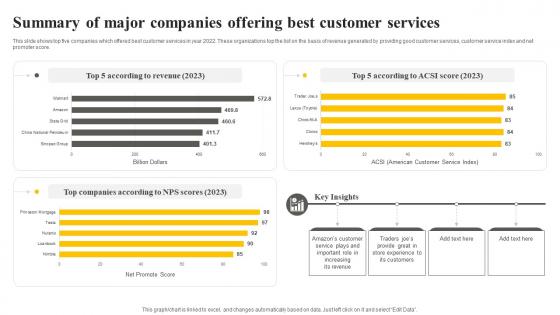
Client Support Plan To Increase Customer Summary Of Major Companies Offering Best Customer Strategy SS V
This slide shows top five companies which offered best customer services in year 2022. These organizations top the list on the basis of revenue generated by providing good customer services, customer service index and net promoter score. Presenting this PowerPoint presentation, titled Client Support Plan To Increase Customer Summary Of Major Companies Offering Best Customer Strategy SS V, with topics curated by our researchers after extensive research. This editable presentation is available for immediate download and provides attractive features when used. Download now and captivate your audience. Presenting this Client Support Plan To Increase Customer Summary Of Major Companies Offering Best Customer Strategy SS V. Our researchers have carefully researched and created these slides with all aspects taken into consideration. This is a completely customizable Client Support Plan To Increase Customer Summary Of Major Companies Offering Best Customer Strategy SS V that is available for immediate downloading. Download now and make an impact on your audience. Highlight the attractive features available with our PPTs. This slide shows top five companies which offered best customer services in year 2022. These organizations top the list on the basis of revenue generated by providing good customer services, customer service index and net promoter score.
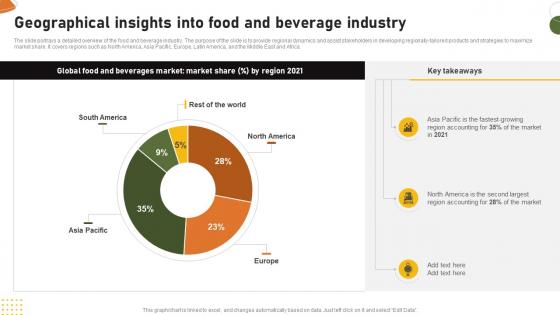
Food And Drink Industry Report Geographical Insights Into Food And Beverage Industry IR SS V
The slide portrays a detailed overview of the food and beverage industry. The purpose of the slide is to provide regional dynamics and assist stakeholders in developing regionally-tailored products and strategies to maximize market share. It covers regions such as North America, Asia Pacific, Europe, Latin America, and the Middle East and Africa. Find highly impressive Food And Drink Industry Report Geographical Insights Into Food And Beverage Industry IR SS V on Slidegeeks to deliver a meaningful presentation. You can save an ample amount of time using these presentation templates. No need to worry to prepare everything from scratch because Slidegeeks experts have already done a huge research and work for you. You need to download Food And Drink Industry Report Geographical Insights Into Food And Beverage Industry IR SS V for your upcoming presentation. All the presentation templates are 100 percent editable and you can change the color and personalize the content accordingly. Download now The slide portrays a detailed overview of the food and beverage industry. The purpose of the slide is to provide regional dynamics and assist stakeholders in developing regionally-tailored products and strategies to maximize market share. It covers regions such as North America, Asia Pacific, Europe, Latin America, and the Middle East and Africa.
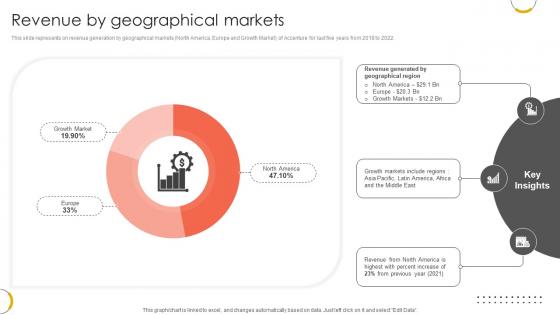
Revenue By Geographical Markets Professional Services And Technology Consulting Ppt Template CP SS V
This slide represents on revenue generation by geographical markets North America, Europe and Growth Market of Accenture for last five years from 2018 to 2022. Presenting this PowerPoint presentation, titled Revenue By Geographical Markets Professional Services And Technology Consulting Ppt Template CP SS V, with topics curated by our researchers after extensive research. This editable presentation is available for immediate download and provides attractive features when used. Download now and captivate your audience. Presenting this Revenue By Geographical Markets Professional Services And Technology Consulting Ppt Template CP SS V. Our researchers have carefully researched and created these slides with all aspects taken into consideration. This is a completely customizable Revenue By Geographical Markets Professional Services And Technology Consulting Ppt Template CP SS V that is available for immediate downloading. Download now and make an impact on your audience. Highlight the attractive features available with our PPTs. This slide represents on revenue generation by geographical markets North America, Europe and Growth Market of Accenture for last five years from 2018 to 2022.
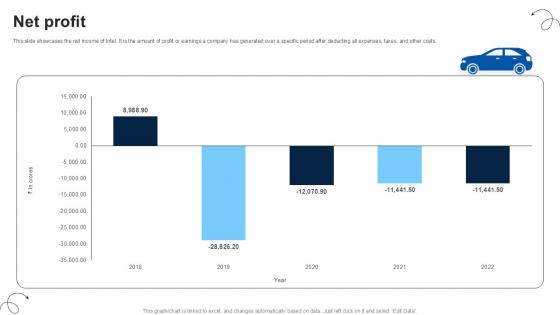
Net Profit Luxury Automobile Vehicles PPT Presentation CP SS V
This slide showcases the net income of Intel. It is the amount of profit or earnings a company has generated over a specific period after deducting all expenses, taxes, and other costs. Presenting this PowerPoint presentation, titled Net Profit Luxury Automobile Vehicles PPT Presentation CP SS V, with topics curated by our researchers after extensive research. This editable presentation is available for immediate download and provides attractive features when used. Download now and captivate your audience. Presenting this Net Profit Luxury Automobile Vehicles PPT Presentation CP SS V. Our researchers have carefully researched and created these slides with all aspects taken into consideration. This is a completely customizable Net Profit Luxury Automobile Vehicles PPT Presentation CP SS V that is available for immediate downloading. Download now and make an impact on your audience. Highlight the attractive features available with our PPTs. This slide showcases the net income of Intel. It is the amount of profit or earnings a company has generated over a specific period after deducting all expenses, taxes, and other costs.
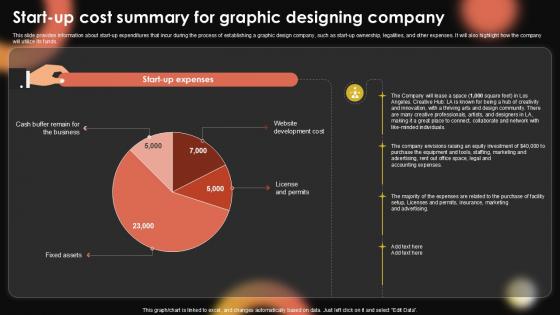
Start Up Cost Summary For Graphic Sample Pentagram Business Plan PPT Sample BP SS V
This slide provides information about start-up expenditures that incur during the process of establishing a graphic design company, such as start-up ownership, legalities, and other expenses. It will also highlight how the company will utilize its funds. Presenting this PowerPoint presentation, titled Start Up Cost Summary For Graphic Sample Pentagram Business Plan PPT Sample BP SS V, with topics curated by our researchers after extensive research. This editable presentation is available for immediate download and provides attractive features when used. Download now and captivate your audience. Presenting this Start Up Cost Summary For Graphic Sample Pentagram Business Plan PPT Sample BP SS V. Our researchers have carefully researched and created these slides with all aspects taken into consideration. This is a completely customizable Start Up Cost Summary For Graphic Sample Pentagram Business Plan PPT Sample BP SS V that is available for immediate downloading. Download now and make an impact on your audience. Highlight the attractive features available with our PPTs. This slide provides information about start-up expenditures that incur during the process of establishing a graphic design company, such as start-up ownership, legalities, and other expenses. It will also highlight how the company will utilize its funds.
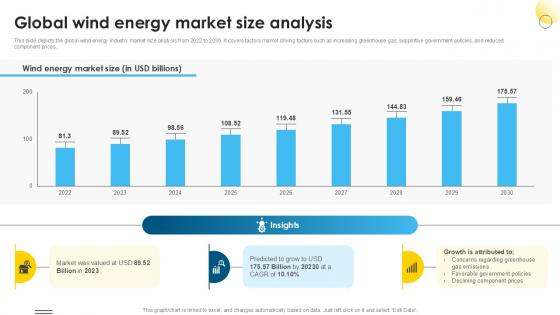
Global Wind Energy Market Size Global Wind Power Market PPT Slide IR SS V
This slide depicts the global wind energy industry market size analysis from 2022 to 2030. It covers factors market driving factors such as increasing greenhouse gas, supportive government policies, and reduced component prices. Find highly impressive Global Wind Energy Market Size Global Wind Power Market PPT Slide IR SS V on Slidegeeks to deliver a meaningful presentation. You can save an ample amount of time using these presentation templates. No need to worry to prepare everything from scratch because Slidegeeks experts have already done a huge research and work for you. You need to download Global Wind Energy Market Size Global Wind Power Market PPT Slide IR SS V for your upcoming presentation. All the presentation templates are 100 percent editable and you can change the color and personalize the content accordingly. Download now This slide depicts the global wind energy industry market size analysis from 2022 to 2030. It covers factors market driving factors such as increasing greenhouse gas, supportive government policies, and reduced component prices.
Tracking First Response Time Improving Customer Retention PPT Presentation
The following slide depicts key performance indicators to review call resolution time and offer real time support. It also includes elements such as unsolved calls, weekly response time analysis, best day to call etc. Presenting this PowerPoint presentation, titled Tracking First Response Time Improving Customer Retention PPT Presentation, with topics curated by our researchers after extensive research. This editable presentation is available for immediate download and provides attractive features when used. Download now and captivate your audience. Presenting this Tracking First Response Time Improving Customer Retention PPT Presentation. Our researchers have carefully researched and created these slides with all aspects taken into consideration. This is a completely customizable Tracking First Response Time Improving Customer Retention PPT Presentation that is available for immediate downloading. Download now and make an impact on your audience. Highlight the attractive features available with our PPTs. The following slide depicts key performance indicators to review call resolution time and offer real time support. It also includes elements such as unsolved calls, weekly response time analysis, best day to call etc.
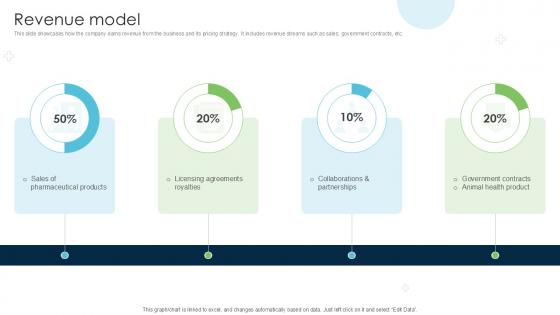
Revenue Model Strategies Driving Business Triumph Through Pfizer PPT Template BMC SS V
This slide showcases how the company earns revenue from the business and its pricing strategy. It includes revenue streams such as sales, government contracts, etc. Presenting this PowerPoint presentation, titled Revenue Model Strategies Driving Business Triumph Through Pfizer PPT Template BMC SS V, with topics curated by our researchers after extensive research. This editable presentation is available for immediate download and provides attractive features when used. Download now and captivate your audience. Presenting this Revenue Model Strategies Driving Business Triumph Through Pfizer PPT Template BMC SS V. Our researchers have carefully researched and created these slides with all aspects taken into consideration. This is a completely customizable Revenue Model Strategies Driving Business Triumph Through Pfizer PPT Template BMC SS V that is available for immediate downloading. Download now and make an impact on your audience. Highlight the attractive features available with our PPTs. This slide showcases how the company earns revenue from the business and its pricing strategy. It includes revenue streams such as sales, government contracts, etc.
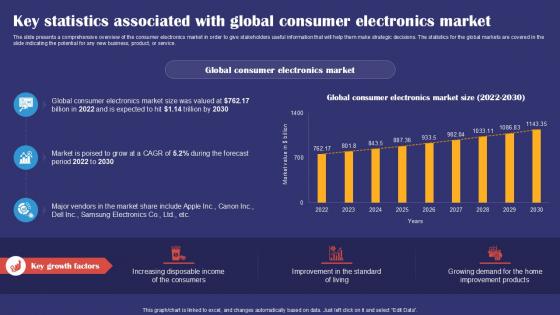
Key Statistics Associated With Global Consumer Electronics Smartphones Industry Report PPT PowerPoint IR SS V
The slide presents a comprehensive overview of the consumer electronics market in order to give stakeholders useful information that will help them make strategic decisions. The statistics for the global markets are covered in the slide indicating the potential for any new business, product, or service. Find highly impressive Key Statistics Associated With Global Consumer Electronics Smartphones Industry Report PPT PowerPoint IR SS V on Slidegeeks to deliver a meaningful presentation. You can save an ample amount of time using these presentation templates. No need to worry to prepare everything from scratch because Slidegeeks experts have already done a huge research and work for you. You need to download Key Statistics Associated With Global Consumer Electronics Smartphones Industry Report PPT PowerPoint IR SS V for your upcoming presentation. All the presentation templates are 100 percent editable and you can change the color and personalize the content accordingly. Download now The slide presents a comprehensive overview of the consumer electronics market in order to give stakeholders useful information that will help them make strategic decisions. The statistics for the global markets are covered in the slide indicating the potential for any new business, product, or service.
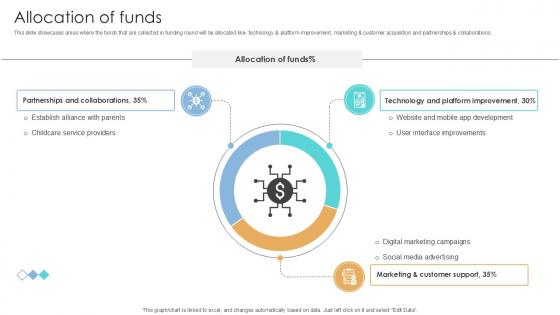
Allocation Of Funds Online Marketplace Investor Funding Elevator Pitch Deck Ppt Sample
This slide showcases areas where the funds that are collected in funding round will be allocated like- technology and platform improvement, marketing and customer acquisition and partnerships and collaborations. Presenting this PowerPoint presentation, titled Allocation Of Funds Online Marketplace Investor Funding Elevator Pitch Deck Ppt Sample with topics curated by our researchers after extensive research. This editable presentation is available for immediate download and provides attractive features when used. Download now and captivate your audience. Presenting this Allocation Of Funds Online Marketplace Investor Funding Elevator Pitch Deck Ppt Sample Our researchers have carefully researched and created these slides with all aspects taken into consideration. This is a completely customizable Allocation Of Funds Online Marketplace Investor Funding Elevator Pitch Deck Ppt Sample that is available for immediate downloading. Download now and make an impact on your audience. Highlight the attractive features available with our PPTs. This slide showcases areas where the funds that are collected in funding round will be allocated like- technology and platform improvement, marketing and customer acquisition and partnerships and collaborations.
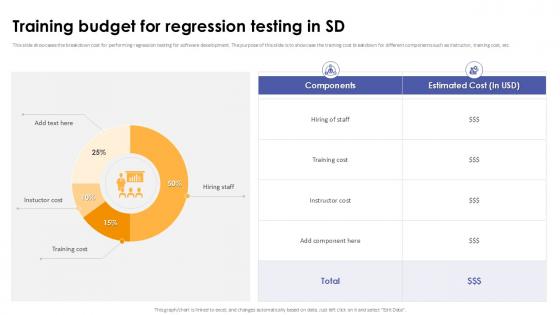
Training Budget For Regression Testing In Sd Corrective Regression Testing Ppt Powerpoint
This slide showcases the breakdown cost for performing regression testing for software development. The purpose of this slide is to showcase the training cost breakdown for different components such as instructor, training cost, etc. Presenting this PowerPoint presentation, titled Training Budget For Regression Testing In Sd Corrective Regression Testing Ppt Powerpoint with topics curated by our researchers after extensive research. This editable presentation is available for immediate download and provides attractive features when used. Download now and captivate your audience. Presenting this Training Budget For Regression Testing In Sd Corrective Regression Testing Ppt Powerpoint Our researchers have carefully researched and created these slides with all aspects taken into consideration. This is a completely customizable Training Budget For Regression Testing In Sd Corrective Regression Testing Ppt Powerpoint that is available for immediate downloading. Download now and make an impact on your audience. Highlight the attractive features available with our PPTs. This slide showcases the breakdown cost for performing regression testing for software development. The purpose of this slide is to showcase the training cost breakdown for different components such as instructor, training cost, etc.
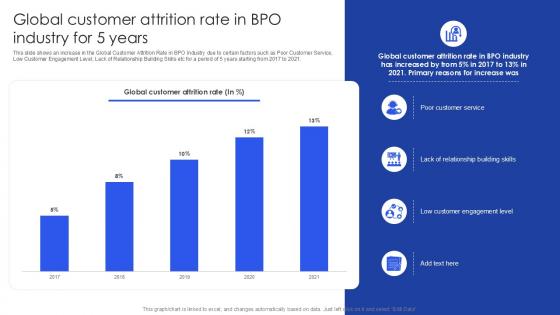
Global Customer Attrition Rate In BPO Industry For 5 Years PPT PowerPoint SS
This slide shows an increase in the Global Customer Attrition Rate in BPO Industry due to certain factors such as Poor Customer Service, Low Customer Engagement Level, Lack of Relationship Building Skills etc for a period of 5 years starting from 2017 to 2021. Find highly impressive Global Customer Attrition Rate In BPO Industry For 5 Years PPT PowerPoint SS on Slidegeeks to deliver a meaningful presentation. You can save an ample amount of time using these presentation templates. No need to worry to prepare everything from scratch because Slidegeeks experts have already done a huge research and work for you. You need to download Global Customer Attrition Rate In BPO Industry For 5 Years PPT PowerPoint SS for your upcoming presentation. All the presentation templates are 100 percent editable and you can change the color and personalize the content accordingly. Download now This slide shows an increase in the Global Customer Attrition Rate in BPO Industry due to certain factors such as Poor Customer Service, Low Customer Engagement Level, Lack of Relationship Building Skills etc for a period of 5 years starting from 2017 to 2021.
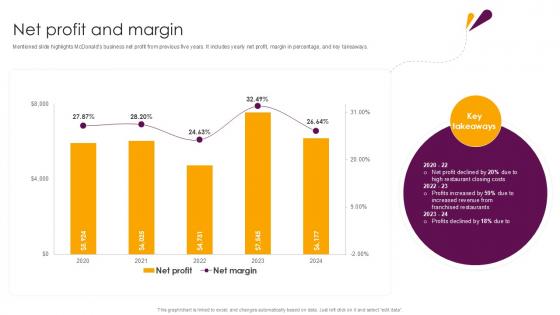
Net Profit And Margin Food And Beverages Company Profile Ppt Template CP SS V
Mentioned slide highlights McDonalds business net profit from previous five years. It includes yearly net profit, margin in percentage, and key takeaways. Presenting this PowerPoint presentation, titled Net Profit And Margin Food And Beverages Company Profile Ppt Template CP SS V with topics curated by our researchers after extensive research. This editable presentation is available for immediate download and provides attractive features when used. Download now and captivate your audience. Presenting this Net Profit And Margin Food And Beverages Company Profile Ppt Template CP SS V Our researchers have carefully researched and created these slides with all aspects taken into consideration. This is a completely customizable Net Profit And Margin Food And Beverages Company Profile Ppt Template CP SS V that is available for immediate downloading. Download now and make an impact on your audience. Highlight the attractive features available with our PPTs. Mentioned slide highlights McDonalds business net profit from previous five years. It includes yearly net profit, margin in percentage, and key takeaways.
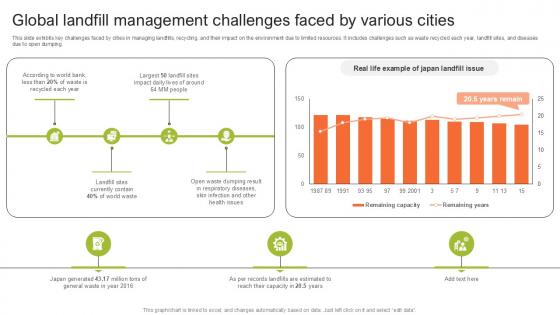
Global Landfill Management Step By Step Guide For Electronic Ppt PowerPoint
This slide exhibits key challenges faced by cities in managing landfills, recycling, and their impact on the environment due to limited resources. It includes challenges such as waste recycled each year, landfill sites, and diseases due to open dumping. Find highly impressive Global Landfill Management Step By Step Guide For Electronic Ppt PowerPoint on Slidegeeks to deliver a meaningful presentation. You can save an ample amount of time using these presentation templates. No need to worry to prepare everything from scratch because Slidegeeks experts have already done a huge research and work for you. You need to download Global Landfill Management Step By Step Guide For Electronic Ppt PowerPoint for your upcoming presentation. All the presentation templates are 100 percent editable and you can change the color and personalize the content accordingly. Download now This slide exhibits key challenges faced by cities in managing landfills, recycling, and their impact on the environment due to limited resources. It includes challenges such as waste recycled each year, landfill sites, and diseases due to open dumping.
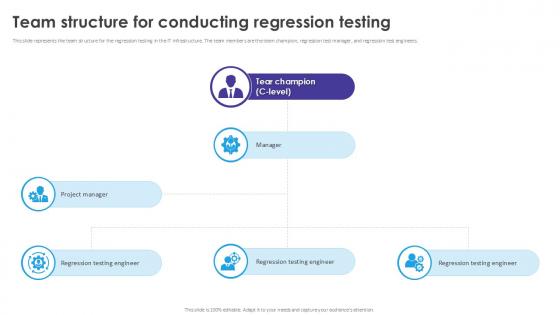
Team Structure For Conducting Automated Regression Testing And Achieving PPT Example
This slide represents the team structure for the regression testing in the IT infrastructure. The team members are the team champion, regression test manager, and regression test engineers. Presenting this PowerPoint presentation, titled Team Structure For Conducting Automated Regression Testing And Achieving PPT Example with topics curated by our researchers after extensive research. This editable presentation is available for immediate download and provides attractive features when used. Download now and captivate your audience. Presenting this Team Structure For Conducting Automated Regression Testing And Achieving PPT Example Our researchers have carefully researched and created these slides with all aspects taken into consideration. This is a completely customizable Team Structure For Conducting Automated Regression Testing And Achieving PPT Example that is available for immediate downloading. Download now and make an impact on your audience. Highlight the attractive features available with our PPTs. This slide represents the team structure for the regression testing in the IT infrastructure. The team members are the team champion, regression test manager, and regression test engineers.
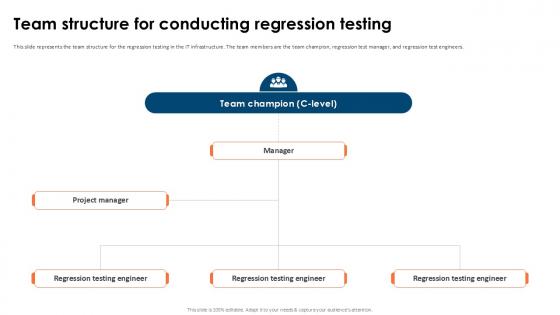
Team Structure For Conducting Partial Regression Testing For A Best PPT Template
This slide represents the team structure for the regression testing in the IT infrastructure. The team members are the team champion, regression test manager, and regression test engineers. Presenting this PowerPoint presentation, titled Team Structure For Conducting Partial Regression Testing For A Best PPT Template with topics curated by our researchers after extensive research. This editable presentation is available for immediate download and provides attractive features when used. Download now and captivate your audience. Presenting this Team Structure For Conducting Partial Regression Testing For A Best PPT Template Our researchers have carefully researched and created these slides with all aspects taken into consideration. This is a completely customizable Team Structure For Conducting Partial Regression Testing For A Best PPT Template that is available for immediate downloading. Download now and make an impact on your audience. Highlight the attractive features available with our PPTs. This slide represents the team structure for the regression testing in the IT infrastructure. The team members are the team champion, regression test manager, and regression test engineers.

Major Strategic Options To Solve Effective Strategies To Succeed At Virtual Ppt Slide SA SS V
Purpose of this slide is to analyze key options that company should consider to solve issues and increase sales revenue. Presenting this PowerPoint presentation, titled Major Strategic Options To Solve Effective Strategies To Succeed At Virtual Ppt Slide SA SS V, with topics curated by our researchers after extensive research. This editable presentation is available for immediate download and provides attractive features when used. Download now and captivate your audience. Presenting this Major Strategic Options To Solve Effective Strategies To Succeed At Virtual Ppt Slide SA SS V. Our researchers have carefully researched and created these slides with all aspects taken into consideration. This is a completely customizable Major Strategic Options To Solve Effective Strategies To Succeed At Virtual Ppt Slide SA SS V that is available for immediate downloading. Download now and make an impact on your audience. Highlight the attractive features available with our PPTs. Purpose of this slide is to analyze key options that company should consider to solve issues and increase sales revenue.
Tracking First Response Time Enhancing Customer Experience Ppt Presentation
The following slide depicts key performance indicators to review call resolution time and offer real time support. It also includes elements such as unsolved calls, weekly response time analysis, best day to call etc. Presenting this PowerPoint presentation, titled Tracking First Response Time Enhancing Customer Experience Ppt Presentation, with topics curated by our researchers after extensive research. This editable presentation is available for immediate download and provides attractive features when used. Download now and captivate your audience. Presenting this Tracking First Response Time Enhancing Customer Experience Ppt Presentation. Our researchers have carefully researched and created these slides with all aspects taken into consideration. This is a completely customizable Tracking First Response Time Enhancing Customer Experience Ppt Presentation that is available for immediate downloading. Download now and make an impact on your audience. Highlight the attractive features available with our PPTs. The following slide depicts key performance indicators to review call resolution time and offer real time support. It also includes elements such as unsolved calls, weekly response time analysis, best day to call etc.
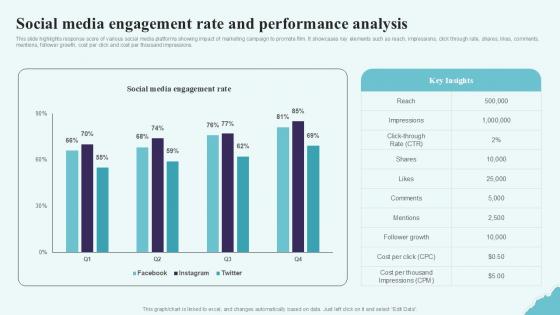
Social Media Engagement Rate And Strategic Plan To Increase Film Ppt Powerpoint Strategy SS V
This slide highlights response score of various social media platforms showing impact of marketing campaign to promote film. It showcases key elements such as reach, impressions, click through rate, shares, likes, comments, mentions, follower growth, cost per click and cost per thousand impressions. Find highly impressive Social Media Engagement Rate And Strategic Plan To Increase Film Ppt Powerpoint Strategy SS V on Slidegeeks to deliver a meaningful presentation. You can save an ample amount of time using these presentation templates. No need to worry to prepare everything from scratch because Slidegeeks experts have already done a huge research and work for you. You need to download Social Media Engagement Rate And Strategic Plan To Increase Film Ppt Powerpoint Strategy SS V for your upcoming presentation. All the presentation templates are 100 percent editable and you can change the color and personalize the content accordingly. Download now This slide highlights response score of various social media platforms showing impact of marketing campaign to promote film. It showcases key elements such as reach, impressions, click through rate, shares, likes, comments, mentions, follower growth, cost per click and cost per thousand impressions.
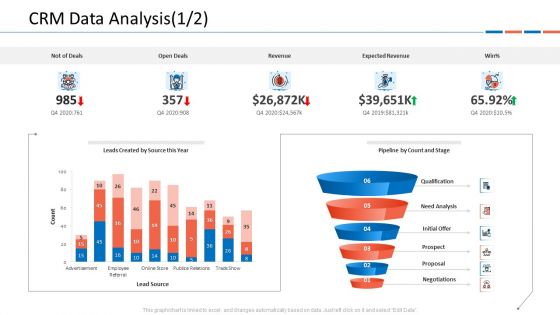
Customer Relationship Management Dashboard CRM Data Analysis Deals Ideas PDF
This graph or chart is linked to excel, and changes automatically based on data. Just left click on it and select Edit Data.Deliver and pitch your topic in the best possible manner with this customer relationship management dashboard crm data analysis deals ideas pdf. Use them to share invaluable insights on v and impress your audience. This template can be altered and modified as per your expectations. So, grab it now.
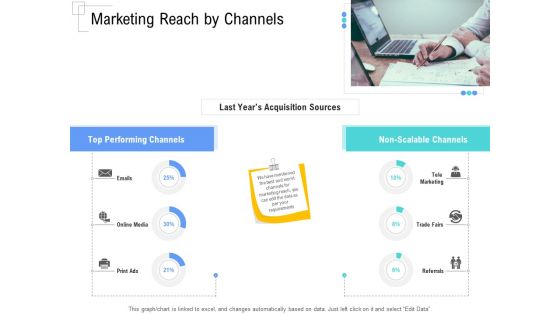
Managing Customer Experience Marketing Reach By Channels Elements PDF
This graph or chart is linked to excel, and changes automatically based on data. Just left click on it and select Edit Data.Deliver and pitch your topic in the best possible manner with this managing customer experience marketing reach by channels elements pdf. Use them to share invaluable insights on last years acquisition sources, top performing channels, non scalable channels and impress your audience. This template can be altered and modified as per your expectations. So, grab it now.
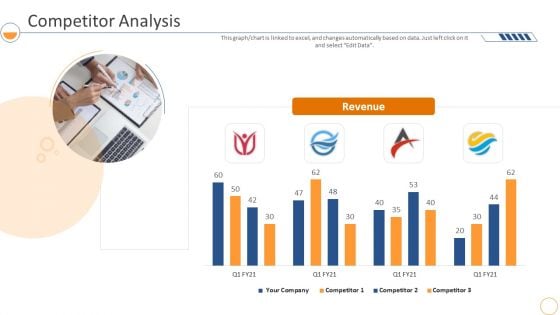
Monthly Company Performance Analysiscompetitor Analysis Pictures PDF
This graph or chart is linked to excel, and changes automatically based on data. Just left click on it and select Edit Data. Deliver and pitch your topic in the best possible manner with this monthly company performance analysiscompetitor analysis pictures pdf. Use them to share invaluable insights on revenue, competitor analysis and impress your audience. This template can be altered and modified as per your expectations. So, grab it now.
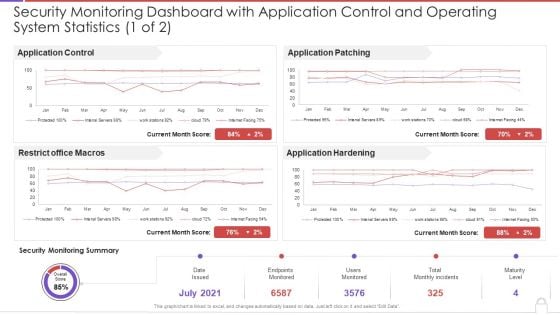
Security Monitoring Dashboard With Application Control And Operating System Statistics Template PDF
This graph or chart is linked to excel, and changes automatically based on data. Just left click on it and select Edit Data. Deliver and pitch your topic in the best possible manner with this security monitoring dashboard with application control and operating system statistics template pdf. Use them to share invaluable insights on application control, restrict office macros, application patching, application hardening and impress your audience. This template can be altered and modified as per your expectations. So, grab it now.
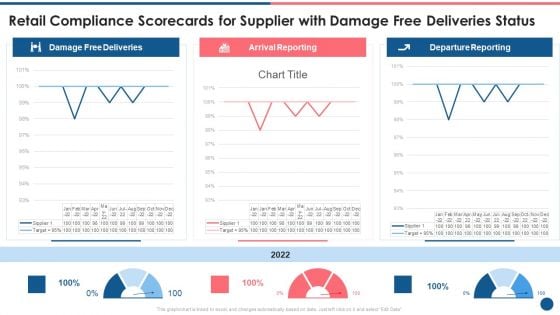
Supplier Scorecard Retail Compliance Scorecards For Supplier With Damage Free Deliveries Status Sample PDF
This graph or chart is linked to excel, and changes automatically based on data. Just left click on it and select Edit Data. Deliver and pitch your topic in the best possible manner with this supplier scorecard retail compliance scorecards for supplier with damage free deliveries status sample pdf. Use them to share invaluable insights on damage free deliveries, arrival reporting, departure reporting and impress your audience. This template can be altered and modified as per your expectations. So, grab it now.
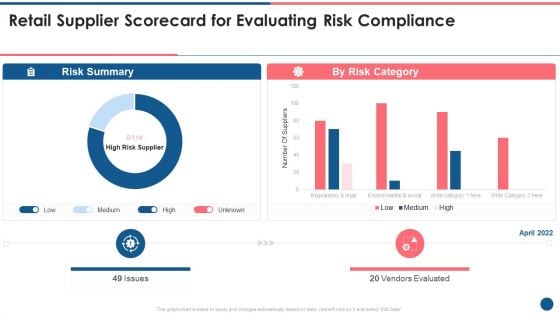
Supplier Scorecard Retail Supplier Scorecard For Evaluating Risk Compliance Clipart PDF
This graph or chart is linked to excel, and changes automatically based on data. Just left click on it and select Edit Data. Deliver and pitch your topic in the best possible manner with this supplier scorecard retail supplier scorecard for evaluating risk compliance clipart pdf. Use them to share invaluable insights on risk summary, risk category, vendors evaluated, low, medium, high and impress your audience. This template can be altered and modified as per your expectations. So, grab it now.
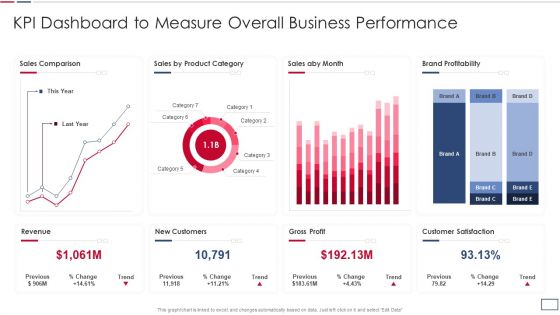
Software Developer Playbook Kpi Dashboard To Measure Overall Business Performance Topics PDF
This graph or chart is linked to excel, and changes automatically based on data. Just left click on it and select Edit Data. Deliver and pitch your topic in the best possible manner with this software developer playbook kpi dashboard to measure overall business performance topics pdf. Use them to share invaluable insights on revenue new customers, gross profit, customer satisfaction, sales comparison and impress your audience. This template can be altered and modified as per your expectations. So, grab it now.
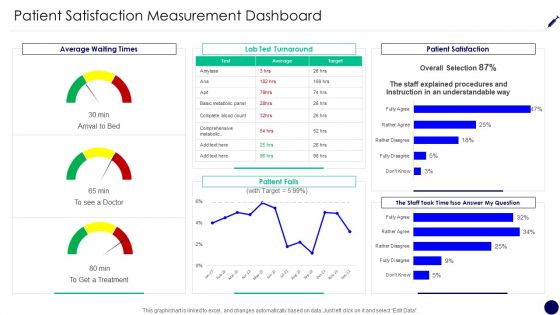
Consumer Retention Techniques Patient Satisfaction Measurement Dashboard Rules PDF
This graph or chart is linked to excel, and changes automatically based on data. Just left click on it and select Edit Data. Deliver and pitch your topic in the best possible manner with this consumer retention techniques patient satisfaction measurement dashboard rules pdf. Use them to share invaluable insights on average waiting times, lab test turnaround, patient satisfaction, patient falls and impress your audience. This template can be altered and modified as per your expectations. So, grab it now.
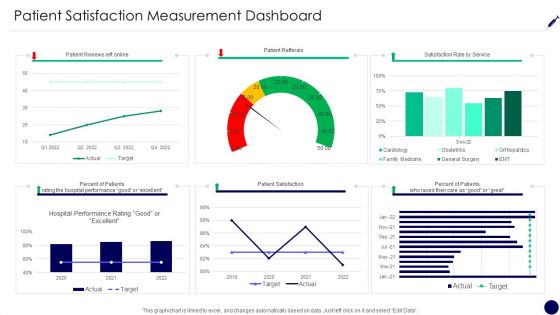
Patient Satisfaction Measurement Dashboard Consumer Retention Techniques Summary PDF
This graph or chart is linked to excel, and changes automatically based on data. Just left click on it and select Edit Data. Deliver and pitch your topic in the best possible manner with this patient satisfaction measurement dashboard consumer retention techniques summary pdf. Use them to share invaluable insights on patient reviews left online, patient refferals, satisfaction rate service, percent patients and impress your audience. This template can be altered and modified as per your expectations. So, grab it now.
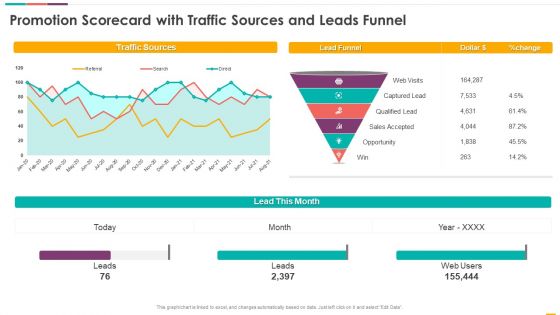
Promotion Scorecard With Traffic Sources And Leads Funnel Ppt Layouts Background PDF
This graph or chart is linked to excel, and changes automatically based on data. Just left click on it and select Edit Data. Deliver and pitch your topic in the best possible manner with this promotion scorecard with traffic sources and leads funnel ppt layouts background pdf. Use them to share invaluable insights on lead month, lead funnel, dollar, traffic sources and impress your audience. This template can be altered and modified as per your expectations. So, grab it now.
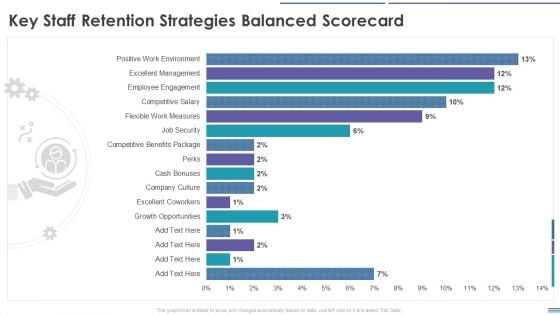
Staff Retention Balanced Scorecard Key Staff Retention Strategies Balanced Scorecard Rules PDF
This graph or chart is linked to excel, and changes automatically based on data. Just left click on it and select Edit Data. Deliver and pitch your topic in the best possible manner with this Staff Retention Balanced Scorecard Key Staff Retention Strategies Balanced Scorecard Rules PDF. Use them to share invaluable insights on Growth Opportunities, Excellent Coworkers, Company Culture, Excellent Management and impress your audience. This template can be altered and modified as per your expectations. So, grab it now.
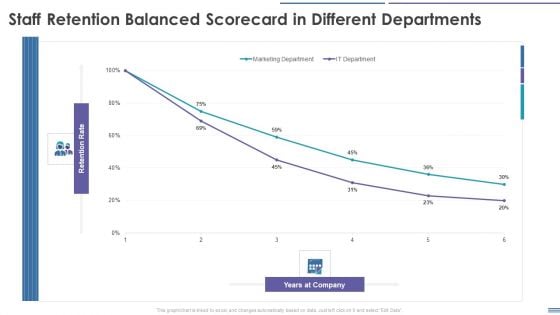
Staff Retention Balanced Scorecard Staff Retention Balanced Scorecard In Different Departments Template PDF
This graph or chart is linked to excel, and changes automatically based on data. Just left click on it and select Edit Data. Deliver and pitch your topic in the best possible manner with this Staff Retention Balanced Scorecard Staff Retention Balanced Scorecard In Different Departments Template PDF. Use them to share invaluable insights on Marketing Department, IT Department and impress your audience. This template can be altered and modified as per your expectations. So, grab it now.
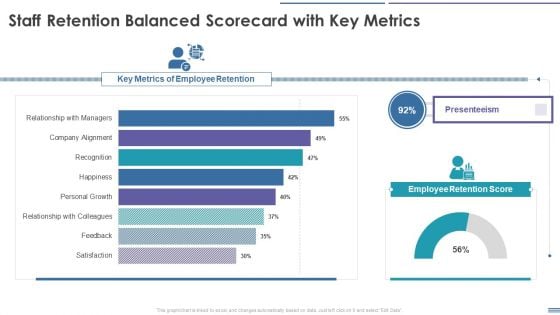
Staff Retention Balanced Scorecard Staff Retention Balanced Scorecard With Key Metrics Demonstration PDF
This graph or chart is linked to excel, and changes automatically based on data. Just left click on it and select Edit Data. Deliver and pitch your topic in the best possible manner with this Staff Retention Balanced Scorecard Staff Retention Balanced Scorecard With Key Metrics Demonstration PDF. Use them to share invaluable insights on Key Metrics Of Employee Retention, Presenteeism, Employee Retention Score and impress your audience. This template can be altered and modified as per your expectations. So, grab it now.
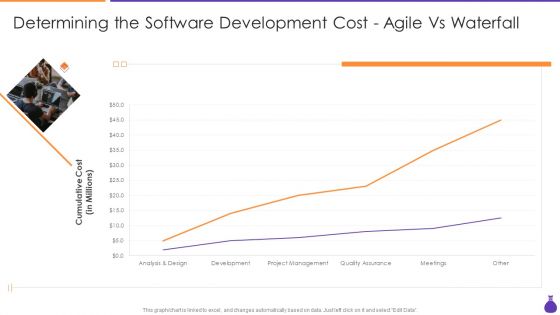
Why Is Agile Cost Effective IT Determining The Software Development Cost Agile Demonstration PDF
This graph or chart is linked to excel, and changes automatically based on data. Just left click on it and select Edit Data. Deliver and pitch your topic in the best possible manner with this Why Is Agile Cost Effective IT Determining The Software Development Cost Agile Demonstration PDF. Use them to share invaluable insights on Analysis And Design, Development, Project Management, Quality Assurance and impress your audience. This template can be altered and modified as per your expectations. So, grab it now.
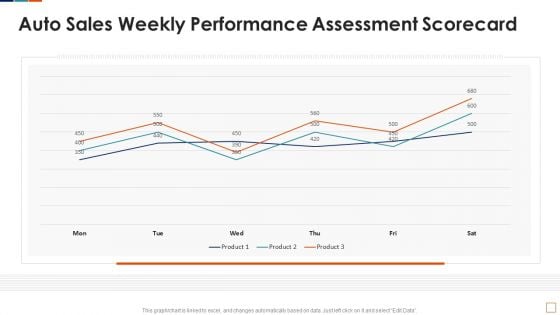
Auto Sales Weekly Performance Assessment Scorecard Background PDF
This graph or chart is linked to excel, and changes automatically based on data. Just left click on it and select Edit Data. Deliver and pitch your topic in the best possible manner with this Auto Sales Weekly Performance Assessment Scorecard Background PDF. Use them to share invaluable insights on Auto Sales Weekly, Performance Assessment Scorecard and impress your audience. This template can be altered and modified as per your expectations. So, grab it now.
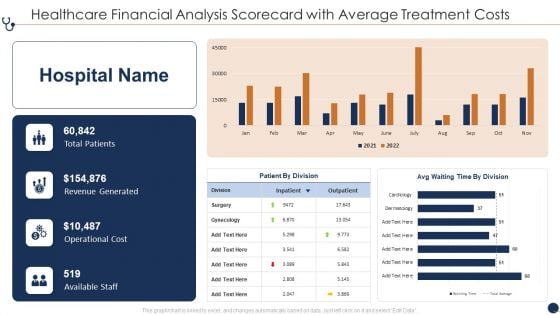
Healthcare Financial Analysis Scorecard With Average Treatment Costs Ppt Gallery Inspiration PDF
This graph or chart is linked to excel, and changes automatically based on data. Just left click on it and select Edit Data. Deliver and pitch your topic in the best possible manner with this Healthcare Financial Analysis Scorecard With Average Treatment Costs Ppt Gallery Inspiration PDF. Use them to share invaluable insights on Total Patients Revenue, Generated Operational Cost, Available Staff Outpatient and impress your audience. This template can be altered and modified as per your expectations. So, grab it now.
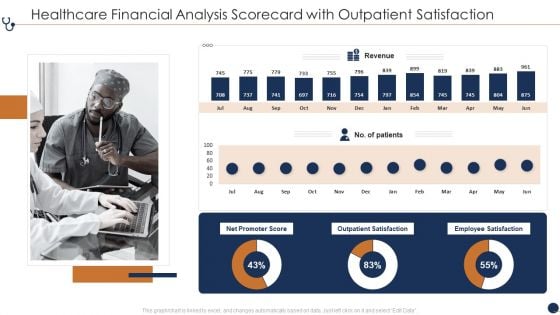
Healthcare Financial Analysis Scorecard With Outpatient Satisfaction Ppt Professional Background Image PDF
This graph or chart is linked to excel, and changes automatically based on data. Just left click on it and select Edit Data. Deliver and pitch your topic in the best possible manner with this Healthcare Financial Analysis Scorecard With Outpatient Satisfaction Ppt Professional Background Image PDF. Use them to share invaluable insights on Net Promoter Score, Outpatient Satisfaction Employee, Revenue Satisfaction Patients and impress your audience. This template can be altered and modified as per your expectations. So, grab it now.
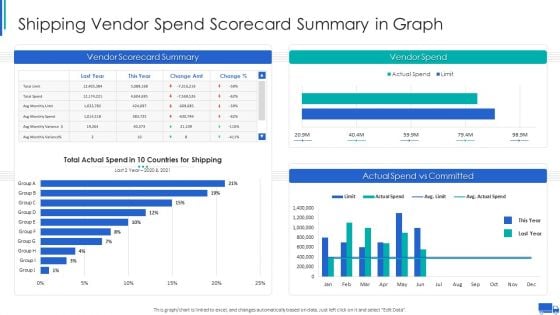
Shipping Vendor Spend Scorecard Summary In Graph Ppt Pictures Introduction PDF
This graph or chart is linked to excel, and changes automatically based on data. Just left click on it and select Edit Data. Deliver and pitch your topic in the best possible manner with this Shipping Vendor Spend Scorecard Summary In Graph Ppt Pictures Introduction PDF. Use them to share invaluable insights on Vendor Scorecard Summary, Vendor Spend Shipping, Actual Spend Vs and impress your audience. This template can be altered and modified as per your expectations. So, grab it now.
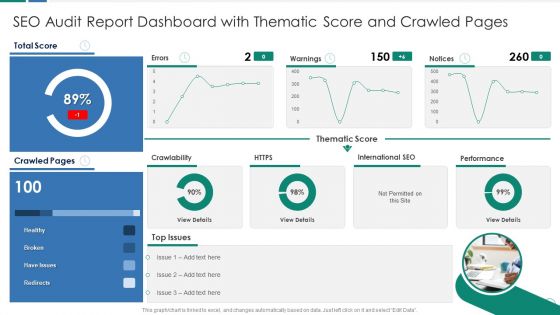
SEO Audit Report Dashboard With Thematic Score And Crawled Pages Download PDF
This graph or chart is linked to excel, and changes automatically based on data. Just left click on it and select Edit Data. Deliver and pitch your topic in the best possible manner with this SEO Audit Report Dashboard With Thematic Score And Crawled Pages Download PDF. Use them to share invaluable insights on Thematic Score Warnings, International SEO Performance, Total Score Healthy and impress your audience. This template can be altered and modified as per your expectations. So, grab it now.
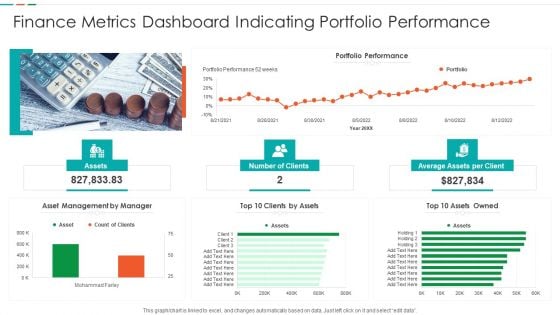
Finance Metrics Dashboard Indicating Portfolio Performance Microsoft PDF
This graph or chart is linked to excel, and changes automatically based on data. Just left click on it and select edit data. Pitch your topic with ease and precision using this Finance Metrics Dashboard Indicating Portfolio Performance Microsoft PDF. This layout presents information on Portfolio Performance Portfolio, Asset Management Manager, Top 10 Assets. It is also available for immediate download and adjustment. So, changes can be made in the color, design, graphics or any other component to create a unique layout.
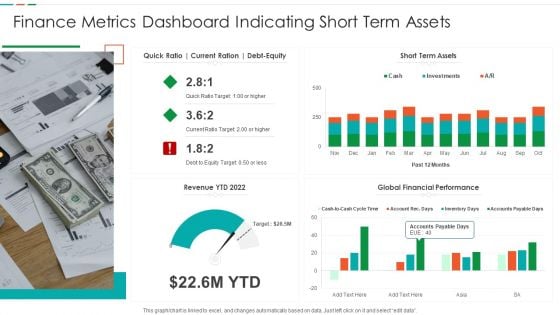
Finance Metrics Dashboard Indicating Short Term Assets Download PDF
This graph or chart is linked to excel, and changes automatically based on data. Just left click on it and select edit data. Pitch your topic with ease and precision using this Finance Metrics Dashboard Indicating Short Term Assets Download PDF. This layout presents information on Short Term Assets, Global Financial Performance, Revenue YTD 2022. It is also available for immediate download and adjustment. So, changes can be made in the color, design, graphics or any other component to create a unique layout.
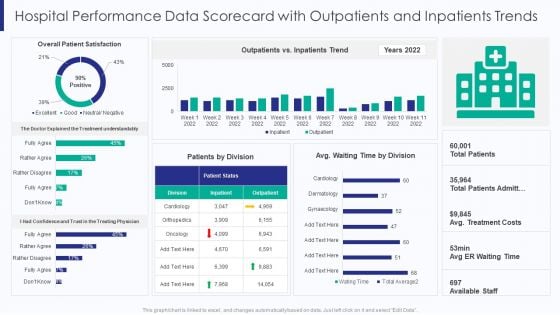
Healthcare Hospital Performance Data Scorecard With Outpatients And Inpatients Trends Ppt Summary Good PDF
This graphor chart is linked to excel, and changes automatically based on data. Just left click on it and select Edit Data. Deliver and pitch your topic in the best possible manner with this Healthcare Hospital Performance Data Scorecard With Outpatients And Inpatients Trends Ppt Summary Good PDF. Use them to share invaluable insights on Overall Patient Satisfaction, Outpatients Vs Inpatients, Trend Years 2022 and impress your audience. This template can be altered and modified as per your expectations. So, grab it now.
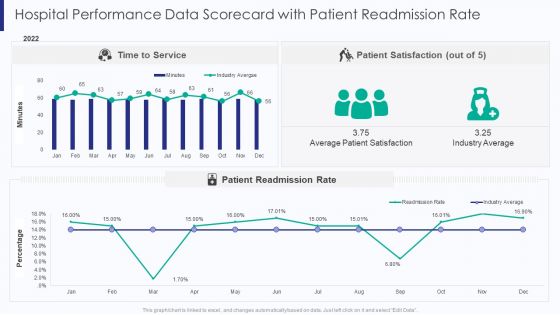
Healthcare Hospital Performance Data Scorecard With Patient Readmission Rate Ppt Model Objects PDF
This graphor chart is linked to excel, and changes automatically based on data. Just left click on it and select Edit Data. Deliver and pitch your topic in the best possible manner with this Healthcare Hospital Performance Data Scorecard With Patient Readmission Rate Ppt Model Objects PDF. Use them to share invaluable insights on Time To Service, Average Patient Satisfaction, Patient Readmission Rate and impress your audience. This template can be altered and modified as per your expectations. So, grab it now.
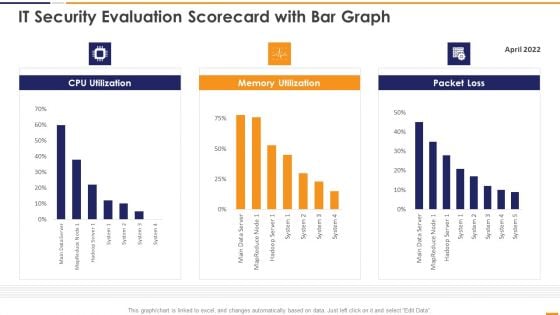
IT Security Evaluation Scorecard With Bar Graph Ppt Gallery Design Templates PDF
This graph or chart is linked to excel, and changes automatically based on data. Just left click on it and select Edit Data. Deliver and pitch your topic in the best possible manner with this IT Security Evaluation Scorecard With Bar Graph Ppt Gallery Design Templates PDF. Use them to share invaluable insights on CPU Utilization Memory, Utilization Packet Loss and impress your audience. This template can be altered and modified as per your expectations. So, grab it now.
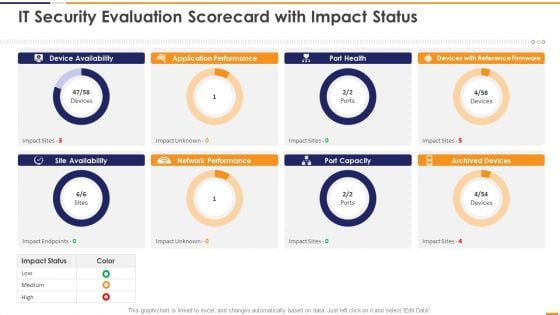
IT Security Evaluation Scorecard With Impact Status Ppt Portfolio Guidelines PDF
This graph or chart is linked to excel, and changes automatically based on data. Just left click on it and select Edit Data. Deliver and pitch your topic in the best possible manner with this IT Security Evaluation Scorecard With Impact Status Ppt Portfolio Guidelines PDF. Use them to share invaluable insights on Device Availability Application, Performance Port Health, Devices Reference Firmware and impress your audience. This template can be altered and modified as per your expectations. So, grab it now.
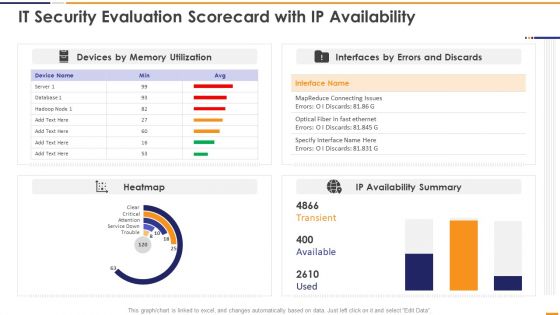
IT Security Evaluation Scorecard With Ip Availability Ppt Pictures Portrait PDF
This graph or chart is linked to excel, and changes automatically based on data. Just left click on it and select Edit Data. Deliver and pitch your topic in the best possible manner with this IT Security Evaluation Scorecard With Ip Availability Ppt Pictures Portrait PDF. Use them to share invaluable insights on Devices Memory Utilization, Interfaces Errors Discards, IP Availability Summary and impress your audience. This template can be altered and modified as per your expectations. So, grab it now.
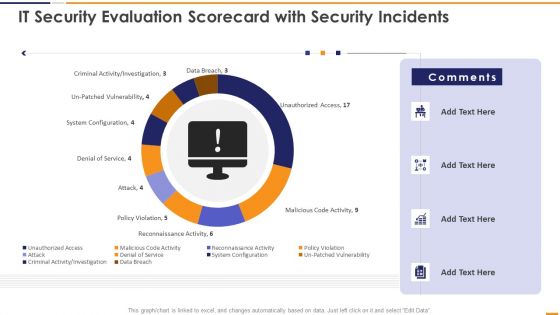
IT Security Evaluation Scorecard With Security Incidents Ppt Pictures Vector PDF
This graph or chart is linked to excel, and changes automatically based on data. Just left click on it and select Edit Data. Deliver and pitch your topic in the best possible manner with this IT Security Evaluation Scorecard With Security Incidents Ppt Pictures Vector PDF. Use them to share invaluable insights on Unauthorized Access Sales, Malicious Code Activity, Reconnaissance Activity Attack and impress your audience. This template can be altered and modified as per your expectations. So, grab it now.
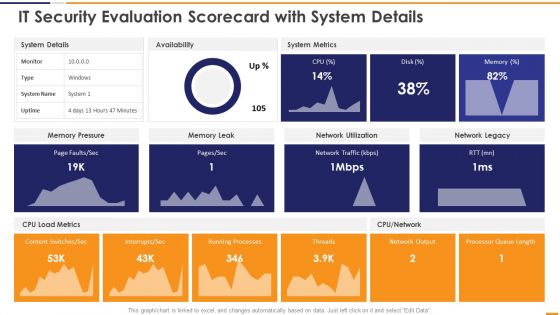
IT Security Evaluation Scorecard With System Details Ppt Inspiration Vector PDF
This graph or chart is linked to excel, and changes automatically based on data. Just left click on it and select Edit Data. Deliver and pitch your topic in the best possible manner with this IT Security Evaluation Scorecard With System Details Ppt Inspiration Vector PDF. Use them to share invaluable insights on System Details Availability, System Metrics Memory, Pressure Memory Leak and impress your audience. This template can be altered and modified as per your expectations. So, grab it now.
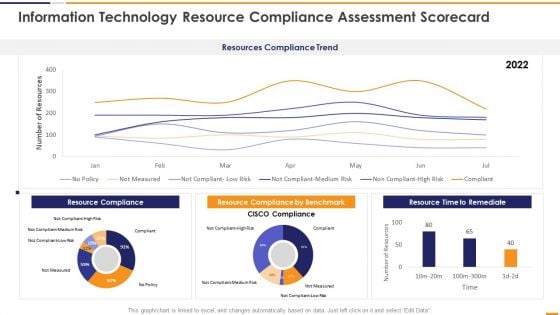
IT Security Evaluation Scorecard Information Technology Resource Compliance Background PDF
This graph or chart is linked to excel, and changes automatically based on data. Just left click on it and select Edit Data. Deliver and pitch your topic in the best possible manner with this IT Security Evaluation Scorecard Information Technology Resource Compliance Background PDF. Use them to share invaluable insights on Resources Compliance Trend, Resource Compliance 2022, Resource Compliance Benchmark, Resource Time Remediate and impress your audience. This template can be altered and modified as per your expectations. So, grab it now.

IT Security Evaluation Scorecard With Response Time And Availability Brochure PDF
This graph or chart is linked to excel, and changes automatically based on data. Just left click on it and select Edit Data. Deliver and pitch your topic in the best possible manner with this IT Security Evaluation Scorecard With Response Time And Availability Brochure PDF. Use them to share invaluable insights on Response Time 2022, Disk Utilization Availability and impress your audience. This template can be altered and modified as per your expectations. So, grab it now.
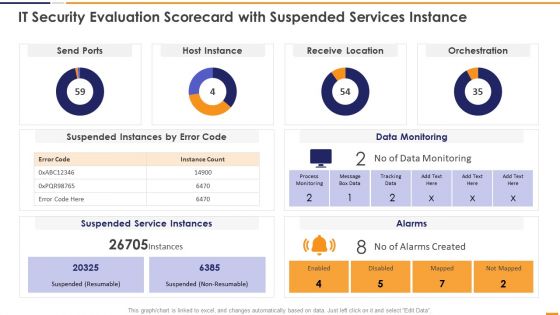
IT Security Evaluation Scorecard With Suspended Services Instance Graphics PDF
This graph or chart is linked to excel, and changes automatically based on data. Just left click on it and select Edit Data. Deliver and pitch your topic in the best possible manner with this IT Security Evaluation Scorecard With Suspended Services Instance Graphics PDF. Use them to share invaluable insights on Send Ports Alarms, Host Instance Orchestration, Receive Location Data and impress your audience. This template can be altered and modified as per your expectations. So, grab it now.
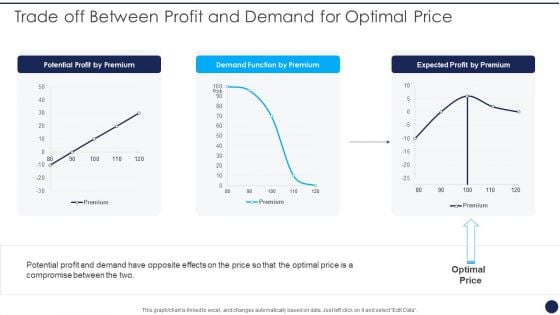
Product Pricing Strategies Analysis Trade Off Between Profit And Demand For Optimal Price Portrait PDF
This graph or chart is linked to excel, and changes automatically based on data. Just left click on it and select Edit Data. Deliver and pitch your topic in the best possible manner with this Product Pricing Strategies Analysis Trade Off Between Profit And Demand For Optimal Price Portrait PDF. Use them to share invaluable insights on Potential Profit Premium, Demand Function Premium and impress your audience. This template can be altered and modified as per your expectations. So, grab it now.
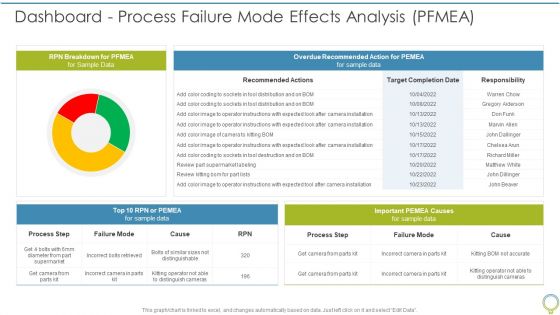
FMEA To Determine Potential Dashboard Process Failure Mode Effects Analysis PFMEA Elements PDF
This graph or chart is linked to excel, and changes automatically based on data. Just left click on it and select Edit Data. Deliver and pitch your topic in the best possible manner with this FMEA To Determine Potential Dashboard Process Failure Mode Effects Analysis PFMEA Elements PDF. Use them to share invaluable insights on RPN Breakdown, Overdue Recommended, Process Step and impress your audience. This template can be altered and modified as per your expectations. So, grab it now.
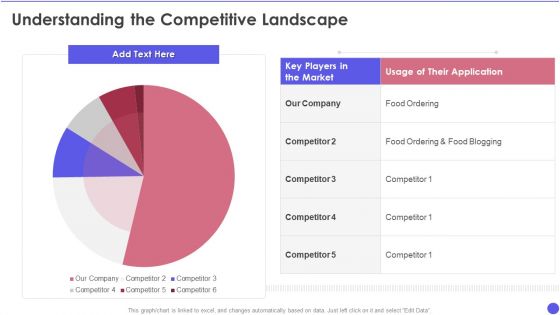
Openfin Capital Raising Understanding The Competitive Landscape Ppt Portfolio Layouts PDF
This graph or chart is linked to excel, and changes automatically based on data. Just left click on it and select Edit Data. Deliver and pitch your topic in the best possible manner with this Openfin Capital Raising Understanding The Competitive Landscape Ppt Portfolio Layouts PDF. Use them to share invaluable insights on Usage Application, Food Ordering, Food Blogging and impress your audience. This template can be altered and modified as per your expectations. So, grab it now.
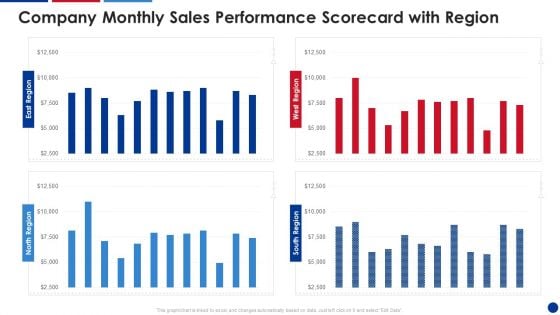
Company Monthly Sales Performance Scorecard With Region Sample PDF
This graph or chart is linked to excel, and changes automatically based on data. Just left click on it and select Edit Data. Deliver and pitch your topic in the best possible manner with this Company Monthly Sales Performance Scorecard With Region Sample PDF. Use them to share invaluable insights on Company Monthly, Sales Performance, Scorecard Region and impress your audience. This template can be altered and modified as per your expectations. So, grab it now.
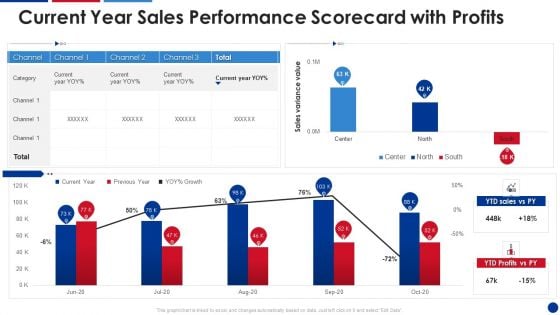
Current Year Sales Performance Scorecard With Profits Structure PDF
This graph or chart is linked to excel, and changes automatically based on data. Just left click on it and select Edit Data. Deliver and pitch your topic in the best possible manner with this Current Year Sales Performance Scorecard With Profits Structure PDF. Use them to share invaluable insights on Current Year, YTD Sales, Previous Year and impress your audience. This template can be altered and modified as per your expectations. So, grab it now.


 Continue with Email

 Home
Home


