Employee Chart
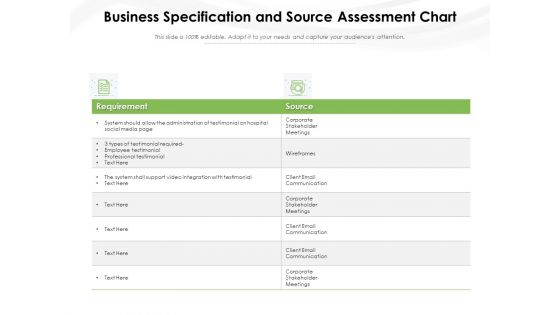
Business Specification And Source Assessment Chart Ppt PowerPoint Presentation Portfolio Clipart PDF
Presenting this set of slides with name business specification and source assessment chart ppt powerpoint presentation portfolio clipart pdf. The topics discussed in these slides are requirement, source, employee testimonial, professional testimonial, client email communication. This is a completely editable PowerPoint presentation and is available for immediate download. Download now and impress your audience.

Buyer Persona Illustration For Confidence Level Chart Ppt PowerPoint Presentation Gallery Pictures PDF
Persuade your audience using this buyer persona illustration for confidence level chart ppt powerpoint presentation gallery pictures pdf. This PPT design covers seven stages, thus making it a great tool to use. It also caters to a variety of topics including top performing employees holding trophy best employee reward. Download this PPT design now to present a convincing pitch that not only emphasizes the topic but also showcases your presentation skills.
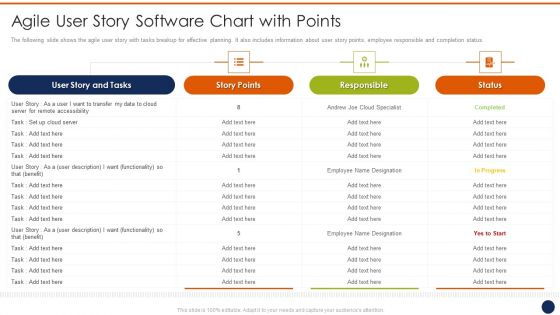
Agile User Story Software Chart With Points Ppt Styles Guidelines PDF
The following slide shows the agile user story with tasks breakup for effective planning. It also includes information about user story points, employee responsible and completion status. Deliver and pitch your topic in the best possible manner with this agile user story software chart with points ppt styles guidelines pdf. Use them to share invaluable insights on agile user story software chart with points and impress your audience. This template can be altered and modified as per your expectations. So, grab it now.
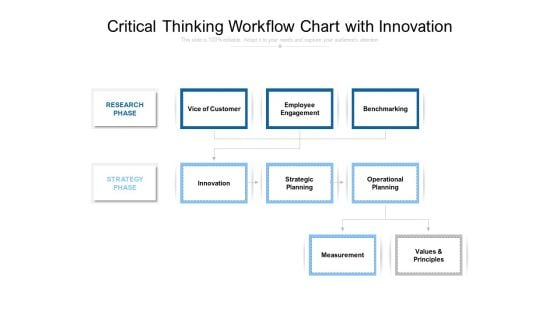
Critical Thinking Workflow Chart With Innovation Ppt PowerPoint Presentation Portfolio Design Templates
Presenting this set of slides with name critical thinking workflow chart with innovation ppt powerpoint presentation portfolio design templates. This is a one stage process. The stages in this process are research phase, strategy phase, innovation, vice customer, employee engagement, benchmarking, strategic planning, operational planning, measurement, values and principles. This is a completely editable PowerPoint presentation and is available for immediate download. Download now and impress your audience.
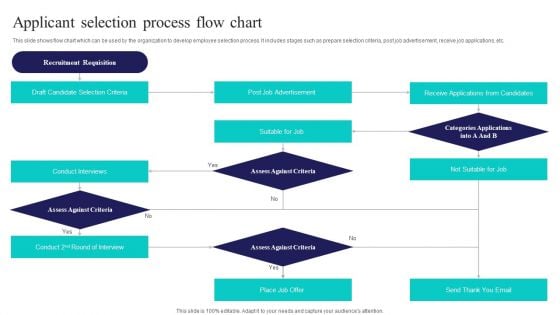
Applicant Selection Process Flow Chart Ppt PowerPoint Presentation File Inspiration PDF
This slide shows flow chart which can be used by the organization to develop employee selection process. It includes stages such as prepare selection criteria, post job advertisement, receive job applications, etc. Presenting Applicant Selection Process Flow Chart Ppt PowerPoint Presentation File Inspiration PDF to dispense important information. This template comprises one stages. It also presents valuable insights into the topics including Recruitment Requisition, Assess Against Criteria, Post Job Advertisement. This is a completely customizable PowerPoint theme that can be put to use immediately. So, download it and address the topic impactfully.
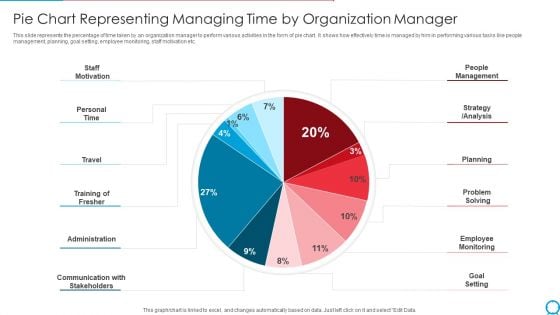
Pie Chart Representing Managing Time By Organization Manager Ppt PowerPoint Presentation Gallery Template PDF
This slide represents the percentage of time taken by an organization manager to perform various activities in the form of pie chart. It shows how effectively time is managed by him in performing various tasks like people management, planning, goal setting, employee monitoring, staff motivation etc. Pitch your topic with ease and precision using this pie chart representing managing time by organization manager ppt powerpoint presentation gallery template pdf. This layout presents information on staff motivation, personal time, travel training of fresher, administration. It is also available for immediate download and adjustment. So, changes can be made in the color, design, graphics or any other component to create a unique layout.
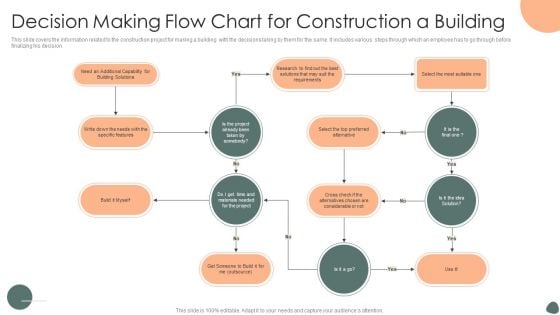
Decision Making Flow Chart For Construction A Building Ppt Outline Background Designs PDF
This slide covers the information related to the construction project for making a building with the decisions taking by them for the same. It includes various steps through which an employee has to go through before finalizing his decision. Presenting Decision Making Flow Chart For Construction A Building Ppt Outline Background Designs PDF to dispense important information. This template comprises one stages. It also presents valuable insights into the topics including Specific Features, Project, Preferred Alternative. This is a completely customizable PowerPoint theme that can be put to use immediately. So, download it and address the topic impactfully.
CSR Report On Employees Statistics During Pandemic Icons PDF
This slide illustrates data related to CSR human resources of a corporation. It includes global employees, dough-nut chart of North American employees, global employees by age etc. Showcasing this set of slides titled CSR Report On Employees Statistics During Pandemic Icons PDF. The topics addressed in these templates are Global Employees, Supporting Workforce Transformation, Employees Statistics During Pandemic. All the content presented in this PPT design is completely editable. Download it and make adjustments in color, background, font etc. as per your unique business setting.
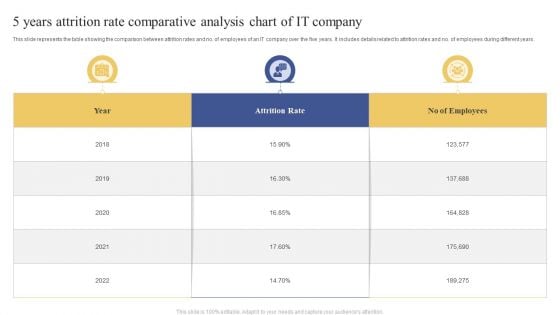
5 Years Attrition Rate Comparative Analysis Chart Of IT Company Ppt Layouts Examples PDF
This slide represents the table showing the comparison between attrition rates and no. of employees of an IT company over the five years. It includes details related to attrition rates and no. of employees during different years. Showcasing this set of slides titled 5 Years Attrition Rate Comparative Analysis Chart Of IT Company Ppt Layouts Examples PDF. The topics addressed in these templates are Attrition Rate, No Employees, 2018 To 2022. All the content presented in this PPT design is completely editable. Download it and make adjustments in color, background, font etc. as per your unique business setting.
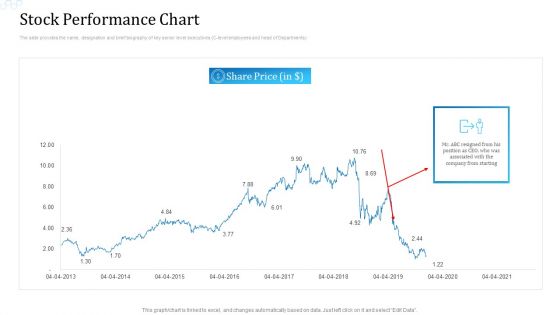
Investor Deck For Procuring Funds From Money Market Stock Performance Chart Designs PDF
The slide provides the name, designation and brief biography of key senior level executives C level employees and head of Departments. Deliver an awe inspiring pitch with this creative investor deck for procuring funds from money market stock performance chart designs pdf bundle. Topics like stock performance chart can be discussed with this completely editable template. It is available for immediate download depending on the needs and requirements of the user.
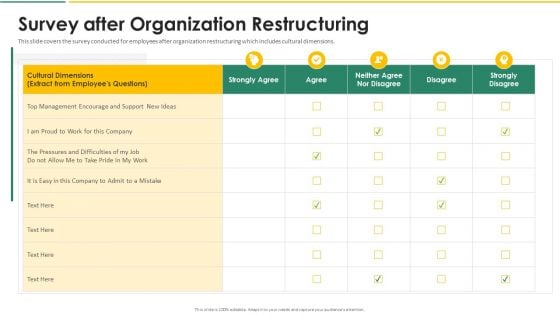
Organization Chart And Corporate Model Transformation Survey After Organization Restructuring Elements PDF
This slide covers the survey conducted for employees after organization restructuring which includes cultural dimensions. Deliver an awe inspiring pitch with this creative organization chart and corporate model transformation survey after organization restructuring elements pdf bundle. Topics like survey after organization restructuring can be discussed with this completely editable template. It is available for immediate download depending on the needs and requirements of the user.
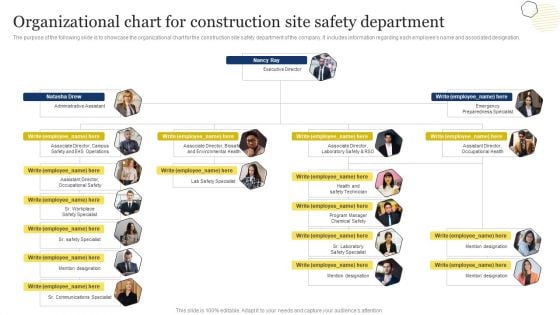
Improvement Of Safety Performance At Construction Site Organizational Chart For Construction Slides PDF
The purpose of the following slide is to showcase the organizational chart for the construction site safety department of the company. It includes information regarding each employees name and associated designation. This Improvement Of Safety Performance At Construction Site Organizational Chart For Construction Slides PDF is perfect for any presentation, be it in front of clients or colleagues. It is a versatile and stylish solution for organizing your meetings. The Improvement Of Safety Performance At Construction Site Organizational Chart For Construction Slides PDF features a modern design for your presentation meetings. The adjustable and customizable slides provide unlimited possibilities for acing up your presentation. Slidegeeks has done all the homework before launching the product for you. So, dont wait, grab the presentation templates today
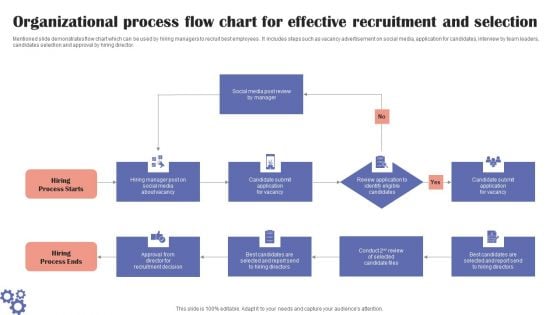
Organizational Process Flow Chart For Effective Recruitment And Selection Demonstration PDF
Mentioned slide demonstrates flow chart which can be used by hiring managers to recruit best employees . It includes steps such as vacancy advertisement on social media, application for candidates, interview by team leaders, candidates selection and approval by hiring director. Showcasing this set of slides titled Organizational Process Flow Chart For Effective Recruitment And Selection Demonstration PDF. The topics addressed in these templates are Social Media, Application For Vacancy, Recruitment Decision. All the content presented in this PPT design is completely editable. Download it and make adjustments in color, background, font etc. as per your unique business setting.

Business Case Flow Chart To Fulfill Order Process Ppt PowerPoint Presentation Layouts Information PDF
Persuade your audience using this business case flow chart to fulfill order process ppt powerpoint presentation layouts information pdf. This PPT design covers five stages, thus making it a great tool to use. It also caters to a variety of topics including product registration, removing products, register order, register payment, close system, register employee, remove employee, configurate permissions, print order, print receipt, print daily overview, fulfillment center employees, fulfillment center employees, employee, admin. Download this PPT design now to present a convincing pitch that not only emphasizes the topic but also showcases your presentation skills.
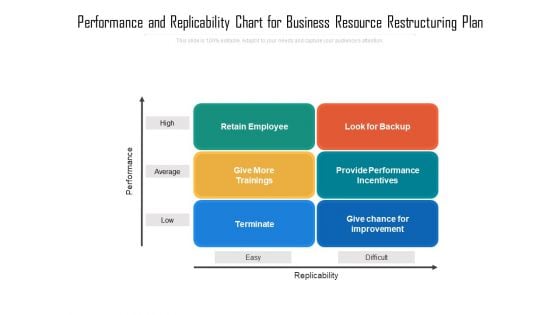
Performance And Replicability Chart For Business Resource Restructuring Plan Ppt PowerPoint Presentation Gallery Sample PDF
Persuade your audience using this performance and replicability chart for business resource restructuring plan ppt powerpoint presentation gallery sample pdf. This PPT design covers three stages, thus making it a great tool to use. It also caters to a variety of topics including retain employee, provide performance incentives, give chance for improvement. Download this PPT design now to present a convincing pitch that not only emphasizes the topic but also showcases your presentation skills.
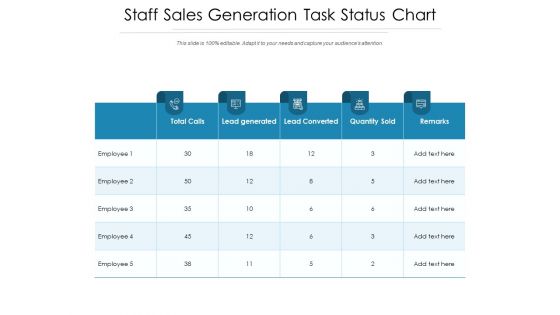
Staff Sales Generation Task Status Chart Ppt PowerPoint Presentation Inspiration Ideas PDF
Presenting this set of slides with name staff sales generation task status chart ppt powerpoint presentation inspiration ideas pdf. The topics discussed in these slides are total calls, lead generated, lead converted, quantity sold, remarks, employee. This is a completely editable PowerPoint presentation and is available for immediate download. Download now and impress your audience.
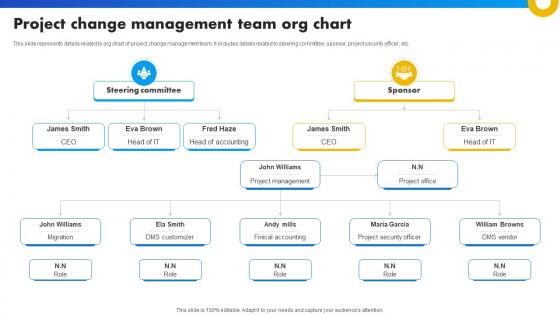
Project Change Management Team Org Chart Strategies For Success In Digital
This slide represents details related to org chart of project change management team. It includes details related to steering committee, sponsor, project security officer, etc. Presenting this PowerPoint presentation, titled Project Change Management Team Org Chart Strategies For Success In Digital, with topics curated by our researchers after extensive research. This editable presentation is available for immediate download and provides attractive features when used. Download now and captivate your audience. Presenting this Project Change Management Team Org Chart Strategies For Success In Digital. Our researchers have carefully researched and created these slides with all aspects taken into consideration. This is a completely customizable Project Change Management Team Org Chart Strategies For Success In Digital that is available for immediate downloading. Download now and make an impact on your audience. Highlight the attractive features available with our PPTs. This slide represents details related to org chart of project change management team. It includes details related to steering committee, sponsor, project security officer, etc.
Payroll Process Workflow Chart With Icons Ppt PowerPoint Presentation Gallery Show PDF
Presenting payroll process workflow chart with icons ppt powerpoint presentation gallery show pdf to dispense important information. This template comprises five stages. It also presents valuable insights into the topics including payroll cycle, process, employee. This is a completely customizable PowerPoint theme that can be put to use immediately. So, download it and address the topic impactfully.
Skills Gap Analysis Chart With Initiatives Ppt PowerPoint Presentation Icon Slideshow
Presenting this set of slides with name skills gap analysis chart with initiatives ppt powerpoint presentation icon slideshow. The topics discussed in these slides are executive, sales, expected rating, initiatives, employee. This is a completely editable PowerPoint presentation and is available for immediate download. Download now and impress your audience.
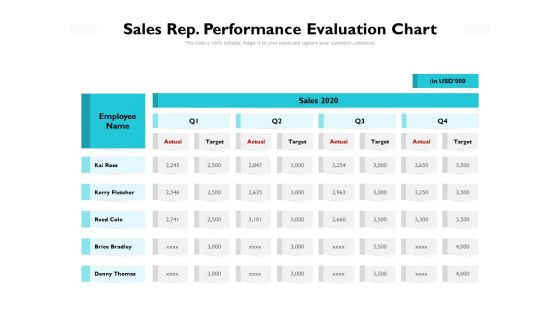
Sales Rep Performance Evaluation Chart Ppt PowerPoint Presentation File Elements PDF
Presenting this set of slides with name sales rep performance evaluation chart ppt powerpoint presentation file elements pdf. The topics discussed in these slides are employee, sales, actual, target. This is a completely editable PowerPoint presentation and is available for immediate download. Download now and impress your audience.
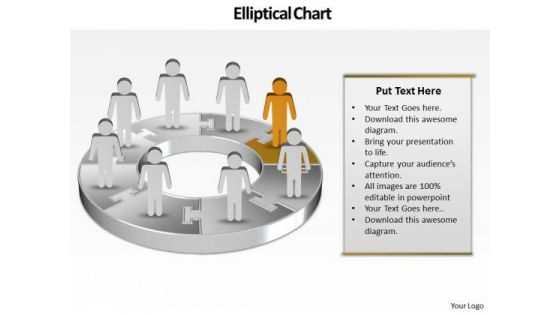
Ppt Team Work Person Presentation Standing Orange Piece Of Chart PowerPoint Templates
PPT team work person presentation standing orange piece of chart PowerPoint Templates-Use this graphical approach to represent global business issues such as financial data, stock market Exchange, increase in sales, corporate presentations and more. Create captivating presentations to deliver comparative and weighted arguments.-PPT team work person presentation standing orange piece of chart PowerPoint Templates-arrow, bar, business, businessman, candidate, cartoon, character, chart, circle, circular, client, communication, company, concept, diagram, finance, financial, flow, growth, human, illustration, increase, information, iteration, man, market, marketing, process, processing, profit, sales, statistics, stats, success, target Bounce back with our Ppt Team Work Person Presentation Standing Orange Piece Of Chart PowerPoint Templates. You will come out on top.

Team On Pie Chart Business PowerPoint Templates And PowerPoint Themes 0412
Microsoft Powerpoint Templates and Background with business team with bigger pie chart teamwork success concept Our Team On Pie Chart Business PowerPoint Templates And PowerPoint Themes 0412 ensure the audience is never fed up. They will continue asking for more.
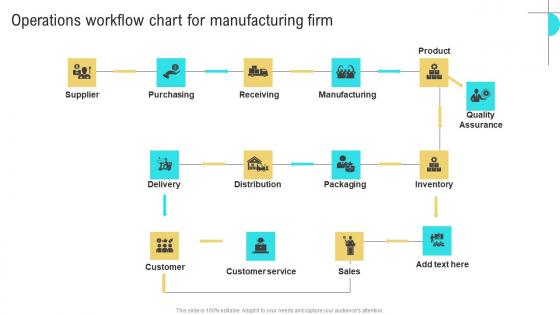
Operations Workflow Chart Business Performance Optimization New Operations Strategy Sample Pdf
Presenting this PowerPoint presentation, titled Operations Workflow Chart Business Performance Optimization New Operations Strategy Sample Pdf, with topics curated by our researchers after extensive research. This editable presentation is available for immediate download and provides attractive features when used. Download now and captivate your audience. Presenting this Operations Workflow Chart Business Performance Optimization New Operations Strategy Sample Pdf. Our researchers have carefully researched and created these slides with all aspects taken into consideration. This is a completely customizable Operations Workflow Chart Business Performance Optimization New Operations Strategy Sample Pdf that is available for immediate downloading. Download now and make an impact on your audience. Highlight the attractive features available with our PPTs. Our Operations Workflow Chart Business Performance Optimization New Operations Strategy Sample Pdf are topically designed to provide an attractive backdrop to any subject. Use them to look like a presentation pro.

Goal Pie Chart Concept Business PowerPoint Templates And PowerPoint Themes 0712
Goal Pie Chart Concept Business PowerPoint Templates And PowerPoint Themes 0712-Microsoft Powerpoint Templates and Background with pie chart concept Lecture teams with our Goal Pie Chart Concept Business PowerPoint Templates And PowerPoint Themes 0712. Download without worries with our money back guaranteee.
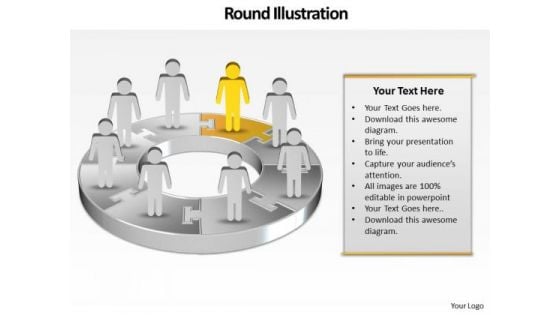
Ppt Team Effort Person Standing Yellow Piece Of Chart PowerPoint Ks2 Templates
PPT team effort person standing yellow piece of chart PowerPoint ks2 Templates-Use this Circular Arrow diagram to show activities that are related to the business plan metrics and monitor the results to determine if the business plan is proceeding as planned. You can apply other 3D Styles and shapes to the slide to enhance your presentations.-PPT team effort person standing yellow piece of chart PowerPoint ks2 Templates-arrow, bar, business, businessman, candidate, cartoon, character, chart, circle, circular, client, communication, company, concept, diagram, finance, financial, flow, growth, human, illustration, increase, information, iteration, man, market, marketing, process, processing, profit, sales, statistics, stats, success, target Feature your views with our Ppt Team Effort Person Standing Yellow Piece Of Chart PowerPoint Ks2 Templates. They will get the desired exposure.
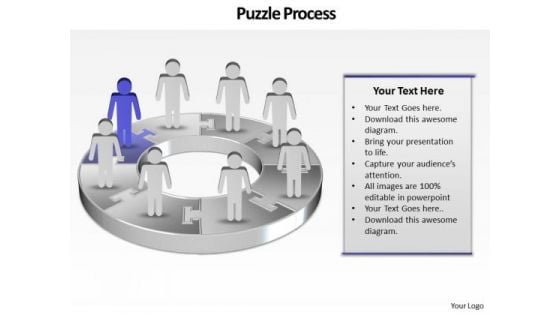
Ppt Group Of People Pie Chart Person Standing Purple Piece PowerPoint Templates
PPT group of people pie chart person standing purple piece PowerPoint Templates-This continual illustration of procedure graphic is a visual representation of your information and ideas. Use this diagram as a method of graphically representing the flow of data as an information processing system.-PPT group of people pie chart person standing purple piece PowerPoint Templates-arrow, bar, business, businessman, candidate, cartoon, character, chart, circle, circular, client, communication, company, concept, diagram, finance, growth, human, illustration, increase, information, marketing, person, presentation, process, profit, sales, stats, success, target Establish your command over the subject. Display your awareness with our Ppt Group Of People Pie Chart Person Standing Purple Piece PowerPoint Templates.
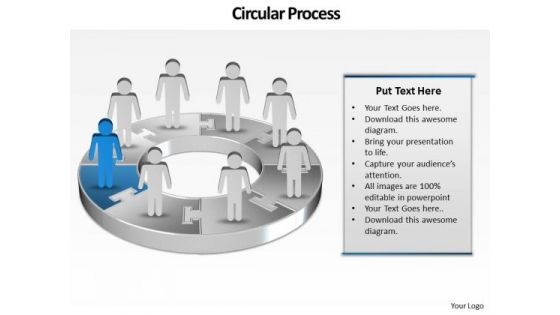
Ppt Group Of People Pie Chart Person Presentation Standing Blue Piece PowerPoint Templates
PPT group of people pie chart person presentation standing blue piece PowerPoint Templates-This PowerPoint Diagram shows the Round Description of steps which are involved in development Process. It includes Eight Steps. You can change color, size and orientation of any icon to your liking.-PPT group of people pie chart person presentation standing blue piece PowerPoint Templates-arrow, bar, business, businessman, candidate, cartoon, character, chart, circle, circular, client, communication, company, concept, diagram, finance, growth, human, illustration, increase, information, marketing, person, presentation, process, profit, sales, stats, success, target Expound your logic on our Ppt Group Of People Pie Chart Person Presentation Standing Blue Piece PowerPoint Templates. Let them in on your chain of thought.
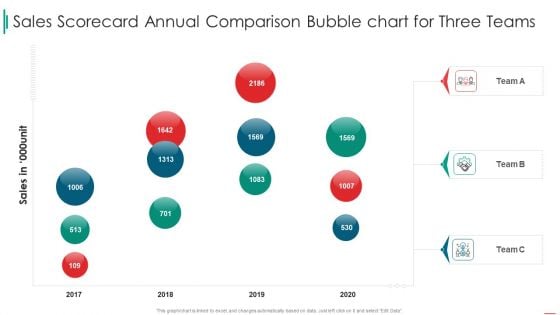
Sales Rep Scorecard Sales Scorecard Annual Comparison Bubble Chart For Three Teams Designs PDF
Deliver and pitch your topic in the best possible manner with this sales rep scorecard sales scorecard annual comparison bubble chart for three teams designs pdf. Use them to share invaluable insights on sales scorecard annual comparison bubble chart for three teams and impress your audience. This template can be altered and modified as per your expectations. So, grab it now.
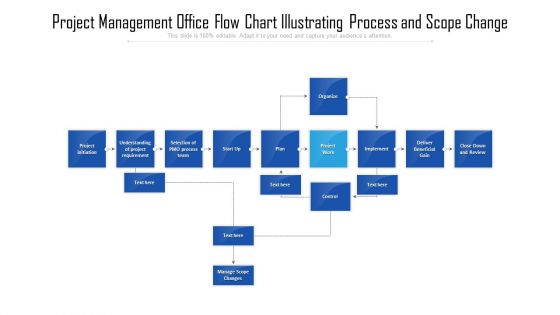
Project Management Office Flow Chart Illustrating Process And Scope Change Information PDF
Presenting project management office flow chart illustrating process and scope change information pdf to dispense important information. This template comprises one stage. It also presents valuable insights into the topics including process team, project requirement, project initiation. This is a completely customizable PowerPoint theme that can be put to use immediately. So, download it and address the topic impactfully.
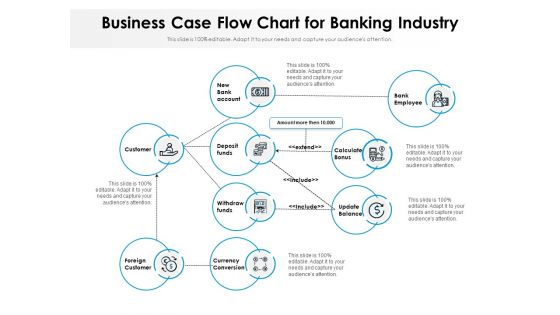
Business Case Flow Chart For Banking Industry Ppt PowerPoint Presentation Layouts Picture PDF
Presenting business case flow chart for banking industry ppt powerpoint presentation layouts picture pdf to dispense important information. This template comprises nine stages. It also presents valuable insights into the topics including deposit funds, withdraw funds, currency conversion, foreign customer, customer, new bank account, bank employee, calculate bonus, update balance. This is a completely customizable PowerPoint theme that can be put to use immediately. So, download it and address the topic impactfully.
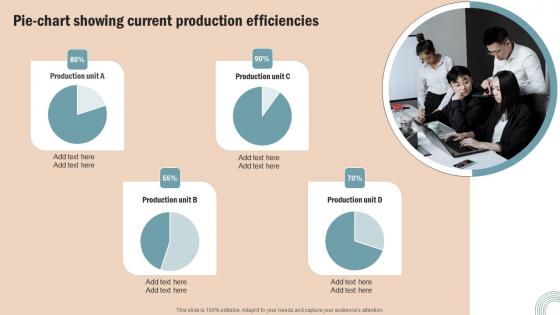
Pie Chart Showing Current Operations Strategy Improve Business Productivity Clipart Pdf
Here you can discover an assortment of the finest PowerPoint and Google Slides templates. With these templates, you can create presentations for a variety of purposes while simultaneously providing your audience with an eye catching visual experience. Download Pie Chart Showing Current Operations Strategy Improve Business Productivity Clipart Pdf to deliver an impeccable presentation. These templates will make your job of preparing presentations much quicker, yet still, maintain a high level of quality. Slidegeeks has experienced researchers who prepare these templates and write high quality content for you. Later on, you can personalize the content by editing the Pie Chart Showing Current Operations Strategy Improve Business Productivity Clipart Pdf. Our Pie Chart Showing Current Operations Strategy Improve Business Productivity Clipart Pdf are topically designed to provide an attractive backdrop to any subject. Use them to look like a presentation pro.
Cash Market Investor Deck Organization Chart Diagram Of The Company Services Ppt Professional Icon PDF
The slide provides the diagram which shows ownership structure holding and subsidiary companies of the company. The structure includes holding company, sister subsidiaries and subsidiaries of our company. This is a cash market investor deck organization chart diagram of the company services ppt professional icon pdf template with various stages. Focus and dispense information on three stages using this creative set, that comes with editable features. It contains large content boxes to add your information on topics like services provider, investment company, asset management solutions, insurance operations. You can also showcase facts, figures, and other relevant content using this PPT layout. Grab it now.
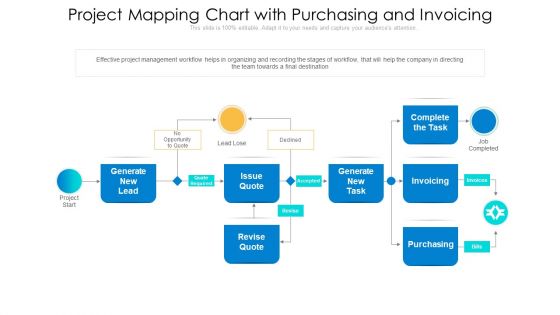
Project Mapping Chart With Purchasing And Invoicing Ppt Inspiration Smartart PDF
Showcasing this set of slides titled project mapping chart with purchasing and invoicing ppt inspiration smartart pdf. The topics addressed in these templates are opportunity, project management workflow, team. All the content presented in this PPT design is completely editable. Download it and make adjustments in color, background, font etc. as per your unique business setting.
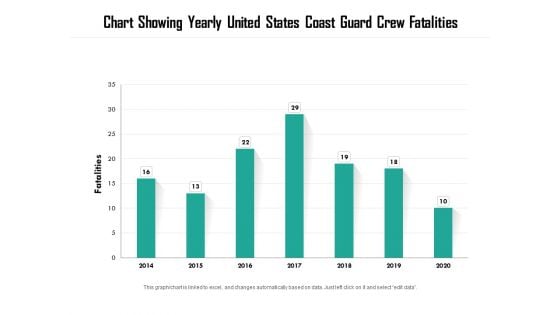
Chart Showing Yearly United States Coast Guard Crew Fatalities Ppt PowerPoint Presentation Inspiration Structure PDF
Pitch your topic with ease and precision using this chart showing yearly united states coast guard crew fatalities ppt powerpoint presentation inspiration structure pdf. This layout presents information on chart showing yearly united states coast guard crew fatalities. It is also available for immediate download and adjustment. So, changes can be made in the color, design, graphics or any other component to create a unique layout.
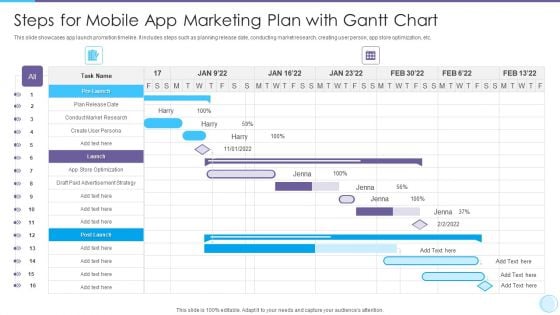
Steps For Mobile App Marketing Plan With Gantt Chart Rules PDF
Your complex projects can be managed and organized simultaneously using this detailed Steps For Mobile App Marketing Plan With Gantt Chart Rules PDF template. Track the milestones, tasks, phases, activities, and subtasks to get an updated visual of your project. Share your planning horizon and release plan with this well crafted presentation template. This exemplary template can be used to plot various dependencies to distinguish the tasks in the pipeline and their impact on the schedules and deadlines of the project. Apart from this, you can also share this visual presentation with your team members and stakeholders. It a resourceful tool that can be incorporated into your business structure. Therefore, download and edit it conveniently to add the data and statistics as per your requirement
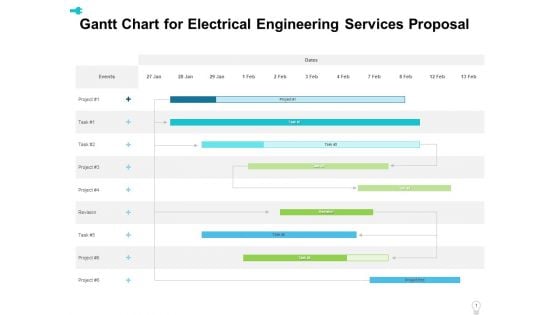
Gantt Chart For Electrical Engineering Services Proposal Ppt Layouts Layout PDF
Your complex projects can be managed and organized simultaneously using this detailed gantt chart for electrical engineering services proposal ppt layouts layout pdf template. Track the milestones, tasks, phases, activities, and subtasks to get an updated visual of your project. Share your planning horizon and release plan with this well-crafted presentation template. This exemplary template can be used to plot various dependencies to distinguish the tasks in the pipeline and their impact on the schedules and deadlines of the project. Apart from this, you can also share this visual presentation with your team members and stakeholders. It a resourceful tool that can be incorporated into your business structure. Therefore, download and edit it conveniently to add the data and statistics as per your requirement.
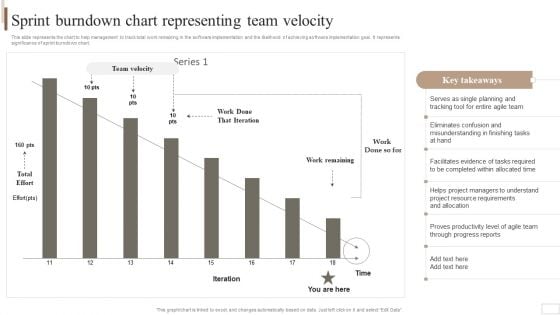
Strategic Plan For Enterprise Sprint Burndown Chart Representing Team Velocity Graphics PDF
This slide represents the chart to help management to track total work remaining in the software implementation and the likelihood of achieving software implementation goal. It represents significance of sprint burndown chart. Want to ace your presentation in front of a live audience Our Strategic Plan For Enterprise Sprint Burndown Chart Representing Team Velocity Graphics PDF can help you do that by engaging all the users towards you.. Slidegeeks experts have put their efforts and expertise into creating these impeccable powerpoint presentations so that you can communicate your ideas clearly. Moreover, all the templates are customizable, and easy-to-edit and downloadable. Use these for both personal and commercial use.
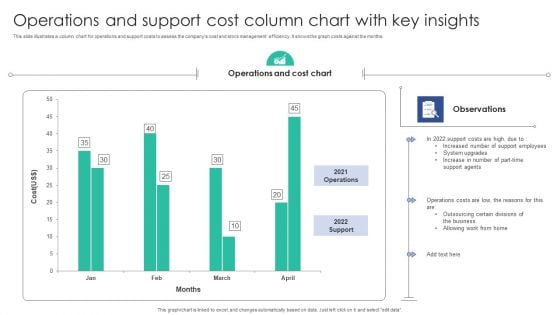
Operations And Support Cost Column Chart With Key Insights Background PDF
This slide illustrates a column chart for operations and support costs to assess the companys cost and stock management efficiency. It shows the graph costs against the months.Showcasing this set of slides titled Operations And Support Cost Column Chart With Key Insights Background PDF. The topics addressed in these templates are Operations Cost, Support Agents, Support Employees. All the content presented in this PPT design is completely editable. Download it and make adjustments in color, background, font etc. as per your unique business setting.
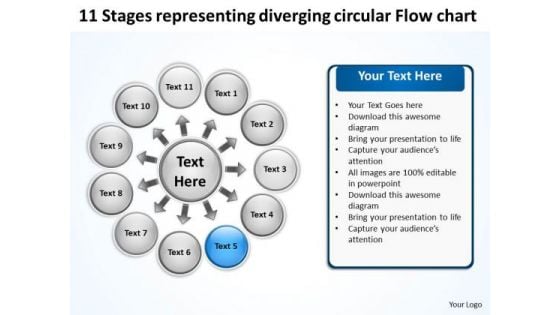
11 Stages Representing Diverging Circular Flow Chart Cycle Layout Diagram PowerPoint Slides
We present our 11 stages representing diverging circular flow chart Cycle Layout Diagram PowerPoint Slides.Download our Arrows PowerPoint Templates because this diagram helps you to explain your strategy to co-ordinate activities of these seperate groups. Use our Flow charts PowerPoint Templates because this template helps you to put your finger on the pulse of your business and sense the need to re-align a bit. Download and present our Business PowerPoint Templates because it helps you to project your enthusiasm and single mindedness to your colleagues. Download and present our Process and Flows PowerPoint Templates because your brain is always churning out ideas like cogs in a wheel. Present our Circle charts PowerPoint Templates because it shows you the vision of a desired destination and the best road to take to reach that goal.Use these PowerPoint slides for presentations relating to Business, chart, circle, colors, concept, corporate, cycle, data, design, detail, development, diagram, engineering, graphic, ideas, illustration, image, implement, implementation, life, lifecycle, management, model, objects, organization, plan, process, product, professional, project, quality, schema, shape, stack, stage, steps, strategy, structure, success, symbol. The prominent colors used in the PowerPoint template are Blue, Gray, Black. You can be sure our 11 stages representing diverging circular flow chart Cycle Layout Diagram PowerPoint Slides are designed by a team of presentation professionals. Presenters tell us our circle PowerPoint templates and PPT Slides are Precious. We assure you our 11 stages representing diverging circular flow chart Cycle Layout Diagram PowerPoint Slides are Clever. Customers tell us our data PowerPoint templates and PPT Slides are Dazzling. Presenters tell us our 11 stages representing diverging circular flow chart Cycle Layout Diagram PowerPoint Slides are Amazing. You can be sure our data PowerPoint templates and PPT Slides are incredible easy to use. Nourish the self-esteem of your employees. Acknowledge their accomplishments with our 11 Stages Representing Diverging Circular Flow Chart Cycle Layout Diagram PowerPoint Slides.

Prevention Of Information Functional Chart Of Cyber Security Team Themes PDF
The purpose of this slide is to provide glimpse of cyber security team in the form of org chart. The key stakeholders mentioned in the slide are chief information security officer CISO, cyber risk committee, cyber security director, cyber risk manager, security operations manager etc. Whether you have daily or monthly meetings, a brilliant presentation is necessary. Prevention Of Information Functional Chart Of Cyber Security Team Themes PDF can be your best option for delivering a presentation. Represent everything in detail using Prevention Of Information Functional Chart Of Cyber Security Team Themes PDF and make yourself stand out in meetings. The template is versatile and follows a structure that will cater to your requirements. All the templates prepared by Slidegeeks are easy to download and edit. Our research experts have taken care of the corporate themes as well. So, give it a try and see the results.
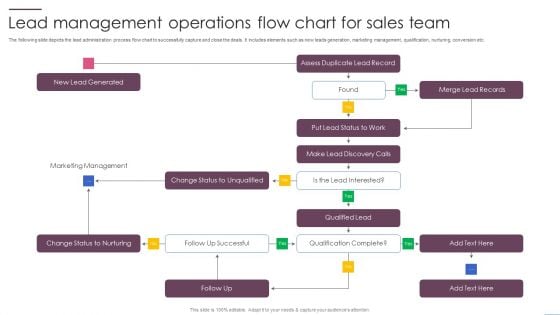
Lead Management Operations Flow Chart For Sales Team Ppt PowerPoint Presentation File Outfit PDF
The following slide depicts the lead administration process flow chart to successfully capture and close the deals. It includes elements such as new leads generation, marketing management, qualification, nurturing, conversion etc. Persuade your audience using this Lead Management Operations Flow Chart For Sales Team Ppt PowerPoint Presentation File Outfit PDF. This PPT design covers one stages, thus making it a great tool to use. It also caters to a variety of topics including New Lead Generated, Merge Lead Records, Marketing Management. Download this PPT design now to present a convincing pitch that not only emphasizes the topic but also showcases your presentation skills.
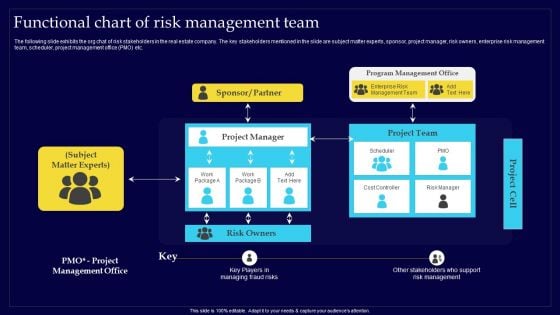
Executing Risk Mitigation Functional Chart Of Risk Management Team Designs PDF
The following slide exhibits the org chat of risk stakeholders in the real estate company. The key stakeholders mentioned in the slide are subject matter experts, sponsor, project manager, risk owners, enterprise risk management team, scheduler, project management office PMO etc. From laying roadmaps to briefing everything in detail, our templates are perfect for you. You can set the stage with your presentation slides. All you have to do is download these easy-to-edit and customizable templates. Executing Risk Mitigation Functional Chart Of Risk Management Team Designs PDF will help you deliver an outstanding performance that everyone would remember and praise you for. Do download this presentation today.
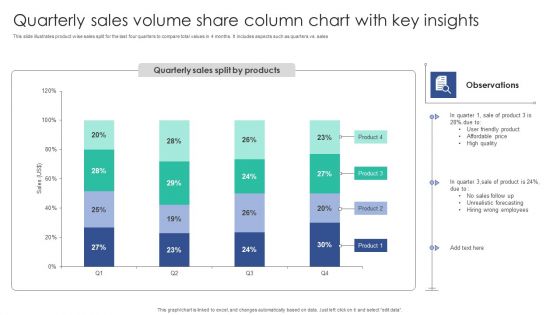
Quarterly Sales Volume Share Column Chart With Key Insights Structure PDF
This slide illustrates product wise sales split for the last four quarters to compare total values in 4 months. It includes aspects such as quarters vs. salesShowcasing this set of slides titled Quarterly Sales Volume Share Column Chart With Key Insights Structure PDF. The topics addressed in these templates are Unrealistic Forecasting, Wrong Employees, Friendly Product. All the content presented in this PPT design is completely editable. Download it and make adjustments in color, background, font etc. as per your unique business setting.
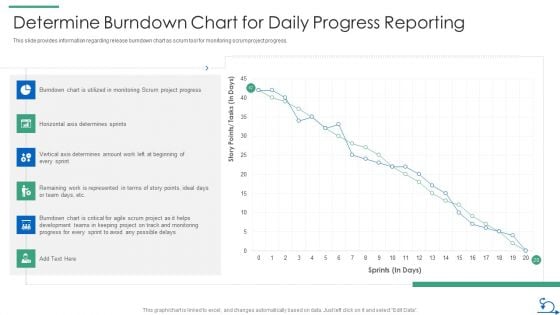
How Bidding Teams Determine Burndown Chart For Daily Progress Reporting Pictures PDF
This slide provides information regarding release burndown chart as scrum tool for monitoring scrum project progress. Deliver an awe inspiring pitch with this creative how bidding teams determine burndown chart for daily progress reporting pictures pdf bundle. Topics like burndown chart, team, project progress can be discussed with this completely editable template. It is available for immediate download depending on the needs and requirements of the user.
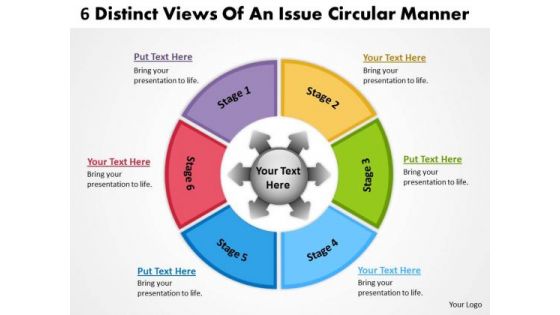
6 Distinct Views Of An Issue Circular Manner Flow Chart PowerPoint Slides
We present our 6 distinct views of an issue circular manner Flow Chart PowerPoint Slides.Use our Arrows PowerPoint Templates because it shows the pyramid which is a symbol of the desire to reach the top in a steady manner. Download our Circle Charts PowerPoint Templates because this template contains the material to highlight the key issues of your presentation. Present our Shapes PowerPoint Templates because you can Raise your Company stocks at the Opening Bell. Use our Ring Charts PowerPoint Templates because this diagram provides range of options to garner your interest. Download and present our Flow Charts PowerPoint Templates because this Layout helps you to expand your plans to overcome obstacles and reassure the team that they shall continue to roll along merrily.Use these PowerPoint slides for presentations relating to abstract, access, arrow, background, banner, blue, bright, business, chart, circle, color, colorful, concept, conceptual, connection, corporate, creative, cycle, design, different, element, empty, form, frame, graphic, green, group, idea, illustration, match, message, order, part, piece, place, process, red, shape, solution, special, speech, strategy, symbol, template, text, usable, vector, web, website. The prominent colors used in the PowerPoint template are Red, Purple, Yellow. Presenters tell us our 6 distinct views of an issue circular manner Flow Chart PowerPoint Slides are Upbeat. You can be sure our blue PowerPoint templates and PPT Slides are Nostalgic. Professionals tell us our 6 distinct views of an issue circular manner Flow Chart PowerPoint Slides are Tasteful. People tell us our banner PowerPoint templates and PPT Slides are Multicolored. People tell us our 6 distinct views of an issue circular manner Flow Chart PowerPoint Slides are Liberated. Professionals tell us our chart PowerPoint templates and PPT Slides are Playful. Get the elevation you deserve. Ascend the ladder with our 6 Distinct Views Of An Issue Circular Manner Flow Chart PowerPoint Slides.
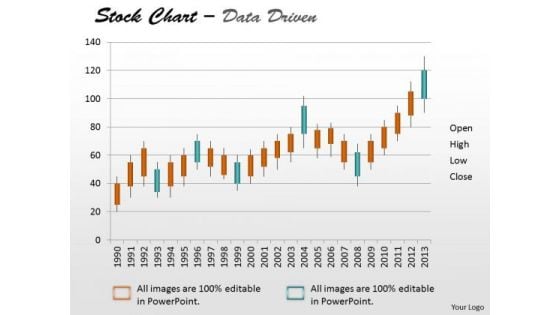
Data Analysis Template Driven Stock Chart For Market Trends PowerPoint Slides Templates
Drive Your Team Along The Road To Success. Take The Wheel With Our data analysis template driven stock chart for market trends powerpoint slides Templates .

Ppt Green PowerPoint Slide Man On Circular Gantt Chart Template Templates
PPT green powerpoint slide man on circular gantt chart template Templates-This PowerPoint Diagram shows you the Circular way to represent Business components or losses in Business related Activities. This PowerPoint Diagram can be use in Investor presentations for Initial Public Offerings, Annual general meetings and financial seminars.-PPT green powerpoint slide man on circular gantt chart template Templates-abstract, accounting, background, business, businessman, chart, company, connection, corporate, diagram, earnings, finance, forecast, graph, growth, investment, management, network, people, profit, progress, puzzle, shapes, team, technology, vector, wealth Fight down jealousies with our Ppt Green PowerPoint Slide Man On Circular Gantt Chart Template Templates. Make everyone feel equal with your words.

Data Analysis Excel 3d Pie Chart For Marketing Process PowerPoint Templates
Our data analysis excel 3d pie chart for marketing process Powerpoint Templates Team Are A Dogged Lot. They Keep At It Till They Get It Right.

Quantitative Data Analysis 3d Pie Chart For Business Process PowerPoint Templates
Put Them On The Same Page With Our quantitative data analysis 3d pie chart for business process Powerpoint Templates . Your Team Will Sing From The Same Sheet.
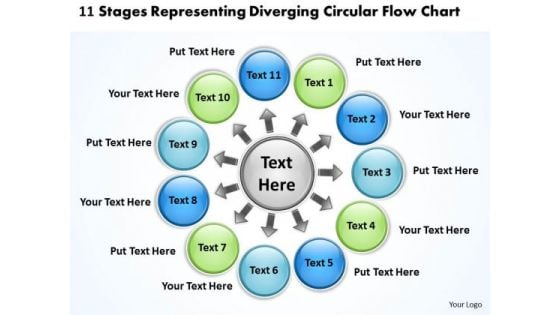
11 Stages Representing Diverging Circular Flow Chart Ppt Cycle Process PowerPoint Templates
We present our 11 stages representing diverging circular flow chart ppt Cycle Process PowerPoint templates.Present our Circle Charts PowerPoint Templates because they will Amplify your basic corporate concept and forefront the benefits of overlapping processes to arrive at common goals. Download and present our Arrows PowerPoint Templates because this slide is an excellent backdrop for you to enlighten your audience on the process you have gone through and the vision you have for the future. Use our Ring Charts PowerPoint Templates because your listeners do not have to put on their thinking caps. Download and present our Business PowerPoint Templates because it helps you to project your enthusiasm and single mindedness to your colleagues. Use our Flow Charts PowerPoint Templates because you have examined every element down to the finest detail.Use these PowerPoint slides for presentations relating to arrows, business, chart, circle, company, concept, continuity, continuous, cycle, dependency, diagram, direction, dynamic, endless, feeds, graph, iteration, iterative, method, path, phase, presentation, process, production, progress, progression, report, rotation, sequence, succession, vector. The prominent colors used in the PowerPoint template are Green, Blue, Gray. Presenters tell us our 11 stages representing diverging circular flow chart ppt Cycle Process PowerPoint templates are Pleasant. You can be sure our cycle PowerPoint templates and PPT Slides will get their audience's attention. Professionals tell us our 11 stages representing diverging circular flow chart ppt Cycle Process PowerPoint templates are Flirty. People tell us our circle PowerPoint templates and PPT Slides will save the presenter time. People tell us our 11 stages representing diverging circular flow chart ppt Cycle Process PowerPoint templates are aesthetically designed to attract attention. We guarantee that they will grab all the eyeballs you need. Professionals tell us our circle PowerPoint templates and PPT Slides are Playful. Be fantastic with our 11 Stages Representing Diverging Circular Flow Chart Ppt Cycle Process PowerPoint Templates. Give a boost to your creativity.
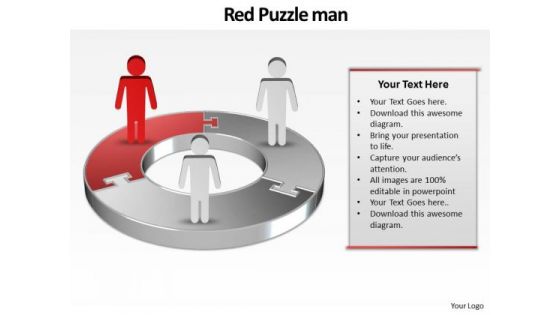
Ppt Red World Business Layouts People Stand On Circular Chart PowerPoint Templates
PPT red world business layouts people stand on circular chart PowerPoint Templates-This 3D PowerPoint Diagram shows the Three interconnected stages represented by first Red Quadrant. It signifies the concept of aspect, attribute, bearing, complexion, component, differentia, disposition, distinction, earmark, essence, essential etc.-PPT red world business layouts people stand on circular chart PowerPoint Templates-abstract, accounting, background, business, businessman, chart, company, connection, corporate, diagram, earnings, finance, forecast, graph, growth, investment, management, network, people, profit, progress, puzzle, shapes, team, technology, vector, wealth Make a powerful statement with our Ppt Red World Business Layouts People Stand On Circular Chart PowerPoint Templates. You'll always stay ahead of the game.
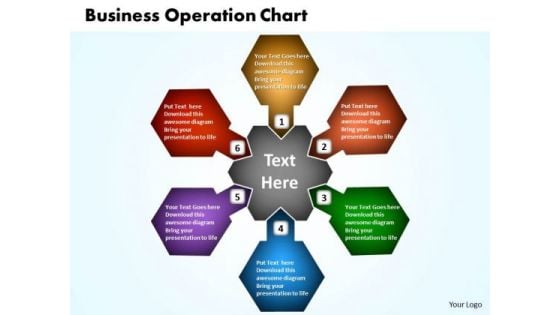
Business Process PowerPoint Templates Business The Circular Operation Process Chart Ppt Slides
Business Process PowerPoint Templates Business The Circular Operation Process Chart PPT Slides-Use this Circular Operation Chart Diagram in Business Presentations. This PowerPoint diagram can be used for information flow, business process automation, business process re-engineering and other business related issues.-Business Process PowerPoint Templates Business The Circular Operation Process Chart PPT Slides Achieve strong & sustainable productivity gains with our Business Process PowerPoint Templates Business The Circular Operation Process Chart Ppt Slides. They will make you look good.
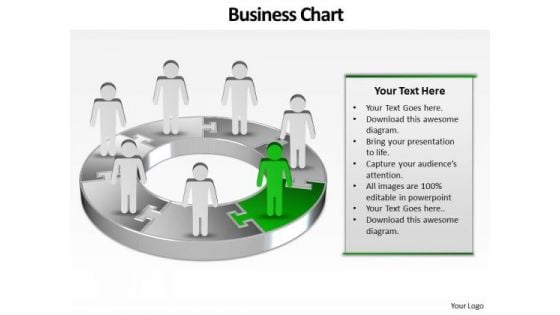
Ppt Group Of Describing People PowerPoint Presentation With 3d Pie Chart Templates
PPT group of describing people powerpoint presentation with 3d pie chart Templates-Use this 3D Animated PowerPoint Diagram to demonstrate the Marketing Flow Process step wise step. This Diagram imitates the following concept: connected, consecutive, continued, day and night, endless, everlasting, extended etc.-PPT group of describing people powerpoint presentation with 3d pie chart Templates-Adult, Art, Background, Business, Career, Chart, Communication, Concept, Conference, Corporate, Creative, Design, Economy, Executive, Finance, Group, Growth, Idea, Illustration, Leadership, Meeting, New, Occupation, Office, People, Person, Progress, Silhouette, Space, Speaking, Standing, Success Get accustomed to appreciation with our Ppt Group Of Describing People PowerPoint Presentation With 3d Pie Chart Templates. You will be getting a lot of it.
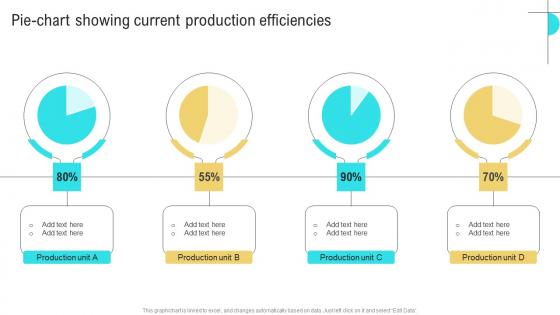
Pie Chart Showing Current Business Performance Optimization New Operations Strategy Portrait Pdf
Here you can discover an assortment of the finest PowerPoint and Google Slides templates. With these templates, you can create presentations for a variety of purposes while simultaneously providing your audience with an eye catching visual experience. Download Pie Chart Showing Current Business Performance Optimization New Operations Strategy Portrait Pdf to deliver an impeccable presentation. These templates will make your job of preparing presentations much quicker, yet still, maintain a high level of quality. Slidegeeks has experienced researchers who prepare these templates and write high quality content for you. Later on, you can personalize the content by editing the Pie Chart Showing Current Business Performance Optimization New Operations Strategy Portrait Pdf. Our Pie Chart Showing Current Business Performance Optimization New Operations Strategy Portrait Pdf are topically designed to provide an attractive backdrop to any subject. Use them to look like a presentation pro.
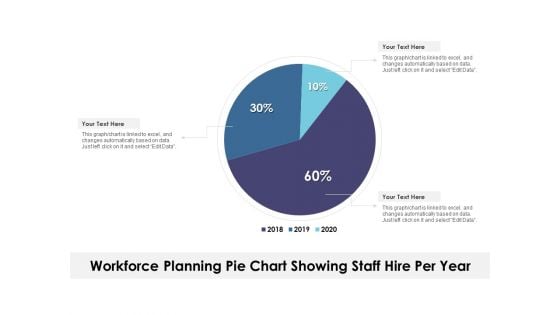
Workforce Planning Pie Chart Showing Staff Hire Per Year Ppt PowerPoint Presentation Show Demonstration PDF
Pitch your topic with ease and precision using this workforce planning pie chart showing staff hire per year ppt powerpoint presentation show demonstration pdf. This layout presents information on workforce planning pie chart showing staff hire per year. It is also available for immediate download and adjustment. So, changes can be made in the color, design, graphics or any other component to create a unique layout.
PowerPoint Templates Executive Leadership 3d Circle Chart List Ppt Slide Designs
PowerPoint Templates Executive Leadership 3d Circle Chart list PPT Slide Designs-These high quality powerpoint pre-designed slides and powerpoint templates have been carefully created by our professional team to help you impress your audience. All slides have been created and are 100% editable in powerpoint. Each and every property of any graphic - color, size, orientation, shading, outline etc. can be modified to help you build an effective powerpoint presentation. Any text can be entered at any point in the powerpoint template or slide. Simply DOWNLOAD, TYPE and PRESENT! Operate efficiently with our PowerPoint Templates Executive Leadership 3d Circle Chart List Ppt Slide Designs. Download without worries with our money back guaranteee.
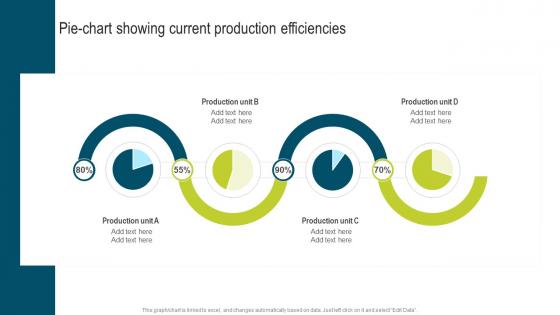
Pie Chart Showing Current Production Developing Extensive Plan For Operational Guidelines Pdf
Take your projects to the next level with our ultimate collection of Pie Chart Showing Current Production Developing Extensive Plan For Operational Guidelines Pdf. Slidegeeks has designed a range of layouts that are perfect for representing task or activity duration, keeping track of all your deadlines at a glance. Tailor these designs to your exact needs and give them a truly corporate look with your own brand colors they well make your projects stand out from the rest. Our Pie Chart Showing Current Production Developing Extensive Plan For Operational Guidelines Pdf are topically designed to provide an attractive backdrop to any subject. Use them to look like a presentation pro.

Pie Chart Result Discussion With Team PowerPoint Templates Ppt Backgrounds For Slides 0613
Raise A Toast With Our People Powerpoint Templates. Spread Good Cheer Amongst Your Audience. Press The Right Buttons With Our Pie Charts Powerpoint Templates. They Will Take Your Ideas Down The Perfect Channel. Your ideas will raise the stocks. Gain equity with our Pie Chart Result Discussion With Team PowerPoint Templates Ppt Backgrounds For Slides 0613.

Team Efforts To Complete The Task Pie Chart PowerPoint Templates Ppt Backgrounds For Slides 0813
Double your chances with our Team Efforts To Complete The Task Pie Chart PowerPoint Templates PPT Backgrounds For Slides. The value of your thoughts will increase two-fold. Charm the audience with your thoughts. Add our Pie Charts PowerPoint Templates and they will be dotty for you. Double up our Teamwork PowerPoint Templates with your thoughts. They will make an awesome pair.
System Deployment Project Sprint Burndown Chart Representing Team Velocity Icons PDF
This slide represents the chart to help management to track total work remaining in the software implementation and the likelihood of achieving software implementation goal. It represents significance of sprint burndown chart. Create an editable System Deployment Project Sprint Burndown Chart Representing Team Velocity Icons PDF that communicates your idea and engages your audience. Whether youre presenting a business or an educational presentation, pre-designed presentation templates help save time. System Deployment Project Sprint Burndown Chart Representing Team Velocity Icons PDF is highly customizable and very easy to edit, covering many different styles from creative to business presentations. Slidegeeks has creative team members who have crafted amazing templates. So, go and get them without any delay.


 Continue with Email

 Home
Home


