Employee Turnover Dashboard

Requirements For Natural Language Generation System AI Content Creation It Ppt Template
This slide represents the different needs of a Natural Language Generation system. The purpose of this slide is to showcase the various requirements for the NLG system, including primary data to be conveyed, the structure of content, the flow of sentences, choice of words, right referring expressions, and so on. Slidegeeks is here to make your presentations a breeze with Requirements For Natural Language Generation System AI Content Creation It Ppt Template With our easy-to-use and customizable templates, you can focus on delivering your ideas rather than worrying about formatting. With a variety of designs to choose from, you are sure to find one that suits your needs. And with animations and unique photos, illustrations, and fonts, you can make your presentation pop. So whether you are giving a sales pitch or presenting to the board, make sure to check out Slidegeeks first This slide represents the different needs of a Natural Language Generation system. The purpose of this slide is to showcase the various requirements for the NLG system, including primary data to be conveyed, the structure of content, the flow of sentences, choice of words, right referring expressions, and so on.
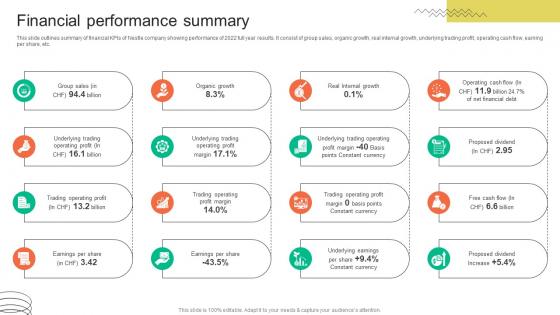
Financial Performance Summary FMCG Provider Company Profile CP SS V
This slide outlines summary of financial KPIs of Nestle company showing performance of 2022 full year results. It consist of group sales, organic growth, real internal growth, underlying trading profit, operating cash flow, earning per share, etc. Find highly impressive Financial Performance Summary FMCG Provider Company Profile CP SS V on Slidegeeks to deliver a meaningful presentation. You can save an ample amount of time using these presentation templates. No need to worry to prepare everything from scratch because Slidegeeks experts have already done a huge research and work for you. You need to download Financial Performance Summary FMCG Provider Company Profile CP SS V for your upcoming presentation. All the presentation templates are 100 percent editable and you can change the color and personalize the content accordingly. Download now This slide outlines summary of financial KPIs of Nestle company showing performance of 2022 full year results. It consist of group sales, organic growth, real internal growth, underlying trading profit, operating cash flow, earning per share, etc.
Ppt Interrelated Arrows Three Practice The PowerPoint Macro Steps Business Templates
PPT interrelated arrows three practice the powerpoint macro steps Business Templates-Use this graphical approach to represent global business issues such as financial data, stock market Exchange, increase in sales, corporate presentations and more. This image has been conceived to enable you to emphatically communicate your ideas in your Business, Marketing PPT presentation.-PPT interrelated arrows three practice the powerpoint macro steps Business Templates-Aim, Arrow, Arrowheads, Badge, Border, Click, Connection, Curve, Design, Direction, Download, Element, Fuchsia, Icon, Illustration, Indicator, Internet, Magenta, Mark, Object, Orientation, Pointer, Shadow, Shape, Sign Achieve high-performance with our Ppt Interrelated Arrows Three Practice The PowerPoint Macro Steps Business Templates. They will make you look good.
Ppt Direct Demonstration Of Process Using Arrows Download PowerPoint Layouts Templates
PPT direct demonstration of process using arrows download powerpoint layouts Templates-Use this graphical approach to represent global business issues such as financial data, stock market Exchange, increase in sales, corporate presentations and more. It Signifies common, comprehensive, extensive, global, international, multinational, omnipresent, planetary, ubiquitous, universal etc.-PPT direct demonstration of process using arrows download powerpoint layouts Templates-Aim, Arrow, Arrowheads, Badge, Border, Click, Connection, Curve, Design, Direction, Download, Element, Fuchsia, Icon, Illustration, Indicator, Internet, Magenta, Mark, Object, Orientation, Pointer, Shadow, Shape, Sign Deliver fascinating presentations with our Ppt Direct Demonstration Of Process Using Arrows Download PowerPoint Layouts Templates. Dont waste time struggling with PowerPoint. Let us do it for you.
Ppt Pointing Curved Arrow Forging Process PowerPoint Slides 6 State Diagram Templates
PPT pointing curved arrow forging process powerpoint slides 6 state diagram Templates-This diagram is an amazing tool to ensure that strategic planning sessions contribute to teambuilding. Use this graphical approach to represent global business issues such as financial data, stock market Exchange, increase in sales, corporate presentations and more.-PPT pointing curved arrow forging process powerpoint slides 6 state diagram Templates-Aim, Arrow, Arrowheads, Badge, Border, Click, Connection, Curve, Design, Direction, Download, Element, Fuchsia, Icon, Illustration, Indicator, Internet, Magenta, Mark, Object, Orientation, Pointer, Shadow, Shape, Sign Figureout answers with our Ppt Pointing Curved Arrow Forging Process PowerPoint Slides 6 State Diagram Templates. They assist in addressing any and all doubts.
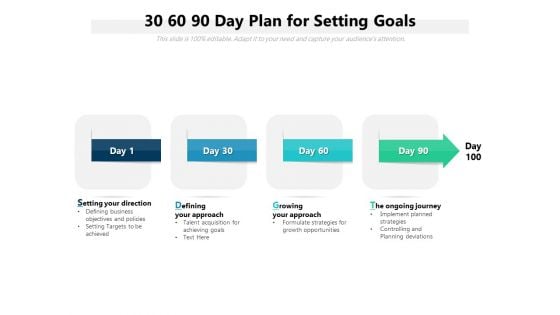
30 60 90 Day Plan For Setting Goals Ppt PowerPoint Presentation Diagram Lists PDF
Presenting this set of slides with name 30 60 90 day plan for setting goals ppt powerpoint presentation diagram lists pdf. This is a five stage process. The stages in this process are knowing the organization and colleagues, understanding company websites and annual reports, building network with colleagues, strategies used for sales and operations, knowing the current market, business planning to achieve targets, review and feedback from top level management. This is a completely editable PowerPoint presentation and is available for immediate download. Download now and impress your audience.
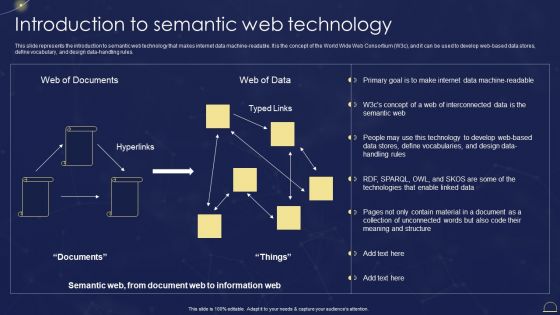
Semantic Web Technologies Introduction To Semantic Web Technology Portrait PDF
This slide represents the introduction to semantic web technology that makes internet data machine-readable. It is the concept of the World Wide Web Consortium W3c, and it can be used to develop web-based data stores, define vocabulary, and design data-handling rules. Slidegeeks is here to make your presentations a breeze with Semantic Web Technologies Introduction To Semantic Web Technology Portrait PDF With our easy-to-use and customizable templates, you can focus on delivering your ideas rather than worrying about formatting. With a variety of designs to choose from, youre sure to find one that suits your needs. And with animations and unique photos, illustrations, and fonts, you can make your presentation pop. So whether youre giving a sales pitch or presenting to the board, make sure to check out Slidegeeks first.
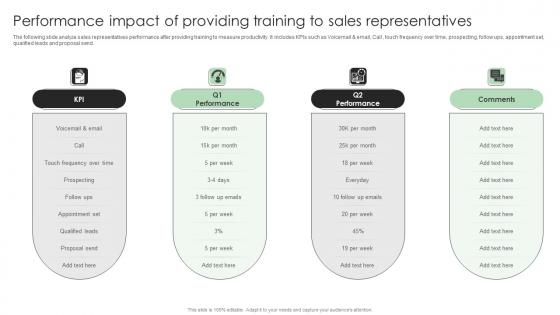
Performance Enhancement Plan Performance Impact Of Providing Training Graphics Pdf
The following slide analyze sales representatives performance after providing training to measure productivity. It includes KPIs such as Voicemail and email, Call , touch frequency over time, prospecting, follow ups, appointment set, qualified leads and proposal send. Explore a selection of the finest Performance Enhancement Plan Performance Impact Of Providing Training Graphics Pdf here. With a plethora of professionally designed and pre-made slide templates, you can quickly and easily find the right one for your upcoming presentation. You can use our Performance Enhancement Plan Performance Impact Of Providing Training Graphics Pdf to effectively convey your message to a wider audience. Slidegeeks has done a lot of research before preparing these presentation templates. The content can be personalized and the slides are highly editable. Grab templates today from Slidegeeks. The following slide analyze sales representatives performance after providing training to measure productivity. It includes KPIs such as Voicemail and email, Call , touch frequency over time, prospecting, follow ups, appointment set, qualified leads and proposal send.
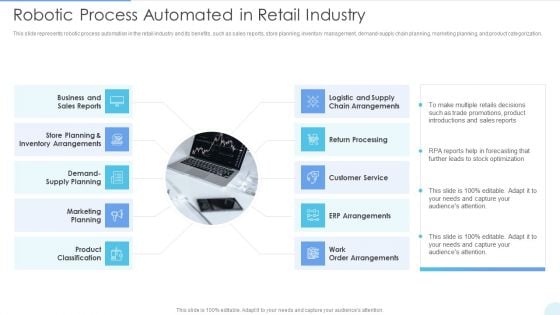
Robotic Process Automated In Retail Industry Graphics PDF
This slide represents robotic process automation in the retail industry and its benefits, such as sales reports, store planning, inventory management, demand supply chain planning, marketing planning, and product categorization. Presenting Robotic Process Automated In Retail Industry Graphics PDF to provide visual cues and insights. Share and navigate important information on ten stages that need your due attention. This template can be used to pitch topics like Return Processing, Customer Service, Work Order Arrangements. In addtion, this PPT design contains high resolution images, graphics, etc, that are easily editable and available for immediate download.
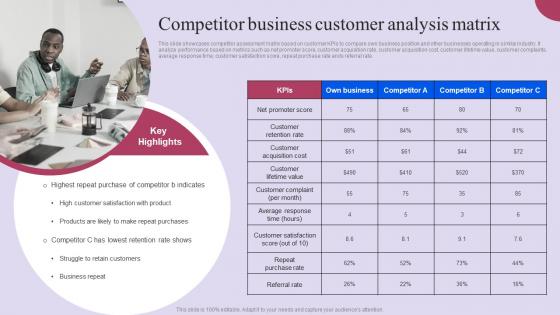
Competitor Business Customer Analysis Matrix Ppt Layouts Example File Pdf
This slide showcases competitor assessment matrix based on customer KPIs to compare own business position and other businesses operating in similar industry. It analyze performance based on metrics such as net promoter score, customer acquisition rate, customer acquisition cost, customer lifetime value, customer complaints, average response time, customer satisfaction score, repeat purchase rate ands referral rate. Slidegeeks is here to make your presentations a breeze with Competitor Business Customer Analysis Matrix Ppt Layouts Example File Pdf With our easy to use and customizable templates, you can focus on delivering your ideas rather than worrying about formatting. With a variety of designs to choose from, you are sure to find one that suits your needs. And with animations and unique photos, illustrations, and fonts, you can make your presentation pop. So whether you are giving a sales pitch or presenting to the board, make sure to check out Slidegeeks first This slide showcases competitor assessment matrix based on customer KPIs to compare own business position and other businesses operating in similar industry. It analyze performance based on metrics such as net promoter score, customer acquisition rate, customer acquisition cost, customer lifetime value, customer complaints, average response time, customer satisfaction score, repeat purchase rate ands referral rate.
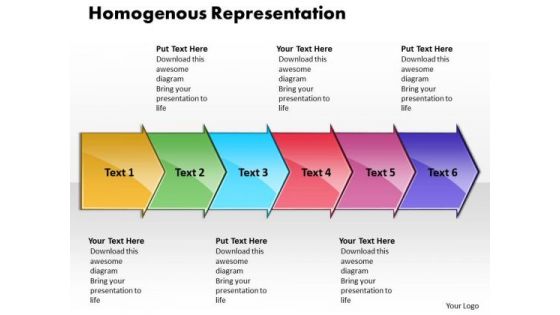
Ppt Homogenuous Representation By 6 Shapes Arrows PowerPoint Templates
PPT homogenuous representation by 6 shapes arrows powerpoint Templates-Use this graphical approach to represent global business issues such as financial data, stock market Exchange, increase in sales, corporate presentations and more. This image has been conceived to enable you to emphatically communicate your ideas in your Business, Marketing PPT presentation.-PPT homogenuous representation by 6 shapes arrows powerpoint Templates-Arrow, Background, Process, Business, Chart, Diagram, Financial, Graphic, Gray, Icon, Illustration, Management, Orange, Perspective, Planning Process, Stages, Steps, Text, Transparency Get a fabulous start with our Ppt Homogenuous Representation By 6 Shapes Arrows PowerPoint Templates. Put your audience in an excellent mood.
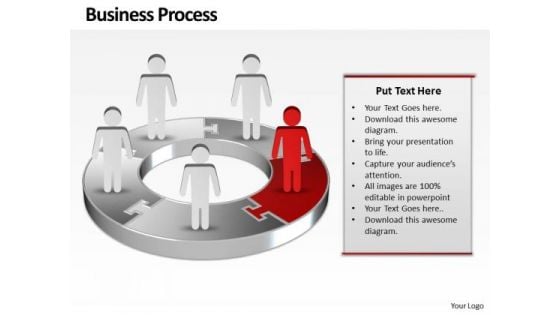
Ppt Red Men Standing On Business PowerPoint Theme Pie Chart Templates
PPT red men standing on business powerpoint theme pie chart Templates-Use this graphical approach to represent global business issues such as financial data, stock market Exchange, increase in sales, corporate presentations and more.-PPT red men standing on business powerpoint theme pie chart Templates-3d, arrow, background, blue, chart, circle, circular, clipart, colorful, connection, continuity, cycle, cyclic, diagram, direction, flow, graph, icon, illustration, isolated, loop, motion, process, progress, recycle, ring, round, step, sticker, symbol, teamwork, template, turn, vector Make a beautiful presentation with our Ppt Red Men Standing On Business PowerPoint Theme Pie Chart Templates. Just download, type and present.
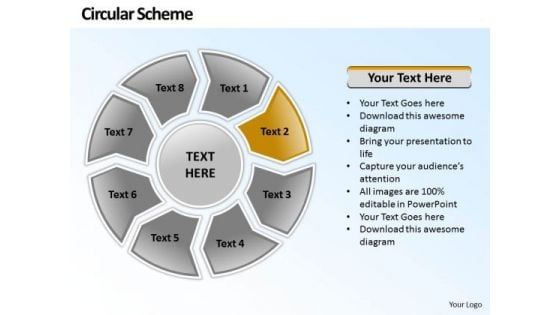
Ppt Circular PowerPoint Menu Template Scheme 8 Phase Diagram Templates
PPT circular powerpoint menu template scheme 8 phase diagram Templates-Use this graphical approach to represent global business issues such as financial data, stock market Exchange, increase in sales, corporate presentations and more. It illustrates the second stage of the process.-PPT circular powerpoint menu template scheme 8 phase diagram Templates-Arrow, Art, Blue, Business, Button, Circular, Clip, Design, Diagram, Drop, Element, Glowing, Graph, Graphic, Icon, Illustration, Isolated, Process, Round, Set, Shadow, Sphere, Symbol Our Ppt Circular PowerPoint Menu Template Scheme 8 Phase Diagram Templates provide a common thread. Stitch all different factions together.
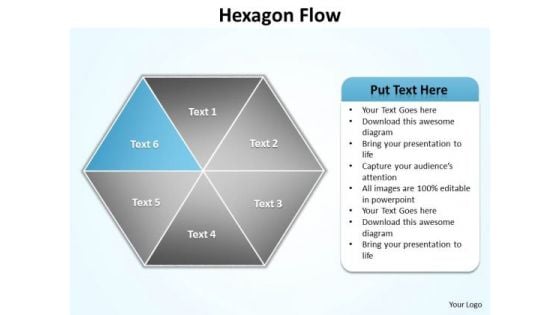
Ppt Blue Factor Hexagon Angles Spider Diagram PowerPoint Template Editable Templates
PPT blue factor hexagon angles spider diagram PowerPoint template editable Templates-You can easily collaborate this PowerPoint diagram with colleagues to create detailed process diagrams and use them as a key element in streamlining your processes. Use this graphical approach to represent global business issues such as financial data, stock market Exchange, increase in sales, corporate presentations and more. -PPT blue factor hexagon angles spider diagram PowerPoint template editable Templates-attached, backgrounds, blue, cell, color, component, connect, connection, diagram, elements, geometric, graphic, group, hexagon, honeycomb, icon, illustration, intricacy, lines, link, map, mesh, model, network, science, shape, shiny, strategy, structure, symbol, teamwork, technology Out Ppt Blue Factor Hexagon Angles Spider Diagram PowerPoint Template Editable Templates embody the contemporary. They are always at the forefront of fashion.


 Continue with Email

 Home
Home


