Engineer Icon
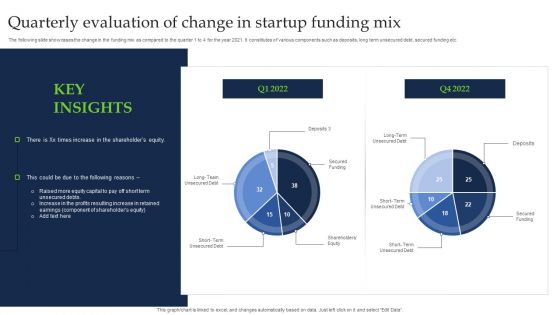
Quarterly Evaluation Of Change In Startup Funding Mix Diagrams PDF
The following slide showcases the change in the funding mix as compared to the quarter 1 to 4 for the year 2021. It constitutes of various components such as deposits, long term unsecured debt, secured funding etc. Showcasing this set of slides titled Quarterly Evaluation Of Change In Startup Funding Mix Diagrams PDF. The topics addressed in these templates are Secured Funding, Term Unsecured Debt, Shareholder Equity. All the content presented in this PPT design is completely editable. Download it and make adjustments in color, background, font etc. as per your unique business setting.
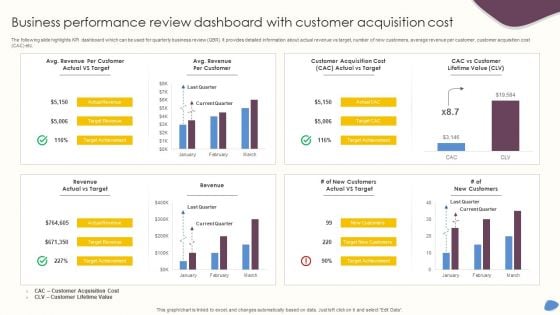
Business Performance Review Dashboard With Customer Acquisition Cost Diagrams PDF
The following slide highlights KPI dashboard which can be used for quarterly business review QBR. It provides detailed information about actual revenue vs target, number of new customers, average revenue per customer, customer acquisition cost CAC etc. Pitch your topic with ease and precision using this Business Performance Review Dashboard With Customer Acquisition Cost Diagrams PDF. This layout presents information on Revenue, Customer Acquisition Cost, Current Quarter. It is also available for immediate download and adjustment. So, changes can be made in the color, design, graphics or any other component to create a unique layout.
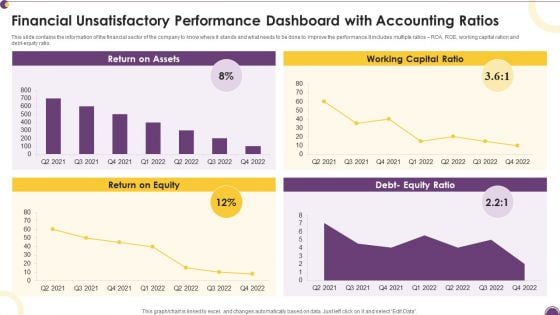
Financial Unsatisfactory Performance Dashboard With Accounting Ratios Diagrams PDF
This slide contains the information of the financial sector of the company to know where it stands and what needs to be done to improve the performance.It includes multiple ratios ROA, ROE, working capital ration and debt-equity ratio. Pitch your topic with ease and precision using this Financial Unsatisfactory Performance Dashboard With Accounting Ratios Diagrams PDF. This layout presents information on Return Assets, Working Capital, Return Equity. It is also available for immediate download and adjustment. So, changes can be made in the color, design, graphics or any other component to create a unique layout.

Personal Job Assignment Distribution Dashboard With Work Patterns Diagrams PDF
The following slide highlights the employee workload distribution dashboard with work patterns illustrating key headings which includes work patterns, work time summary, workload distribution by location and workload summary by time spent. Showcasing this set of slides titled Personal Job Assignment Distribution Dashboard With Work Patterns Diagrams PDF. The topics addressed in these templates are Work Patterns, Workload Distribution, Work Location. All the content presented in this PPT design is completely editable. Download it and make adjustments in color, background, font etc. as per your unique business setting.
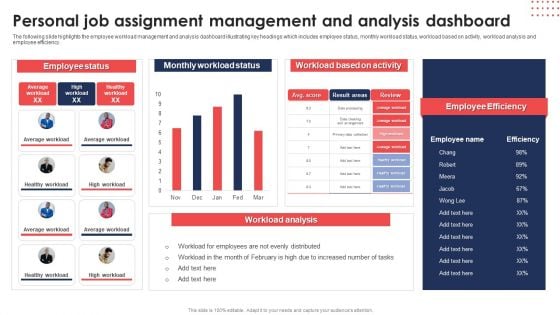
Personal Job Assignment Management And Analysis Dashboard Diagrams PDF
The following slide highlights the employee workload management and analysis dashboard illustrating key headings which includes employee status, monthly workload status, workload based on activity, workload analysis and employee efficiency. Pitch your topic with ease and precision using thisPersonal Job Assignment Management And Analysis Dashboard Diagrams PDF. This layout presents information on Employee Status, Monthly Workload Status, Workload Based Activity. It is also available for immediate download and adjustment. So, changes can be made in the color, design, graphics or any other component to create a unique layout.
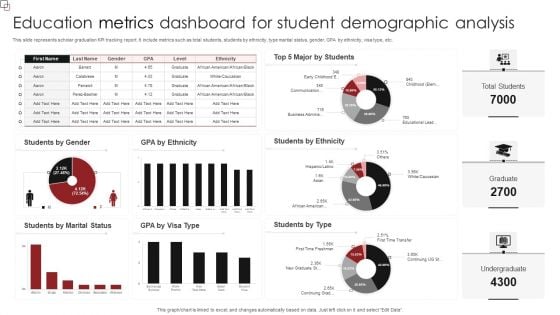
Education Metrics Dashboard For Student Demographic Analysis Diagrams PDF
This slide represents scholar graduation KPI tracking report. It include metrics such as total students, students by ethnicity, type marital status, gender, GPA by ethnicity, visa type, etc. Showcasing this set of slides titled Education Metrics Dashboard For Student Demographic Analysis Diagrams PDF. The topics addressed in these templates are Students Ethnicity, Students Type, Students Marital Status. All the content presented in this PPT design is completely editable. Download it and make adjustments in color, background, font etc. as per your unique business setting.
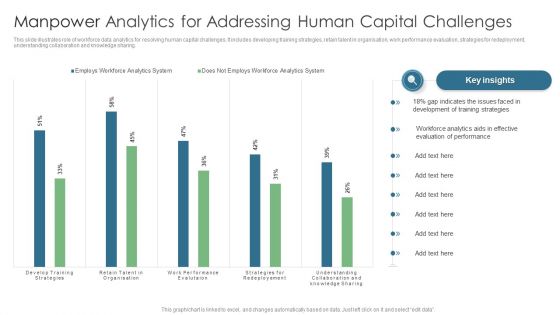
Manpower Analytics For Addressing Human Capital Challenges Diagrams PDF
This slide illustrates role of workforce data analytics for resolving human capital challenges. It includes developing training strategies, retain talent in organisation, work performance evaluation, strategies for redeployment, understanding collaboration and knowledge sharing. Showcasing this set of slides titled Manpower Analytics For Addressing Human Capital Challenges Diagrams PDF. The topics addressed in these templates are Gap Indicates, Training Strategies, Evaluation Performance. All the content presented in this PPT design is completely editable. Download it and make adjustments in color, background, font etc. as per your unique business setting.

Consulting Project Status Report Dashboard With Workspaces Diagrams PDF
The following slide showcases dashboard to provide an insight of active projects, their status and areas that require attention and improvement. Status included are on track, at risk and late Pitch your topic with ease and precision using this Consulting Project Status Report Dashboard With Workspaces Diagrams PDF. This layout presents information on Consulting Project Status Report, Dashboard With Workspaces. It is also available for immediate download and adjustment. So, changes can be made in the color, design, graphics or any other component to create a unique layout.
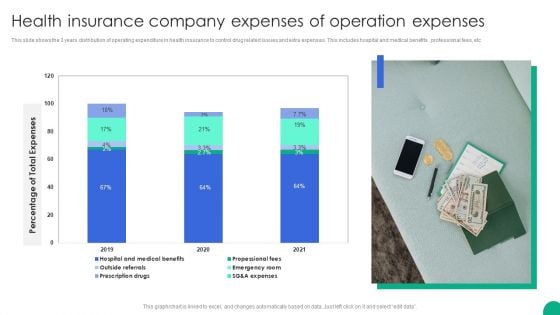
Health Insurance Company Expenses Of Operation Expenses Diagrams PDF
This slide shows the 3 years distribution of operating expenditure in health insurance to control drug related issues and extra expenses. This includes hospital and medical benefits , professional fees, etc.Showcasing this set of slides titled Health Insurance Company Expenses Of Operation Expenses Diagrams PDF. The topics addressed in these templates are Percentage Total Expenses, Propessional Fees, Emergency Room. All the content presented in this PPT design is completely editable. Download it and make adjustments in color, background, font etc. as per your unique business setting.
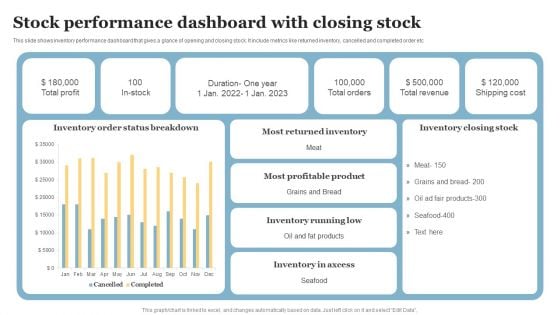
Stock Performance Dashboard With Closing Stock Diagrams PDF
This slide shows inventory performance dashboard that gives a glance of opening and closing stock. It include metrics like returned inventory, cancelled and completed order etc. Pitch your topic with ease and precision using this Stock Performance Dashboard With Closing Stock Diagrams PDF. This layout presents information on Most Returned Inventory, Most Profitable Product, Inventory Running Low. It is also available for immediate download and adjustment. So, changes can be made in the color, design, graphics or any other component to create a unique layout.
Data Structure IT Data Structure Performance Tracking Dashboard Diagrams PDF
Slidegeeks is here to make your presentations a breeze with Data Structure IT Data Structure Performance Tracking Dashboard Diagrams PDF With our easy-to-use and customizable templates, you can focus on delivering your ideas rather than worrying about formatting. With a variety of designs to choose from, youre sure to find one that suits your needs. And with animations and unique photos, illustrations, and fonts, you can make your presentation pop. So whether youre giving a sales pitch or presenting to the board, make sure to check out Slidegeeks first.
Executive Dashboards For Tracking Financial Health Of Enterprise Diagrams PDF
This slide represents the CEO dashboard to track the financial health of an organization. It includes key performance indicators such as revenue, expenses, activity ratio, gross profit margin, EBIT etc. Pitch your topic with ease and precision using this Executive Dashboards For Tracking Financial Health Of Enterprise Diagrams PDF. This layout presents information on Revenue, Expense, Activity Ratio. It is also available for immediate download and adjustment. So, changes can be made in the color, design, graphics or any other component to create a unique layout.
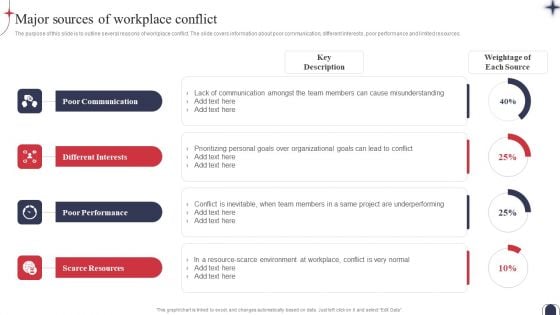
Workplace Conflict Resolution Major Sources Of Workplace Conflict Diagrams PDF
The purpose of this slide is to outline several reasons of workplace conflict. The slide covers information about poor communication, different interests, poor performance and limited resources. The Workplace Conflict Resolution Major Sources Of Workplace Conflict Diagrams PDF is a compilation of the most recent design trends as a series of slides. It is suitable for any subject or industry presentation, containing attractive visuals and photo spots for businesses to clearly express their messages. This template contains a variety of slides for the user to input data, such as structures to contrast two elements, bullet points, and slides for written information. Slidegeeks is prepared to create an impression.
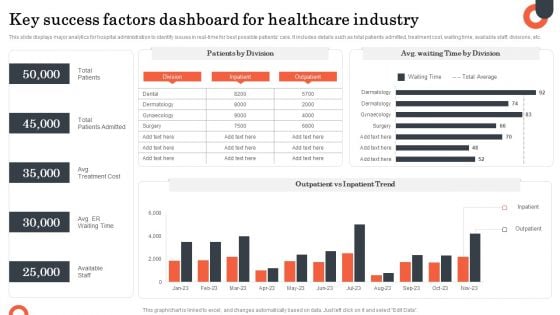
Key Success Factors Dashboard For Healthcare Industry Diagrams PDF
This slide displays major analytics for hospital administration to identify issues in real-time for best possible patients care. It includes details such as total patients admitted, treatment cost, waiting time, available staff, divisions, etc. Showcasing this set of slides titled Key Success Factors Dashboard For Healthcare Industry Diagrams PDF. The topics addressed in these templates are Success Factors, Total Patients, Total Patients Admitted, Available Staff. All the content presented in this PPT design is completely editable. Download it and make adjustments in color, background, font etc. as per your unique business setting.
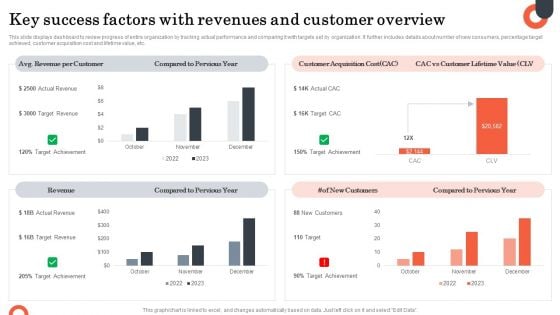
Key Success Factors With Revenues And Customer Overview Diagrams PDF
This slide displays dashboard to review progress of entire organization by tracking actual performance and comparing it with targets set by organization. It further includes details about number of new consumers, percentage target achieved, customer acquisition cost and lifetime value, etc. Showcasing this set of slides titled Key Success Factors With Revenues And Customer Overview Diagrams PDF. The topics addressed in these templates are Compared Pervious Year, Customer Acquisition Cost. All the content presented in this PPT design is completely editable. Download it and make adjustments in color, background, font etc. as per your unique business setting.
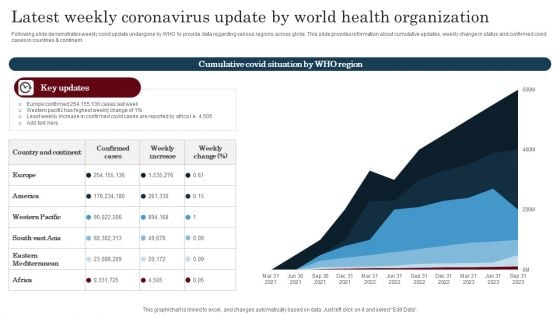
Latest Weekly Coronavirus Update By World Health Organization Diagrams PDF
Following slide highlights the top ten counties coronavirus data which helps community to evaluate current status and follow protocols. This slide includes country specific information such as total cases, death toll, recovered and active cases, etc. Showcasing this set of slides titled Latest Weekly Coronavirus Update By World Health Organization Diagrams PDF. The topics addressed in these templates are atest Weekly Coronavirus, Update, World Health Organization. All the content presented in this PPT design is completely editable. Download it and make adjustments in color, background, font etc. as per your unique business setting.
Plan Dashboard For Tracking Location Wise Revenue Diagrams PDF
This slide presents a dashboard which will assist managers to track the revenue of each branch having geographical presence in different corners of the world. The key performance indicators are total revenue, location wise rent, branch performance among many others.Pitch your topic with ease and precision using this Plan Dashboard For Tracking Location Wise Revenue Diagrams PDF. This layout presents information on Taxes Paid, Current Month, Branch Performance, Previous Quarter. It is also available for immediate download and adjustment. So, changes can be made in the color, design, graphics or any other component to create a unique layout.
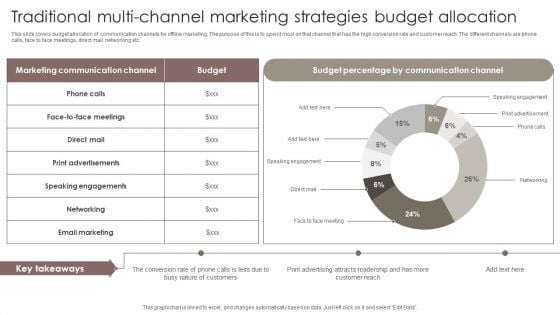
Traditional Multi Channel Marketing Strategies Budget Allocation Diagrams PDF
This slide covers budget allocation of communication channels for offline marketing. The purpose of this is to spend most on that channel that has the high conversion rate and customer reach. The different channels are phone calls, face to face meetings, direct mail, networking etc. Pitch your topic with ease and precision using this Traditional Multi Channel Marketing Strategies Budget Allocation Diagrams PDF. This layout presents information on Communication Channel, Budget Percentage, Speaking Engagements. It is also available for immediate download and adjustment. So, changes can be made in the color, design, graphics or any other component to create a unique layout.
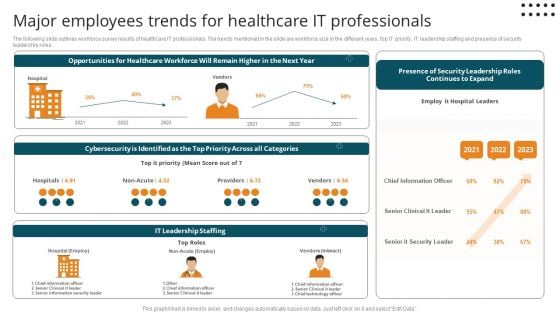
Major Employees Trends For Healthcare It Professionals Diagrams PDF
The following slide outlines workforce survey results of healthcare IT professionals. The trends mentioned in the slide are workforce size in the different years, top IT priority, IT leadership staffing and presence of security leadership roles.Pitch your topic with ease and precision using this Major Employees Trends For Healthcare It Professionals Diagrams PDF. This layout presents information on Cybersecurity Identified, Chief Information, Senior Clinical. It is also available for immediate download and adjustment. So, changes can be made in the color, design, graphics or any other component to create a unique layout.
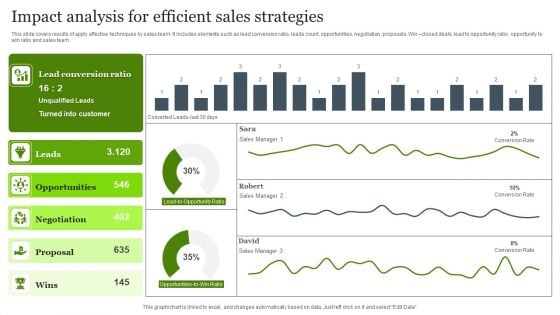
Impact Analysis For Efficient Sales Strategies Diagrams PDF
This slide covers results of apply effective techniques by sales team. It includes elements such as lead conversion ratio, leads count, opportunities, negotiation, proposals. Win closed deals, lead to opportunity ratio, opportunity to win ratio and sales team. Pitch your topic with ease and precision using this Impact Analysis For Efficient Sales Strategies Diagrams PDF. This layout presents information on Customer, Opportunities, Efficient Sales Strategies. It is also available for immediate download and adjustment. So, changes can be made in the color, design, graphics or any other component to create a unique layout.
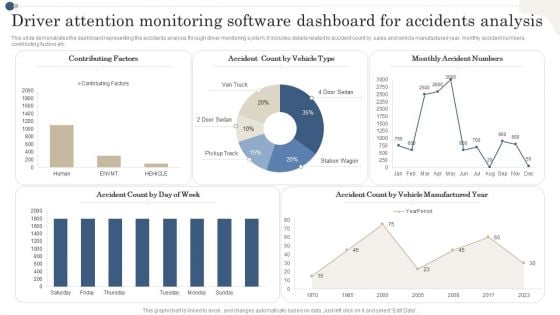
Driver Attention Monitoring Software Dashboard For Accidents Analysis Diagrams PDF
This slide demonstrates the dashboard representing the accidents analysis through driver monitoring system. It includes details related to accident count by sales and vehicle manufactured year, monthly accident numbers, contributing factors etc. Showcasing this set of slides titled Driver Attention Monitoring Software Dashboard For Accidents Analysis Diagrams PDF. The topics addressed in these templates are Contributing Factors,Vehicle Type, Monthly Accident Numbers. All the content presented in this PPT design is completely editable. Download it and make adjustments in color, background, font etc. as per your unique business setting.
Storage Facility Productivity Tracking And Management System Dashboard Diagrams PDF
This slide showcases a dashboard for managing and tracking warehouse productivity to optimize operational process. It includes key components such as user registered, subscribers request, orders, sales, transaction summary and top profiles. Showcasing this set of slides titled Storage Facility Productivity Tracking And Management System Dashboard Diagrams PDF. The topics addressed in these templates are Transaction Summary, Registered Users, Tracking Management. All the content presented in this PPT design is completely editable. Download it and make adjustments in color, background, font etc. as per your unique business setting.
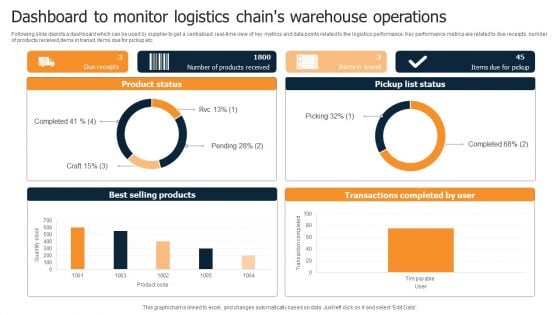
Dashboard To Monitor Logistics Chains Warehouse Operations Diagrams PDF
Following slide depicts a dashboard which can be used by supplier to get a centralized, real-time view of key metrics and data points related to the logistics performance. Key performance metrics are related to due receipts, number of products received,items in transit, items due for pickup etc. Pitch your topic with ease and precision using this Dashboard To Monitor Logistics Chains Warehouse Operations Diagrams PDF. This layout presents information on Product Status, Pickup List Status, Best Selling Products. It is also available for immediate download and adjustment. So, changes can be made in the color, design, graphics or any other component to create a unique layout.
Lead Tracking Metrics Dashboard With User Responses Diagrams PDF
This slide showcases dashboard for lead conversion metrics that can help organization to filter out total leads interested from the leads who have responded to the phone calls by organization. It also showcases key metrics such as leads busiest hours, leads busiest days, phone number types and lead types. Showcasing this set of slides titled Lead Tracking Metrics Dashboard With User Responses Diagrams PDF. The topics addressed in these templates are Busiest Hours Leads, Conversion Metrics, Lead Types. All the content presented in this PPT design is completely editable. Download it and make adjustments in color, background, font etc. as per your unique business setting.
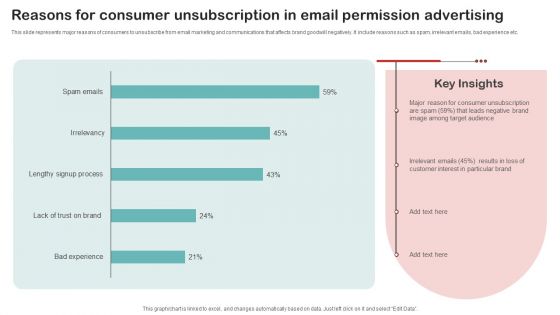
Reasons For Consumer Unsubscription In Email Permission Advertising Diagrams PDF
This slide represents major reasons of consumers to unsubscribe from email marketing and communications that affects brand goodwill negatively. It include reasons such as spam, irrelevant emails, bad experience etc. Pitch your topic with ease and precision using this Reasons For Consumer Unsubscription In Email Permission Advertising Diagrams PDF. This layout presents information on Irrelevant Emails, Customer Interest, Target Audience. It is also available for immediate download and adjustment. So, changes can be made in the color, design, graphics or any other component to create a unique layout.
Company Payout Dashboard For Tracking Expenses And Transactions Diagrams PDF
The slide highlights the dashboard to effectively manage day-to-day payments. Various elements included are wallet, last week transaction, amount receivable, payable, total invoices and previous transactions. Showcasing this set of slides titled Company Payout Dashboard For Tracking Expenses And Transactions Diagrams PDF. The topics addressed in these templates are Last Week Transaction, Your Wallet, Total Invoices, Invoice Done. All the content presented in this PPT design is completely editable. Download it and make adjustments in color, background, font etc. as per your unique business setting.
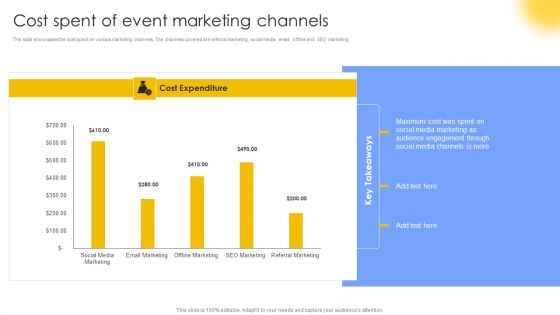
Cost Spent Of Event Marketing Channels Diagrams PDF
This slide showcases the cost spent on various marketing channels. The channels covered are referral marketing, social media, email, offline and SEO marketing. If your project calls for a presentation, then Slidegeeks is your go-to partner because we have professionally designed, easy-to-edit templates that are perfect for any presentation. After downloading, you can easily edit Cost Spent Of Event Marketing Channels Diagrams PDF and make the changes accordingly. You can rearrange slides or fill them with different images. Check out all the handy templates
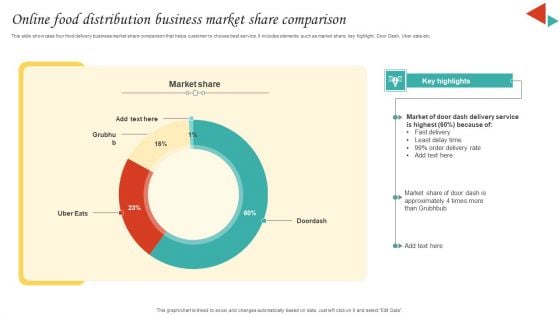
Online Food Distribution Business Market Share Comparison Diagrams PDF
This slide showcase four food delivery business market share comparison that helps customer to choose best service. It includes elements such as market share, key highlight, Door Dash, Uber eats etc. Showcasing this set of slides titled Online Food Distribution Business Market Share Comparison Diagrams PDF. The topics addressed in these templates are Market Share, Delivery Service, Least Delay Time. All the content presented in this PPT design is completely editable. Download it and make adjustments in color, background, font etc. as per your unique business setting.
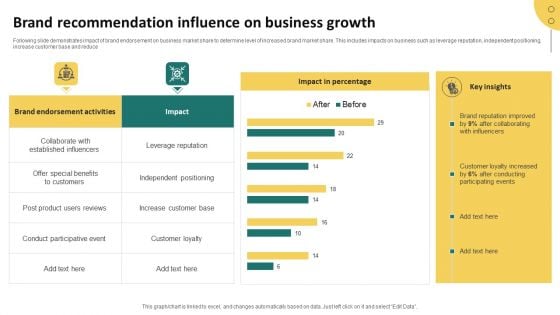
Brand Recommendation Influence On Business Growth Diagrams PDF
Following slide demonstrates impact of brand endorsement on business market share to determine level of increased brand market share. This includes impacts on business such as leverage reputation, independent positioning, increase customer base and reduce. Pitch your topic with ease and precision using this Brand Recommendation Influence On Business Growth Diagrams PDF. This layout presents information on Leverage Reputation, Independent Positioning, Increase Customer Base, Customer Loyalty. It is also available for immediate download and adjustment. So, changes can be made in the color, design, graphics or any other component to create a unique layout.
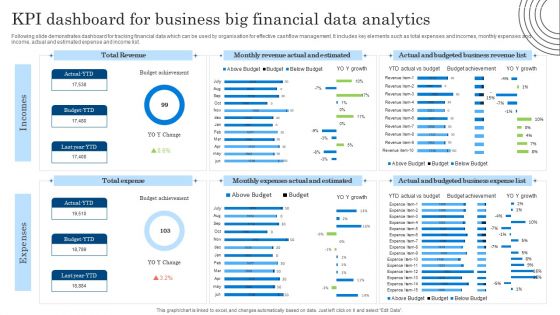
KPI Dashboard For Business Big Financial Data Analytics Diagrams PDF
Following slide demonstrates dashboard for tracking financial data which can be used by organisation for effective cashflow management. It includes key elements such as total expenses and incomes, monthly expenses and income, actual and estimated expense and income list. Showcasing this set of slides titled KPI Dashboard For Business Big Financial Data Analytics Diagrams PDF. The topics addressed in these templates are KPI Dashboard, Business Big Financial, Data Analytics. All the content presented in this PPT design is completely editable. Download it and make adjustments in color, background, font etc. as per your unique business setting.
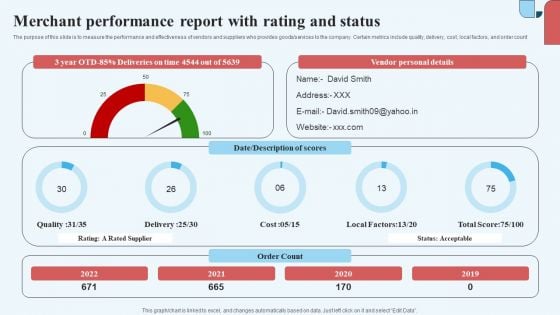
Merchant Performance Report With Rating And Status Diagrams PDF
The purpose of this slide is to measure the performance and effectiveness of vendors and suppliers who provides goods or services to the company. Certain metrics include quality, delivery, cost, local factors, and order count. Showcasing this set of slides titled Merchant Performance Report With Rating And Status Diagrams PDF. The topics addressed in these templates are Merchant Performance Report, Rating And Status. All the content presented in this PPT design is completely editable. Download it and make adjustments in color, background, font etc. as per your unique business setting.
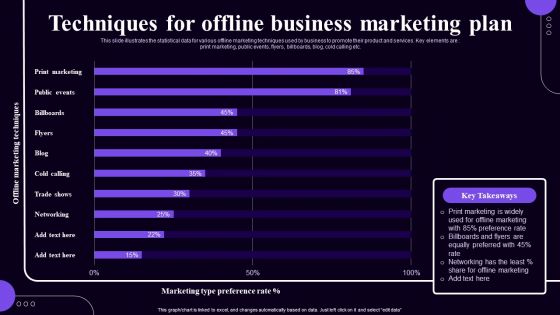
Techniques For Offline Business Marketing Plan Diagrams PDF
This slide illustrates the statistical data for various offline marketing techniques used by business to promote their product and services. Key elements are print marketing, public events, flyers, billboards, blog, cold calling etc. Showcasing this set of slides titled Techniques For Offline Business Marketing Plan Diagrams PDF. The topics addressed in these templates are Print Marketing, Public Events, Billboards. All the content presented in this PPT design is completely editable. Download it and make adjustments in color, background, font etc. as per your unique business setting.
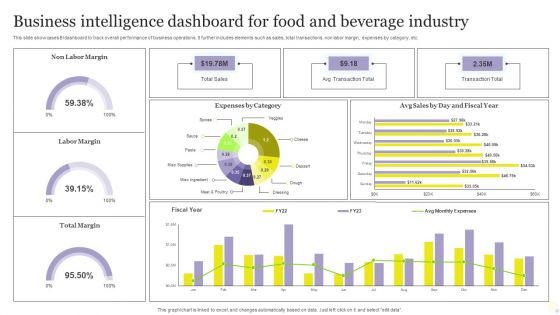
Business Intelligence Dashboard For Food And Beverage Industry Diagrams PDF
This slide showcases BI dashboard to track overall performance of business operations. It further includes elements such as sales, total transactions, non labor margin, expenses by category, etc. Pitch your topic with ease and precision using this Business Intelligence Dashboard For Food And Beverage Industry Diagrams PDF. This layout presents information on Expenses, Sales, Business Intelligence Dashboard. It is also available for immediate download and adjustment. So, changes can be made in the color, design, graphics or any other component to create a unique layout.
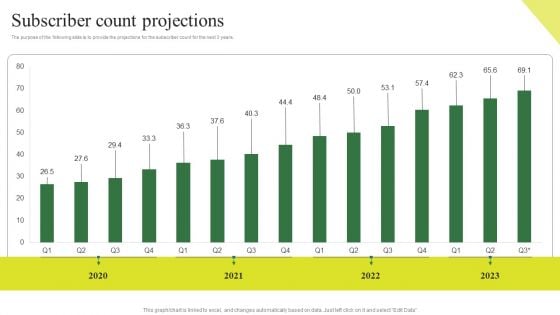
Consumption Based Pricing Model Subscriber Count Projections Diagrams PDF
The purpose of the following slide is to provide the projections for the subscriber count for the next 3 years. The Consumption Based Pricing Model Subscriber Count Projections Diagrams PDF is a compilation of the most recent design trends as a series of slides. It is suitable for any subject or industry presentation, containing attractive visuals and photo spots for businesses to clearly express their messages. This template contains a variety of slides for the user to input data, such as structures to contrast two elements, bullet points, and slides for written information. Slidegeeks is prepared to create an impression.
Ad Campaign Performance Indicators Tracking Dashboard Diagrams PDF
This slide covers dashboard to measure the performance of ad campaigns on LinkedIn platform. The purpose of this template is to provide the company an overview on the outcomes of running ad campaigns on LinkedIn. It includes performance based on impressions, CTR, engagement rates, CPC, CPM, etc. Find a pre designed and impeccable Ad Campaign Performance Indicators Tracking Dashboard Diagrams PDF. The templates can ace your presentation without additional effort. You can download these easy to edit presentation templates to make your presentation stand out from others. So, what are you waiting for Download the template from Slidegeeks today and give a unique touch to your presentation.
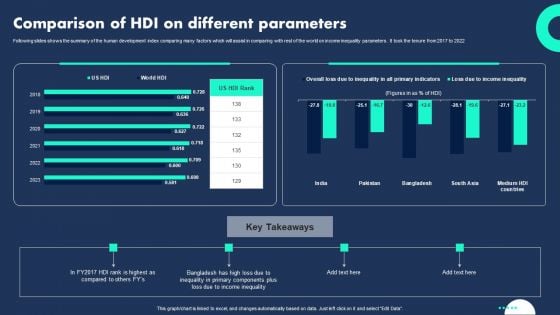
Comparison Of HDI On Different Parameters Diagrams PDF
Following slides shows the summary of the human development index comparing many factors which will assist in comparing with rest of the world on income inequality parameters . It took the tenure from 2017 to 2022. Showcasing this set of slides titled Comparison Of HDI On Different Parameters Diagrams PDF. The topics addressed in these templates are Inequality Primary Components, Plus Loss Income Inequality, Different Parameters . All the content presented in this PPT design is completely editable. Download it and make adjustments in color, background, font etc. as per your unique business setting.
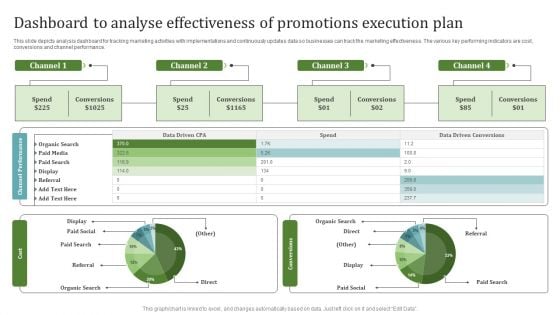
Dashboard To Analyse Effectiveness Of Promotions Execution Plan Diagrams PDF
This slide depicts analysis dashboard for tracking marketing activities with implementations and continuously updates data so businesses can track the marketing effectiveness. The various key performing indicators are cost, conversions and channel performance. Showcasing this set of slides titled Dashboard To Analyse Effectiveness Of Promotions Execution Plan Diagrams PDF. The topics addressed in these templates are Channel Performance, Cost, Conversions. All the content presented in this PPT design is completely editable. Download it and make adjustments in color, background, font etc. as per your unique business setting.
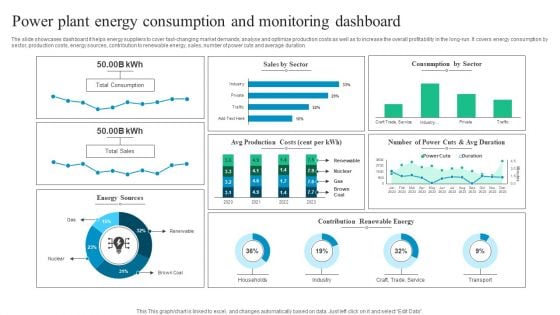
Power Plant Energy Consumption And Monitoring Dashboard Diagrams PDF
The slide showcases dashboard it helps energy suppliers to cover fast-changing market demands, analyse and optimize production costs as well as to increase the overall profitability in the long-run. It covers energy consumption by sector, production costs, energy sources, contribution to renewable energy, sales, number of power cuts and average duration. Pitch your topic with ease and precision using this Power Plant Energy Consumption And Monitoring Dashboard Diagrams PDF. This layout presents information on Power Plant Energy Consumption, Monitoring Dashboard. It is also available for immediate download and adjustment. So, changes can be made in the color, design, graphics or any other component to create a unique layout.
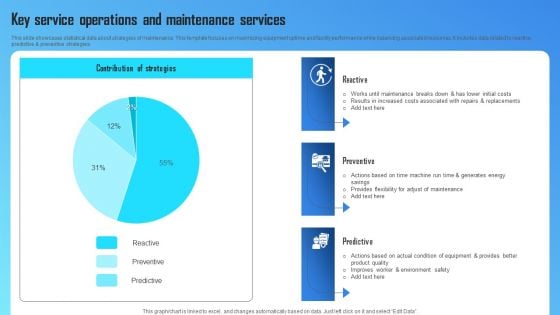
Key Service Operations And Maintenance Services Diagrams PDF
This slide showcases statistical data about strategies of maintenance. This template focuses on maximizing equipment uptime and facility performance while balancing associated resources. It includes data related to reactive, predictive and preventive strategies. Pitch your topic with ease and precision using this Key Service Operations And Maintenance Services Diagrams PDF. This layout presents information on Costs Associated, Environment Safety, Condition Of Equipment. It is also available for immediate download and adjustment. So, changes can be made in the color, design, graphics or any other component to create a unique layout.
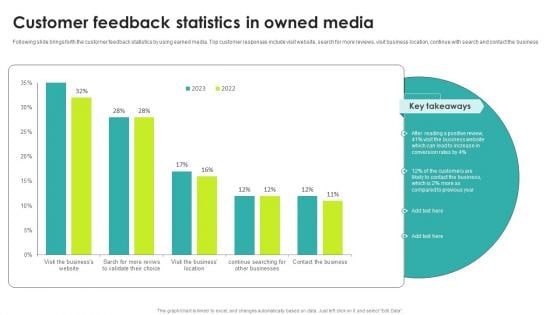
Customer Feedback Statistics In Owned Media Diagrams PDF
Following slide brings forth the customer feedback statistics by using earned media. Top customer responses include visit website, search for more reviews, visit business location, continue with search and contact the business Pitch your topic with ease and precision using this Customer Feedback Statistics In Owned Media Diagrams PDF. This layout presents information on Key Takeaways, Media, Customer. It is also available for immediate download and adjustment. So, changes can be made in the color, design, graphics or any other component to create a unique layout.
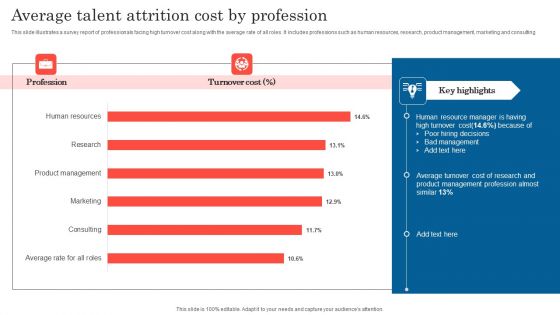
Average Talent Attrition Cost By Profession Diagrams PDF
This slide illustrates a survey report of professionals facing high turnover cost along with the average rate of all roles. It includes professions such as human resources, research, product management, marketing and consulting. Pitch your topic with ease and precision using this Average Talent Attrition Cost By Profession Diagrams PDF. This layout presents information on Human Resource Manager, Key Highlights, Bad Management. It is also available for immediate download and adjustment. So, changes can be made in the color, design, graphics or any other component to create a unique layout.
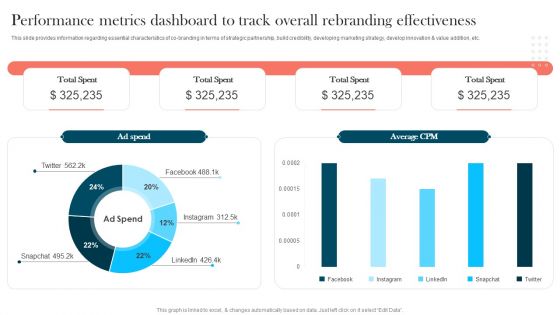
Strengthening Brand Performance Metrics Dashboard To Track Overall Rebranding Themes PDF
This slide provides information regarding essential characteristics of co-branding in terms of strategic partnership, build credibility, developing marketing strategy, develop innovation and value addition, etc. Coming up with a presentation necessitates that the majority of the effort goes into the content and the message you intend to convey. The visuals of a PowerPoint presentation can only be effective if it supplements and supports the story that is being told. Keeping this in mind our experts created Strengthening Brand Performance Metrics Dashboard To Track Overall Rebranding Themes PDF to reduce the time that goes into designing the presentation. This way, you can concentrate on the message while our designers take care of providing you with the right template for the situation.
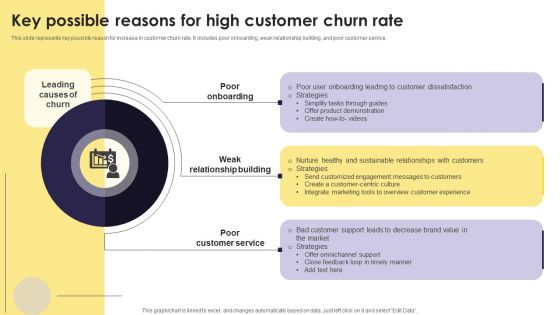
Implementation Of An Efficient Credit Card Promotion Plan Key Possible Reasons High Customer Themes PDF
This slide represents key possible reason for increase in customer churn rate. It includes poor onboarding, weak relationship building, and poor customer service. Coming up with a presentation necessitates that the majority of the effort goes into the content and the message you intend to convey. The visuals of a PowerPoint presentation can only be effective if it supplements and supports the story that is being told. Keeping this in mind our experts created Implementation Of An Efficient Credit Card Promotion Plan Key Possible Reasons High Customer Themes PDF to reduce the time that goes into designing the presentation. This way, you can concentrate on the message while our designers take care of providing you with the right template for the situation.
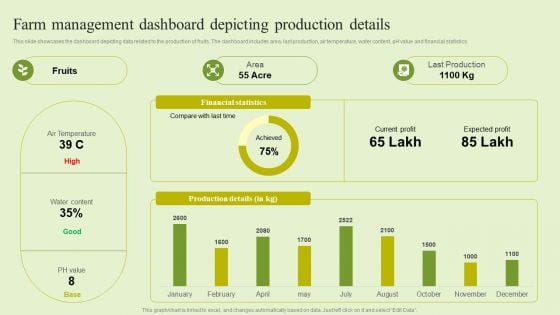
Agriculture Marketing Strategy To Improve Revenue Performance Farm Management Dashboard Depicting Production Themes PDF
This slide showcases the dashboard depicting data related to the production of fruits. The dashboard includes area, last production, air temperature, water content, pH value and financial statistics. Coming up with a presentation necessitates that the majority of the effort goes into the content and the message you intend to convey. The visuals of a PowerPoint presentation can only be effective if it supplements and supports the story that is being told. Keeping this in mind our experts created Agriculture Marketing Strategy To Improve Revenue Performance Farm Management Dashboard Depicting Production Themes PDF to reduce the time that goes into designing the presentation. This way, you can concentrate on the message while our designers take care of providing you with the right template for the situation.
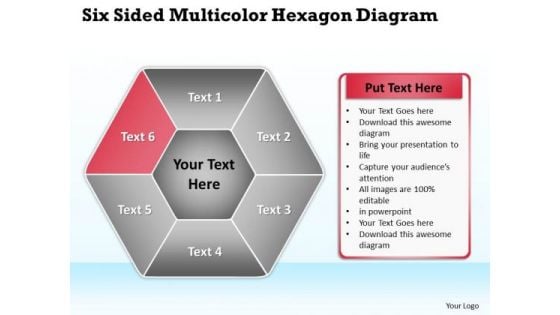
Vision Business Process Diagram PowerPoint Templates Backgrounds For Slides
We present our vision business process diagram PowerPoint templates backgrounds for slides.Present our Process and flows PowerPoint Templates because Our PowerPoint Templates and Slides will let your words and thoughts hit bullseye everytime. Present our Business PowerPoint Templates because Our PowerPoint Templates and Slides will let you Hit the right notes. Watch your audience start singing to your tune. Download our Marketing PowerPoint Templates because You have a driving passion to excel in your field. Our PowerPoint Templates and Slides will prove ideal vehicles for your ideas. Present our Flow Charts PowerPoint Templates because You have gained great respect for your brilliant ideas. Use our PowerPoint Templates and Slides to strengthen and enhance your reputation. Present our Shapes PowerPoint Templates because Our PowerPoint Templates and Slides are the chords of your song. String them along and provide the lilt to your views.Use these PowerPoint slides for presentations relating to Business, button, catalog, chart, circle, company, cross, data, design, diagram, direction, document, financial, four, glossy, goals, graph, green, junction, management, market, marketing, model, multicolored, multiple, navigation, network, options, plan, presentation, process, purple, results, shiny, sphere. The prominent colors used in the PowerPoint template are Red, White, Gray. Professionals tell us our vision business process diagram PowerPoint templates backgrounds for slides are incredible easy to use. Presenters tell us our circle PowerPoint templates and PPT Slides are the best it can get when it comes to presenting. The feedback we get is that our vision business process diagram PowerPoint templates backgrounds for slides are designed by professionals Use our chart PowerPoint templates and PPT Slides will save the presenter time. You can be sure our vision business process diagram PowerPoint templates backgrounds for slides are readymade to fit into any presentation structure. Customers tell us our data PowerPoint templates and PPT Slides are designed by professionals Clip the wings of failure with our Vision Business Process Diagram PowerPoint Templates Backgrounds For Slides. You will come out on top.
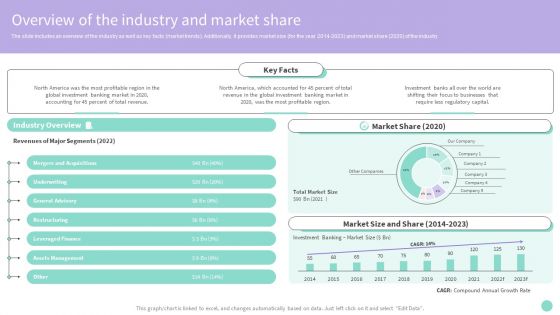
Buy Side Merger And Acquisition Advisory Overview Of The Industry And Market Share Diagrams PDF
The slide includes an overview of the industry as well as key facts market trends. Additionally, it provides market size for the year 2014 to 2023 and market share 2020 of the industry. Do you know about Slidesgeeks de Merger And Acquisition Advisory Overview Of The Industry And Market Share Diagrams PDF These are perfect for delivering any kind od presentation. Using it, create PowerPoint presentations that communicate your ideas and engage audiences. Save time and effort by using our pre designed presentation templates that are perfect for a wide range of topic. Our vast selection of designs covers a range of styles, from creative to business, and are all highly customizable and easy to edit. Download as a PowerPoint template or use them as Google Slides themes.
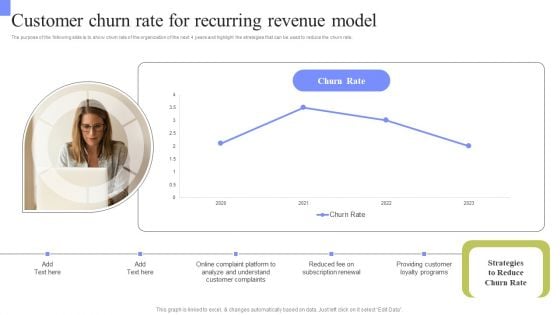
Periodic Revenue Model Customer Churn Rate For Recurring Revenue Model Diagrams PDF
The purpose of the following slide is to show churn rate of the organization of the next 4 years and highlight the strategies that can be used to reduce the churn rate. Do you know about Slidesgeeks Periodic Revenue Model Customer Churn Rate For Recurring Revenue Model Diagrams PDF. These are perfect for delivering any kind od presentation. Using it, create PowerPoint presentations that communicate your ideas and engage audiences. Save time and effort by using our pre designed presentation templates that are perfect for a wide range of topic. Our vast selection of designs covers a range of styles, from creative to business, and are all highly customizable and easy to edit. Download as a PowerPoint template or use them as Google Slides themes.
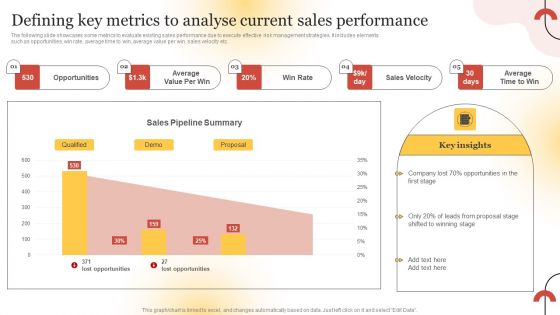
Executing Sales Risk Reduction Plan Defining Key Metrics To Analyse Current Sales Performance Diagrams PDF
The following slide showcases some metrics to evaluate existing sales performance due to execute effective risk management strategies. It includes elements such as opportunities, win rate, average time to win, average value per win, sales velocity etc. Do you know about Slidesgeeks Executing Sales Risk Reduction Plan Defining Key Metrics To Analyse Current Sales Performance Diagrams PDF These are perfect for delivering any kind od presentation. Using it, create PowerPoint presentations that communicate your ideas and engage audiences. Save time and effort by using our pre designed presentation templates that are perfect for a wide range of topic. Our vast selection of designs covers a range of styles, from creative to business, and are all highly customizable and easy to edit. Download as a PowerPoint template or use them as Google Slides themes.
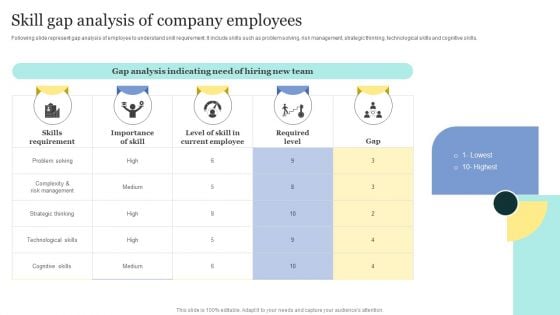
Strategic Approaches To Efficient Candidate Selection Skill Gap Analysis Of Company Employees Diagrams PDF
Following slide represent gap analysis of employee to understand skill requirement. It include skills such as problem solving, risk management, strategic thinking, technological skills and cognitive skills. Do you know about Slidesgeeks Strategic Approaches To Efficient Candidate Selection Skill Gap Analysis Of Company Employees Diagrams PDF These are perfect for delivering any kind od presentation. Using it, create PowerPoint presentations that communicate your ideas and engage audiences. Save time and effort by using our pre-designed presentation templates that are perfect for a wide range of topic. Our vast selection of designs covers a range of styles, from creative to business, and are all highly customizable and easy to edit. Download as a PowerPoint template or use them as Google Slides themes.
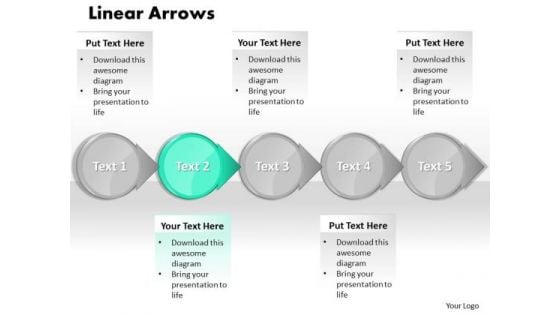
Ppt Cyan Circular Arrow Business PowerPoint Slide Text Download Process Chart Templates
PPT cyan circular arrow business powerpoint slide text download process chart Templates-This mechanical and industrial Diagram for PowerPoint features a 3D representation of interconnected Curved Arrows. Includes several predesigned layouts. Use this successive PowerPoint diagram to represent a series of interconnected ideas.-PPT cyan circular arrow business powerpoint slide text download process chart Templates-abstract, algorithm, arrow, arrow chart, block, block diagram, business, chart, connection, design, development, diagram, direction, element, flow, flowchart, graph, linear, management, organization, plan, process, program, section, segment, set, sign, solution, strategy, symbol, vector Capitalise on the leverage our Ppt Cyan Circular Arrow Business PowerPoint Slide Text Download Process Chart Templates offer. Get maximum benefit for minimum effort.
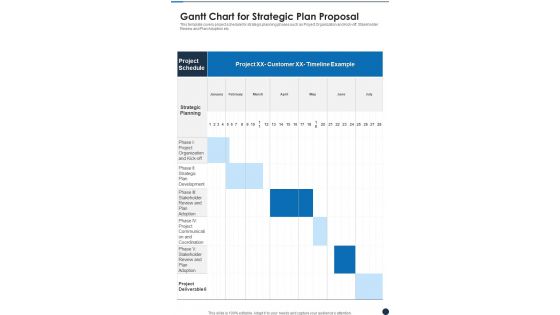
Gantt Chart For Strategic Plan Proposal One Pager Sample Example Document
This template covers project schedule for strategic planning phases such as Project Organization and Kick-off, Stakeholder Review and Plan Adoption etc. Presenting you an exemplary Gantt Chart For Strategic Plan Proposal One Pager Sample Example Document. Our one pager comprises all the must have essentials of an inclusive document. You can edit it with ease, as its layout is completely editable. With such freedom, you can tweak its design and other elements to your requirements. Download this Gantt Chart For Strategic Plan Proposal One Pager Sample Example Document brilliant piece now.
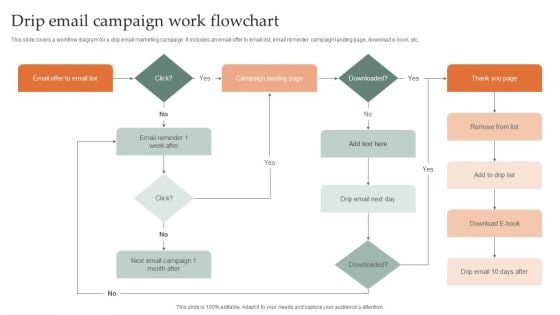
Drip Email Campaign Work Flowchart Diagrams PDF
This slide covers a workflow diagram for a drip email marketing campaign. It includes an email offer to email list, email reminder, campaign landing page, download e-book, etc. Persuade your audience using this Drip Email Campaign Work Flowchart Diagrams PDF. This PPT design covers one stages, thus making it a great tool to use. It also caters to a variety of topics including Drip Email Campaign, Work Flowchart. Download this PPT design now to present a convincing pitch that not only emphasizes the topic but also showcases your presentation skills.

Image Of Beautiful Chocolate Tray Ppt PowerPoint Presentation Professional Background Designs
Presenting this set of slides with name image of beautiful chocolate tray ppt powerpoint presentation professional background designs. The topics discussed in these slides are food, chocolate cake theme, chocolate theme. This is a completely editable PowerPoint presentation and is available for immediate download. Download now and impress your audience.
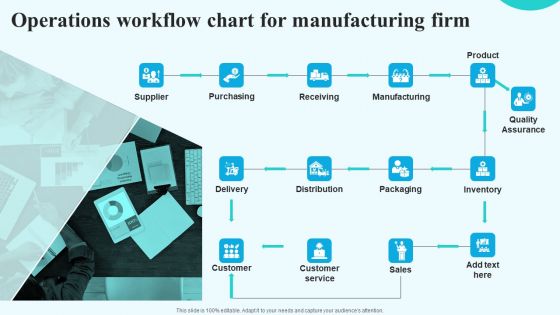
Operations Workflow Chart For Manufacturing Firm Topics PDF
Slidegeeks has constructed Operations Workflow Chart For Manufacturing Firm Topics PDF after conducting extensive research and examination. These presentation templates are constantly being generated and modified based on user preferences and critiques from editors. Here, you will find the most attractive templates for a range of purposes while taking into account ratings and remarks from users regarding the content. This is an excellent jumping off point to explore our content and will give new users an insight into our top notch PowerPoint Templates.
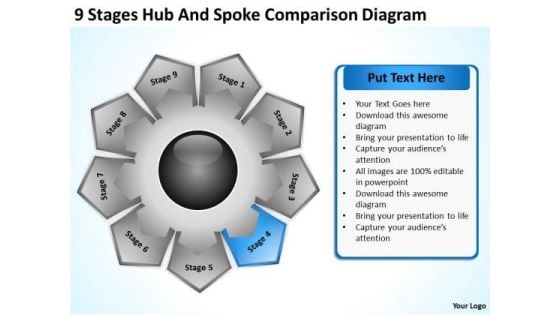
Hub And Spoke Comparison Diagram Business Continuity Plan Template PowerPoint Templates
We present our hub and spoke comparison diagram business continuity plan template PowerPoint templates.Download and present our Business PowerPoint Templates because Our PowerPoint Templates and Slides help you pinpoint your timelines. Highlight the reasons for your deadlines with their use. Download our Process and Flows PowerPoint Templates because Your audience will believe you are the cats whiskers. Download and present our Shapes PowerPoint Templates because It can Conjure up grand ideas with our magical PowerPoint Templates and Slides. Leave everyone awestruck by the end of your presentation. Download our Arrows PowerPoint Templates because Our PowerPoint Templates and Slides will generate and maintain the level of interest you desire. They will create the impression you want to imprint on your audience. Use our Flow Charts PowerPoint Templates because It will Give impetus to the hopes of your colleagues. Our PowerPoint Templates and Slides will aid you in winning their trust.Use these PowerPoint slides for presentations relating to Access, arrow, background, banner, bright, business, chart, concept, conceptual, connection, corporate, creative, design, different, element, empty,flower, form, graphic, group, idea, illustration, match, message, order, part, piece, place, process, shape, solution, special, speech, stage, strategy, template, text, usable, vector, web, website. The prominent colors used in the PowerPoint template are Gray, Blue, Black. Be spiderman with our Hub And Spoke Comparison Diagram Business Continuity Plan Template PowerPoint Templates. You will come out on top.
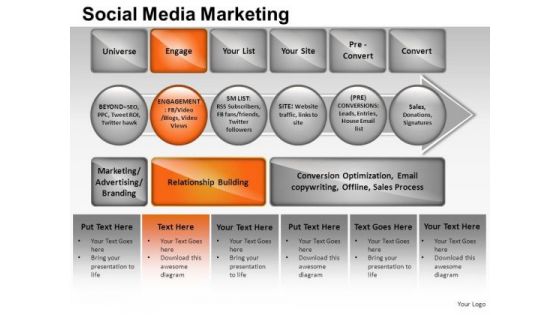
PowerPoint Templates Strategy Social Media Marketing Ppt Themes
PowerPoint Templates Strategy Social Media Marketing PPT Themes-These high quality powerpoint pre-designed slides and powerpoint templates have been carefully created by our professional team to help you impress your audience. All slides have been created and are 100% editable in powerpoint. Each and every property of any graphic - color, size, orientation, shading, outline etc. can be modified to help you build an effective powerpoint presentation. Any text can be entered at any point in the powerpoint template or slide. Simply DOWNLOAD, TYPE and PRESENT! Back up your boast with our PowerPoint Templates Strategy Social Media Marketing Ppt Themes. Demonstrate to your audience that you can.
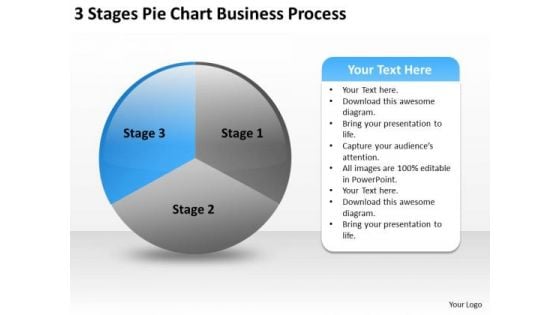
Pie Chart Business PowerPoint Templates Download Process Ppt Plans
We present our pie chart business powerpoint templates download process ppt plans.Use our Circle Charts PowerPoint Templates because you should once Tap the ingenuity of our PowerPoint Templates and Slides. They are programmed to succeed. Download our Process and Flows PowerPoint Templates because you should Whip up a frenzy with our PowerPoint Templates and Slides. They will fuel the excitement of your team. Use our Flow Charts PowerPoint Templates because Our PowerPoint Templates and Slides will generate and maintain the level of interest you desire. They will create the impression you want to imprint on your audience. Use our Business PowerPoint Templates because Our PowerPoint Templates and Slides provide you with a vast range of viable options. Select the appropriate ones and just fill in your text. Use our Shapes PowerPoint Templates because Our PowerPoint Templates and Slides will let you Hit the right notes. Watch your audience start singing to your tune.Use these PowerPoint slides for presentations relating to Abstract, background, banner, blue, bright, business, chart, circle, color, concept, conceptual, corporate, creative, cycle, design,different, element, empty, form, frame, graphic, group, idea, illustration, match, message, order, part, piece, place, process, red, shape, solution, special,speech, strategy, symbol, template, text, usable, web, website. The prominent colors used in the PowerPoint template are Blue, Gray, Black. Evaluate plans with our Pie Chart Business PowerPoint Templates Download Process Ppt Plans. Download without worries with our money back guaranteee.
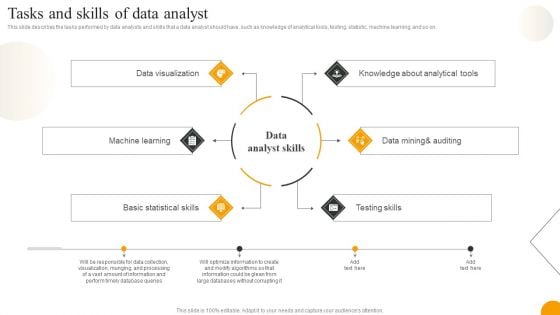
Using Data Science Technologies For Business Transformation Tasks And Skills Of Data Analyst Microsoft PDF
This slide describes the tasks performed by data analysts and skills that a data analyst should have, such as knowledge of analytical tools, testing, statistic, machine learning, and so on. If you are looking for a format to display your unique thoughts, then the professionally designed Using Data Science Technologies For Business Transformation Tasks And Skills Of Data Analyst Microsoft PDF is the one for you. You can use it as a Google Slides template or a PowerPoint template. Incorporate impressive visuals, symbols, images, and other charts. Modify or reorganize the text boxes as you desire. Experiment with shade schemes and font pairings. Alter, share or cooperate with other people on your work. Download Using Data Science Technologies For Business Transformation Tasks And Skills Of Data Analyst Microsoft PDF and find out how to give a successful presentation. Present a perfect display to your team and make your presentation unforgettable.
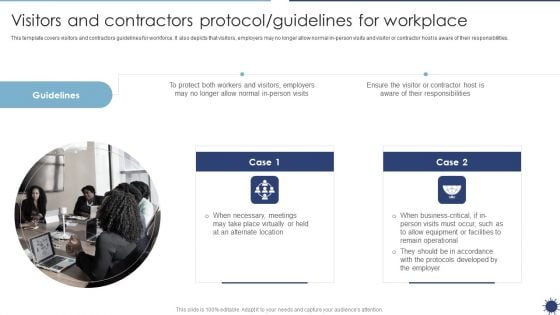
Visitors And Contractors Protocol Guidelines For Workplace Organization Transformation Instructions Mockup PDF
This template covers visitors and contractors guidelines for workforce. It also depicts that visitors, employers may no longer allow normal in-person visits and visitor or contractor host is aware of their responsibilities.If you are looking for a format to display your unique thoughts, then the professionally designed Visitors And Contractors Protocol Guidelines For Workplace Organization Transformation Instructions Mockup PDF is the one for you. You can use it as a Google Slides template or a PowerPoint template. Incorporate impressive visuals, symbols, images, and other charts. Modify or reorganize the text boxes as you desire. Experiment with shade schemes and font pairings. Alter, share or cooperate with other people on your work. Download Visitors And Contractors Protocol Guidelines For Workplace Organization Transformation Instructions Mockup PDF and find out how to give a successful presentation. Present a perfect display to your team and make your presentation unforgettable.
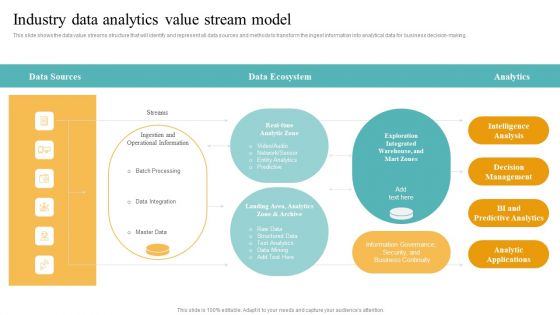
Transformation Toolkit Competitive Intelligence Information Analysis Industry Data Analytics Value Stream Model Raw Mockup PDF
This slide illustrates the workflow related to performing the data analytics project along with key responsible owners to accomplish the activities. If you are looking for a format to display your unique thoughts, then the professionally designed Transformation Toolkit Competitive Intelligence Information Analysis Industry Data Analytics Value Stream Model Raw Mockup PDF is the one for you. You can use it as a Google Slides template or a PowerPoint template. Incorporate impressive visuals, symbols, images, and other charts. Modify or reorganize the text boxes as you desire. Experiment with shade schemes and font pairings. Alter, share or cooperate with other people on your work. Download Transformation Toolkit Competitive Intelligence Information Analysis Industry Data Analytics Value Stream Model Raw Mockup PDF and find out how to give a successful presentation. Present a perfect display to your team and make your presentation unforgettable.


 Continue with Email

 Home
Home


