Engineer Icon
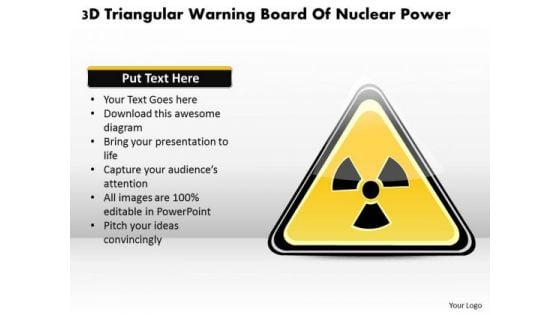
Business Diagram 3d Triangular Warning Board Of Nuclear Power Presentation Template
This Power Point template has been designed with graphic of triangular warning sign. This diagram contains the concept of nuclear safety systems. Use this image for your presentation and get full marks from viewers.

Business Diagram 3d Warning Symbol Of Nuclear Power Production Presentation Template
This Power Point template has been designed with graphic of 3d warning symbol. This warning symbol is used to represent nuclear safety systems. Use this diagram to build informative presentations.

Business Diagram No Man Entry Warning Sign In Nuclear Area Presentation Template
This Power Point template has been designed with graphic of no entry warning sign. This warning image contains the prohibited area remark or no entry place for humans. Use this exclusive diagram for safety related topics.
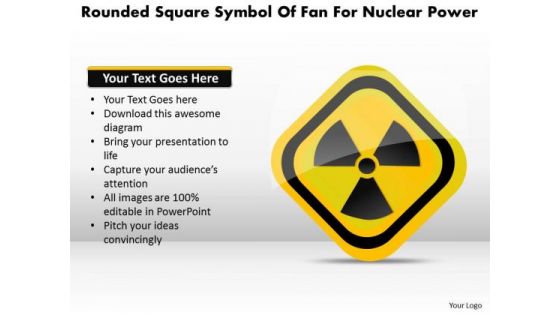
Business Diagram Rounded Square Symbol Of Fan For Nuclear Power Presentation Template
This Power Point template has been designed with graphic of rounded square symbol of fan. This fan is useful for nuclear power related topics. Use this diagram for nuclear energy related presentations.
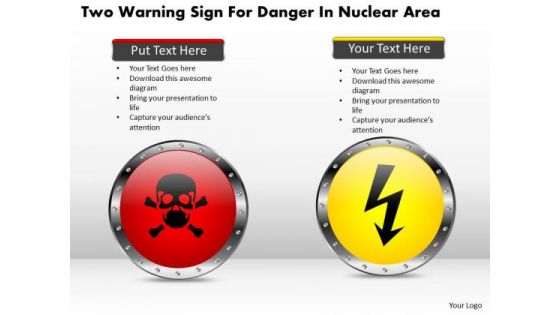
Business Diagram Two Warning Sign For Danger In Nuclear Area Presentation Template
This PowerPoint template has been designed with graphic of two warning sign for danger indication. The importance of safety in the work place can be defined with this diagram. Use this image to build quality presentation for your viewers.

Business Diagram Warning Sign Board For Water Hose For Fire Safety Presentation Template
This diagram has been designed with fire safety sign and fire hose warning sign. This sign board is used to display fire danger. Warning signs are used to alert passers-by to hazards and or draw their attention to important information.
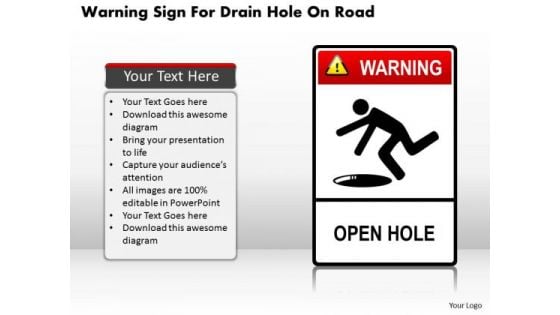
Business Diagram Warning Sign For Drain Hole On Road Presentation Template
This PowerPoint diagram has been designed with graphic of warning sign. This warning sign is displaying the open drain hole on road. Use this image for road safety measures related topics.

Business Diagram Warning Sign For Nuclear Plant And Hazard Presentation Template
This PowerPoint template has been designed with graphic of warning signs. These signs are used to display warning for nuclear power. Use this diagram to make danger indication related presentations.

Business Diagram Watch Out The Main Hole Safety Warning Sign Presentation Template
This PowerPoint template has been designed with graphic of warning sign. This warning sign to display the open main hole. Use this diagram for road safety measures related presentations.
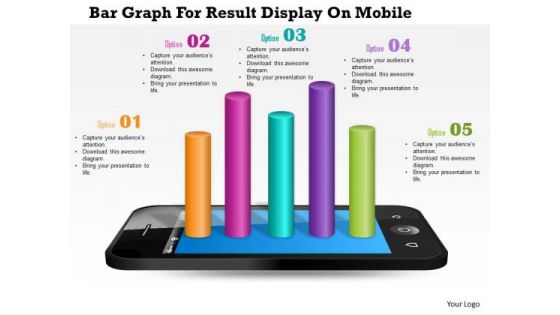
Business Diagram Bar Graph For Result Display On Mobile Presentation Template
This Power Point template has been designed with graphic of bar graph on mobile phone. This business diagram can be used to make business reports. Download this Power Point slide to build quality presentation for your viewers.
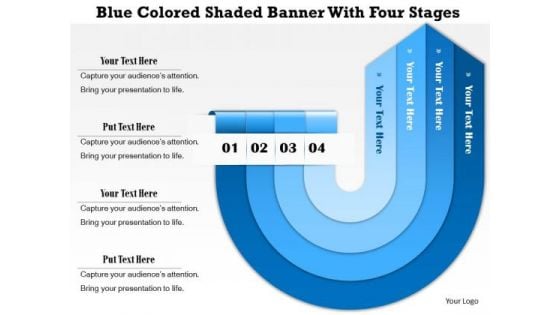
Business Diagram Blue Colored Shaded Banner With Four Stages Presentation Template
Blue colored twisted arrows are used to design this business diagram. These arrows are in banner style with four stages. Use this amazing slide for your data representation in effective manner. Build a unique presentation for your viewers
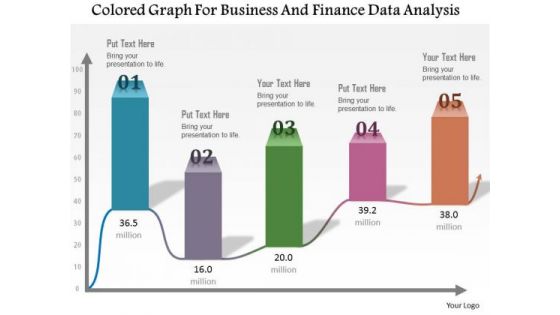
Business Diagram Colored Graph For Business And Finance Data Analysis Presentation Template
This Power Point template has been designed with graphic of colored bar graph. Use this slide to represent five steps of any business process. Use this diagram for your business presentations and get exclusive comments on your efforts.
Business Diagram Hand In Punch Position For Creative Text Presentation Template
This business diagram has been designed with graphic of hand in punch position. This PPT slide contains the space to put text. Use this slide to accomplish your presentation needs at company or business presentations.
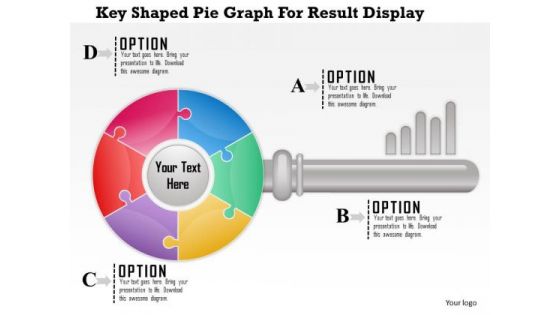
Business Diagram Key Shaped Pie Graph For Result Display Presentation Template
Key shaped pie graph has been used to design this business diagram. This slide has key graphic with abcd options. Use this amazing slide to present a business plan. Download this slide to impress your viewers.
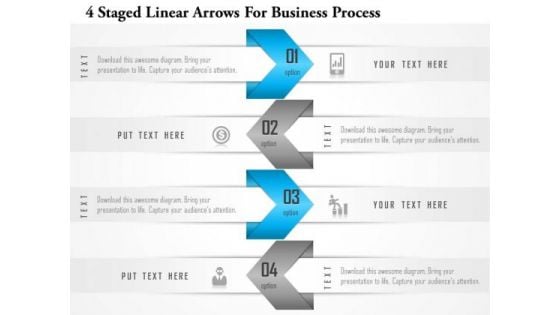
Business Diagram 4 Staged Linear Arrows For Business Process Presentation Template
This Power Point template has been designed with graphic of four staged linear arrow diagram. This PPT contains the concept of business and marketing process flow. Use this PPT for your business and marketing presentations.
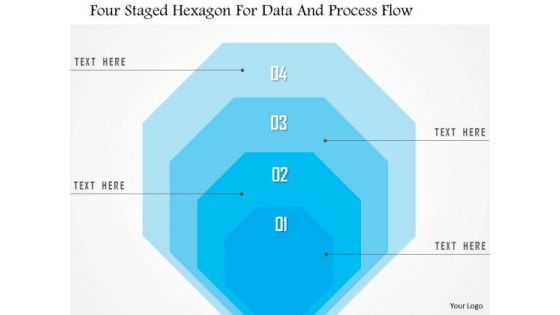
Business Diagram Four Staged Hexagon For Data And Process Flow Presentation Template
Four staged hexagon diagram has been used to design this power point template. This PPT contains the concept of data and process flow. Use this PPT and build professional presentation on business topics.
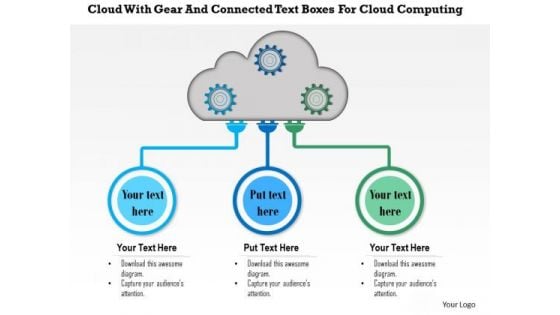
Business Diagram Cloud With Gear And Connected Text Boxes For Cloud Computing Presentation Template
Connected text boxes with clouds and gears are used to design this business diagram. This slide can be used to present statistical information in innovative manner. Download this slide to earn good impressions from the audience.
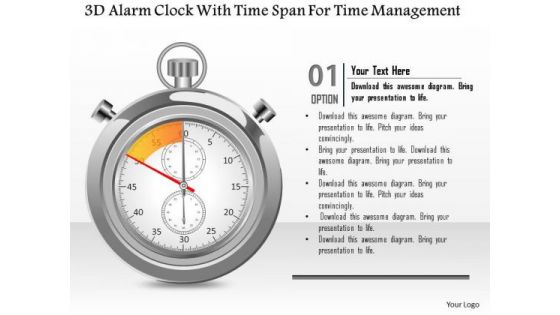
Busines Diagram 3d Alarm Clock With Time Span For Time Management Presentation Template
This business diagram has been designed with graphic of 3d alarm clock. This clock displays the specific time span for time management. Use this editable business slide for your time management related presentations.
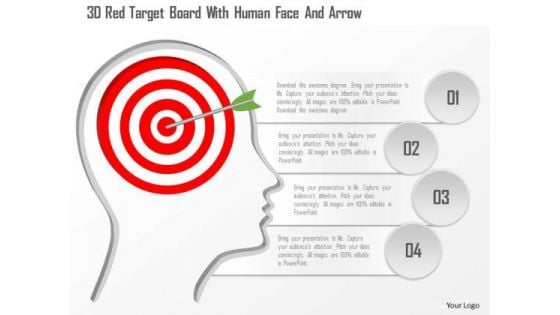
Busines Diagram 3d Red Target Board With Human Face And Arrow Presentation Template
This business diagram has been designed with graphic of 3d red target board on human face. This business slide helps to portray the concept of target achievement. Use this awesome slide for business and marketing target related presentations.
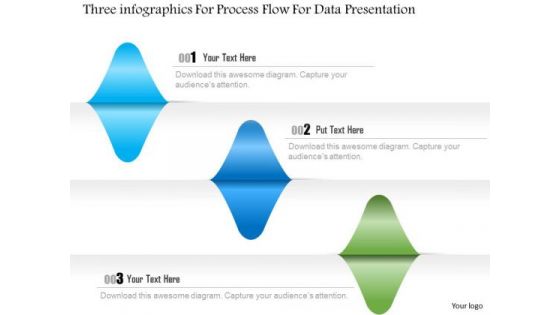
Busines Diagram Three Infographics For Process Flow For Data Presentation Template
Three info graphics has been used to design this business diagram. This slide helps to depict business process flow. This slide offers an excellent background to build professional presentations.
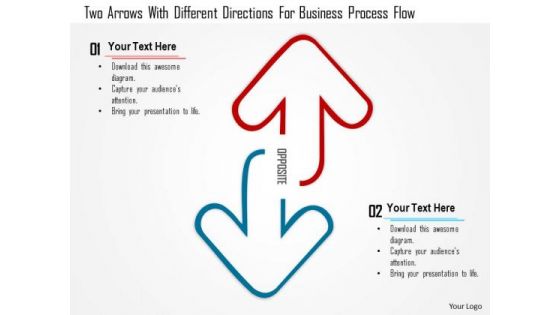
Busines Diagram Two Arrows With Different Directions For Business Process Flow Ppt Template
This business diagram has been designed with graphic of two arrows and different directions. This slide helps to depict business process flow. This slide offers an excellent background to build professional presentations.
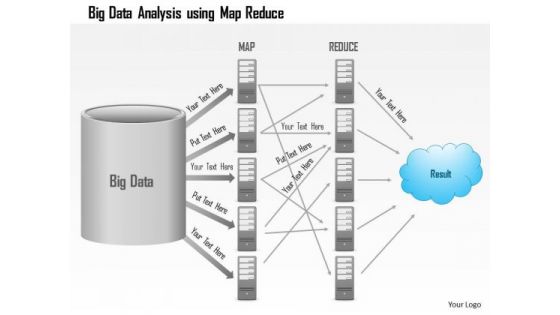
Business Diagram Big Data Analysis Using Map Reduce Batch Processing Ppt Slide
This PowerPoint template has been designed with graphic of server and data transfer network. This slide contains the steps of big data, map, reduce and result. Use this editable diagram for data technology related presentations.

Business Diagram Big Data Concept With Globe And Finger Clicking On Global Data Feeds Ppt Slide
This PowerPoint template has been designed with big data tag on globe. This graphic also displays the hand cursor on the big data text. This diagram can be used to display concept of global data transfer.
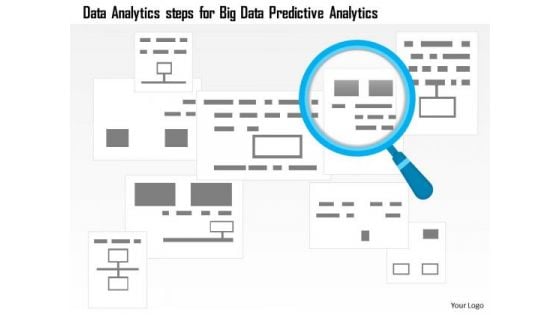
Business Diagram Data Analytics Steps For Big Data Predictive Analytics Ppt Slide
This power point template has been designed with graphic of magnifier over boxes. This slide contains the concept of predictive analytics of big data. This diagram can be used for data analytics related topics in any presentation.
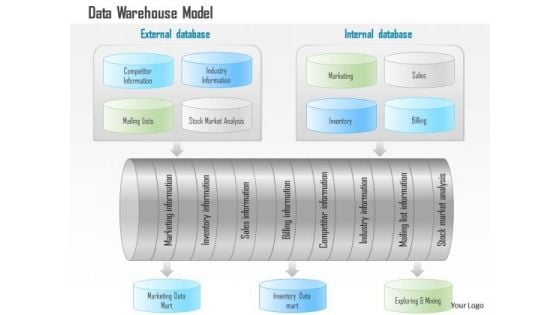
Business Diagram Data Warehouse Model With Analytics And Business Intelligence Ppt Slide
This technology diagram has been designed with graphic of data warehouse model. This model depicts concept of business intelligence and analysis. Download this editable slide build an exclusive presentation.
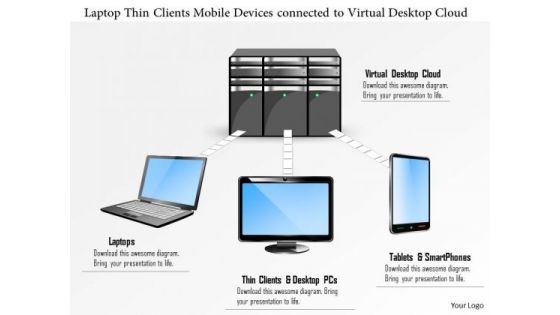
Business Diagram Laptop Thin Clients Mobile Devices Connected To Virtual Desktop Cloud Ppt Slide
This PowerPoint template has been designed with graphic of laptop and mobile devices. It depicts concept of network with interconnected devices. Use this diagram for technology and internet related topics.
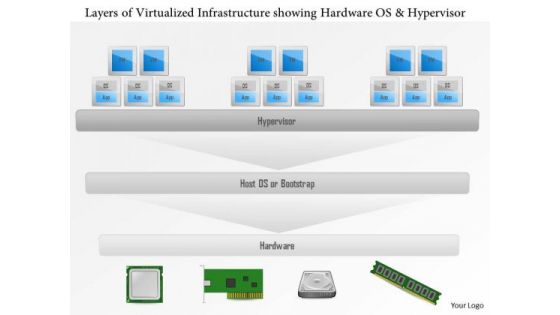
Business Diagram Layers Of A Virtualized Infrastructure Showing Hardware Os And Hypervisor Ppt Slide
This PowerPoint template has been designed with graphic of hardware. These devices are used to display concept of device infrastructure. This diagram slide may be used for cloud technology and business related presentations.

Business Diagram Secure Connections To The Public Cloud With Folders And Lock Ppt Slide
This technical slide has been designed with graphic of folders and cloud with lock. This PPT slide depicts the concept of secure connections. It focuses on the data safety in cloud technology. Use this diagram for data safety related presentations.
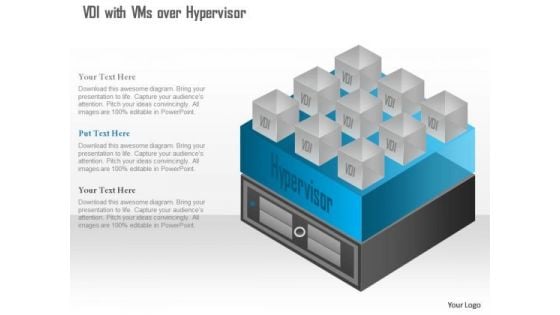
Business Diagram Virtual Desktip Infrastructure Vdi With Vms Over Hypervisor Ppt Slide
This PowerPoint template has been designed with graphic of virtual infrastructure. This diagram contains the VMS running on hardware. This slide may be used for computer technology related presentations.
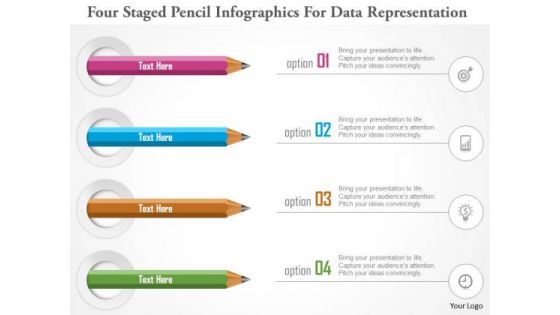
Business Diagram Four Staged Pencil Infographics For Data Representation PowerPoint Template
Four staged pencil info graphics has been used to design this power point template. This diagram template contains the concept of data representations. Use this PPT for your business and marketing presentations.
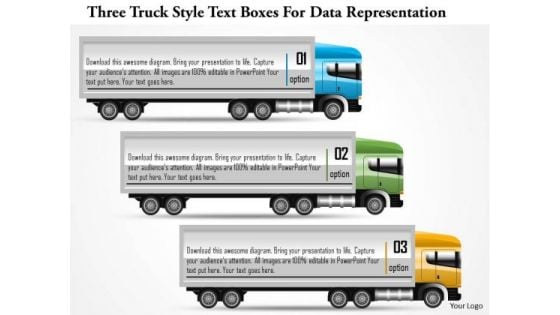
Business Diagram Three Truck Style Text Boxes For Data Representation PowerPoint Template
This power point template diagram has been designed with graphic of three truck style text boxes. These boxes are used to display the text and data. Use this PPT for your business presentation and get good comments from your viewers.

Business Diagram Yellow Smiley Bulb With Series Of White Bulbs Presentation Template
This business diagram has been designed with graphic of yellow smiley bulbs and white bulb. This slide depicts the concept of leadership. Use this slide to build quality presentation for your viewers.
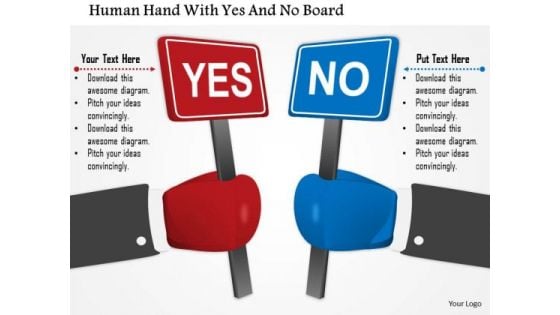
Business Diagram Human Hand With Yes And No Board Presentation Template
Graphic of human hands with yes and no boards has been used to design this power point template. This PPT contains the concept of decision making. Use this PPT diagram for business and marketing related presentations.
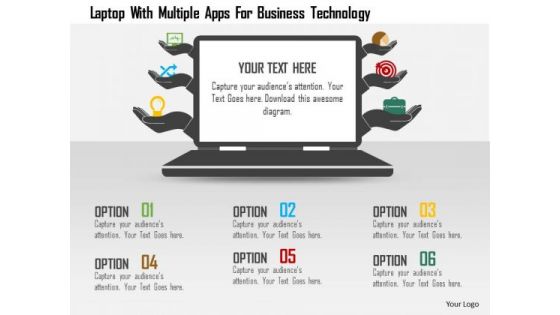
Business Diagram Laptop With Multiple Apps For Business Technology Presentation Template
This power point template diagram has been designed with graphic of laptop and multiple apps. This PPT can be used for technology and communication. Use this PPT for business and technology related presentations.
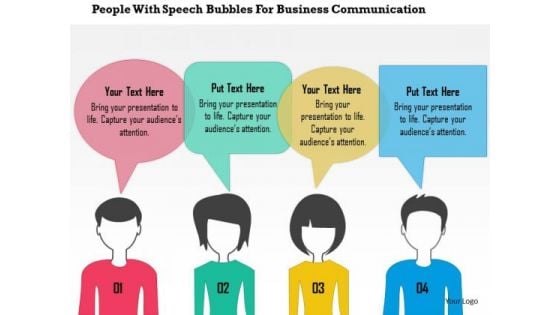
Business Diagram People With Speech Bubbles For Business Communication Presentation Template
This power point template diagram has been designed with graphic of people and speech bubbles. This PPT can be used for business communication. Use this PPT for business and management related presentations.
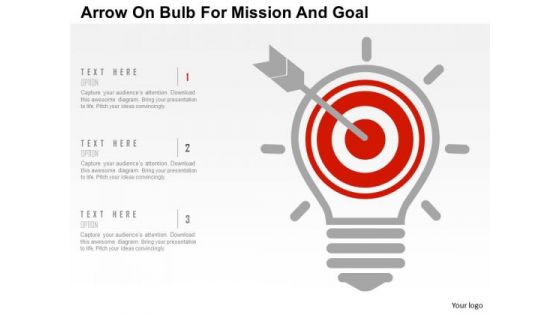
Business Diagram Arrow On Bulb For Mission And Goal Presentation Template
This business slide has been designed with graphics of arrow on target bulb. You may download this slide for mission and goal related topics. Mesmerize your audience with this unique diagram.
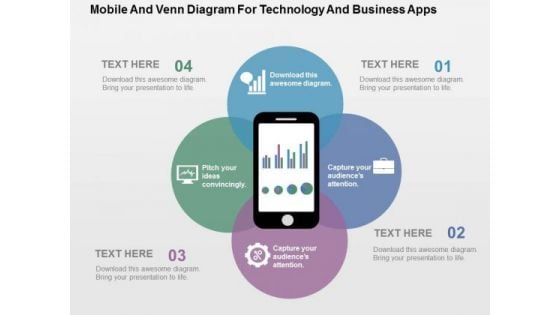
Mobile And Venn Diagram For Technology And Business Apps PowerPoint Template
Our professionally designed business diagram is as an effective tool for communicating business ideas and strategies for corporate planning. It contains graphics of mobile with Venn graphics. Above slide is suitable to display business options with technology.
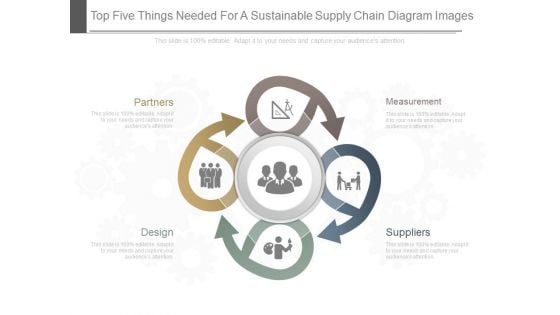
Top Five Things Needed For A Sustainable Supply Chain Diagram Images
This is a top five things needed for a sustainable supply chain diagram images. This is a four stage process. The stages in this process are partners, measurement, design, suppliers.
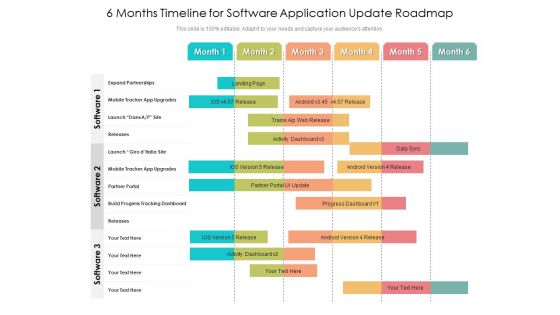
6 Months Timeline For Software Application Update Roadmap Clipart
Introducing our 6 months timeline for software application update roadmap clipart. This PPT presentation is Google Slides compatible, therefore, you can share it easily with the collaborators for measuring the progress. Also, the presentation is available in both standard screen and widescreen aspect ratios. So edit the template design by modifying the font size, font type, color, and shapes as per your requirements. As this PPT design is fully editable it can be presented in PDF, JPG and PNG formats.Presenting the 6 months timeline for software application update roadmap clipart. The template includes a roadmap that can be used to initiate a strategic plan. Not only this, the PowerPoint slideshow is completely editable and you can effortlessly modify the font size, font type, and shapes according to your needs. This PPT slide can be easily reached in standard screen and widescreen aspect ratios. The set is also available in various formats like PDF, PNG, and JPG. So download and use it multiple times as per your knowledge.
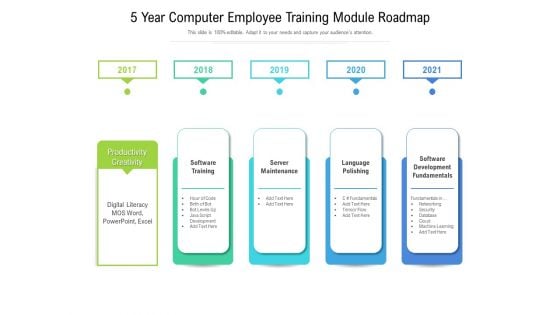
5 Year Computer Employee Training Module Roadmap Pictures
Introducing our 5 year computer employee training module roadmap pictures. This PPT presentation is Google Slides compatible, therefore, you can share it easily with the collaborators for measuring the progress. Also, the presentation is available in both standard screen and widescreen aspect ratios. So edit the template design by modifying the font size, font type, color, and shapes as per your requirements. As this PPT design is fully editable it can be presented in PDF, JPG and PNG formats.Presenting the 5 year computer employee training module roadmap pictures. The template includes a roadmap that can be used to initiate a strategic plan. Not only this, the PowerPoint slideshow is completely editable and you can effortlessly modify the font size, font type, and shapes according to your needs. This PPT slide can be easily reached in standard screen and widescreen aspect ratios. The set is also available in various formats like PDF, PNG, and JPG. So download and use it multiple times as per your knowledge.
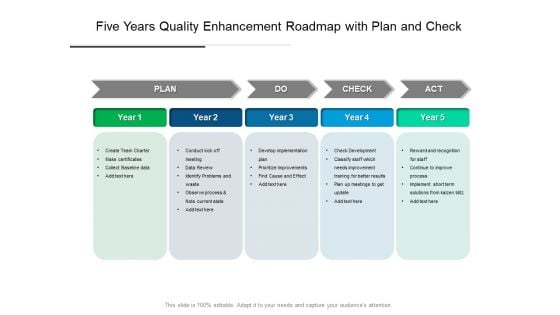
Five Years Quality Enhancement Roadmap With Plan And Check Elements
Introducing our five years quality enhancement roadmap with plan and check elements. This PPT presentation is Google Slides compatible, therefore, you can share it easily with the collaborators for measuring the progress. Also, the presentation is available in both standard screen and widescreen aspect ratios. So edit the template design by modifying the font size, font type, color, and shapes as per your requirements. As this PPT design is fully editable it can be presented in PDF, JPG and PNG formats.Presenting the five years quality enhancement roadmap with plan and check elements. The template includes a roadmap that can be used to initiate a strategic plan. Not only this, the PowerPoint slideshow is completely editable and you can effortlessly modify the font size, font type, and shapes according to your needs. This PPT slide can be easily reached in standard screen and widescreen aspect ratios. The set is also available in various formats like PDF, PNG, and JPG. So download and use it multiple times as per your knowledge.
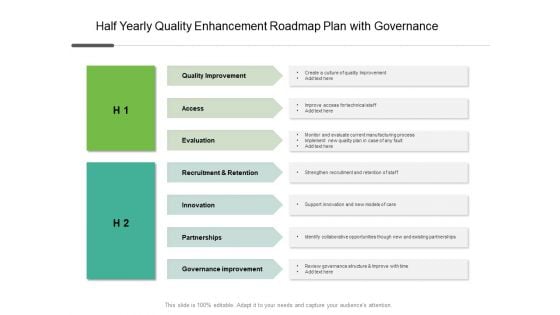
Half Yearly Quality Enhancement Roadmap Plan With Governance Information
Introducing our half yearly quality enhancement roadmap plan with governance information. This PPT presentation is Google Slides compatible, therefore, you can share it easily with the collaborators for measuring the progress. Also, the presentation is available in both standard screen and widescreen aspect ratios. So edit the template design by modifying the font size, font type, color, and shapes as per your requirements. As this PPT design is fully editable it can be presented in PDF, JPG and PNG formats.Presenting the half yearly quality enhancement roadmap plan with governance information. The template includes a roadmap that can be used to initiate a strategic plan. Not only this, the PowerPoint slideshow is completely editable and you can effortlessly modify the font size, font type, and shapes according to your needs. This PPT slide can be easily reached in standard screen and widescreen aspect ratios. The set is also available in various formats like PDF, PNG, and JPG. So download and use it multiple times as per your knowledge.
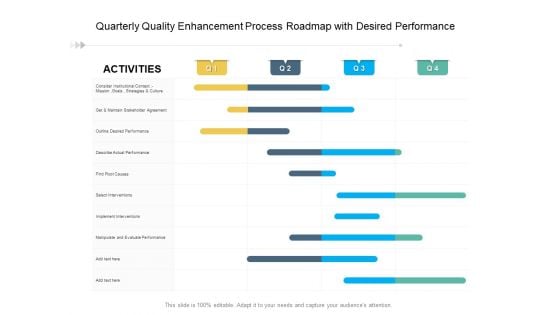
Quarterly Quality Enhancement Process Roadmap With Desired Performance Structure
Introducing our quarterly quality enhancement process roadmap with desired performance structure. This PPT presentation is Google Slides compatible, therefore, you can share it easily with the collaborators for measuring the progress. Also, the presentation is available in both standard screen and widescreen aspect ratios. So edit the template design by modifying the font size, font type, color, and shapes as per your requirements. As this PPT design is fully editable it can be presented in PDF, JPG and PNG formats.Presenting the quarterly quality enhancement process roadmap with desired performance structure. The template includes a roadmap that can be used to initiate a strategic plan. Not only this, the PowerPoint slideshow is completely editable and you can effortlessly modify the font size, font type, and shapes according to your needs. This PPT slide can be easily reached in standard screen and widescreen aspect ratios. The set is also available in various formats like PDF, PNG, and JPG. So download and use it multiple times as per your knowledge.
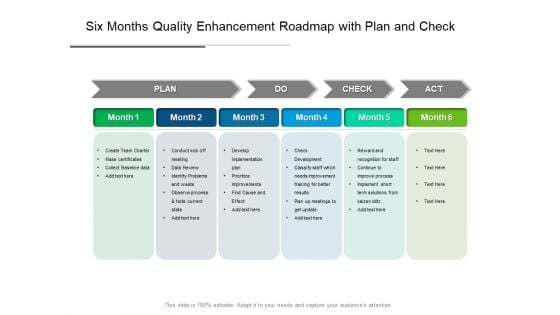
Six Months Quality Enhancement Roadmap With Plan And Check Download
Introducing our six months quality enhancement roadmap with plan and check download. This PPT presentation is Google Slides compatible, therefore, you can share it easily with the collaborators for measuring the progress. Also, the presentation is available in both standard screen and widescreen aspect ratios. So edit the template design by modifying the font size, font type, color, and shapes as per your requirements. As this PPT design is fully editable it can be presented in PDF, JPG and PNG formats.Presenting the six months quality enhancement roadmap with plan and check download. The template includes a roadmap that can be used to initiate a strategic plan. Not only this, the PowerPoint slideshow is completely editable and you can effortlessly modify the font size, font type, and shapes according to your needs. This PPT slide can be easily reached in standard screen and widescreen aspect ratios. The set is also available in various formats like PDF, PNG, and JPG. So download and use it multiple times as per your knowledge.
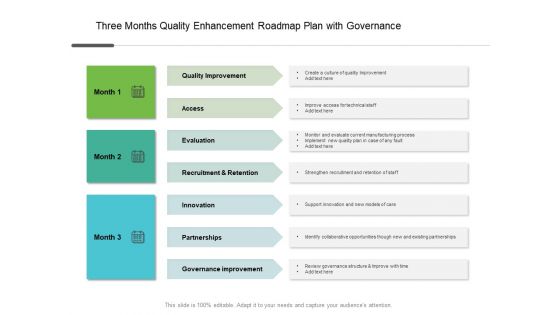
Three Months Quality Enhancement Roadmap Plan With Governance Microsoft
Introducing our three months quality enhancement roadmap plan with governance microsoft. This PPT presentation is Google Slides compatible, therefore, you can share it easily with the collaborators for measuring the progress. Also, the presentation is available in both standard screen and widescreen aspect ratios. So edit the template design by modifying the font size, font type, color, and shapes as per your requirements. As this PPT design is fully editable it can be presented in PDF, JPG and PNG formats.Presenting the three months quality enhancement roadmap plan with governance microsoft. The template includes a roadmap that can be used to initiate a strategic plan. Not only this, the PowerPoint slideshow is completely editable and you can effortlessly modify the font size, font type, and shapes according to your needs. This PPT slide can be easily reached in standard screen and widescreen aspect ratios. The set is also available in various formats like PDF, PNG, and JPG. So download and use it multiple times as per your knowledge.
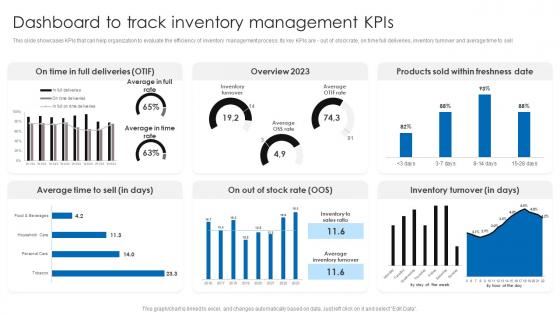
Dashboard To Track Inventory Management Kpis Retail Stock Administration Strategies Rules Pdf
This slide showcases KPIs that can help organization to evaluate the efficiency of inventory management process. Its key KPIs are - out of stock rate, on time full deliveries, inventory turnover and average time to sell.Coming up with a presentation necessitates that the majority of the effort goes into the content and the message you intend to convey. The visuals of a PowerPoint presentation can only be effective if it supplements and supports the story that is being told. Keeping this in mind our experts created Dashboard To Track Inventory Management Kpis Retail Stock Administration Strategies Rules Pdf to reduce the time that goes into designing the presentation. This way, you can concentrate on the message while our designers take care of providing you with the right template for the situation. This slide showcases KPIs that can help organization to evaluate the efficiency of inventory management process. Its key KPIs are out of stock rate, on time full deliveries, inventory turnover and average time to sell
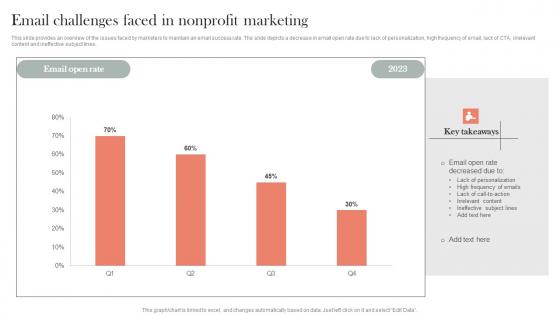
Email Challenges Faced In Nonprofit Marketing Efficient Nonprofit Marketing Topics Pdf
This slide provides an overview of the issues faced by marketers to maintain an email success rate. The slide depicts a decrease in email open rate due to lack of personalization, high frequency of email, lack of CTA, irrelevant content and ineffective subject lines.Coming up with a presentation necessitates that the majority of the effort goes into the content and the message you intend to convey. The visuals of a PowerPoint presentation can only be effective if it supplements and supports the story that is being told. Keeping this in mind our experts created Email Challenges Faced In Nonprofit Marketing Efficient Nonprofit Marketing Topics Pdf to reduce the time that goes into designing the presentation. This way, you can concentrate on the message while our designers take care of providing you with the right template for the situation. This slide provides an overview of the issues faced by marketers to maintain an email success rate. The slide depicts a decrease in email open rate due to lack of personalization, high frequency of email, lack of CTA, irrelevant content and ineffective subject lines.
Confidential Computing Performance Tracking Dashboard Secure Multi Party Portrait Pdf
This slide represents the performance tracking dashboard for confidential computing. The purpose of this slide is to represent the overall performance of the confidential computing cloud environment visually. The main components include overall health, operations, progress, time, cost and workloads. Coming up with a presentation necessitates that the majority of the effort goes into the content and the message you intend to convey. The visuals of a PowerPoint presentation can only be effective if it supplements and supports the story that is being told. Keeping this in mind our experts created Confidential Computing Performance Tracking Dashboard Secure Multi Party Portrait Pdf to reduce the time that goes into designing the presentation. This way, you can concentrate on the message while our designers take care of providing you with the right template for the situation. This slide represents the performance tracking dashboard for confidential computing. The purpose of this slide is to represent the overall performance of the confidential computing cloud environment visually. The main components include overall health, operations, progress, time, cost and workloads.
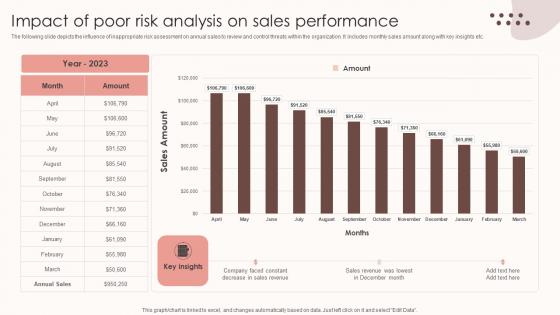
Assessing Sales Risks Impact Of Poor Risk Analysis On Sales Performance Elements PDF
The following slide depicts the influence of inappropriate risk assessment on annual sales to review and control threats within the organization. It includes monthly sales amount along with key insights etc. Coming up with a presentation necessitates that the majority of the effort goes into the content and the message you intend to convey. The visuals of a PowerPoint presentation can only be effective if it supplements and supports the story that is being told. Keeping this in mind our experts created The following slide depicts the influence of inappropriate risk assessment on annual sales to review and control threats within the organization. It includes monthly sales amount along with key insights etc. to reduce the time that goes into designing the presentation. This way, you can concentrate on the message while our designers take care of providing you with the right template for the situation. The following slide depicts the influence of inappropriate risk assessment on annual sales to review and control threats within the organization. It includes monthly sales amount along with key insights etc.
Factors To Consider Before Innovative Business Promotion Ideas Demonstration Pdf
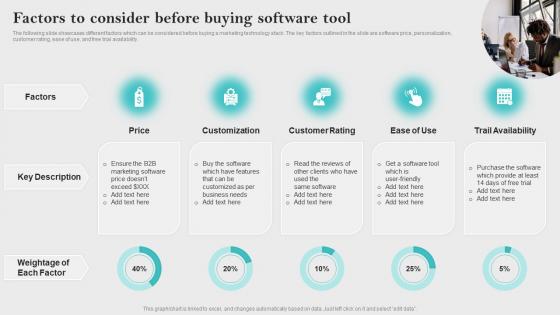
The following slide showcases different factors which can be considered before buying a marketing technology stack. The key factors outlined in the slide are software price, personalization, customer rating, ease of use, and free trial availability. Coming up with a presentation necessitates that the majority of the effort goes into the content and the message you intend to convey. The visuals of a PowerPoint presentation can only be effective if it supplements and supports the story that is being told. Keeping this in mind our experts created Factors To Consider Before Innovative Business Promotion Ideas Demonstration Pdf to reduce the time that goes into designing the presentation. This way, you can concentrate on the message while our designers take care of providing you with the right template for the situation. The following slide showcases different factors which can be considered before buying a marketing technology stack. The key factors outlined in the slide are software price, personalization, customer rating, ease of use, and free trial availability.
Monthly Sales Performance Tracking Sales Performance Enhancement Background Pdf
This slide showcases a dashboard presenting various metrics to measure and analyze sales performance for revenue growth. It includes key components such as number of sales, revenue, profit, cost, sales revenue, sales increment, cost analysis and cross sell. Coming up with a presentation necessitates that the majority of the effort goes into the content and the message you intend to convey. The visuals of a PowerPoint presentation can only be effective if it supplements and supports the story that is being told. Keeping this in mind our experts created Monthly Sales Performance Tracking Sales Performance Enhancement Background Pdf to reduce the time that goes into designing the presentation. This way, you can concentrate on the message while our designers take care of providing you with the right template for the situation. This slide showcases a dashboard presenting various metrics to measure and analyze sales performance for revenue growth. It includes key components such as number of sales, revenue, profit, cost, sales revenue, sales increment, cost analysis and cross sell.
Performance Enhancement Plan Monthly Sales Performance Tracking And Monitoring Portrait Pdf
This slide showcases a dashboard presenting various metrics to measure and analyze sales performance for revenue growth. It includes key components such as number of sales, revenue, profit, cost, sales revenue, sales increment, cost analysis and cross sell. Coming up with a presentation necessitates that the majority of the effort goes into the content and the message you intend to convey. The visuals of a PowerPoint presentation can only be effective if it supplements and supports the story that is being told. Keeping this in mind our experts created Performance Enhancement Plan Monthly Sales Performance Tracking And Monitoring Portrait Pdf to reduce the time that goes into designing the presentation. This way, you can concentrate on the message while our designers take care of providing you with the right template for the situation. This slide showcases a dashboard presenting various metrics to measure and analyze sales performance for revenue growth. It includes key components such as number of sales, revenue, profit, cost, sales revenue, sales increment, cost analysis and cross sell.
Highlighting Statistics Associated Esponsible Tech Guide To Manage Infographics Pdf
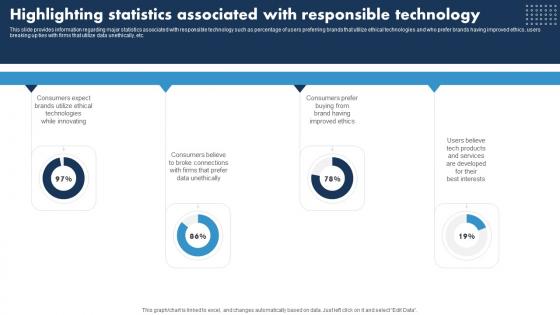
This slide provides information regarding major statistics associated with responsible technology such as percentage of users preferring brands that utilize ethical technologies and who prefer brands having improved ethics, users breaking up ties with firms that utilize data unethically, etc. Coming up with a presentation necessitates that the majority of the effort goes into the content and the message you intend to convey. The visuals of a PowerPoint presentation can only be effective if it supplements and supports the story that is being told. Keeping this in mind our experts created Highlighting Statistics Associated Esponsible Tech Guide To Manage Infographics Pdf to reduce the time that goes into designing the presentation. This way, you can concentrate on the message while our designers take care of providing you with the right template for the situation. This slide provides information regarding major statistics associated with responsible technology such as percentage of users preferring brands that utilize ethical technologies and who prefer brands having improved ethics, users breaking up ties with firms that utilize data unethically, etc.
Track And Evaluate Sales Describing Business Performance Administration Goals Information Pdf
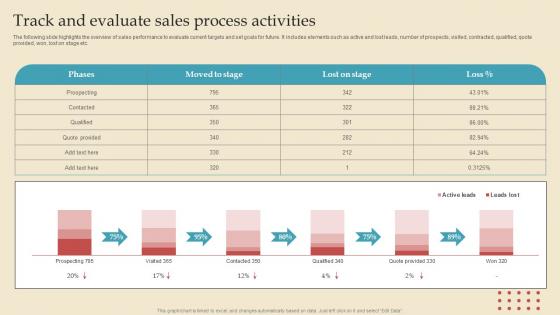
The following slide highlights the overview of sales performance to evaluate current targets and set goals for future. It includes elements such as active and lost leads, number of prospects, visited, contracted, qualified, quote provided, won, lost on stage etc. Coming up with a presentation necessitates that the majority of the effort goes into the content and the message you intend to convey. The visuals of a PowerPoint presentation can only be effective if it supplements and supports the story that is being told. Keeping this in mind our experts created Track And Evaluate Sales Describing Business Performance Administration Goals Information Pdf to reduce the time that goes into designing the presentation. This way, you can concentrate on the message while our designers take care of providing you with the right template for the situation. The following slide highlights the overview of sales performance to evaluate current targets and set goals for future. It includes elements such as active and lost leads, number of prospects, visited, contracted, qualified, quote provided, won, lost on stage etc.
Impact Of SMS Marketing Business Text Message Advertising Solutions Enhancing Introduction Pdf
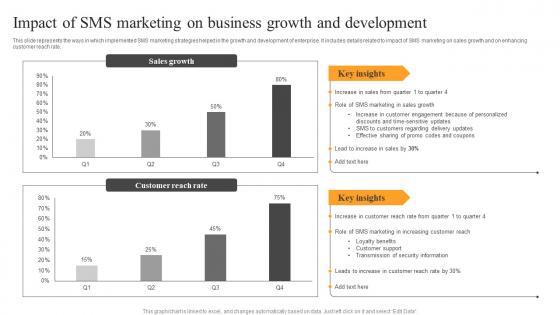
This slide represents the ways in which implemented SMS marketing strategies helped in the growth and development of enterprise. It includes details related to impact of SMS marketing on sales growth and on enhancing customer reach rate. Coming up with a presentation necessitates that the majority of the effort goes into the content and the message you intend to convey. The visuals of a PowerPoint presentation can only be effective if it supplements and supports the story that is being told. Keeping this in mind our experts created Impact Of SMS Marketing Business Text Message Advertising Solutions Enhancing Introduction Pdf to reduce the time that goes into designing the presentation. This way, you can concentrate on the message while our designers take care of providing you with the right template for the situation. This slide represents the ways in which implemented SMS marketing strategies helped in the growth and development of enterprise. It includes details related to impact of SMS marketing on sales growth and on enhancing customer reach rate.
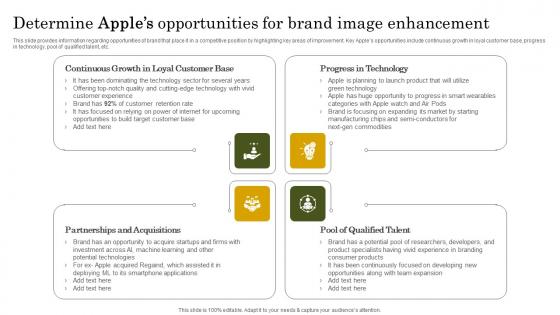
Determine Apples Opportunities Apple Branding Strategy To Become Market Leader Mockup Pdf
This slide provides information regarding opportunities of brand that place it in a competitive position by highlighting key areas of improvement. Key Apples opportunities include continuous growth in loyal customer base, progress in technology, pool of qualified talent, etc. Coming up with a presentation necessitates that the majority of the effort goes into the content and the message you intend to convey. The visuals of a PowerPoint presentation can only be effective if it supplements and supports the story that is being told. Keeping this in mind our experts created Determine Apples Opportunities Apple Branding Strategy To Become Market Leader Mockup Pdf to reduce the time that goes into designing the presentation. This way, you can concentrate on the message while our designers take care of providing you with the right template for the situation. This slide provides information regarding opportunities of brand that place it in a competitive position by highlighting key areas of improvement. Key Apples opportunities include continuous growth in loyal customer base, progress in technology, pool of qualified talent, etc.
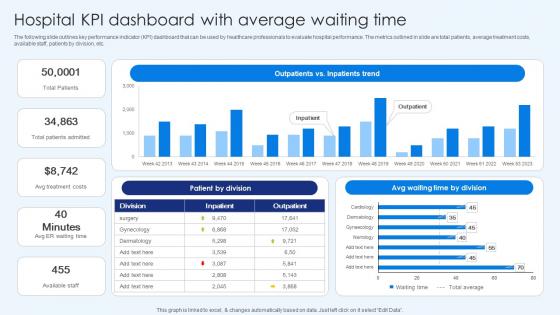
Hospital Kpi Dashboard With Average Waiting Time Healthcare Promotion Ideas Pdf
The following slide outlines key performance indicator KPI dashboard that can be used by healthcare professionals to evaluate hospital performance. The metrics outlined in slide are total patients, average treatment costs, available staff, patients by division, etc. Coming up with a presentation necessitates that the majority of the effort goes into the content and the message you intend to convey. The visuals of a PowerPoint presentation can only be effective if it supplements and supports the story that is being told. Keeping this in mind our experts created Hospital KPI Dashboard With Average Waiting Time Healthcare Promotion Ideas Pdf to reduce the time that goes into designing the presentation. This way, you can concentrate on the message while our designers take care of providing you with the right template for the situation. The following slide outlines key performance indicator KPI dashboard that can be used by healthcare professionals to evaluate hospital performance. The metrics outlined in slide are total patients, average treatment costs, available staff, patients by division, etc.
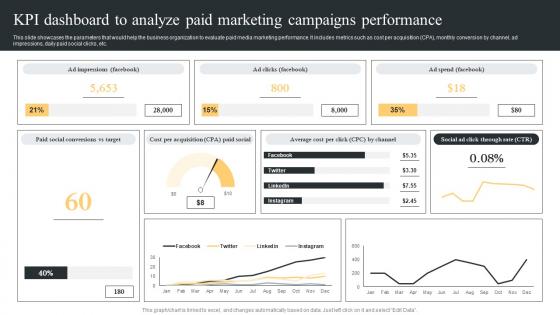
KPI Dashboard To Analyze Paid Comprehensive Guide For Paid Media Marketing Strategies Sample Pdf
This slide showcases the parameters that would help the business organization to evaluate paid media marketing performance. It includes metrics such as cost per acquisition CPA, monthly conversion by channel, ad impressions, daily paid social clicks, etc. Coming up with a presentation necessitates that the majority of the effort goes into the content and the message you intend to convey. The visuals of a PowerPoint presentation can only be effective if it supplements and supports the story that is being told. Keeping this in mind our experts created KPI Dashboard To Analyze Paid Comprehensive Guide For Paid Media Marketing Strategies Sample Pdf to reduce the time that goes into designing the presentation. This way, you can concentrate on the message while our designers take care of providing you with the right template for the situation. This slide showcases the parameters that would help the business organization to evaluate paid media marketing performance. It includes metrics such as cost per acquisition CPA, monthly conversion by channel, ad impressions, daily paid social clicks, etc.
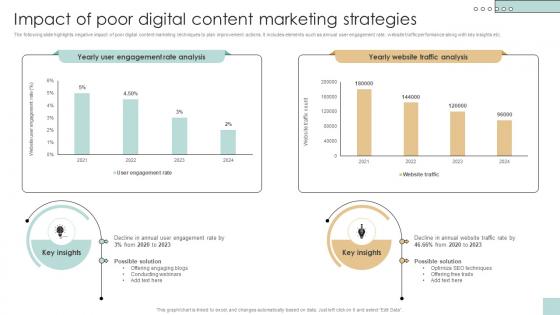
Impact Of Poor Digital Content Marketing Strategies Developing And Creating Digital Content Strategy SS V
The following slide highlights negative impact of poor digital content marketing techniques to plan improvement actions. It includes elements such as annual user engagement rate, website traffic performance along with key insights etc. Coming up with a presentation necessitates that the majority of the effort goes into the content and the message you intend to convey. The visuals of a PowerPoint presentation can only be effective if it supplements and supports the story that is being told. Keeping this in mind our experts created Impact Of Poor Digital Content Marketing Strategies Developing And Creating Digital Content Strategy SS V to reduce the time that goes into designing the presentation. This way, you can concentrate on the message while our designers take care of providing you with the right template for the situation. The following slide highlights negative impact of poor digital content marketing techniques to plan improvement actions. It includes elements such as annual user engagement rate, website traffic performance along with key insights etc.
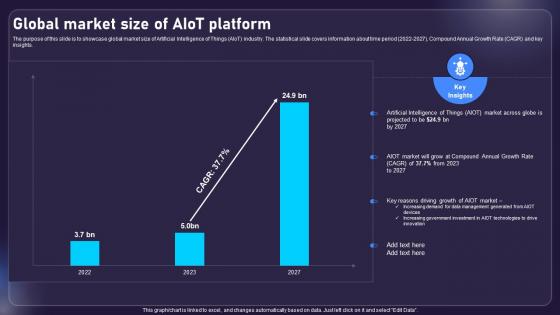
Global Market Size Of AIOT Platform AIOT Applications For Various Industries IoT SS V
The purpose of this slide is to showcase global market size of Artificial Intelligence of Things AIoT industry. The statistical slide covers information about time period 2022-2027, Compound Annual Growth Rate CAGR and key insights. Coming up with a presentation necessitates that the majority of the effort goes into the content and the message you intend to convey. The visuals of a PowerPoint presentation can only be effective if it supplements and supports the story that is being told. Keeping this in mind our experts created Global Market Size Of AIOT Platform AIOT Applications For Various Industries IoT SS V to reduce the time that goes into designing the presentation. This way, you can concentrate on the message while our designers take care of providing you with the right template for the situation. The purpose of this slide is to showcase global market size of Artificial Intelligence of Things AIoT industry. The statistical slide covers information about time period 2022-2027, Compound Annual Growth Rate CAGR and key insights.


 Continue with Email

 Home
Home


