Engineer Icon
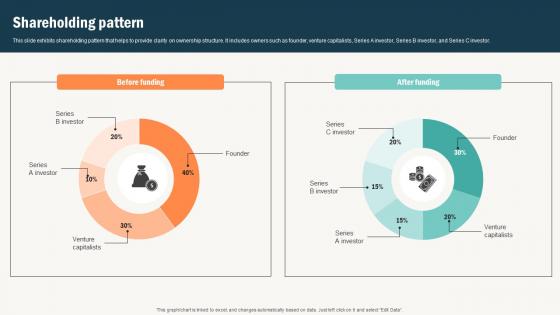
Shareholding Pattern Conversational Commerce Platform Investor
This slide exhibits shareholding pattern that helps to provide clarity on ownership structure. It includes owners such as founder, venture capitalists, Series A investor, Series B investor, and Series C investor. This Shareholding Pattern Conversational Commerce Platform Investor is perfect for any presentation, be it in front of clients or colleagues. It is a versatile and stylish solution for organizing your meetings. The Shareholding Pattern Conversational Commerce Platform Investor features a modern design for your presentation meetings. The adjustable and customizable slides provide unlimited possibilities for acing up your presentation. Slidegeeks has done all the homework before launching the product for you. So, do not wait, grab the presentation templates today This slide exhibits shareholding pattern that helps to provide clarity on ownership structure. It includes owners such as founder, venture capitalists, Series A investor, Series B investor, and Series C investor.

The Digital Project Managers Project Change Management Kpi Dashboard
This slide represents KPI dashboard to effectively track and monitor effectiveness of changes implemented in organizational projects. It includes details related to KPIs such as changes investigated, submitted, approved, declined, etc. This The Digital Project Managers Project Change Management Kpi Dashboard from Slidegeeks makes it easy to present information on your topic with precision. It provides customization options, so you can make changes to the colors, design, graphics, or any other component to create a unique layout. It is also available for immediate download, so you can begin using it right away. Slidegeeks has done good research to ensure that you have everything you need to make your presentation stand out. Make a name out there for a brilliant performance. This slide represents KPI dashboard to effectively track and monitor effectiveness of changes implemented in organizational projects. It includes details related to KPIs such as changes investigated, submitted, approved, declined, etc.
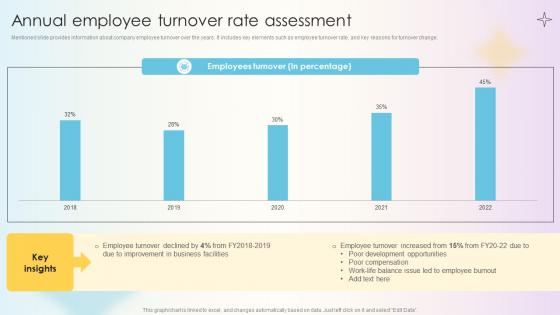
Managing Technical And Non Annual Employee Turnover Rate Assessment
Mentioned slide provides information about company employee turnover over the years. It includes key elements such as employee turnover rate, and key reasons for turnover change. Get a simple yet stunning designed Managing Technical And Non Annual Employee Turnover Rate Assessment. It is the best one to establish the tone in your meetings. It is an excellent way to make your presentations highly effective. So, download this PPT today from Slidegeeks and see the positive impacts. Our easy-to-edit Managing Technical And Non Annual Employee Turnover Rate Assessment can be your go-to option for all upcoming conferences and meetings. So, what are you waiting for Grab this template today. Mentioned slide provides information about company employee turnover over the years. It includes key elements such as employee turnover rate, and key reasons for turnover change.
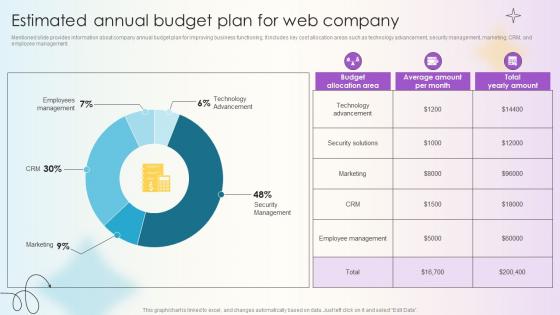
Managing Technical And Non Estimated Annual Budget Plan For Web Company
Mentioned slide provides information about company annual budget plan for improving business functioning. It includes key cost allocation areas such as technology advancement, security management, marketing, CRM, and employee management. Explore a selection of the finest Managing Technical And Non Estimated Annual Budget Plan For Web Company here. With a plethora of professionally designed and pre-made slide templates, you can quickly and easily find the right one for your upcoming presentation. You can use our Managing Technical And Non Estimated Annual Budget Plan For Web Company to effectively convey your message to a wider audience. Slidegeeks has done a lot of research before preparing these presentation templates. The content can be personalized and the slides are highly editable. Grab templates today from Slidegeeks. Mentioned slide provides information about company annual budget plan for improving business functioning. It includes key cost allocation areas such as technology advancement, security management, marketing, CRM, and employee management.
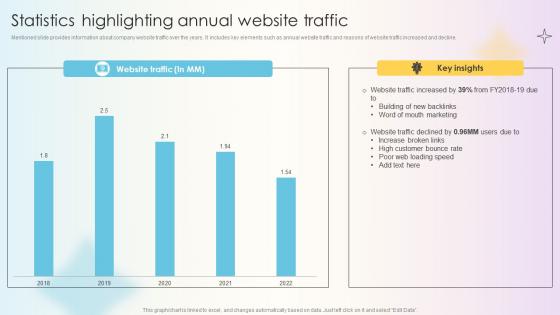
Managing Technical And Non Statistics Highlighting Annual Website Traffic
Mentioned slide provides information about company website traffic over the years. It includes key elements such as annual website traffic and reasons of website traffic increased and decline. Get a simple yet stunning designed Managing Technical And Non Statistics Highlighting Annual Website Traffic. It is the best one to establish the tone in your meetings. It is an excellent way to make your presentations highly effective. So, download this PPT today from Slidegeeks and see the positive impacts. Our easy-to-edit Managing Technical And Non Statistics Highlighting Annual Website Traffic can be your go-to option for all upcoming conferences and meetings. So, what are you waiting for Grab this template today. Mentioned slide provides information about company website traffic over the years. It includes key elements such as annual website traffic and reasons of website traffic increased and decline.
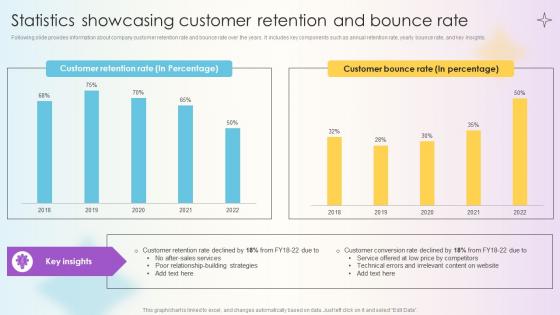
Managing Technical And Non Technical Statistics Showcasing Customer Retention
Following slide provides information about company customer retention rate and bounce rate over the years. It includes key components such as annual retention rate, yearly bounce rate, and key insights. If your project calls for a presentation, then Slidegeeks is your go-to partner because we have professionally designed, easy-to-edit templates that are perfect for any presentation. After downloading, you can easily edit Managing Technical And Non Technical Statistics Showcasing Customer Retention and make the changes accordingly. You can rearrange slides or fill them with different images. Check out all the handy templates Following slide provides information about company customer retention rate and bounce rate over the years. It includes key components such as annual retention rate, yearly bounce rate, and key insights.
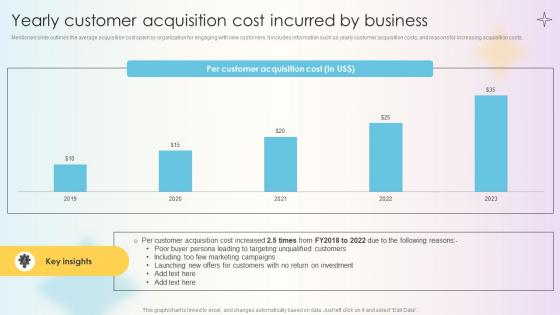
Managing Technical And Non Yearly Customer Acquisition Cost Incurred By Business
Mentioned slide outlines the average acquisition cost spent by organization for engaging with new customers. It includes information such as yearly customer acquisition costs, and reasons for increasing acquisition costs. Explore a selection of the finest Managing Technical And Non Yearly Customer Acquisition Cost Incurred By Business here. With a plethora of professionally designed and pre-made slide templates, you can quickly and easily find the right one for your upcoming presentation. You can use our Managing Technical And Non Yearly Customer Acquisition Cost Incurred By Business to effectively convey your message to a wider audience. Slidegeeks has done a lot of research before preparing these presentation templates. The content can be personalized and the slides are highly editable. Grab templates today from Slidegeeks. Mentioned slide outlines the average acquisition cost spent by organization for engaging with new customers. It includes information such as yearly customer acquisition costs, and reasons for increasing acquisition costs.
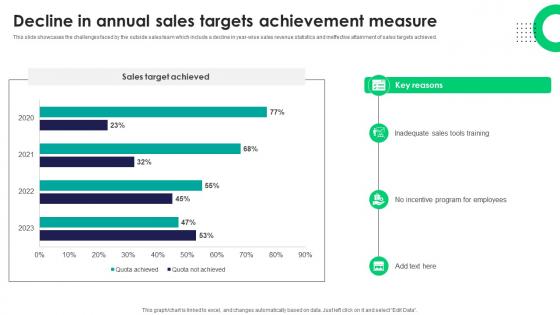
Decline In Annual Sales Targets Achievement Measure Tactics For Improving Field Sales Team SA SS V
This slide showcases the challenges faced by the outside sales team which include a decline in year-wise sales revenue statistics and ineffective attainment of sales targets achieved.Slidegeeks is here to make your presentations a breeze with Decline In Annual Sales Targets Achievement Measure Tactics For Improving Field Sales Team SA SS V With our easy-to-use and customizable templates, you can focus on delivering your ideas rather than worrying about formatting. With a variety of designs to choose from, you are sure to find one that suits your needs. And with animations and unique photos, illustrations, and fonts, you can make your presentation pop. So whether you are giving a sales pitch or presenting to the board, make sure to check out Slidegeeks first This slide showcases the challenges faced by the outside sales team which include a decline in year-wise sales revenue statistics and ineffective attainment of sales targets achieved.
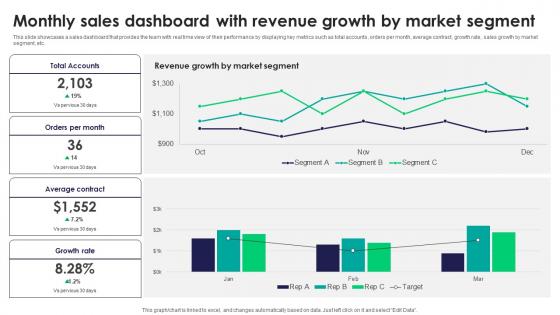
Monthly Sales Dashboard With Revenue Growth By Tactics For Improving Field Sales Team SA SS V
This slide showcases a sales dashboard that provides the team with real time view of their performance by displaying key metrics such as total accounts, orders per month, average contract, growth rate, sales growth by market segment, etc. The Monthly Sales Dashboard With Revenue Growth By Tactics For Improving Field Sales Team SA SS V is a compilation of the most recent design trends as a series of slides. It is suitable for any subject or industry presentation, containing attractive visuals and photo spots for businesses to clearly express their messages. This template contains a variety of slides for the user to input data, such as structures to contrast two elements, bullet points, and slides for written information. Slidegeeks is prepared to create an impression. This slide showcases a sales dashboard that provides the team with real time view of their performance by displaying key metrics such as total accounts, orders per month, average contract, growth rate, sales growth by market segment, etc.
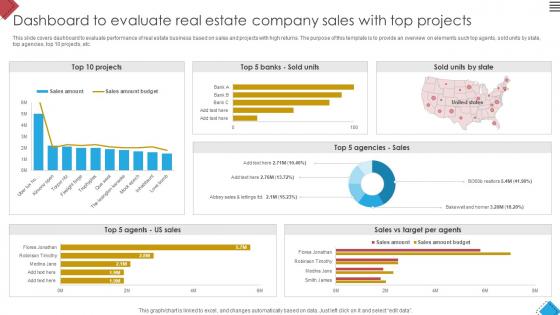
Blueprint For Effective Real Dashboard To Evaluate Real Estate Company Sales Strategy SS V
This slide covers dashboard to evaluate performance of real estate business based on sales and projects with high returns. The purpose of this template is to provide an overview on elements such top agents, sold units by state, top agencies, top 10 projects, etc. If your project calls for a presentation, then Slidegeeks is your go-to partner because we have professionally designed, easy-to-edit templates that are perfect for any presentation. After downloading, you can easily edit Blueprint For Effective Real Dashboard To Evaluate Real Estate Company Sales Strategy SS V and make the changes accordingly. You can rearrange slides or fill them with different images. Check out all the handy templates This slide covers dashboard to evaluate performance of real estate business based on sales and projects with high returns. The purpose of this template is to provide an overview on elements such top agents, sold units by state, top agencies, top 10 projects, etc.
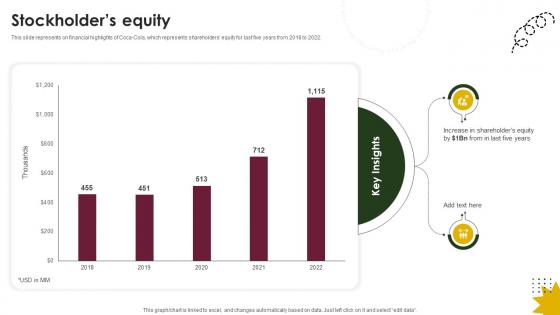
Stockholders Equity Beverage Company Profile CP SS V
This slide represents on financial highlights of Coca-Cola, which represents shareholders equity for last five years from 2018 to 2022.This Stockholders Equity Beverage Company Profile CP SS V is perfect for any presentation, be it in front of clients or colleagues. It is a versatile and stylish solution for organizing your meetings. The Stockholders Equity Beverage Company Profile CP SS V features a modern design for your presentation meetings. The adjustable and customizable slides provide unlimited possibilities for acing up your presentation. Slidegeeks has done all the homework before launching the product for you. So, do not wait, grab the presentation templates today This slide represents on financial highlights of Coca-Cola, which represents shareholders equity for last five years from 2018 to 2022.
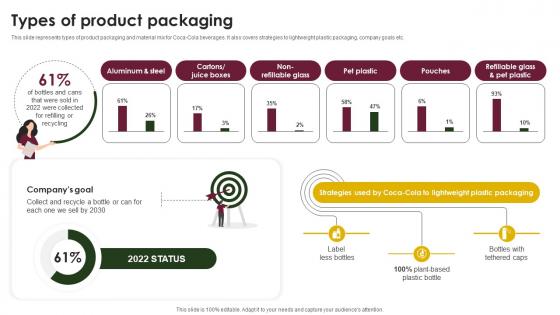
Types Of Product Packaging Beverage Company Profile CP SS V
This slide represents types of product packaging and material mix for Coca-Cola beverages. It also covers strategies to lightweight plastic packaging, company goals etc.The Types Of Product Packaging Beverage Company Profile CP SS V is a compilation of the most recent design trends as a series of slides. It is suitable for any subject or industry presentation, containing attractive visuals and photo spots for businesses to clearly express their messages. This template contains a variety of slides for the user to input data, such as structures to contrast two elements, bullet points, and slides for written information. Slidegeeks is prepared to create an impression. This slide represents types of product packaging and material mix for Coca-Cola beverages. It also covers strategies to lightweight plastic packaging, company goals etc.
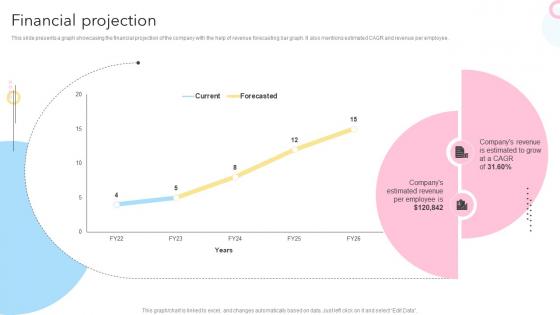
Financial Projection Maternity Support Platform Pitch Deck
This slide presents a graph showcasing the financial projection of the company with the help of revenue forecasting bar graph. It also mentions estimated CAGR and revenue per employee.Slidegeeks is here to make your presentations a breeze with Financial Projection Maternity Support Platform Pitch Deck With our easy-to-use and customizable templates, you can focus on delivering your ideas rather than worrying about formatting. With a variety of designs to choose from, you are sure to find one that suits your needs. And with animations and unique photos, illustrations, and fonts, you can make your presentation pop. So whether you are giving a sales pitch or presenting to the board, make sure to check out Slidegeeks first This slide presents a graph showcasing the financial projection of the company with the help of revenue forecasting bar graph. It also mentions estimated CAGR and revenue per employee.
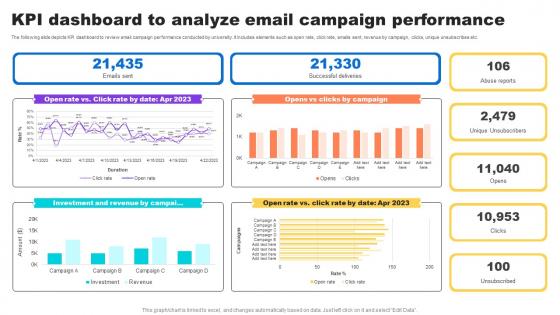
Kpi Dashboard To Analyze Email Campaign Key Step To Implementation University Strategy SS V
The following slide depicts KPI dashboard to review email campaign performance conducted by university. It includes elements such as open rate, click rate, emails sent, revenue by campaign, clicks, unique unsubscribes etc.The Kpi Dashboard To Analyze Email Campaign Key Step To Implementation University Strategy SS V is a compilation of the most recent design trends as a series of slides. It is suitable for any subject or industry presentation, containing attractive visuals and photo spots for businesses to clearly express their messages. This template contains a variety of slides for the user to input data, such as structures to contrast two elements, bullet points, and slides for written information. Slidegeeks is prepared to create an impression. The following slide depicts KPI dashboard to review email campaign performance conducted by university. It includes elements such as open rate, click rate, emails sent, revenue by campaign, clicks, unique unsubscribes etc.
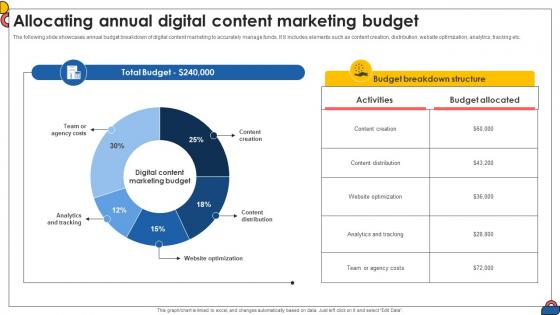
Allocating Annual Digital Content Marketing Budget Comprehensive Guide To Implement Strategy SS V
The following slide showcases annual budget breakdown of digital content marketing to accurately manage funds. It It includes elements such as content creation, distribution, website optimization, analytics, tracking etc. Create an editable Allocating Annual Digital Content Marketing Budget Comprehensive Guide To Implement Strategy SS V that communicates your idea and engages your audience. Whether you are presenting a business or an educational presentation, pre-designed presentation templates help save time. Allocating Annual Digital Content Marketing Budget Comprehensive Guide To Implement Strategy SS V is highly customizable and very easy to edit, covering many different styles from creative to business presentations. Slidegeeks has creative team members who have crafted amazing templates. So, go and get them without any delay. The following slide showcases annual budget breakdown of digital content marketing to accurately manage funds. It It includes elements such as content creation, distribution, website optimization, analytics, tracking etc.
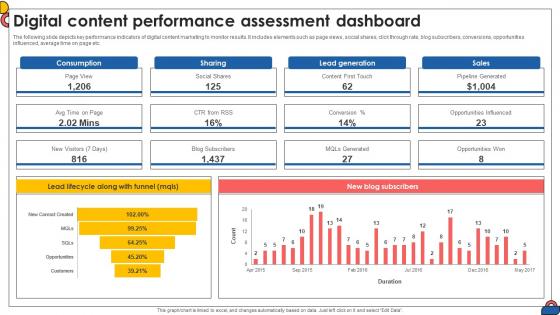
Digital Content Performance Assessment Dashboard Comprehensive Guide To Implement Strategy SS V
The following slide depicts key performance indicators of digital content marketing to monitor results. It includes elements such as page views, social shares, click through rate, blog subscribers, conversions, opportunities influenced, average time on page etc.If your project calls for a presentation, then Slidegeeks is your go-to partner because we have professionally designed, easy-to-edit templates that are perfect for any presentation. After downloading, you can easily edit Digital Content Performance Assessment Dashboard Comprehensive Guide To Implement Strategy SS V and make the changes accordingly. You can rearrange slides or fill them with different images. Check out all the handy templates The following slide depicts key performance indicators of digital content marketing to monitor results. It includes elements such as page views, social shares, click through rate, blog subscribers, conversions, opportunities influenced, average time on page etc.
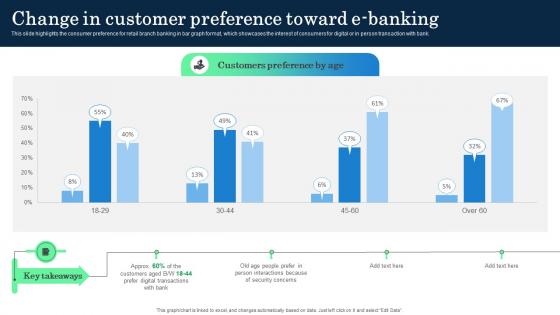
Change In Customer Preference Toward E Banking Incorporating Banking Operational Growth
This slide highlights the consumer preference for retail branch banking in bar graph format, which showcases the interest of consumers for digital or in person transaction with bank. Slidegeeks is here to make your presentations a breeze with Change In Customer Preference Toward E Banking Incorporating Banking Operational Growth With our easy-to-use and customizable templates, you can focus on delivering your ideas rather than worrying about formatting. With a variety of designs to choose from, you are sure to find one that suits your needs. And with animations and unique photos, illustrations, and fonts, you can make your presentation pop. So whether you are giving a sales pitch or presenting to the board, make sure to check out Slidegeeks first This slide highlights the consumer preference for retail branch banking in bar graph format, which showcases the interest of consumers for digital or in person transaction with bank.
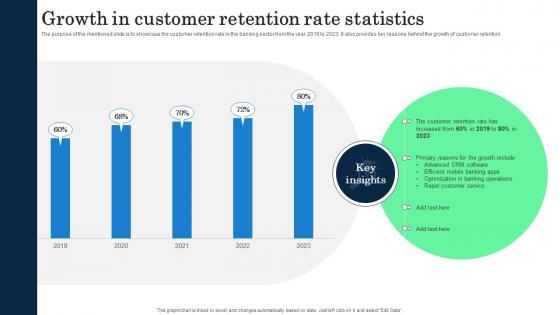
Growth In Customer Retention Rate Statistics Incorporating Banking Operational Growth
The purpose of the mentioned slide is to showcase the customer retention rate in the banking sector from the year 2019 to 2023. it also provides key reasons behind the growth of customer retention. The Growth In Customer Retention Rate Statistics Incorporating Banking Operational Growth is a compilation of the most recent design trends as a series of slides. It is suitable for any subject or industry presentation, containing attractive visuals and photo spots for businesses to clearly express their messages. This template contains a variety of slides for the user to input data, such as structures to contrast two elements, bullet points, and slides for written information. Slidegeeks is prepared to create an impression. The purpose of the mentioned slide is to showcase the customer retention rate in the banking sector from the year 2019 to 2023. it also provides key reasons behind the growth of customer retention
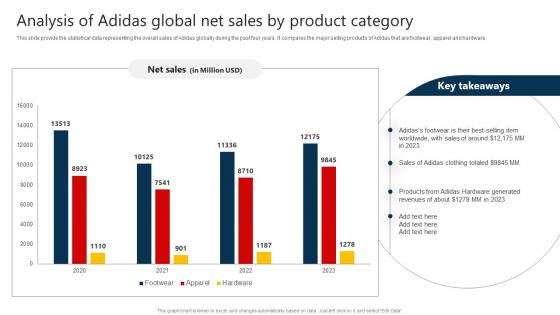
The Marketing Mix Of Analysis Of Adidas Global Net Sales By Product Category Strategy SS V
This slide provide the statistical data representing the overall sales of Adidas globally during the past four years. It compares the major selling products of Adidas that are footwear, apparel and hardware. The The Marketing Mix Of Analysis Of Adidas Global Net Sales By Product Category Strategy SS V is a compilation of the most recent design trends as a series of slides. It is suitable for any subject or industry presentation, containing attractive visuals and photo spots for businesses to clearly express their messages. This template contains a variety of slides for the user to input data, such as structures to contrast two elements, bullet points, and slides for written information. Slidegeeks is prepared to create an impression. This slide provide the statistical data representing the overall sales of Adidas globally during the past four years. It compares the major selling products of Adidas that are footwear, apparel and hardware.
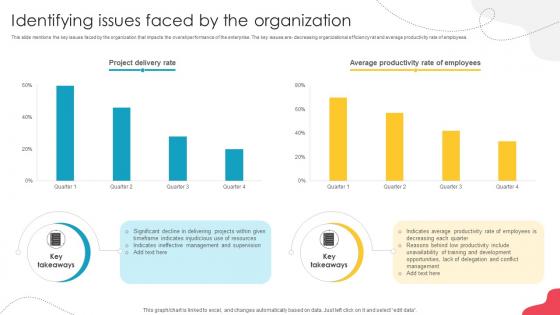
Unlocking Potential Enhancing Identifying Issues Faced By The Organization
This slide mentions the key issues faced by the organization that impacts the overall performance of the enterprise. The key issues are- decreasing organizational efficiency rat and average productivity rate of employees. If your project calls for a presentation, then Slidegeeks is your go-to partner because we have professionally designed, easy-to-edit templates that are perfect for any presentation. After downloading, you can easily edit Unlocking Potential Enhancing Identifying Issues Faced By The Organization and make the changes accordingly. You can rearrange slides or fill them with different images. Check out all the handy templates This slide mentions the key issues faced by the organization that impacts the overall performance of the enterprise. The key issues are- decreasing organizational efficiency rat and average productivity rate of employees.

Unlocking Potential Enhancing Team Management Dashboard To Track Task Completion
This slide depicts dashboard intended to track task completion rate within teams and its management. It includes data about team roles, planned vs actual tasks, task by status, total utilized work hours and task summary. This Unlocking Potential Enhancing Team Management Dashboard To Track Task Completion from Slidegeeks makes it easy to present information on your topic with precision. It provides customization options, so you can make changes to the colors, design, graphics, or any other component to create a unique layout. It is also available for immediate download, so you can begin using it right away. Slidegeeks has done good research to ensure that you have everything you need to make your presentation stand out. Make a name out there for a brilliant performance. This slide depicts dashboard intended to track task completion rate within teams and its management. It includes data about team roles, planned vs actual tasks, task by status, total utilized work hours and task summary.
Unlocking Potential Enhancing Team Training And Development Program Tracking Dashboard
This slide depicts team development program tracking dashboard to analyze the impact of implementing training plan for the members. It includes training satisfaction rate, engagement score, drop-out rate and top 5 trainees. Find a pre-designed and impeccable Unlocking Potential Enhancing Team Training And Development Program Tracking Dashboard. The templates can ace your presentation without additional effort. You can download these easy-to-edit presentation templates to make your presentation stand out from others. So, what are you waiting for Download the template from Slidegeeks today and give a unique touch to your presentation. This slide depicts team development program tracking dashboard to analyze the impact of implementing training plan for the members. It includes training satisfaction rate, engagement score, drop-out rate and top 5 trainees.
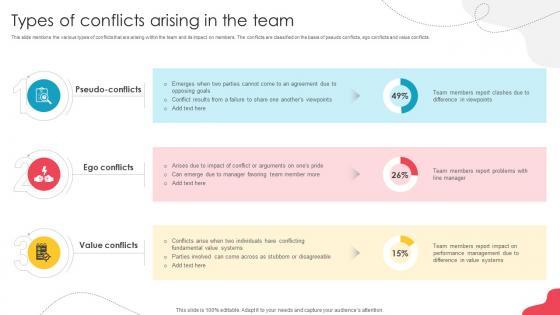
Unlocking Potential Enhancing Types Of Conflicts Arising In The Team
This slide mentions the various types of conflicts that are arising within the team and its impact on members. The conflicts are classified on the basis of pseudo conflicts, ego conflicts and value conflicts. Create an editable Unlocking Potential Enhancing Types Of Conflicts Arising In The Team that communicates your idea and engages your audience. Whether you are presenting a business or an educational presentation, pre-designed presentation templates help save time. Unlocking Potential Enhancing Types Of Conflicts Arising In The Team is highly customizable and very easy to edit, covering many different styles from creative to business presentations. Slidegeeks has creative team members who have crafted amazing templates. So, go and get them without any delay. This slide mentions the various types of conflicts that are arising within the team and its impact on members. The conflicts are classified on the basis of pseudo conflicts, ego conflicts and value conflicts.
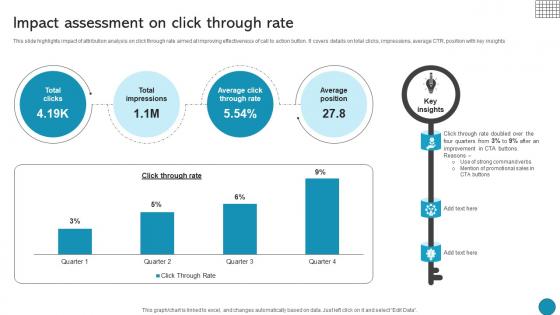
Impact Assessment On Click Through Rate Driving Business Success Integrating Product
This slide highlights impact of attribution analysis on click through rate aimed at improving effectiveness of call to action button. It covers details on total clicks, impressions, average CTR, position with key insights The Impact Assessment On Click Through Rate Driving Business Success Integrating Product is a compilation of the most recent design trends as a series of slides. It is suitable for any subject or industry presentation, containing attractive visuals and photo spots for businesses to clearly express their messages. This template contains a variety of slides for the user to input data, such as structures to contrast two elements, bullet points, and slides for written information. Slidegeeks is prepared to create an impression. This slide highlights impact of attribution analysis on click through rate aimed at improving effectiveness of call to action button. It covers details on total clicks, impressions, average CTR, position with key insights
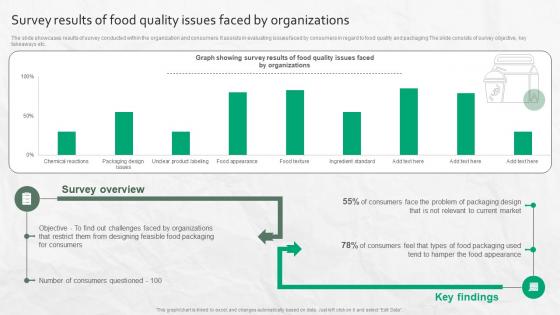
Survey Results Of Food Quality Issues Faced By Organizations
The slide showcases results of survey conducted within the organization and consumers. It assists in evaluating issues faced by consumers in regard to food quality and packaging The slide consists of survey objective, key takeaways etc. Slidegeeks is here to make your presentations a breeze with Survey Results Of Food Quality Issues Faced By Organizations With our easy-to-use and customizable templates, you can focus on delivering your ideas rather than worrying about formatting. With a variety of designs to choose from, you are sure to find one that suits your needs. And with animations and unique photos, illustrations, and fonts, you can make your presentation pop. So whether you are giving a sales pitch or presenting to the board, make sure to check out Slidegeeks first The slide showcases results of survey conducted within the organization and consumers. It assists in evaluating issues faced by consumers in regard to food quality and packaging The slide consists of survey objective, key takeaways etc.
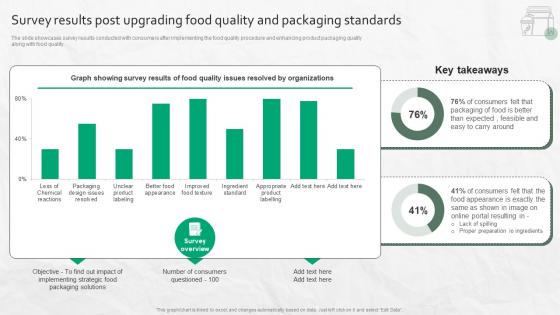
Survey Results Post Upgrading Food Quality And Packaging Standards
The slide showcases survey results conducted with consumers after implementing the food quality procedure and enhancing product packaging quality along with food quality. Do you have an important presentation coming up Are you looking for something that will make your presentation stand out from the rest Look no further than Survey Results Post Upgrading Food Quality And Packaging Standards. With our professional designs, you can trust that your presentation will pop and make delivering it a smooth process. And with Slidegeeks, you can trust that your presentation will be unique and memorable. So why wait Grab Survey Results Post Upgrading Food Quality And Packaging Standards today and make your presentation stand out from the rest The slide showcases survey results conducted with consumers after implementing the food quality procedure and enhancing product packaging quality along with food quality.
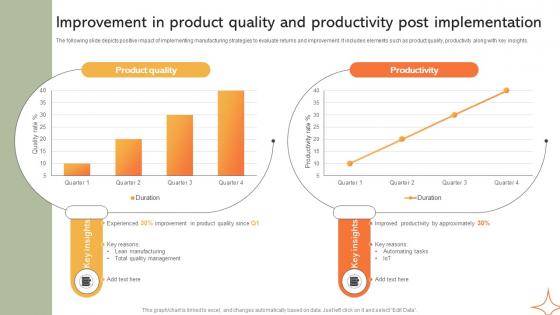
Improvement In Product Quality And Productivity Implementing Manufacturing Strategy SS V
The following slide depicts positive impact of implementing manufacturing strategies to evaluate returns and improvement. It includes elements such as product quality, productivity along with key insights. This Improvement In Product Quality And Productivity Implementing Manufacturing Strategy SS V is perfect for any presentation, be it in front of clients or colleagues. It is a versatile and stylish solution for organizing your meetings. The Improvement In Product Quality And Productivity Implementing Manufacturing Strategy SS V features a modern design for your presentation meetings. The adjustable and customizable slides provide unlimited possibilities for acing up your presentation. Slidegeeks has done all the homework before launching the product for you. So, do not wait, grab the presentation templates today The following slide depicts positive impact of implementing manufacturing strategies to evaluate returns and improvement. It includes elements such as product quality, productivity along with key insights.
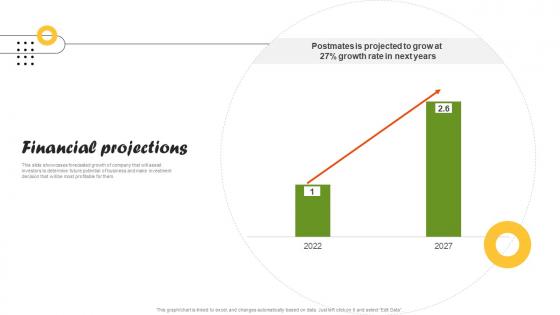
Financial Projections On Demand Food Delivery Platform Investor Funding Elevator Pitch Deck
This slide showcases forecasted growth of company that will assist investors to determine future potential of business and make investment decision that will be most profitable for them. Create an editable Financial Projections On Demand Food Delivery Platform Investor Funding Elevator Pitch Deck that communicates your idea and engages your audience. Whether you are presenting a business or an educational presentation, pre-designed presentation templates help save time. Financial Projections On Demand Food Delivery Platform Investor Funding Elevator Pitch Deck is highly customizable and very easy to edit, covering many different styles from creative to business presentations. Slidegeeks has creative team members who have crafted amazing templates. So, go and get them without any delay. This slide showcases forecasted growth of company that will assist investors to determine future potential of business and make investment decision that will be most profitable for them.
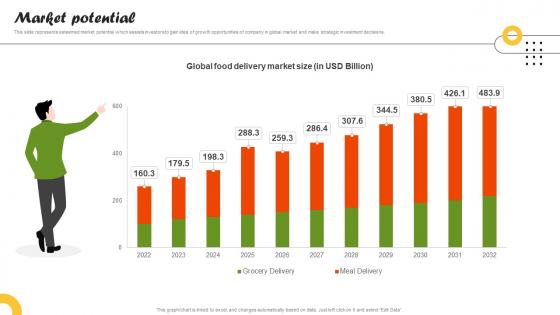
Market Potential On Demand Food Delivery Platform Investor Funding Elevator Pitch Deck
This slide represents esteemed market potential which assists investors to gain idea of growth opportunities of company in global market and make strategic investment decisions. Create an editable Market Potential On Demand Food Delivery Platform Investor Funding Elevator Pitch Deck that communicates your idea and engages your audience. Whether you are presenting a business or an educational presentation, pre-designed presentation templates help save time. Market Potential On Demand Food Delivery Platform Investor Funding Elevator Pitch Deck is highly customizable and very easy to edit, covering many different styles from creative to business presentations. Slidegeeks has creative team members who have crafted amazing templates. So, go and get them without any delay. This slide represents esteemed market potential which assists investors to gain idea of growth opportunities of company in global market and make strategic investment decisions.
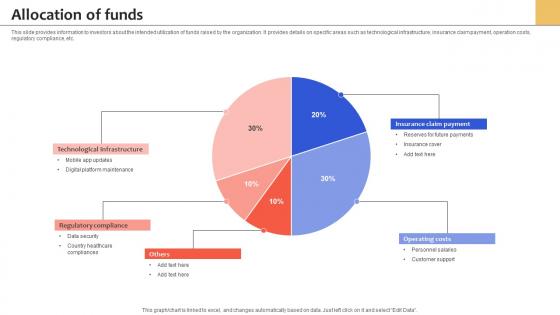
Allocation Of Funds Health Insurance Services Management Platform Pitch Deck
This slide provides information to investors about the intended utilization of funds raised by the organization. It provides details on specific areas such as technological infrastructure, insurance claim payment, operation costs, regulatory compliance, etc. Find a pre-designed and impeccable Allocation Of Funds Health Insurance Services Management Platform Pitch Deck. The templates can ace your presentation without additional effort. You can download these easy-to-edit presentation templates to make your presentation stand out from others. So, what are you waiting for Download the template from Slidegeeks today and give a unique touch to your presentation. This slide provides information to investors about the intended utilization of funds raised by the organization. It provides details on specific areas such as technological infrastructure, insurance claim payment, operation costs, regulatory compliance, etc.
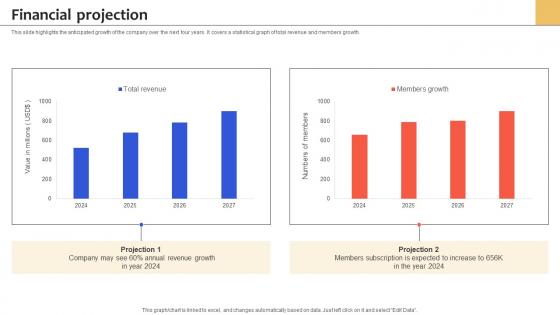
Financial Projection Health Insurance Services Management Platform Pitch Deck
This slide highlights the anticipated growth of the company over the next four years. It covers a statistical graph of total revenue and members growth. Slidegeeks is here to make your presentations a breeze with Financial Projection Health Insurance Services Management Platform Pitch Deck With our easy-to-use and customizable templates, you can focus on delivering your ideas rather than worrying about formatting. With a variety of designs to choose from, you are sure to find one that suits your needs. And with animations and unique photos, illustrations, and fonts, you can make your presentation pop. So whether you are giving a sales pitch or presenting to the board, make sure to check out Slidegeeks first This slide highlights the anticipated growth of the company over the next four years. It covers a statistical graph of total revenue and members growth.
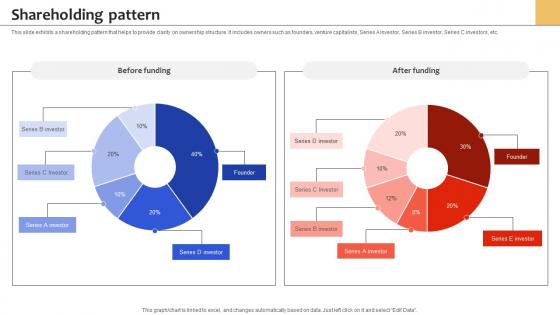
Shareholding Pattern Health Insurance Services Management Platform Pitch Deck
This slide exhibits a shareholding pattern that helps to provide clarity on ownership structure. It includes owners such as founders, venture capitalists, Series A investor, Series B investor, Series C investors, etc. This Shareholding Pattern Health Insurance Services Management Platform Pitch Deck is perfect for any presentation, be it in front of clients or colleagues. It is a versatile and stylish solution for organizing your meetings. The Shareholding Pattern Health Insurance Services Management Platform Pitch Deck features a modern design for your presentation meetings. The adjustable and customizable slides provide unlimited possibilities for acing up your presentation. Slidegeeks has done all the homework before launching the product for you. So, do not wait, grab the presentation templates today This slide exhibits a shareholding pattern that helps to provide clarity on ownership structure. It includes owners such as founders, venture capitalists, Series A investor, Series B investor, Series C investors, etc.
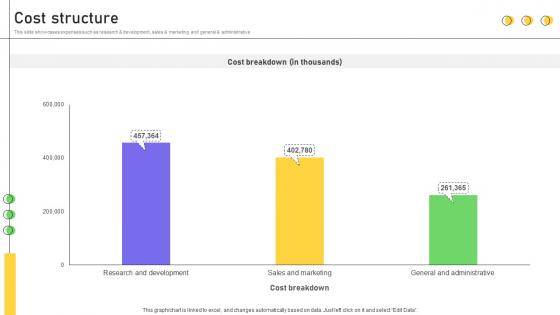
Cost Structure Business Productivity Platform Business Model BMC SS V
This slide showcases expenses such as research and development, sales and marketing and general and administrative. Create an editable Cost Structure Business Productivity Platform Business Model BMC SS V that communicates your idea and engages your audience. Whether you are presenting a business or an educational presentation, pre-designed presentation templates help save time. Cost Structure Business Productivity Platform Business Model BMC SS V is highly customizable and very easy to edit, covering many different styles from creative to business presentations. Slidegeeks has creative team members who have crafted amazing templates. So, go and get them without any delay. This slide showcases expenses such as research and development, sales and marketing and general and administrative.
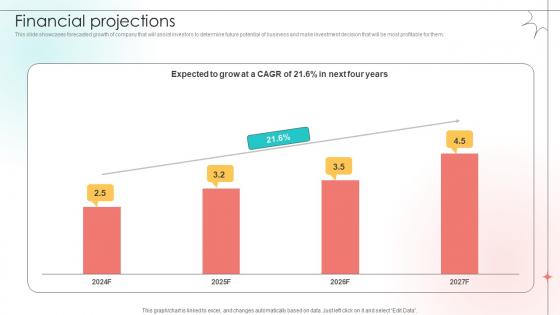
Financial Projections Open Source Solution Investor Funding Elevator Pitch Deck
This slide showcases forecasted growth of company that will assist investors to determine future potential of business and make investment decision that will be most profitable for them. Slidegeeks is here to make your presentations a breeze with Financial Projections Open Source Solution Investor Funding Elevator Pitch Deck With our easy-to-use and customizable templates, you can focus on delivering your ideas rather than worrying about formatting. With a variety of designs to choose from, you are sure to find one that suits your needs. And with animations and unique photos, illustrations, and fonts, you can make your presentation pop. So whether you are giving a sales pitch or presenting to the board, make sure to check out Slidegeeks first This slide showcases forecasted growth of company that will assist investors to determine future potential of business and make investment decision that will be most profitable for them.
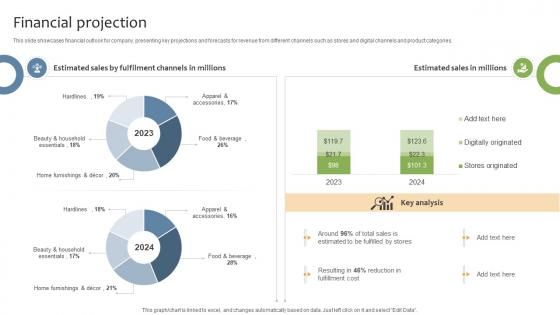
Financial Projection General Merchandising Store Business Model BMC SS V
This slide showcases financial outlook for company, presenting key projections and forecasts for revenue from different channels such as stores and digital channels and product categories. This Financial Projection General Merchandising Store Business Model BMC SS V is perfect for any presentation, be it in front of clients or colleagues. It is a versatile and stylish solution for organizing your meetings. The Financial Projection General Merchandising Store Business Model BMC SS V features a modern design for your presentation meetings. The adjustable and customizable slides provide unlimited possibilities for acing up your presentation. Slidegeeks has done all the homework before launching the product for you. So, do not wait, grab the presentation templates today This slide showcases financial outlook for company, presenting key projections and forecasts for revenue from different channels such as stores and digital channels and product categories.
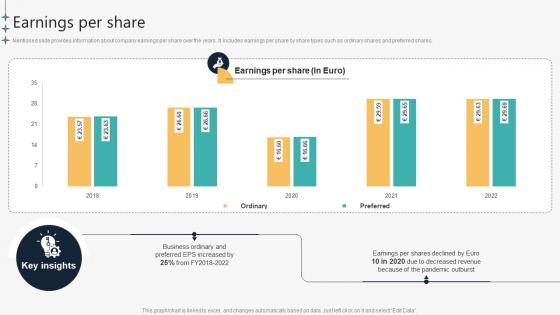
Earnings Per Share Automotive Manufacturing Company Profile CP SS V
Mentioned slide provides information about company earnings per share over the years. It includes earnings per share by share types such as ordinary shares and preferred shares.Slidegeeks is here to make your presentations a breeze with Earnings Per Share Automotive Manufacturing Company Profile CP SS V With our easy-to-use and customizable templates, you can focus on delivering your ideas rather than worrying about formatting. With a variety of designs to choose from, you are sure to find one that suits your needs. And with animations and unique photos, illustrations, and fonts, you can make your presentation pop. So whether you are giving a sales pitch or presenting to the board, make sure to check out Slidegeeks first Mentioned slide provides information about company earnings per share over the years. It includes earnings per share by share types such as ordinary shares and preferred shares.
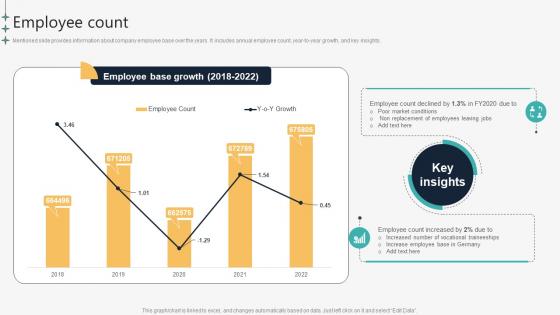
Employee Count Automotive Manufacturing Company Profile CP SS V
Mentioned slide provides information about company employee base over the years. It includes annual employee count, year-to-year growth, and key insights.Do you have an important presentation coming up Are you looking for something that will make your presentation stand out from the rest Look no further than Employee Count Automotive Manufacturing Company Profile CP SS V. With our professional designs, you can trust that your presentation will pop and make delivering it a smooth process. And with Slidegeeks, you can trust that your presentation will be unique and memorable. So why wait Grab Employee Count Automotive Manufacturing Company Profile CP SS V today and make your presentation stand out from the rest Mentioned slide provides information about company employee base over the years. It includes annual employee count, year-to-year growth, and key insights.
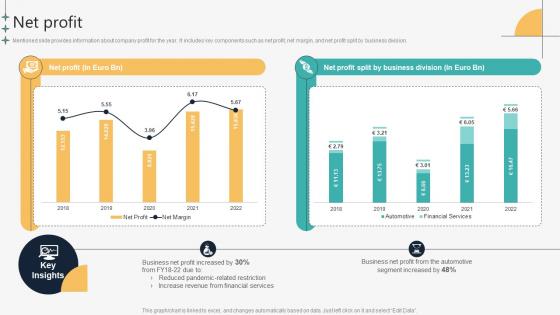
Net Profit Automotive Manufacturing Company Profile CP SS V
Mentioned slide provides information about company profit for the year. It includes key components such as net profit, net margin, and net profit split by business division.The Net Profit Automotive Manufacturing Company Profile CP SS V is a compilation of the most recent design trends as a series of slides. It is suitable for any subject or industry presentation, containing attractive visuals and photo spots for businesses to clearly express their messages. This template contains a variety of slides for the user to input data, such as structures to contrast two elements, bullet points, and slides for written information. Slidegeeks is prepared to create an impression. Mentioned slide provides information about company profit for the year. It includes key components such as net profit, net margin, and net profit split by business division.
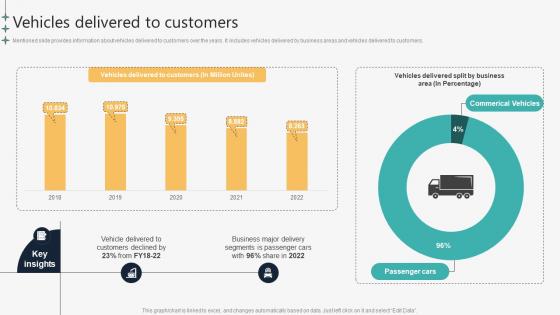
Vehicles Delivered To Customers Automotive Manufacturing Company Profile CP SS V
Mentioned slide provides information about vehicles delivered to customers over the years. It includes vehicles delivered by business areas and vehicles delivered to customers. Slidegeeks is here to make your presentations a breeze with Vehicles Delivered To Customers Automotive Manufacturing Company Profile CP SS V With our easy-to-use and customizable templates, you can focus on delivering your ideas rather than worrying about formatting. With a variety of designs to choose from, you are sure to find one that suits your needs. And with animations and unique photos, illustrations, and fonts, you can make your presentation pop. So whether you are giving a sales pitch or presenting to the board, make sure to check out Slidegeeks first Mentioned slide provides information about vehicles delivered to customers over the years. It includes vehicles delivered by business areas and vehicles delivered to customers.
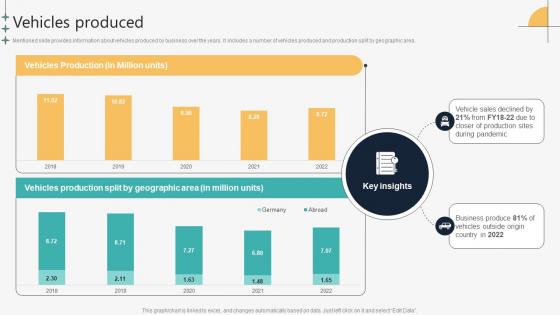
Vehicles Produced Automotive Manufacturing Company Profile CP SS V
Mentioned slide provides information about vehicles produced by business over the years. It includes a number of vehicles produced and production split by geographic area.Do you have an important presentation coming up Are you looking for something that will make your presentation stand out from the rest Look no further than Vehicles Produced Automotive Manufacturing Company Profile CP SS V. With our professional designs, you can trust that your presentation will pop and make delivering it a smooth process. And with Slidegeeks, you can trust that your presentation will be unique and memorable. So why wait Grab Vehicles Produced Automotive Manufacturing Company Profile CP SS V today and make your presentation stand out from the rest Mentioned slide provides information about vehicles produced by business over the years. It includes a number of vehicles produced and production split by geographic area.
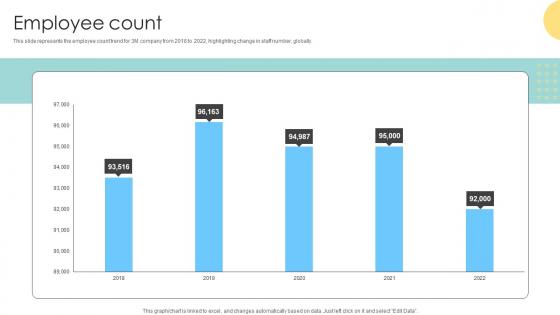
Employee Count Multinational Conglomerate Company Profile CP SS V
This slide represents the employee count trend for 3M company from 2018 to 2022, highlighting change in staff number, globally.Get a simple yet stunning designed Employee Count Multinational Conglomerate Company Profile CP SS V. It is the best one to establish the tone in your meetings. It is an excellent way to make your presentations highly effective. So, download this PPT today from Slidegeeks and see the positive impacts. Our easy-to-edit Employee Count Multinational Conglomerate Company Profile CP SS V can be your go-to option for all upcoming conferences and meetings. So, what are you waiting for Grab this template today. This slide represents the employee count trend for 3M company from 2018 to 2022, highlighting change in staff number, globally.
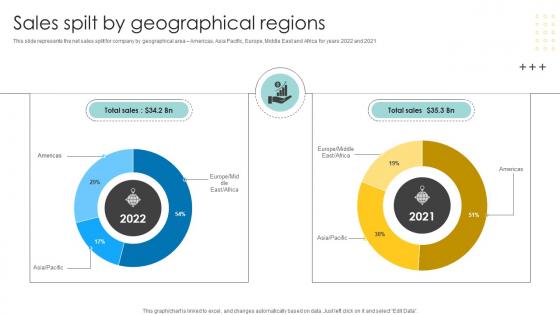
Sales Spilt By Geographical Regions Multinational Conglomerate Company Profile CP SS V
This slide represents the net sales split for company by geographical area Americas, Asia Pacific, Europe, Middle East and Africa for years 2022 and 2021.This Sales Spilt By Geographical Regions Multinational Conglomerate Company Profile CP SS V is perfect for any presentation, be it in front of clients or colleagues. It is a versatile and stylish solution for organizing your meetings. The Sales Spilt By Geographical Regions Multinational Conglomerate Company Profile CP SS V features a modern design for your presentation meetings. The adjustable and customizable slides provide unlimited possibilities for acing up your presentation. Slidegeeks has done all the homework before launching the product for you. So, do not wait, grab the presentation templates today This slide represents the net sales split for company by geographical area Americas, Asia Pacific, Europe, Middle East and Africa for years 2022 and 2021
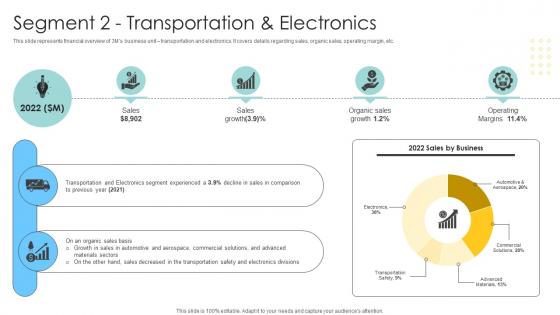
Segment 2 Transportation And Electronics Multinational Conglomerate Company Profile CP SS V
This slide represents financial overview of 3Ms business unit transportation and electronics. It covers details regarding sales, organic sales, operating margin, etc.Explore a selection of the finest Segment 2 Transportation And Electronics Multinational Conglomerate Company Profile CP SS V here. With a plethora of professionally designed and pre-made slide templates, you can quickly and easily find the right one for your upcoming presentation. You can use our Segment 2 Transportation And Electronics Multinational Conglomerate Company Profile CP SS V to effectively convey your message to a wider audience. Slidegeeks has done a lot of research before preparing these presentation templates. The content can be personalized and the slides are highly editable. Grab templates today from Slidegeeks. This slide represents financial overview of 3Ms business unit transportation and electronics. It covers details regarding sales, organic sales, operating margin, etc.

Segment 4 Healthcare Multinational Conglomerate Company Profile CP SS V
This slide represents financial overview of 3Ms business unit healthcare. It covers details regarding sales, organic sales, operating margin, etc.The Segment 4 Healthcare Multinational Conglomerate Company Profile CP SS V is a compilation of the most recent design trends as a series of slides. It is suitable for any subject or industry presentation, containing attractive visuals and photo spots for businesses to clearly express their messages. This template contains a variety of slides for the user to input data, such as structures to contrast two elements, bullet points, and slides for written information. Slidegeeks is prepared to create an impression. This slide represents financial overview of 3Ms business unit healthcare. It covers details regarding sales, organic sales, operating margin, etc.
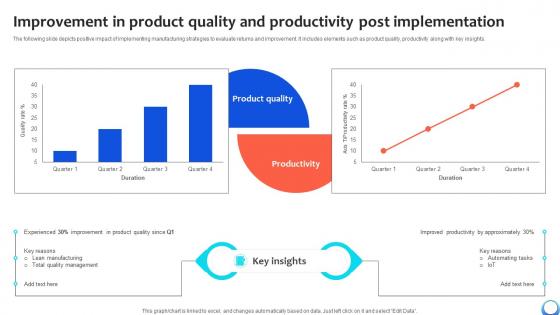
Improvement In Product Quality And Productivity Automating Production Process Strategy SS V
The following slide depicts positive impact of implementing manufacturing strategies to evaluate returns and improvement. It includes elements such as product quality, productivity along with key insights. This Improvement In Product Quality And Productivity Automating Production Process Strategy SS V is perfect for any presentation, be it in front of clients or colleagues. It is a versatile and stylish solution for organizing your meetings. The Improvement In Product Quality And Productivity Automating Production Process Strategy SS V features a modern design for your presentation meetings. The adjustable and customizable slides provide unlimited possibilities for acing up your presentation. Slidegeeks has done all the homework before launching the product for you. So, do not wait, grab the presentation templates today The following slide depicts positive impact of implementing manufacturing strategies to evaluate returns and improvement. It includes elements such as product quality, productivity along with key insights.

Analysing Impact Of Customer Support Boosting Customer Retention Rate With Live Chat
The following slide depicts graphs to evaluate impact of implementing strategies for optimizing customer support. It includes elements such as customer satisfaction score CSAT , net promotor score NPS along with key insights. Create an editable Analysing Impact Of Customer Support Boosting Customer Retention Rate With Live Chat that communicates your idea and engages your audience. Whether you are presenting a business or an educational presentation, pre-designed presentation templates help save time. Analysing Impact Of Customer Support Boosting Customer Retention Rate With Live Chat is highly customizable and very easy to edit, covering many different styles from creative to business presentations. Slidegeeks has creative team members who have crafted amazing templates. So, go and get them without any delay. The following slide depicts graphs to evaluate impact of implementing strategies for optimizing customer support. It includes elements such as customer satisfaction score CSAT , net promotor score NPS along with key insights.
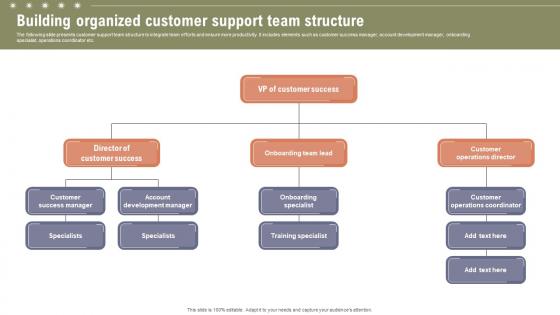
Building Organized Customer Support Boosting Customer Retention Rate With Live Chat
The following slide presents customer support team structure to integrate team efforts and ensure more productivity. It includes elements such as customer success manager, account development manager, onboarding specialist, operations coordinator etc. Get a simple yet stunning designed Building Organized Customer Support Boosting Customer Retention Rate With Live Chat. It is the best one to establish the tone in your meetings. It is an excellent way to make your presentations highly effective. So, download this PPT today from Slidegeeks and see the positive impacts. Our easy-to-edit Building Organized Customer Support Boosting Customer Retention Rate With Live Chat can be your go-to option for all upcoming conferences and meetings. So, what are you waiting for Grab this template today. The following slide presents customer support team structure to integrate team efforts and ensure more productivity. It includes elements such as customer success manager, account development manager, onboarding specialist, operations coordinator etc.
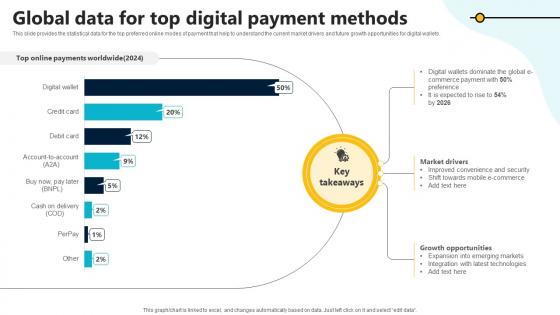
Global Data For Top Digital Payment Methods In Depth Guide To Digital Wallets Fin SS V
This slide provides the statistical data for the top preferred online modes of payment that help to understand the current market drivers and future growth opportunities for digital wallets. Explore a selection of the finest Global Data For Top Digital Payment Methods In Depth Guide To Digital Wallets Fin SS V here. With a plethora of professionally designed and pre-made slide templates, you can quickly and easily find the right one for your upcoming presentation. You can use our Global Data For Top Digital Payment Methods In Depth Guide To Digital Wallets Fin SS V to effectively convey your message to a wider audience. Slidegeeks has done a lot of research before preparing these presentation templates. The content can be personalized and the slides are highly editable. Grab templates today from Slidegeeks. This slide provides the statistical data for the top preferred online modes of payment that help to understand the current market drivers and future growth opportunities for digital wallets.
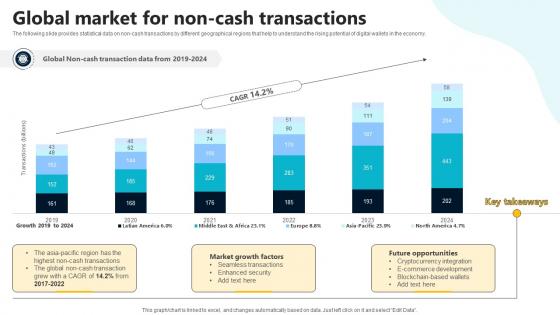
Global Market For Non Cash Transactions In Depth Guide To Digital Wallets Fin SS V
The following slide provides statistical data on non-cash transactions by different geographical regions that help to understand the rising potential of digital wallets in the economy. The Global Market For Non Cash Transactions In Depth Guide To Digital Wallets Fin SS V is a compilation of the most recent design trends as a series of slides. It is suitable for any subject or industry presentation, containing attractive visuals and photo spots for businesses to clearly express their messages. This template contains a variety of slides for the user to input data, such as structures to contrast two elements, bullet points, and slides for written information. Slidegeeks is prepared to create an impression. The following slide provides statistical data on non-cash transactions by different geographical regions that help to understand the rising potential of digital wallets in the economy.
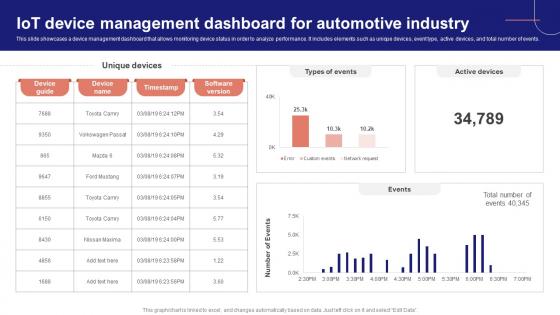
IoT Device Management Fundamentals IoT Device Management Dashboard For Automotive IoT Ss V
This slide showcases a device management dashboard that allows monitoring device status in order to analyze performance. It includes elements such as unique devices, event type, active devices, and total number of events. Create an editable IoT Device Management Fundamentals IoT Device Management Dashboard For Automotive IoT SS V that communicates your idea and engages your audience. Whether you are presenting a business or an educational presentation, pre-designed presentation templates help save time. IoT Device Management Fundamentals IoT Device Management Dashboard For Automotive IoT SS V is highly customizable and very easy to edit, covering many different styles from creative to business presentations. Slidegeeks has creative team members who have crafted amazing templates. So, go and get them without any delay. This slide showcases a device management dashboard that allows monitoring device status in order to analyze performance. It includes elements such as unique devices, event type, active devices, and total number of events.
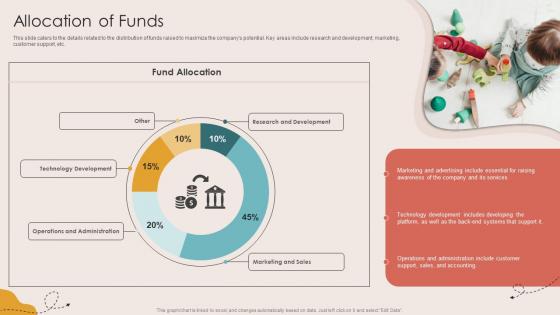
Allocation Of Funds Children Events Listing Investor Funding Elevator Pitch Deck
This slide caters to the details related to the distribution of funds raised to maximize the companys potential. Key areas include research and development, marketing, customer support, etc. Find a pre-designed and impeccable Allocation Of Funds Children Events Listing Investor Funding Elevator Pitch Deck. The templates can ace your presentation without additional effort. You can download these easy-to-edit presentation templates to make your presentation stand out from others. So, what are you waiting for Download the template from Slidegeeks today and give a unique touch to your presentation. This slide caters to the details related to the distribution of funds raised to maximize the companys potential. Key areas include research and development, marketing, customer support, etc.
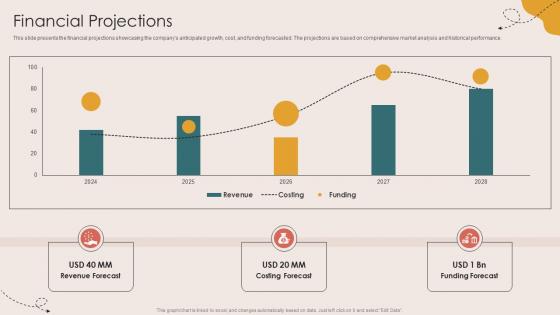
Financial Projections Children Events Listing Investor Funding Elevator Pitch Deck
This slide presents the financial projections showcasing the companys anticipated growth, cost, and funding forecasted. The projections are based on comprehensive market analysis and historical performance. Slidegeeks is here to make your presentations a breeze with Financial Projections Children Events Listing Investor Funding Elevator Pitch Deck With our easy-to-use and customizable templates, you can focus on delivering your ideas rather than worrying about formatting. With a variety of designs to choose from, you are sure to find one that suits your needs. And with animations and unique photos, illustrations, and fonts, you can make your presentation pop. So whether you are giving a sales pitch or presenting to the board, make sure to check out Slidegeeks first This slide presents the financial projections showcasing the companys anticipated growth, cost, and funding forecasted. The projections are based on comprehensive market analysis and historical performance.
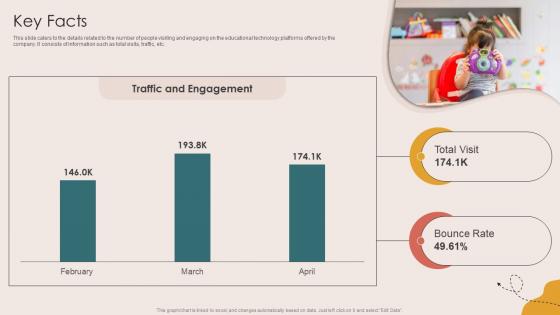
Key Facts Children Events Listing Investor Funding Elevator Pitch Deck
This slide caters to the details related to the number of people visiting and engaging on the educational technology platforms offered by the company. It consists of information such as total visits, traffic, etc. If your project calls for a presentation, then Slidegeeks is your go-to partner because we have professionally designed, easy-to-edit templates that are perfect for any presentation. After downloading, you can easily edit Key Facts Children Events Listing Investor Funding Elevator Pitch Deck and make the changes accordingly. You can rearrange slides or fill them with different images. Check out all the handy templates This slide caters to the details related to the number of people visiting and engaging on the educational technology platforms offered by the company. It consists of information such as total visits, traffic, etc.
Shareholding Pattern Children Events Listing Investor Funding Elevator Pitch Deck
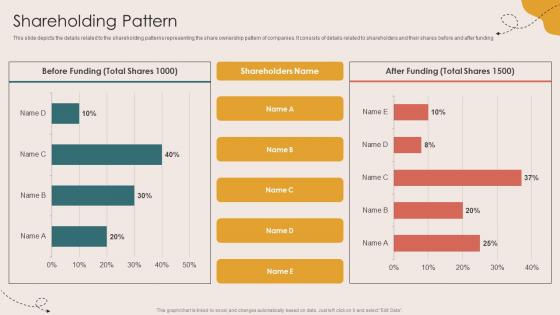
This slide depicts the details related to the shareholding patterns representing the share ownership pattern of companies. It consists of details related to shareholders and their shares before and after funding. This Shareholding Pattern Children Events Listing Investor Funding Elevator Pitch Deck is perfect for any presentation, be it in front of clients or colleagues. It is a versatile and stylish solution for organizing your meetings. The Shareholding Pattern Children Events Listing Investor Funding Elevator Pitch Deck features a modern design for your presentation meetings. The adjustable and customizable slides provide unlimited possibilities for acing up your presentation. Slidegeeks has done all the homework before launching the product for you. So, do not wait, grab the presentation templates today This slide depicts the details related to the shareholding patterns representing the share ownership pattern of companies. It consists of details related to shareholders and their shares before and after funding.
Effective Employee Monthly Productivity Report Analysing Hr Data For Effective Decision Making
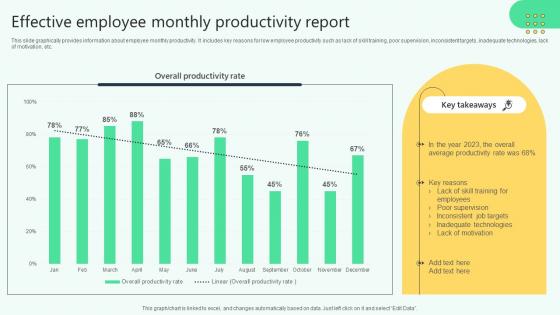
This slide graphically provides information about employee monthly productivity. It includes key reasons for low employee productivity such as lack of skill training, poor supervision, inconsistent targets, inadequate technologies, lack of motivation, etc. If your project calls for a presentation, then Slidegeeks is your go-to partner because we have professionally designed, easy-to-edit templates that are perfect for any presentation. After downloading, you can easily edit Effective Employee Monthly Productivity Report Analysing Hr Data For Effective Decision Making and make the changes accordingly. You can rearrange slides or fill them with different images. Check out all the handy templates This slide graphically provides information about employee monthly productivity. It includes key reasons for low employee productivity such as lack of skill training, poor supervision, inconsistent targets, inadequate technologies, lack of motivation, etc.

Hr Recruitment Dashboard Showcasing Open Positions By Analysing Hr Data For Effective Decision Making
This slide showcases a dashboard that helps organizations track and monitor the hiring process. It includes total applicants, shortlisted candidates, hired candidates, rejected candidates, time to hire, cost to hire, etc. The Hr Recruitment Dashboard Showcasing Open Positions By Analysing Hr Data For Effective Decision Making is a compilation of the most recent design trends as a series of slides. It is suitable for any subject or industry presentation, containing attractive visuals and photo spots for businesses to clearly express their messages. This template contains a variety of slides for the user to input data, such as structures to contrast two elements, bullet points, and slides for written information. Slidegeeks is prepared to create an impression. This slide showcases a dashboard that helps organizations track and monitor the hiring process. It includes total applicants, shortlisted candidates, hired candidates, rejected candidates, time to hire, cost to hire, etc.

Introduction Of New Human Resource Management Analysing Hr Data For Effective Decision Making
Following slide showcases the development of a new human resource management process aimed at increasing employee performance. It includes internal recruitment, external recruitment, selection, training, assessing performance, motivating, This Introduction Of New Human Resource Management Analysing Hr Data For Effective Decision Making from Slidegeeks makes it easy to present information on your topic with precision. It provides customization options, so you can make changes to the colors, design, graphics, or any other component to create a unique layout. It is also available for immediate download, so you can begin using it right away. Slidegeeks has done good research to ensure that you have everything you need to make your presentation stand out. Make a name out there for a brilliant performance. Following slide showcases the development of a new human resource management process aimed at increasing employee performance. It includes internal recruitment, external recruitment, selection, training, assessing performance, motivating,
Kpi Dashboard Measuring Employee Satisfaction Score Analysing Hr Data For Effective Decision Making
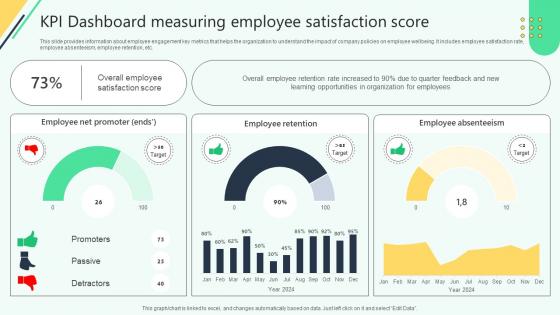
This slide provides information about employee engagement key metrics that helps the organization to understand the impact of company policies on employee wellbeing. It includes employee satisfaction rate, employee absenteeism, employee retention, etc. Create an editable Kpi Dashboard Measuring Employee Satisfaction Score Analysing Hr Data For Effective Decision Making that communicates your idea and engages your audience. Whether you are presenting a business or an educational presentation, pre-designed presentation templates help save time. Kpi Dashboard Measuring Employee Satisfaction Score Analysing Hr Data For Effective Decision Making is highly customizable and very easy to edit, covering many different styles from creative to business presentations. Slidegeeks has creative team members who have crafted amazing templates. So, go and get them without any delay. This slide provides information about employee engagement key metrics that helps the organization to understand the impact of company policies on employee wellbeing. It includes employee satisfaction rate, employee absenteeism, employee retention, etc.
Elevating Sales Networks Decline In Overall Sales Revenue Over Past Years SA SS V
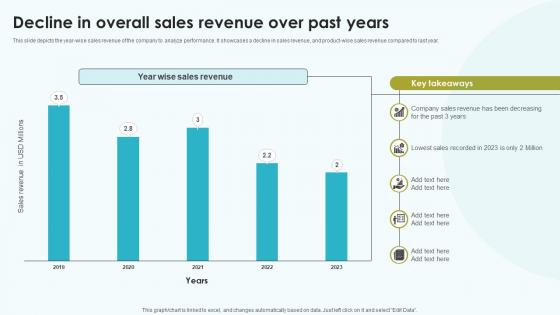
This slide depicts the year-wise sales revenue of the company to analyze performance. It showcases a decline in sales revenue, and product-wise sales revenue compared to last year. Slidegeeks is here to make your presentations a breeze with Elevating Sales Networks Decline In Overall Sales Revenue Over Past Years SA SS V With our easy-to-use and customizable templates, you can focus on delivering your ideas rather than worrying about formatting. With a variety of designs to choose from, you are sure to find one that suits your needs. And with animations and unique photos, illustrations, and fonts, you can make your presentation pop. So whether you are giving a sales pitch or presenting to the board, make sure to check out Slidegeeks first This slide depicts the year-wise sales revenue of the company to analyze performance. It showcases a decline in sales revenue, and product-wise sales revenue compared to last year.
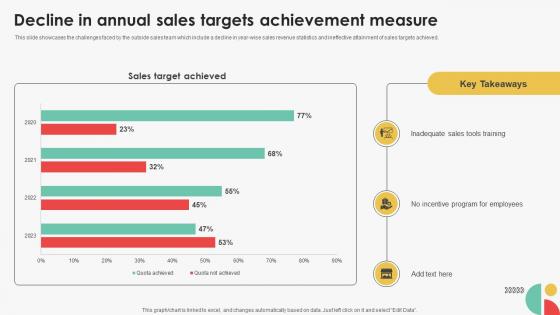
Decline In Annual Sales Targets Achievement Efficient Sales Territory Management To Build SA SS V
This slide showcases the challenges faced by the outside sales team which include a decline in year-wise sales revenue statistics and ineffective attainment of sales targets achieved. Slidegeeks is here to make your presentations a breeze with Decline In Annual Sales Targets Achievement Efficient Sales Territory Management To Build SA SS V With our easy-to-use and customizable templates, you can focus on delivering your ideas rather than worrying about formatting. With a variety of designs to choose from, you are sure to find one that suits your needs. And with animations and unique photos, illustrations, and fonts, you can make your presentation pop. So whether you are giving a sales pitch or presenting to the board, make sure to check out Slidegeeks first This slide showcases the challenges faced by the outside sales team which include a decline in year-wise sales revenue statistics and ineffective attainment of sales targets achieved.


 Continue with Email

 Home
Home


