Engineer Icon
Dashboard For Risk Communication Strategies Planning And Key Metrics Tracking Brochure PDF Ideas PDF
This slide shows dashboard for planning risk communication and tracking key metrics which includes heat map of risk, classification, objectives, effectiveness, critical risks, etc. Showcasing this set of slides titled Dashboard For Risk Communication Strategies Planning And Key Metrics Tracking Brochure PDF Ideas PDF. The topics addressed in these templates are Risk Heat Map, Tactical Objectives, Controls Effectiveness. All the content presented in this PPT design is completely editable. Download it and make adjustments in color, background, font etc. as per your unique business setting.
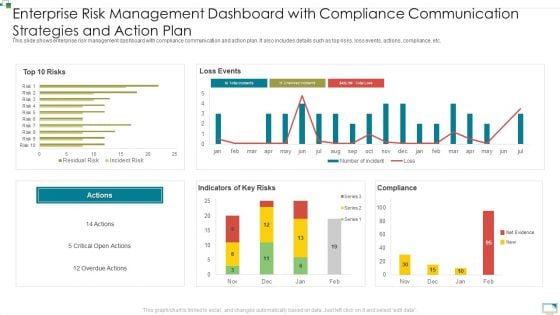
Enterprise Risk Management Dashboard With Compliance Communication Strategies And Action Plan Infographics PDF
This slide shows enterprise risk management dashboard with compliance communication and action plan. It also includes details such as top risks, loss events, actions, compliance, etc. Showcasing this set of slides titled Enterprise Risk Management Dashboard With Compliance Communication Strategies And Action Plan Infographics PDF. The topics addressed in these templates are Top 10 Risks, Loss Events, Actions. All the content presented in this PPT design is completely editable. Download it and make adjustments in color, background, font etc. as per your unique business setting.
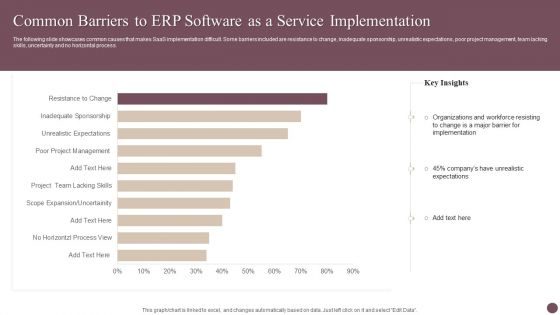
Common Barriers To ERP Software As A Service Implementation Sample PDF
The following slide showcases common causes that makes SaaS implementation difficult. Some barriers included are resistance to change, inadequate sponsorship, unrealistic expectations, poor project management, team lacking skills, uncertainty and no horizontal process. Showcasing this set of slides titled Common Barriers To ERP Software As A Service Implementation Sample PDF. The topics addressed in these templates are Scope Expansion, Uncertainity, Implementation, Workforce Resisting. All the content presented in this PPT design is completely editable. Download it and make adjustments in color, background, font etc. as per your unique business setting.
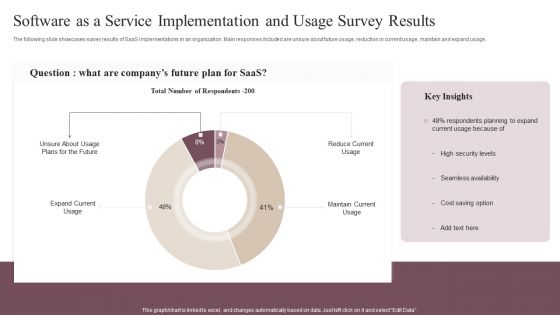
Software As A Service Implementation And Usage Survey Results Clipart PDF
The following slide showcases survey results of SaaS implementations in an organization. Main responses included are unsure about future usage, reduction in current usage, maintain and expand usage. Pitch your topic with ease and precision using this Software As A Service Implementation And Usage Survey Results Clipart PDF. This layout presents information on Reduce Current Usage, Maintain Current Usage, Expand Current Usage . It is also available for immediate download and adjustment. So, changes can be made in the color, design, graphics or any other component to create a unique layout.
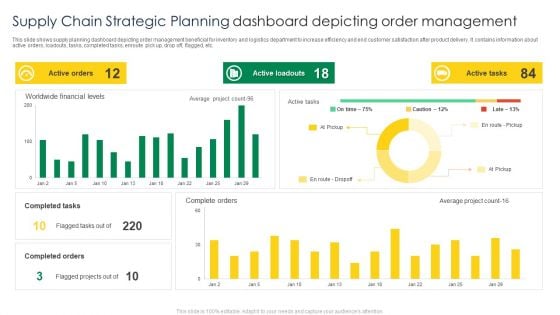
Supply Chain Strategic Planning Dashboard Depicting Order Management Mockup PDF
This slide shows supply planning dashboard depicting order management beneficial for inventory and logistics department to increase efficiency and end customer satisfaction after product delivery. It contains information about active orders, loadouts, tasks, completed tasks, enroute pick up, drop off, flagged, etc. Pitch your topic with ease and precision using this Supply Chain Strategic Planning Dashboard Depicting Order Management Mockup PDF. This layout presents information on Active Orders, Active Loadouts, Active Tasks. It is also available for immediate download and adjustment. So, changes can be made in the color, design, graphics or any other component to create a unique layout.
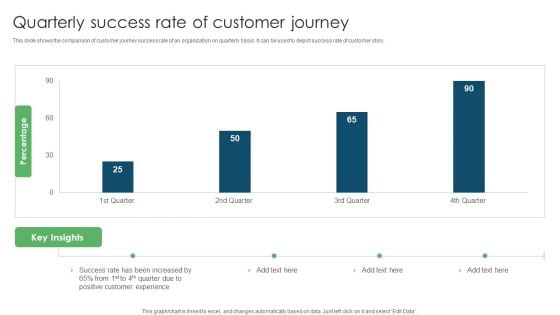
Quarterly Success Rate Of Customer Journey Ppt PowerPoint Presentation Outline Mockup PDF
This slide shows the comparison of customer journey success rate of an organization on quarterly basis. It can be used to depict success rate of customer story. Pitch your topic with ease and precision using this Quarterly Success Rate Of Customer Journey Ppt PowerPoint Presentation Outline Mockup PDF. This layout presents information on Success Rate, Increased Positive, Customer Experience. It is also available for immediate download and adjustment. So, changes can be made in the color, design, graphics or any other component to create a unique layout.
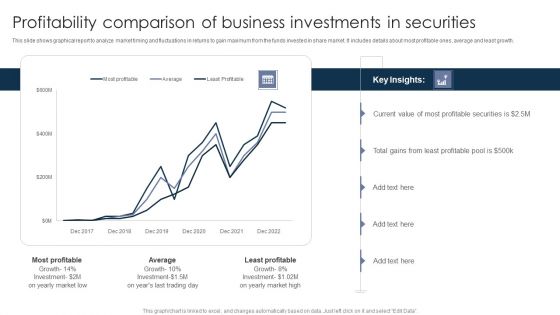
Profitability Comparison Of Business Investments In Securities Ppt PowerPoint Presentation Outline Deck PDF
This slide shows graphical report to analyze market timing and fluctuations in returns to gain maximum from the funds invested in share market. It includes details about most profitable ones, average and least growth. Pitch your topic with ease and precision using this Profitability Comparison Of Business Investments In Securities Ppt PowerPoint Presentation Outline Deck PDF. This layout presents information on Most Profitable, Least Profitable, Least Profitable. It is also available for immediate download and adjustment. So, changes can be made in the color, design, graphics or any other component to create a unique layout.
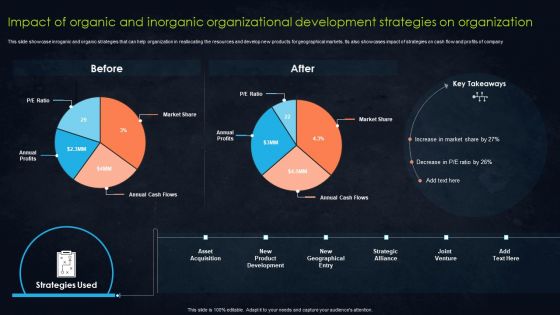
Impact Of Organic And Inorganic Organizational Development Strategies On Organization Demonstration PDF
This slide showcase inroganic and organic strategies that can help organization in reallocating the resources and develop new products for geographical markets. Its also showcases impact of strategies on cash flow and profits of company. Pitch your topic with ease and precision using this Impact Of Organic And Inorganic Organizational Development Strategies On Organization Demonstration PDF. This layout presents information on Annual Profits, Market Share, Strategies. It is also available for immediate download and adjustment. So, changes can be made in the color, design, graphics or any other component to create a unique layout.
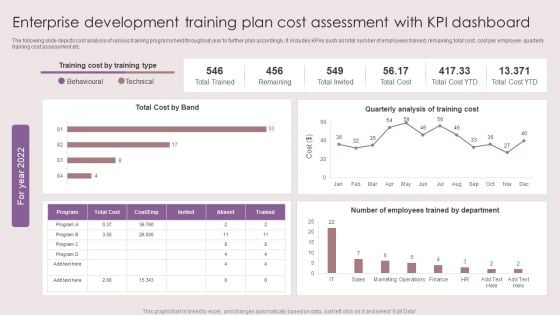
Enterprise Development Training Plan Cost Assessment With KPI Dashboard Mockup PDF
The following slide depicts cost analysis of various training programs held throughout year to further plan accordingly. It includes KPAs such as total number of employees trained, remaining, total cost, cost per employee, quarterly training cost assessment etc. Showcasing this set of slides titled Enterprise Development Training Plan Cost Assessment With KPI Dashboard Mockup PDF. The topics addressed in these templates are Total Cost Band, Quarterly Analysis, Training Cost. All the content presented in this PPT design is completely editable. Download it and make adjustments in color, background, font etc. as per your unique business setting.
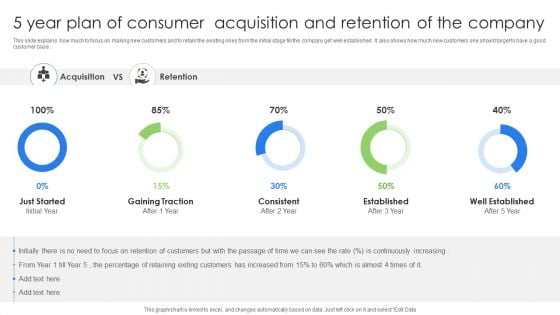
5 Year Plan Of Consumer Acquisition And Retention Of The Company Formats PDF
This slide explains how much to focus on making new customers and to retain the existing ones from the initial stage till the company get well established . It also shows how much new customers one should target to have a good customer base. Showcasing this set of slides titled 5 Year Plan Of Consumer Acquisition And Retention Of The Company Formats PDF. The topics addressed in these templates are Gaining Traction, Established, Well Established. All the content presented in this PPT design is completely editable. Download it and make adjustments in color, background, font etc. as per your unique business setting.
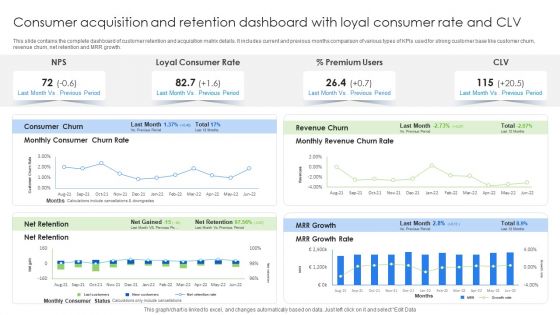
Consumer Acquisition And Retention Dashboard With Loyal Consumer Rate And CLV Brochure PDF
This slide contains the complete dashboard of customer retention and acquisition matrix details. It includes current and previous months comparison of various types of KPIs used for strong customer base like customer churn, revenue churn, net retention and MRR growth. Showcasing this set of slides titled Consumer Acquisition And Retention Dashboard With Loyal Consumer Rate And CLV Brochure PDF. The topics addressed in these templates are Consumer Churn, Revenue Churn, Premium Users. All the content presented in this PPT design is completely editable. Download it and make adjustments in color, background, font etc. as per your unique business setting.
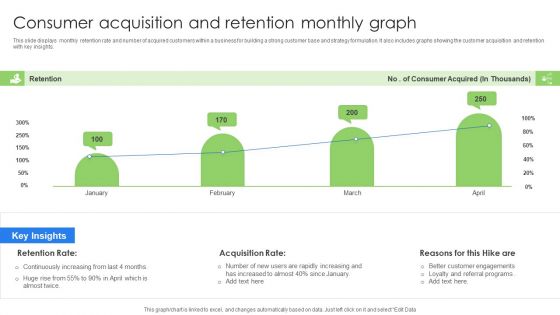
Consumer Acquisition And Retention Monthly Graph Background PDF
This slide displays monthly retention rate and number of acquired customers within a business for building a strong customer base and strategy formulation. It also includes graphs showing the customer acquisition and retention with key insights. Pitch your topic with ease and precision using this Consumer Acquisition And Retention Monthly Graph Background PDF. This layout presents information on Consumer Acquisition, Retention Monthly Graph. It is also available for immediate download and adjustment. So, changes can be made in the color, design, graphics or any other component to create a unique layout.
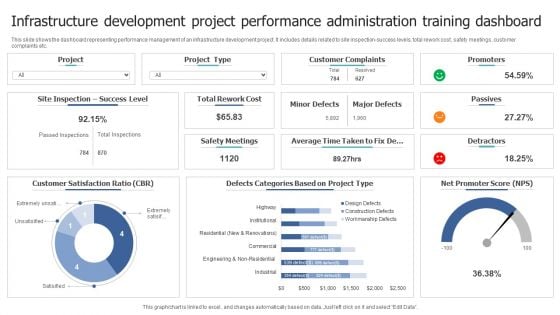
Infrastructure Development Project Performance Administration Training Dashboard Professional PDF
This slide shows the dashboard representing performance management of an infrastructure development project. It includes details related to site inspection success levels, total rework cost, safety meetings, customer complaints etc. Showcasing this set of slides titled Infrastructure Development Project Performance Administration Training Dashboard Professional PDF. The topics addressed in these templates are Customer Satisfaction Ratio, Customer Complaints, Rework Cost. All the content presented in this PPT design is completely editable. Download it and make adjustments in color, background, font etc. as per your unique business setting.
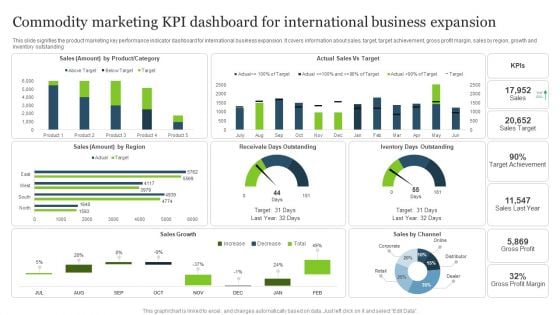
Commodity Marketing KPI Dashboard For International Business Expansion Formats PDF
This slide signifies the product marketing key performance indicator dashboard for international business expansion. It covers information about sales, target, target achievement, gross profit margin, sales by region, growth and inventory outstanding.Pitch your topic with ease and precision using this Commodity Marketing KPI Dashboard For International Business Expansion Formats PDF. This layout presents information on Target Achievement, Receivale Days, Gross Profit. It is also available for immediate download and adjustment. So, changes can be made in the color, design, graphics or any other component to create a unique layout.
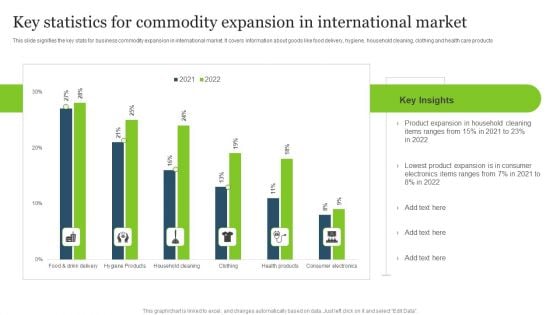
Key Statistics For Commodity Expansion In International Market Pictures PDF
This slide signifies the key stats for business commodity expansion in international market. It covers information about goods like food delivery, hygiene, household cleaning, clothing and health care products.Pitch your topic with ease and precision using this Key Statistics For Commodity Expansion In International Market Pictures PDF. This layout presents information on Product Expansion, Household Cleaning, Items Ranges. It is also available for immediate download and adjustment. So, changes can be made in the color, design, graphics or any other component to create a unique layout.
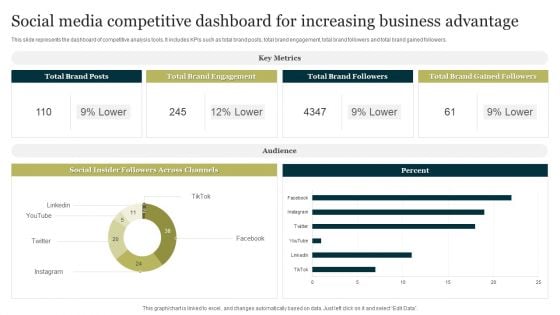
Social Media Competitive Dashboard For Increasing Business Advantage Portrait PDF
This slide represents the dashboard of competitive analysis tools. It includes KPIs such as total brand posts, total brand engagement, total brand followers and total brand gained followers. Pitch your topic with ease and precision using this Social Media Competitive Dashboard For Increasing Business Advantage Portrait PDF. This layout presents information on Social Media Competitive Dashboard, Increasing Business Advantage. It is also available for immediate download and adjustment. So, changes can be made in the color, design, graphics or any other component to create a unique layout.
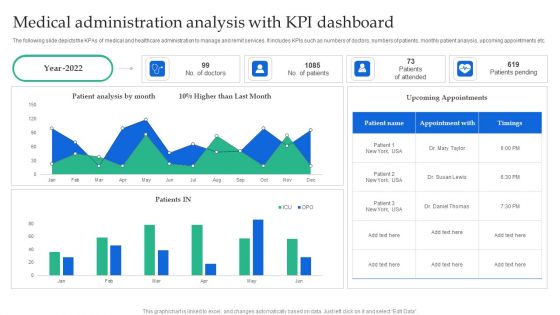
Medical Administration Analysis With KPI Dashboard Clipart PDF
The following slide depicts the KPAs of medical and healthcare administration to manage and remit services. It includes KPIs such as numbers of doctors, numbers of patients, monthly patient analysis, upcoming appointments etc. Showcasing this set of slides titled Medical Administration Analysis With KPI Dashboard Clipart PDF. The topics addressed in these templates are Patient Analysis, Higher Than, Upcoming Appointments. All the content presented in this PPT design is completely editable. Download it and make adjustments in color, background, font etc. as per your unique business setting.
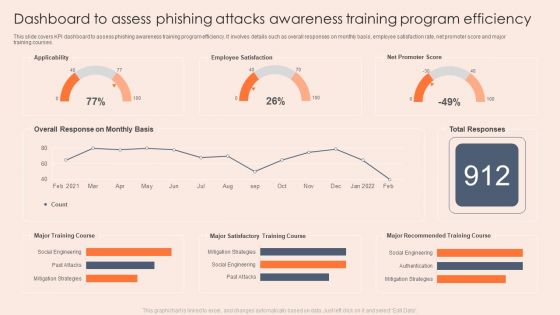
Dashboard To Assess Phishing Attacks Awareness Training Program Efficiency Professional PDF
This slide covers KPI dashboard to assess phishing awareness training program efficiency. It involves details such as overall responses on monthly basis, employee satisfaction rate, net promoter score and major training courses. Showcasing this set of slides titled Dashboard To Assess Phishing Attacks Awareness Training Program Efficiency Professional PDF. The topics addressed in these templates are Applicability, Employee Satisfaction, Mitigation Strategies. All the content presented in this PPT design is completely editable. Download it and make adjustments in color, background, font etc. as per your unique business setting.
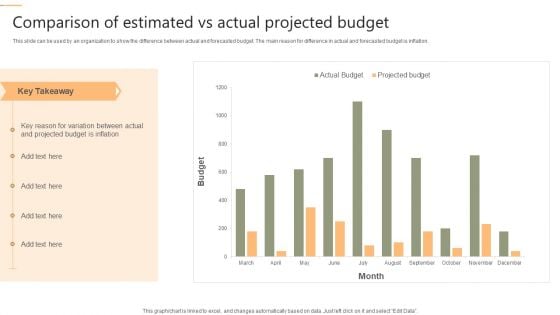
Comparison Of Estimated Vs Actual Projected Budget Download PDF
This slide can be used by an organization to show the difference between actual and forecasted budget. The main reason for difference in actual and forecasted budget is inflation. Showcasing this set of slides titled Comparison Of Estimated Vs Actual Projected Budget Download PDF. The topics addressed in these templates are Comparison Of Estimated, Actual Projected Budget. All the content presented in this PPT design is completely editable. Download it and make adjustments in color, background, font etc. as per your unique business setting.
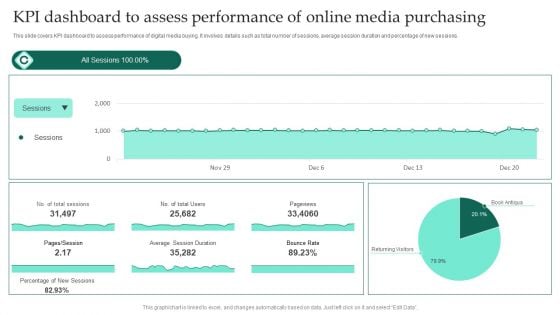
KPI Dashboard To Assess Performance Of Online Media Purchasing Ppt Professional Grid PDF
This slide covers KPI dashboard to assess performance of digital media buying. It involves details such as total number of sessions, average session duration and percentage of new sessions. Showcasing this set of slides titled KPI Dashboard To Assess Performance Of Online Media Purchasing Ppt Professional Grid PDF. The topics addressed in these templates are Average Session Duration, Bounce Rate, Pageviews. All the content presented in this PPT design is completely editable. Download it and make adjustments in color, background, font etc. as per your unique business setting.
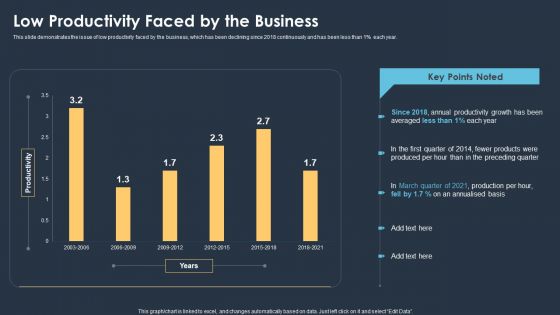
Six Sigma Methodologies For Process Optimization Low Productivity Faced By The Business Sample PDF
This slide demonstrates the issue of low productivity faced by the business, which has been declining since 2018 continuously and has been less than 1 percentage each year. Showcasing this set of slides titled Six Sigma Methodologies For Process Optimization Low Productivity Faced By The Business Sample PDF. The topics addressed in these templates are Annual Productivity Growth, Low Productivity Faced. All the content presented in this PPT design is completely editable. Download it and make adjustments in color, background, font etc. as per your unique business setting.
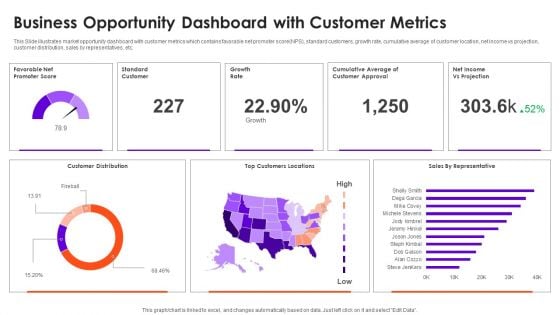
Business Opportunity Dashboard With Customer Metrics Information PDF
This Slide illustrates market opportunity dashboard with customer metrics which contains favorable net promoter score NPS, standard customers, growth rate, cumulative average of customer location, net income vs projection, customer distribution, sales by representatives, etc. Pitch your topic with ease and precision using this Business Opportunity Dashboard With Customer Metrics Information PDF. This layout presents information on Customer Distribution, Growth Rate, Top Customers Locations. It is also available for immediate download and adjustment. So, changes can be made in the color, design, graphics or any other component to create a unique layout.
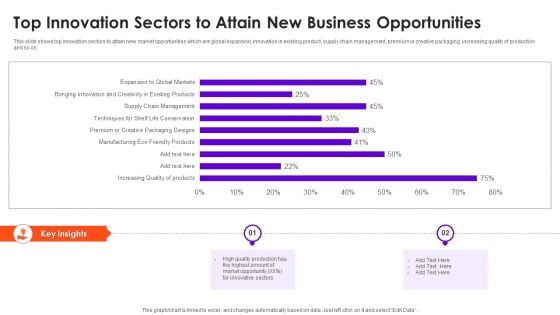
Top Innovation Sectors To Attain New Business Opportunities Information PDF
This slide shows top innovation sectors to attain new market opportunities which are global expansion, innovation in existing product, supply chain management, premium or creative packaging, increasing quality of production and so on. Showcasing this set of slides titled Top Innovation Sectors To Attain New Business Opportunities Information PDF. The topics addressed in these templates are Market Opportunity, Quality Production, Innovative Sectors. All the content presented in this PPT design is completely editable. Download it and make adjustments in color, background, font etc. as per your unique business setting.
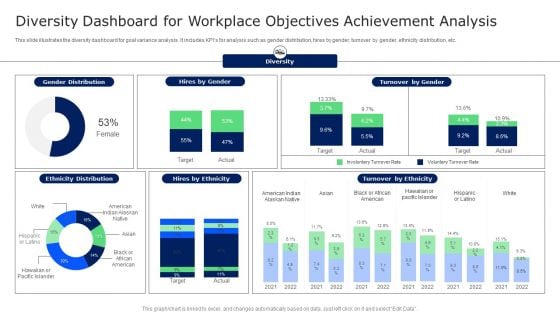
Diversity Dashboard For Workplace Objectives Achievement Analysis Microsoft PDF
This slide illustrates the diversity dashboard for goal variance analysis. It includes KPIs for analysis such as gender distribution, hires by gender, turnover by gender, ethnicity distribution, etc. Showcasing this set of slides titled Diversity Dashboard For Workplace Objectives Achievement Analysis Microsoft PDF. The topics addressed in these templates are Target, Involuntary Turnover Rate, Turnover By Ethnicity. All the content presented in this PPT design is completely editable. Download it and make adjustments in color, background, font etc. as per your unique business setting.
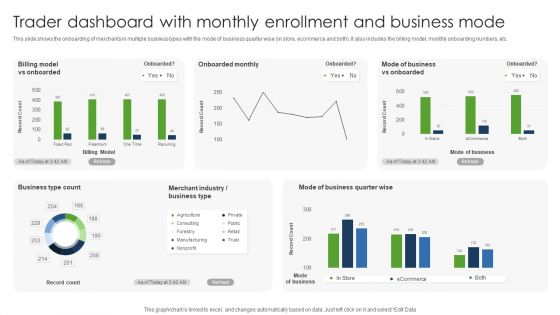
Trader Dashboard With Monthly Enrollment And Business Mode Professional PDF
This slide shows the onboarding of merchants in multiple business types with the mode of business quarter wise in store, ecommerce and both. It also includes the billing model, monthly onboarding numbers, etc. Showcasing this set of slides titled Trader Dashboard With Monthly Enrollment And Business Mode Professional PDF. The topics addressed in these templates are Monthly Enrollment, Business Mode, Trader Dashboard. All the content presented in this PPT design is completely editable. Download it and make adjustments in color, background, font etc. as per your unique business setting.
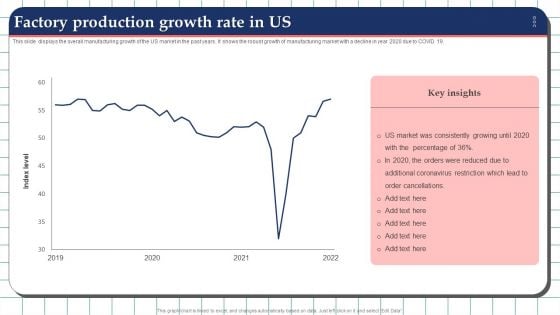
Factory Production Growth Rate In Us Graphics PDF
This slide displays the overall manufacturing growth of the US market in the past years. It shows the robust growth of manufacturing market with a decline in year 2020 due to COVID 19. Showcasing this set of slides titled Factory Production Growth Rate In Us Graphics PDF. The topics addressed in these templates are Factory Production Growth Rate, Market. All the content presented in this PPT design is completely editable. Download it and make adjustments in color, background, font etc. as per your unique business setting.
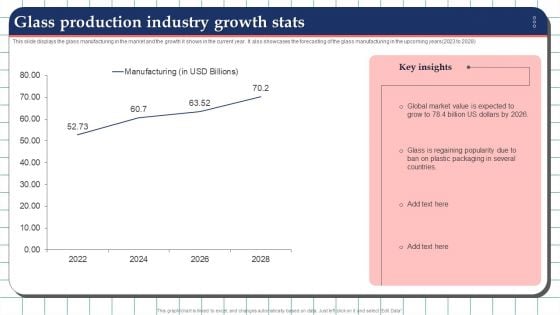
Glass Production Industry Growth Stats Graphics PDF
This slide displays the glass manufacturing in the market and the growth it shows in the current year. It also showcases the forecasting of the glass manufacturing in the upcoming years 2023 to 2028. Pitch your topic with ease and precision using this Glass Production Industry Growth Stats Graphics PDF. This layout presents information on Global Market Value, Glass Production Industry Growth. It is also available for immediate download and adjustment. So, changes can be made in the color, design, graphics or any other component to create a unique layout.
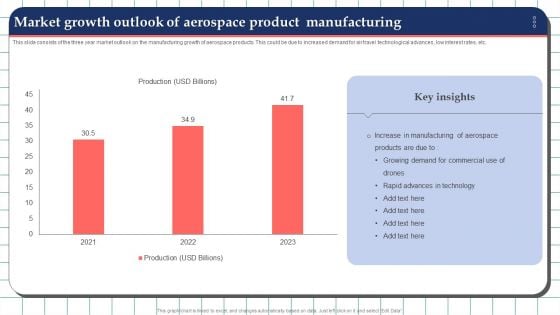
Market Growth Outlook Of Aerospace Product Manufacturing Sample PDF
This slide consists of the three year market outlook on the manufacturing growth of aerospace products. This could be due to increased demand for air travel technological advances, low interest rates, etc. Pitch your topic with ease and precision using this Market Growth Outlook Of Aerospace Product Manufacturing Sample PDF. This layout presents information on Manufacturing, Products, Demand, Commercial. It is also available for immediate download and adjustment. So, changes can be made in the color, design, graphics or any other component to create a unique layout.
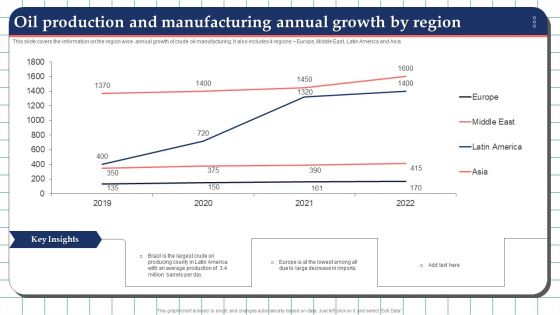
Oil Production And Manufacturing Annual Growth By Region Graphics PDF
This slide covers the information on the region wise. annual growth of crude oil manufacturing. It also includes 4 regions Europe, Middle East, Latin America and Asia. Pitch your topic with ease and precision using this Oil Production And Manufacturing Annual Growth By Region Graphics PDF. This layout presents information on Average Production, Manufacturing Annual Growth. It is also available for immediate download and adjustment. So, changes can be made in the color, design, graphics or any other component to create a unique layout.
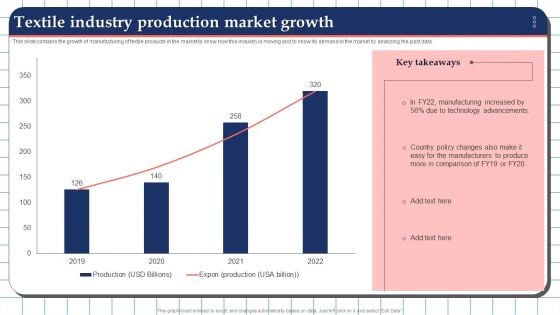
Textile Industry Production Market Growth Elements PDF
This slide contains the growth of manufacturing of textile products in the market to know how this industry is moving and to know its demand in the market by analyzing the past data. Showcasing this set of slides titled Textile Industry Production Market Growth Elements PDF. The topics addressed in these templates are Manufacturers, Technology Advancements, Production Market Growth. All the content presented in this PPT design is completely editable. Download it and make adjustments in color, background, font etc. as per your unique business setting.
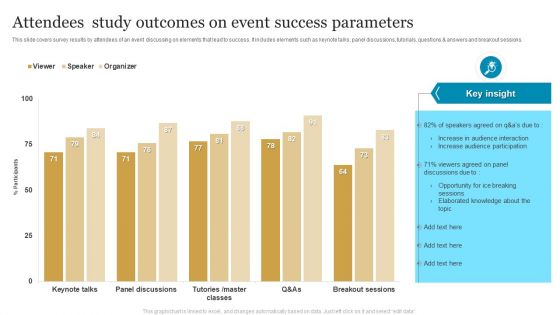
Attendees Study Outcomes On Event Success Parameters Ideas PDF
This slide covers survey results by attendees of an event discussing on elements that lead to success. It includes elements such as keynote talks, panel discussions, tutorials, questions And answers and breakout sessions. Showcasing this set of slides titled Attendees Study Outcomes On Event Success Parameters Ideas PDF. The topics addressed in these templates are Opportunity, Event Success Parameters, Attendees Study Outcomes. All the content presented in this PPT design is completely editable. Download it and make adjustments in color, background, font etc. as per your unique business setting.
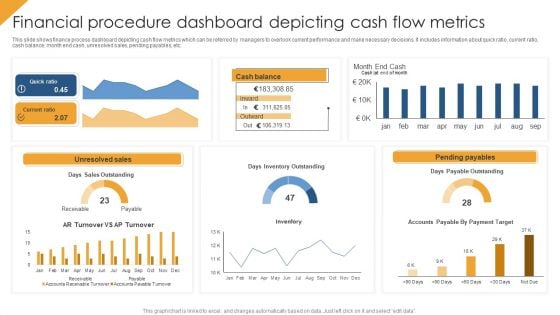
Financial Procedure Dashboard Depicting Cash Flow Metrics Structure PDF
This slide shows finance process dashboard depicting cash flow metrics which can be referred by managers to overlook current performance and make necessary decisions. It includes information about quick ratio, current ratio, cash balance, month end cash, unresolved sales, pending payables, etc. Pitch your topic with ease and precision using this Financial Procedure Dashboard Depicting Cash Flow Metrics Structure PDF. This layout presents information on Quick Ratio, Unresolved Sales, Pending Payables. It is also available for immediate download and adjustment. So, changes can be made in the color, design, graphics or any other component to create a unique layout.
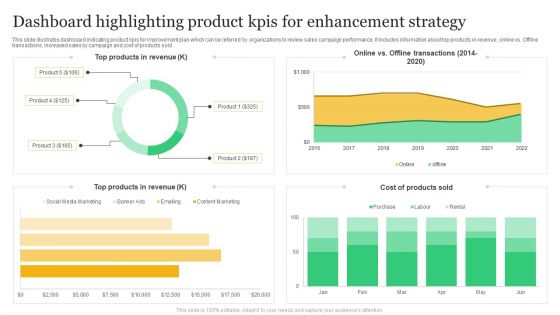
Dashboard Highlighting Product Kpis For Enhancement Strategy Structure PDF
This slide illustrates dashboard indicating product kpis for improvement plan which can be referred by organizations to review sales campaign performance. It includes information about top products in revenue, online vs. Offline transactions, increased sales by campaign and cost of products sold. Showcasing this set of slides titled Dashboard Highlighting Product Kpis For Enhancement Strategy Structure PDF. The topics addressed in these templates are Revenue, Products, Cost. All the content presented in this PPT design is completely editable. Download it and make adjustments in color, background, font etc. as per your unique business setting.
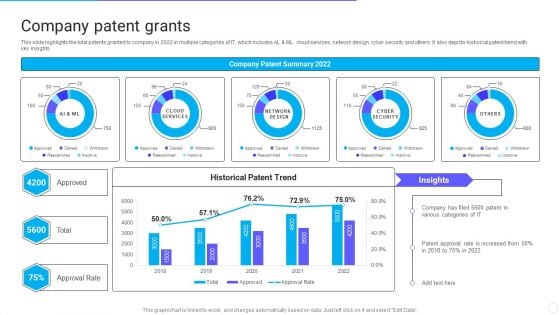
IT Application Services Company Outline Company Patent Grants Introduction PDF
This slide highlights the total patents granted to company in 2022 in multiple categories of IT, which includes AL and ML. cloud services, network design, cyber security and others. It also depicts historical patent trend with key insights. Deliver an awe inspiring pitch with this creative IT Application Services Company Outline Company Patent Grants Introduction PDF bundle. Topics like Approval Rate, Company Patent Grants can be discussed with this completely editable template. It is available for immediate download depending on the needs and requirements of the user.
Company Financials Performance Tracking Dashboard Brochure PDF
This slide illustrates KPI dashboard that can be used by organizations to track their financial performance on company basis. Kpis covered in the slide are contract status, revenue, cost of goods, overdue and task status. Showcasing this set of slides titled Company Financials Performance Tracking Dashboard Brochure PDF. The topics addressed in these templates are Report Shortcut, Revenue Cost, Overdue Task. All the content presented in this PPT design is completely editable. Download it and make adjustments in color, background, font etc. as per your unique business setting.
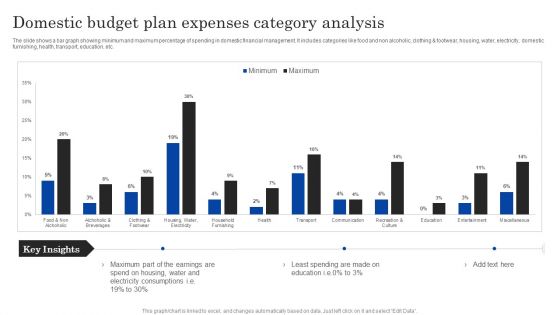
Domestic Budget Plan Expenses Category Analysis Ppt PowerPoint Presentation Layouts Inspiration PDF
The slide shows a bar graph showing minimum and maximum percentage of spending in domestic financial management. It includes categories like food and non alcoholic, clothing and footwear, housing, water, electricity, domestic furnishing, health, transport, education, etc.Showcasing this set of slides titled Domestic Budget Plan Expenses Category Analysis Ppt PowerPoint Presentation Layouts Inspiration PDF. The topics addressed in these templates are Part Earnings, Electricity Consumptions, Least Spending. All the content presented in this PPT design is completely editable. Download it and make adjustments in color, background, font etc. as per your unique business setting.

Domestic Budget Plan Income And Expenditure Analysis Dashboard Ppt PowerPoint Presentation Layouts Clipart Images PDF
The slide presents a dashboard to analyze and monitor income and expenses for formulating savings plan. It includes income, expenses, savings, top five expenses and unplanned expenses.Pitch your topic with ease and precision using this Domestic Budget Plan Income And Expenditure Analysis Dashboard Ppt PowerPoint Presentation Layouts Clipart Images PDF. This layout presents information on Unplanned Expenses, Expenses, Key Metrics. It is also available for immediate download and adjustment. So, changes can be made in the color, design, graphics or any other component to create a unique layout.
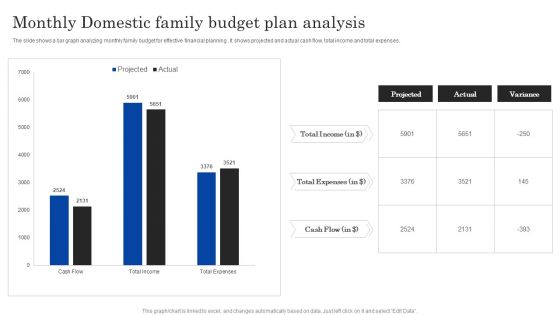
Monthly Domestic Family Budget Plan Analysis Ppt PowerPoint Presentation Portfolio Guide PDF
The slide shows a bar graph analyzing monthly family budget for effective financial planning . It shows projected and actual cash flow, total income and total expenses.Showcasing this set of slides titled Monthly Domestic Family Budget Plan Analysis Ppt PowerPoint Presentation Portfolio Guide PDF. The topics addressed in these templates are Total Income, Total Expenses, Cash Flow. All the content presented in this PPT design is completely editable. Download it and make adjustments in color, background, font etc. as per your unique business setting.
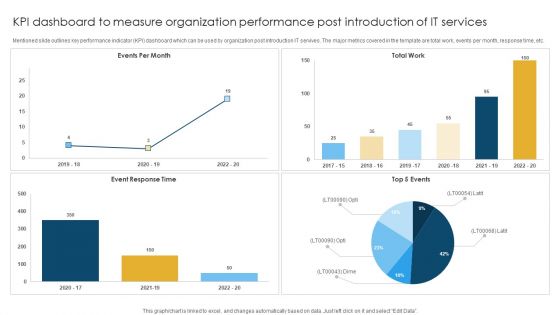
KPI Dashboard To Measure Organization Performance Post Introduction Of IT Services Rules PDF
Mentioned slide outlines key performance indicator KPI dashboard which can be used by organization post introduction IT servives. The major metrics covered in the template are total work, events per month, response time, etc. Showcasing this set of slides titled KPI Dashboard To Measure Organization Performance Post Introduction Of IT Services Rules PDF. The topics addressed in these templates are Event Response, Total Work, Events Per. All the content presented in this PPT design is completely editable. Download it and make adjustments in color, background, font etc. as per your unique business setting.
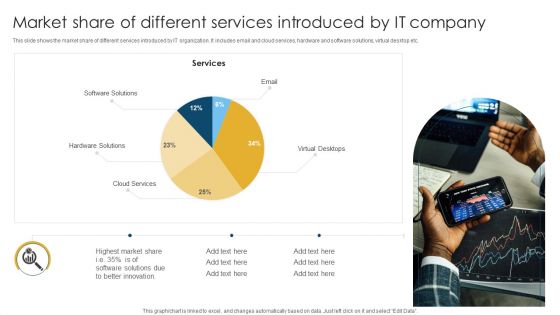
Market Share Of Different Services Introduced By IT Company Download PDF
This slide shows the market share of different services introduced by IT organization. It includes email and cloud services, hardware and software solutions, virtual desktop etc. Pitch your topic with ease and precision using this Market Share Of Different Services Introduced By IT Company Download PDF. This layout presents information on Software Solutions, Hardware Solutions, Highest Market. It is also available for immediate download and adjustment. So, changes can be made in the color, design, graphics or any other component to create a unique layout.
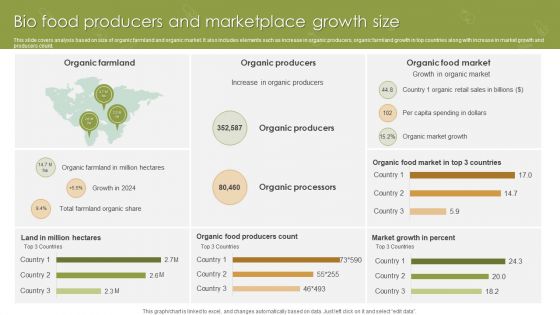
Bio Food Producers And Marketplace Growth Size Ppt Outline Layouts PDF
This slide covers analysis based on size of organic farmland and organic market. It also includes elements such as increase in organic producers, organic farmland growth in top countries along with increase in market growth and producers count. Pitch your topic with ease and precision using this Bio Food Producers And Marketplace Growth Size Ppt Outline Layouts PDF. This layout presents information on Organic Farmland, Organic Producers, Organic Food Market. It is also available for immediate download and adjustment. So, changes can be made in the color, design, graphics or any other component to create a unique layout.
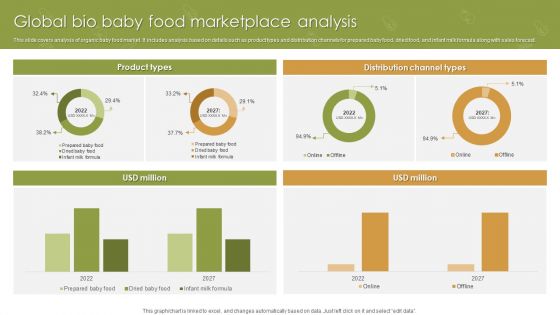
Global Bio Baby Food Marketplace Analysis Ppt Ideas Gallery PDF
This slide covers analysis of organic baby food market. It includes analysis based on details such as product types and distribution channels for prepared baby food, dried food, and infant milk formula along with sales forecast. Pitch your topic with ease and precision using this Global Bio Baby Food Marketplace Analysis Ppt Ideas Gallery PDF. This layout presents information on Product Types, Distribution Channel Types, USD Million. It is also available for immediate download and adjustment. So, changes can be made in the color, design, graphics or any other component to create a unique layout.
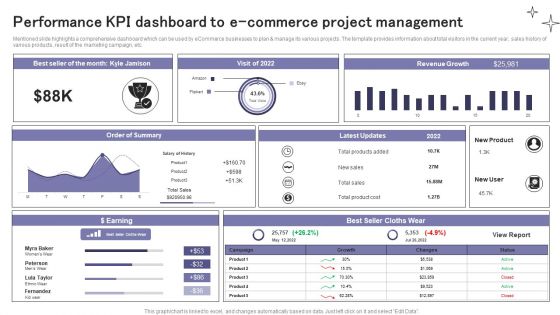
Performance KPI Dashboard To E Commerce Project Management Ppt Summary Inspiration PDF
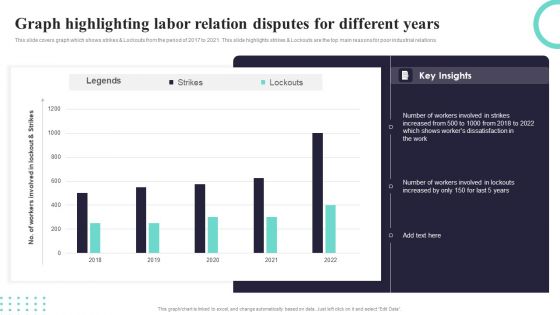
Graph Highlighting Labor Relation Disputes For Different Years Ppt PowerPoint Presentation Gallery Sample PDF
This slide covers graph which shows strikes and Lockouts from the period of 2017 to 2021. This slide highlights strikes and Lockouts are the top main reasons for poor industrial relations. Showcasing this set of slides titled Graph Highlighting Labor Relation Disputes For Different Years Ppt PowerPoint Presentation Gallery Sample PDF. The topics addressed in these templates are Legends, Strikes, Lockouts. All the content presented in this PPT design is completely editable. Download it and make adjustments in color, background, font etc. as per your unique business setting.
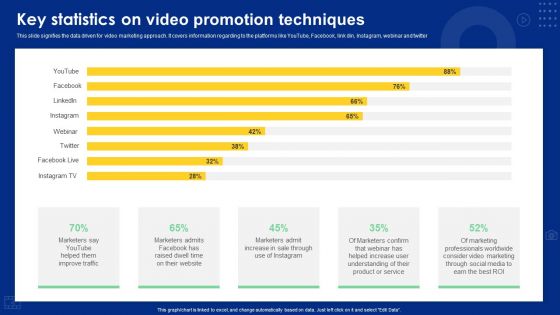
Key Statistics On Video Promotion Techniques Ppt Slides Example Introduction PDF
This slide signifies the data driven for video marketing approach. It covers information regarding to the platforms like YouTube, Facebook, link din, Instagram, webinar and twitter. Showcasing this set of slides titled Key Statistics On Video Promotion Techniques Ppt Slides Example Introduction PDF. The topics addressed in these templates are Marketers Say Youtube, Sale Through, Product Or Service. All the content presented in this PPT design is completely editable. Download it and make adjustments in color, background, font etc. as per your unique business setting.
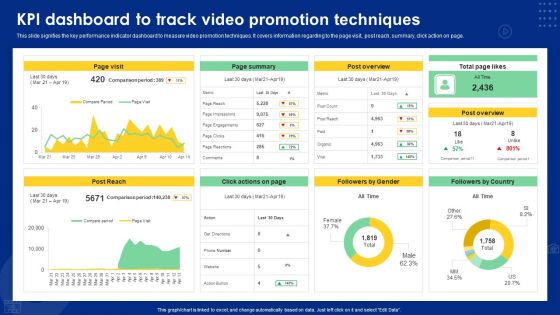
Kpi Dashboard To Track Video Promotion Techniques Ppt Summary Guide PDF
This slide signifies the key performance indicator dashboard to measure video promotion techniques. It covers information regarding to the page visit, post reach, summary, click action on page. Pitch your topic with ease and precision using this Kpi Dashboard To Track Video Promotion Techniques Ppt Summary Guide PDF. This layout presents information on Page Visit, Page Summary, Post Overview. It is also available for immediate download and adjustment. So, changes can be made in the color, design, graphics or any other component to create a unique layout.
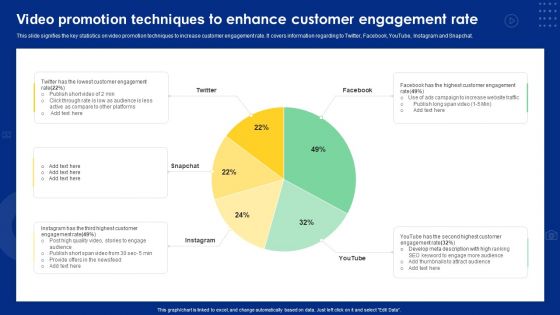
Video Promotion Techniques To Enhance Customer Engagement Rate Ppt Portfolio Images PDF
This slide signifies the key statistics on video promotion techniques to increase customer engagement rate. It covers information regarding to Twitter, Facebook, YouTube, Instagram and Snapchat. Pitch your topic with ease and precision using this Video Promotion Techniques To Enhance Customer Engagement Rate Ppt Portfolio Images PDF. This layout presents information on Facebook, Snapchat, Instagram, YouTube. It is also available for immediate download and adjustment. So, changes can be made in the color, design, graphics or any other component to create a unique layout.
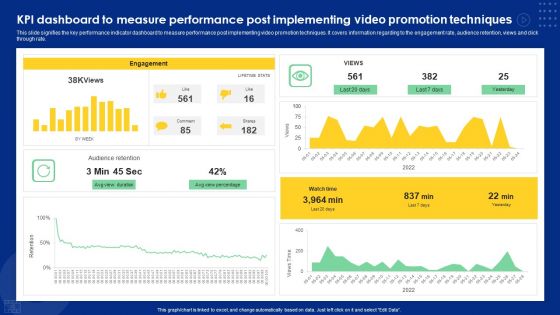
KPI Dashboard To Measure Performance Post Implementing Video Promotion Techniques Ideas PDF
This slide signifies the key performance indicator dashboard to measure performance post implementing video promotion techniques. It covers information regarding to the engagement rate, audience retention, views and click through rate. Pitch your topic with ease and precision using this KPI Dashboard To Measure Performance Post Implementing Video Promotion Techniques Ideas PDF. This layout presents information on Engagement, Audience Retention, Watch Time. It is also available for immediate download and adjustment. So, changes can be made in the color, design, graphics or any other component to create a unique layout.
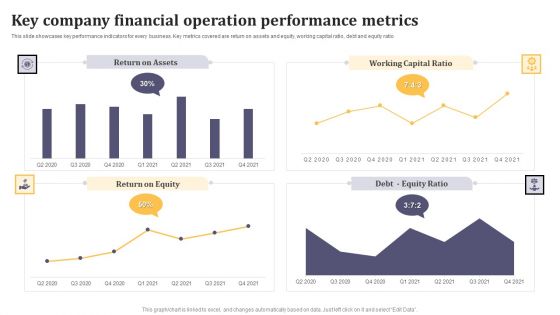
Key Company Financial Operation Performance Metrics Ppt Infographic Template Example Introduction PDF
This slide showcases key performance indicators for every business. Key metrics covered are return on assets and equity, working capital ratio, debt and equity ratio. Showcasing this set of slides titled Key Company Financial Operation Performance Metrics Ppt Infographic Template Example Introduction PDF. The topics addressed in these templates are Return on Assets, Working Capital Ratio, Return on Equity. All the content presented in this PPT design is completely editable. Download it and make adjustments in color, background, font etc. as per your unique business setting.
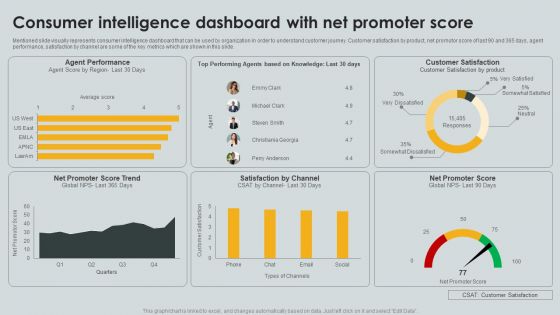
Consumer Intelligence Dashboard With Net Promoter Score Ppt PowerPoint Presentation File Templates PDF
Mentioned slide visually represents consumer intelligence dashboard that can be used by organization in order to understand customer journey. Customer satisfaction by product, net promotor score of last 90 and 365 days, agent performance, satisfaction by channel are some of the key metrics which are shown in this slide. Showcasing this set of slides titled Consumer Intelligence Dashboard With Net Promoter Score Ppt PowerPoint Presentation File Templates PDF. The topics addressed in these templates are Agent Performance, Satisfaction Channel, Net Promoter. All the content presented in this PPT design is completely editable. Download it and make adjustments in color, background, font etc. as per your unique business setting.
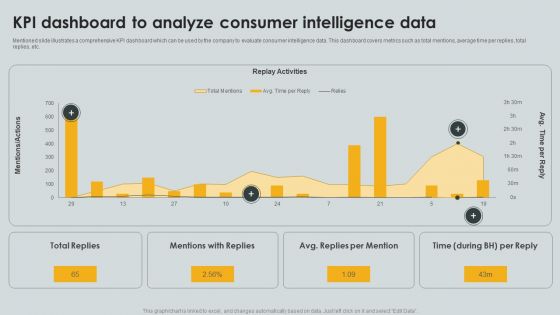
KPI Dashboard To Analyze Consumer Intelligence Data Ppt PowerPoint Presentation File Portfolio PDF
Mentioned slide illustrates a comprehensive KPI dashboard which can be used by the company to evaluate consumer intelligence data. This dashboard covers metrics such as total mentions, average time per replies, total replies, etc. Pitch your topic with ease and precision using this KPI Dashboard To Analyze Consumer Intelligence Data Ppt PowerPoint Presentation File Portfolio PDF. This layout presents information on Replay Activities, Total Replies, Mentions Replies. It is also available for immediate download and adjustment. So, changes can be made in the color, design, graphics or any other component to create a unique layout.
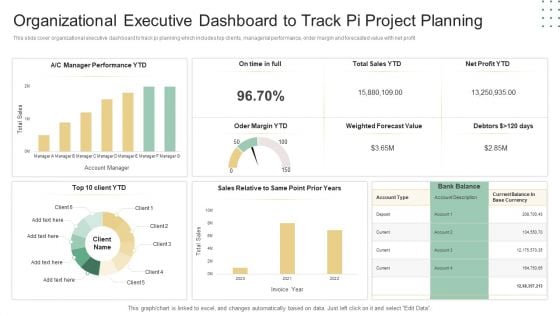
Organizational Executive Dashboard To Track Pi Project Planning Ppt Professional Background PDF
This slide cover organizational executive dashboard to track pi planning which includes top clients, managerial performance, order margin and forecasted value with net profit. Pitch your topic with ease and precision using this Organizational Executive Dashboard To Track Pi Project Planning Ppt Professional Background PDF. This layout presents information on Weighted Forecast Value, Top 10, Client YTD. It is also available for immediate download and adjustment. So, changes can be made in the color, design, graphics or any other component to create a unique layout.

Product Procurement Management Dashboard With Defect Rate Supplier Availability And Lead Time Pictures PDF
This slide shows a dashboard of procurement to provide real time information about various components. It includes defect rate, on time supplies , supplier availability and lead time. Showcasing this set of slides titled Product Procurement Management Dashboard With Defect Rate Supplier Availability And Lead Time Pictures PDF. The topics addressed in these templates are Supplier Defect Rate, Supplier Availability, Lead Time. All the content presented in this PPT design is completely editable. Download it and make adjustments in color, background, font etc. as per your unique business setting.
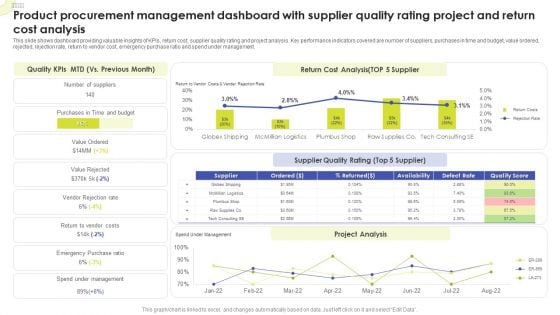
Product Procurement Management Dashboard With Supplier Quality Rating Project And Return Cost Analysis Sample PDF
This slide shows dashboard providing valuable insights of KPIs, return cost, supplier quality rating and project analysis. Key performance indicators covered are number of suppliers, purchases in time and budget, value ordered, rejected, rejection rate, return to vendor cost, emergency purchase ratio and spend under management. Pitch your topic with ease and precision using this Product Procurement Management Dashboard With Supplier Quality Rating Project And Return Cost Analysis Sample PDF. This layout presents information on Quality KPIs, Return Cost Analysis, Supplier Quality Rating. It is also available for immediate download and adjustment. So, changes can be made in the color, design, graphics or any other component to create a unique layout.
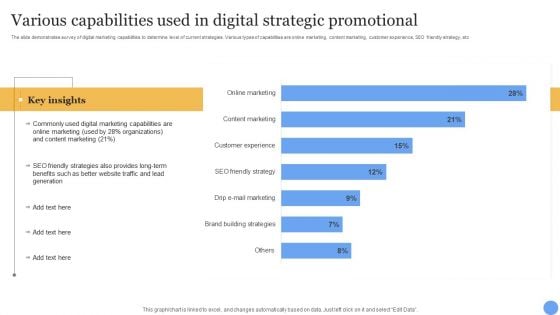
Various Capabilities Used In Digital Strategic Promotional Topics PDF
The slide demonstrates survey of digital marketing capabilities to determine level of current strategies. Various types of capabilities are online marketing, content marketing, customer experience, SEO friendly strategy, etc. Pitch your topic with ease and precision using this Various Capabilities Used In Digital Strategic Promotional Topics PDF. This layout presents information on Digital Marketing Capabilities, Content Marketing, Online Marketing. It is also available for immediate download and adjustment. So, changes can be made in the color, design, graphics or any other component to create a unique layout.
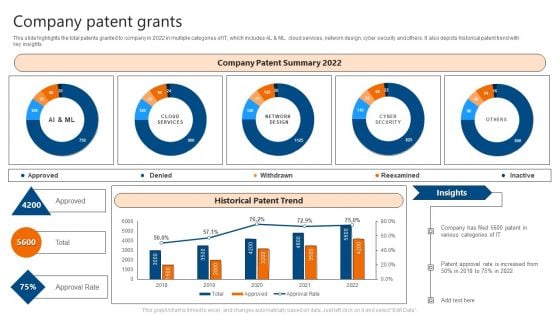
Company Patent Grants IT Software Development Company Profile Introduction PDF
This slide highlights the total patents granted to company in 2022 in multiple categories of IT, which includes AL and ML. cloud services, network design, cyber security and others. It also depicts historical patent trend with key insights. Deliver and pitch your topic in the best possible manner with this Company Patent Grants IT Software Development Company Profile Introduction PDF. Use them to share invaluable insights on Company Patent Summary, Historical Patent Trend and impress your audience. This template can be altered and modified as per your expectations. So, grab it now.
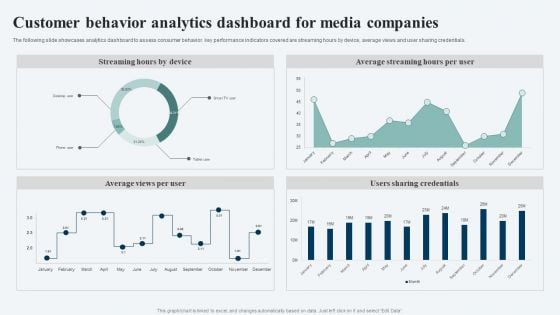
Customer Behavior Analytics Dashboard For Media Companies Ppt Ideas Visuals PDF
The following slide showcases analytics dashboard to assess consumer behavior. key performance indicators covered are streaming hours by device, average views and user sharing credentials. Showcasing this set of slides titled Customer Behavior Analytics Dashboard For Media Companies Ppt Ideas Visuals PDF. The topics addressed in these templates are Streaming Hours Device, Average Streaming Hours, Per User, Users Sharing Credentials. All the content presented in this PPT design is completely editable. Download it and make adjustments in color, background, font etc. as per your unique business setting.
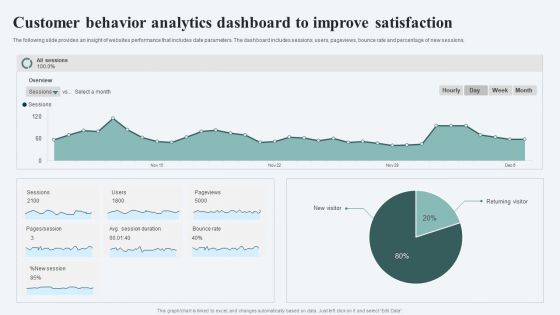
Customer Behavior Analytics Dashboard To Improve Satisfaction Ppt File Infographics PDF
The following slide provides an insight of websites performance that includes date parameters. The dashboard includes sessions, users, pageviews, bounce rate and percentage of new sessions. Pitch your topic with ease and precision using this Customer Behavior Analytics Dashboard To Improve Satisfaction Ppt File Infographics PDF. This layout presents information on Session, Avg Session Duration, Bounce Rate. It is also available for immediate download and adjustment. So, changes can be made in the color, design, graphics or any other component to create a unique layout.
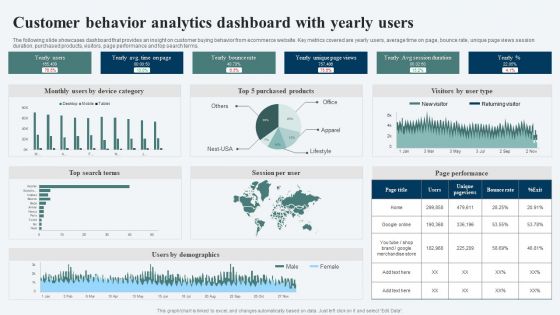
Customer Behavior Analytics Dashboard With Yearly Users Ppt Portfolio Ideas PDF
The following slide showcases dashboard that provides an insight on customer buying behavior from ecommerce website. Key metrics covered are yearly users, average time on page, bounce rate, unique page views session duration, purchased products, visitors, page performance and top search terms. Showcasing this set of slides titled Customer Behavior Analytics Dashboard With Yearly Users Ppt Portfolio Ideas PDF. The topics addressed in these templates are Yearly Users, Yearly Bounce Rate, Top Search Terms. All the content presented in this PPT design is completely editable. Download it and make adjustments in color, background, font etc. as per your unique business setting.
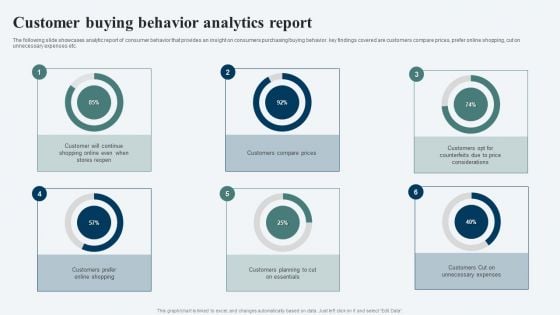
Customer Buying Behavior Analytics Report Ppt Inspiration Elements PDF
The following slide showcases analytic report of consumer behavior that provides an insight on consumers purchasing or buying behavior. key findings covered are customers compare prices, prefer online shopping, cut on unnecessary expenses etc. Pitch your topic with ease and precision using this Customer Buying Behavior Analytics Report Ppt Inspiration Elements PDF. This layout presents information on Customer Will, Continue Shopping, Stores Reopen, Customers Compare Prices. It is also available for immediate download and adjustment. So, changes can be made in the color, design, graphics or any other component to create a unique layout.


 Continue with Email

 Home
Home


