Euro
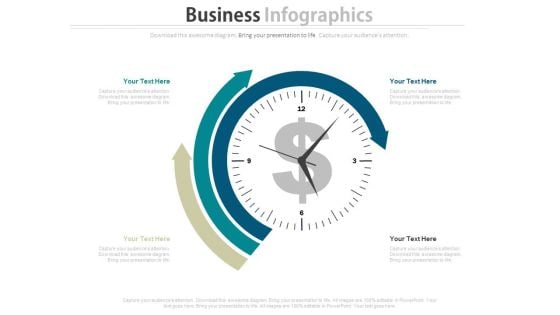
Dashboard Diagram For Finance And Strategic Analysis Powerpoint Slides
This PowerPoint template display graphics of clock with arrows around it and dollar symbol in center. You may use this PPT slide for financial and strategic analysis. This dashboard slide may useful for multilevel status report creation and approval process.
Colorful Cards With Icons For Technology Powerpoint Templates
This slide has been designed with graphics of colorful cards with icons of bulb, dollar, gear and magnifier. You may download this slide for financial analysis. Deliver amazing presentations to mesmerize your audience.
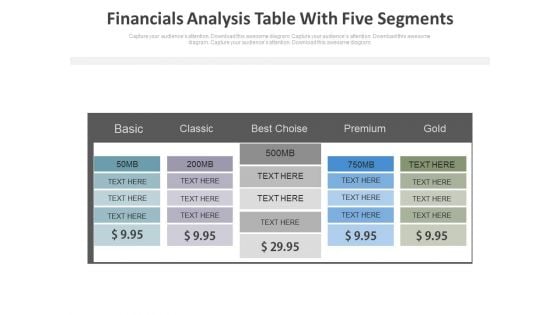
Five Steps Financial Analysis Table Powerpoint Slides
This PowerPoint template has been designed with dollar value pricing table chart. This PPT slide may be used for sample marketing proposal. Download this slide to build unique presentation.
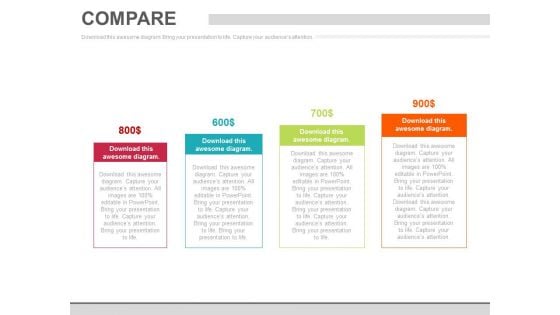
Four Steps Pricing Option Chart Powerpoint Slides
This PowerPoint template has been designed with dollar value pricing table chart. This PPT slide may be used for sample marketing proposal. Download this slide to build unique presentation.
Four Steps Pricing Table With Icons Powerpoint Slides
This PowerPoint template has been designed with dollar value pricing table chart. This PPT slide may be used for sample marketing proposal. Download this slide to build unique presentation.
Piggy Diagram For Financial Planning With Icons Powerpoint Slides
This PowerPoint template has been designed with graphics of piggy and dollar symbol. You may use this ppt slide to exhibit financial planning saving and investment. Download this template to leave permanent impression on your audience.
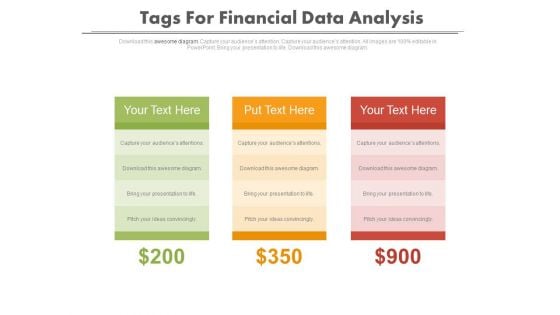
Tags For Financial Data Comparison Powerpoint Slides
Graphic of three text tag with dollar values has been used to design this power point template. This diagram may be used for financial data comparison. Use this diagram to build a professional presentation.

E Commerce Best Practices Applied From B2c To B2b Ppt Slides
This is a e commerce best practices applied from b2c to b2b ppt slides. This is a eight stage process. The stages in this process are login, success, shopping, dollar, search, open, new, shop.
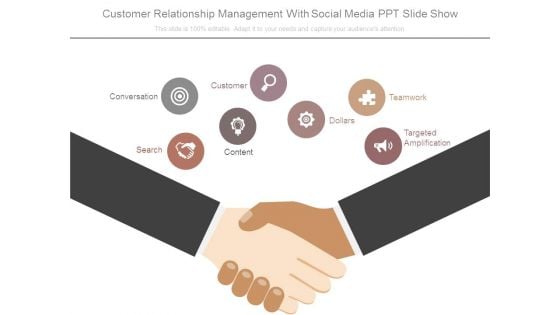
Customer Relationship Management With Social Media Ppt Slide Show
This is a customer relationship management with social media ppt slide show. This is a two stage process. The stages in this process are conversation, search, customer, content, dollars, teamwork, targeted amplification.
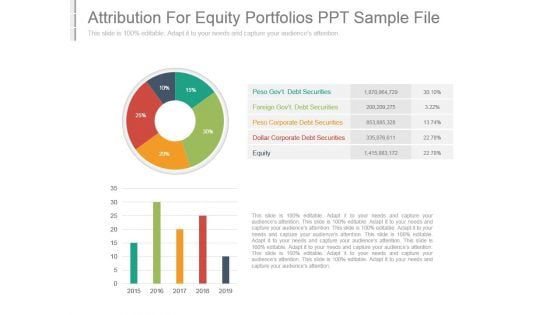
Attribution For Equity Portfolios Ppt Sample File
This is a attribution for equity portfolios ppt sample file. This is a five stage process. The stages in this process are peso govt debt securities, foreign govt debt securities, peso corporate debt securities, dollar corporate debt securities, equity.
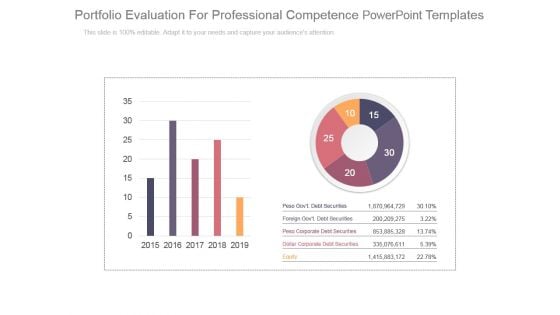
Portfolio Evaluation For Professional Competence Powerpoint Templates
This is a portfolio evaluation for professional competence powerpoint templates. This is a five stage process. The stages in this process are peso govt debt securities, foreign govt debt securities, peso corporate debt securities, dollar corporate debt securities, equity.
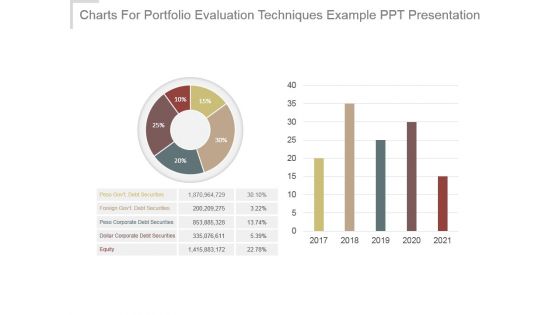
Charts For Portfolio Evaluation Techniques Example Ppt Presentation
This is a charts for portfolio evaluation techniques example ppt presentation. This is a five stage process. The stages in this process are peso govt debt securities, foreign govt debt securities, peso corporate debt securities, dollar corporate debt securities, equity.
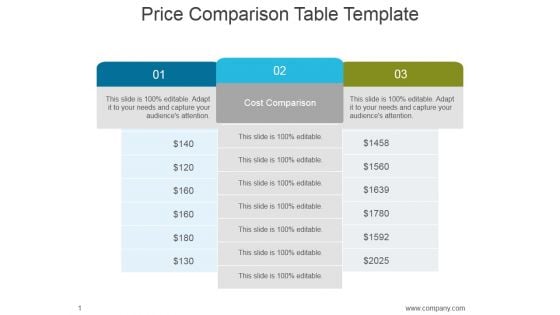
Price Comparison Table Template Ppt PowerPoint Presentation Summary
This is a price comparison table template ppt powerpoint presentation summary. This is a three stage process. The stages in this process are cost comparison, dollar, business, finance, price.
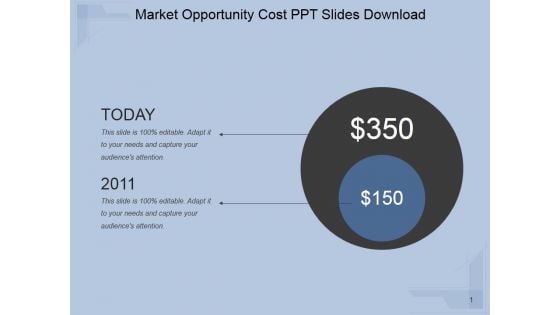
Market Opportunity Cost Ppt PowerPoint Presentation Example 2015
This is a market opportunity cost ppt powerpoint presentation example 2015. This is a two stage process. The stages in this process are today, year, time planning, dollar, symbol.
Target Board With Arrow For Financial Development Ppt PowerPoint Presentation Layouts
This is a target board with arrow for financial development ppt powerpoint presentation layouts. This is a one stage process. The stages in this process are target board, achievement, success, dollar, symbol.
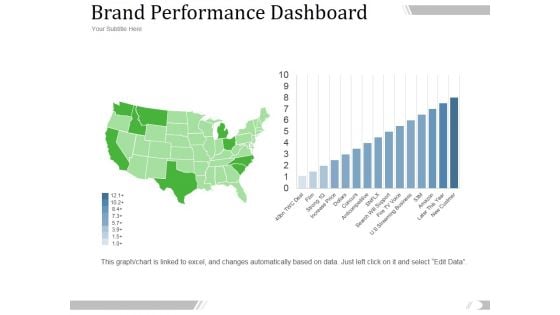
Brand Performance Dashboard Template 1 Ppt PowerPoint Presentation Inspiration
This is a brand performance dashboard template 1 ppt powerpoint presentation inspiration. This is a ten stage process. The stages in this process are new customer, film, dollars, amazon.

Portfolio Evaluation Template 1 Ppt PowerPoint Presentation Backgrounds
This is a portfolio evaluation template 1 ppt powerpoint presentation backgrounds. This is a five stage process. The stages in this process are annualized gross return, annualized standard deviation, portfolio, equity, dollar corporate debt securities, corporate debt securities.
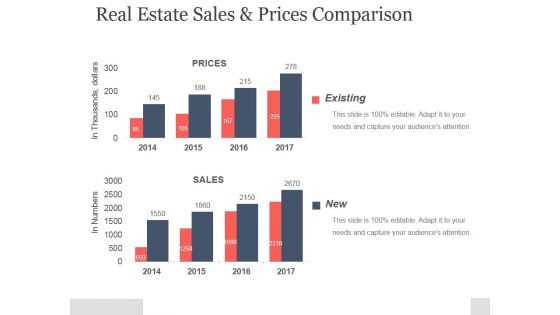
Real Estate Sales And Prices Comparison Ppt PowerPoint Presentation Example
This is a real estate sales and prices comparison ppt powerpoint presentation example. This is a two stage process. The stages in this process are existing, prices, sales, in thousands, dollars.
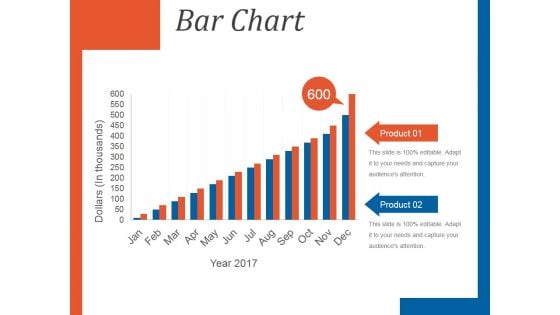
Bar Chart Template 1 Ppt PowerPoint Presentation Background Images
This is a bar chart template 1 ppt powerpoint presentation background images. This is a twelve stage process. The stages in this process are product, bar chart, dollars, year.
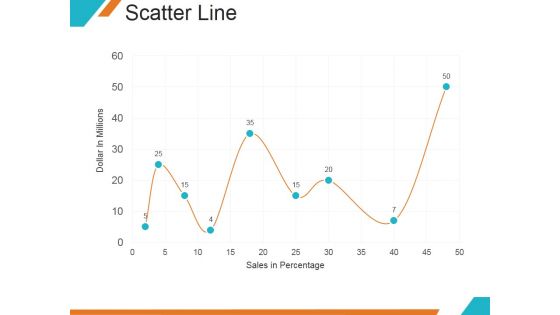
Scatter Line Ppt PowerPoint Presentation Backgrounds
This is a scatter line ppt powerpoint presentation backgrounds. This is a nine stage process. The stages in this process are dollar in millions, sales in percentage, graph, growth.
Scatter Line Ppt PowerPoint Presentation Icon Picture
This is a scatter line ppt powerpoint presentation icon picture. This is a nine stage process. The stages in this process are dollar in billions, sales in percentage, finance, management.
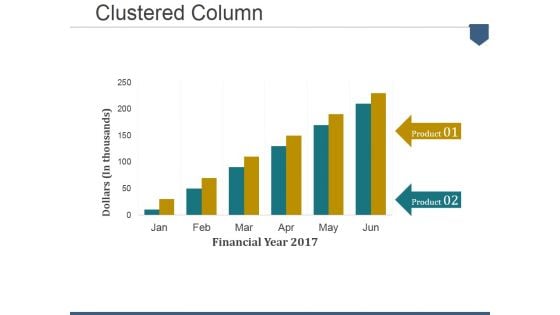
Clustered Column Ppt PowerPoint Presentation File Designs Download
This is a clustered column ppt powerpoint presentation file designs download. This is a six stage process. The stages in this process are dollars in thousands, financial year, product.
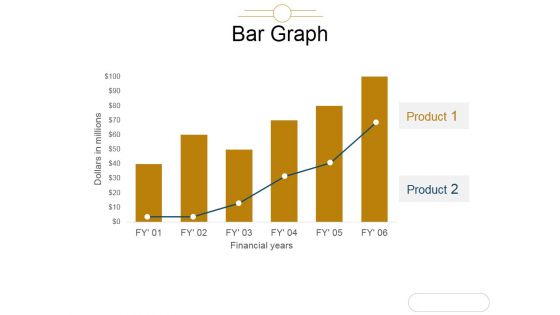
Bar Graph Ppt PowerPoint Presentation Model Graphic Tips
This is a bar graph ppt powerpoint presentation model graphic tips. This is a two stage process. The stages in this process are we are dollars in millions, financials years, bar graph, product, business.
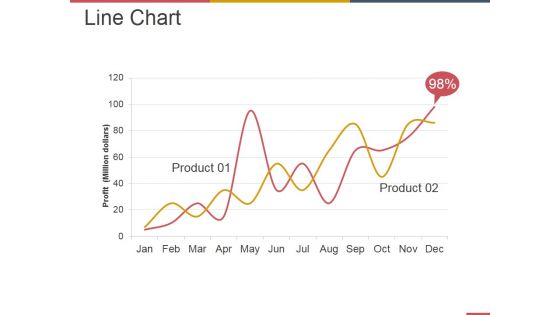
Line Chart Ppt PowerPoint Presentation Summary Information
This is a line chart ppt powerpoint presentation summary information. This is a two stage process. The stages in this process are business, strategy, marketing, analysis, profit million dollars.
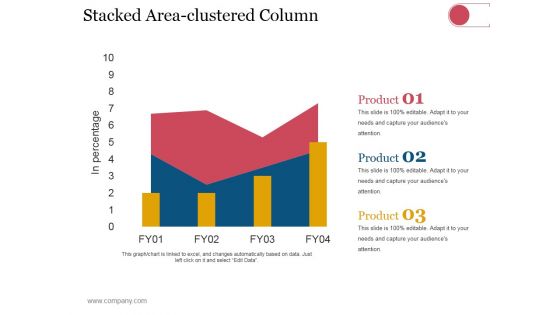
Stacked Area Clustered Column Ppt PowerPoint Presentation Styles Gridlines
This is a stacked area clustered column ppt powerpoint presentation styles gridlines. This is a three stage process. The stages in this process are dollars, in percentage, finance, growth strategy, business, strategy.
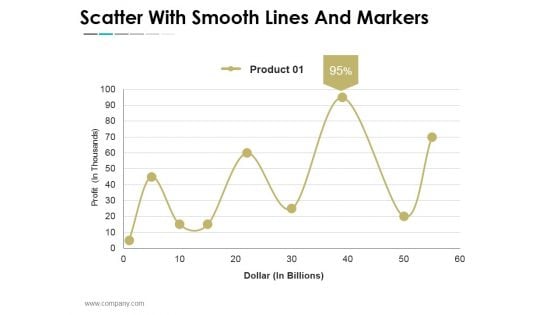
Scatter With Smooth Lines And Markers Ppt PowerPoint Presentation Show Template
This is a scatter with smooth lines and markers ppt powerpoint presentation show template. This is a nine stage process. The stages in this process are business, strategy, marketing, success, dollar in billions, profit in thousands.
Stacked Line With Marker Ppt PowerPoint Presentation Icon Format
This is a stacked line with marker ppt powerpoint presentation icon format. This is a twelve stage process. The stages in this process are business, strategy, marketing, success, profit million dollars, stacked column.

Projected Key Financials Template 2 Ppt PowerPoint Presentation Professional Clipart
This is a projected key financials template 2 ppt powerpoint presentation professional clipart. This is a four stage process. The stages in this process are sales, gross profit, net profit, in dollar.
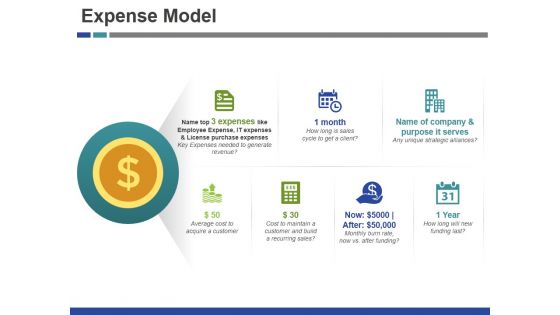
Expense Model Template 1 Ppt PowerPoint Presentation Gallery Clipart Images
This is a expense model template 1 ppt powerpoint presentation gallery clipart images. This is a seven stage process. The stages in this process are month, year, dollar, symbol, business .
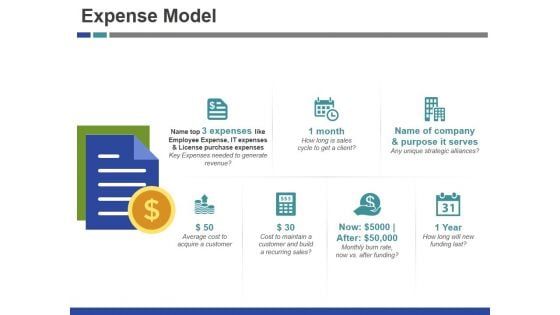
Expense Model Template 2 Ppt PowerPoint Presentation Inspiration Design Ideas
This is a expense model template 2 ppt powerpoint presentation inspiration design ideas. This is a seven stage process. The stages in this process are month, year, dollar, symbol, business.
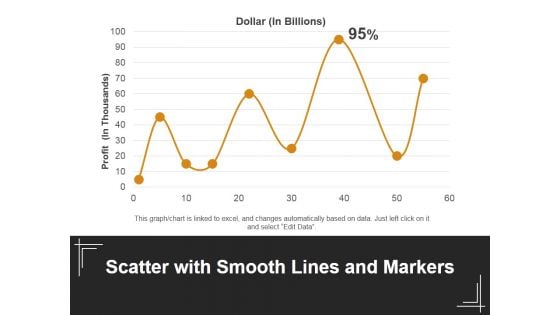
Scatter With Smooth Lines And Markers Ppt PowerPoint Presentation Outline Design Ideas
This is a scatter with smooth lines and markers ppt powerpoint presentation outline design ideas. This is a one stage process. The stages in this process are dollar, profit, line chart, business, marketing.
Scatter Chart Ppt PowerPoint Presentation Icon Elements
This is a scatter chart ppt powerpoint presentation icon elements. This is a nine stage process. The stages in this process are dollar in billions, sales in percentage, business, success.
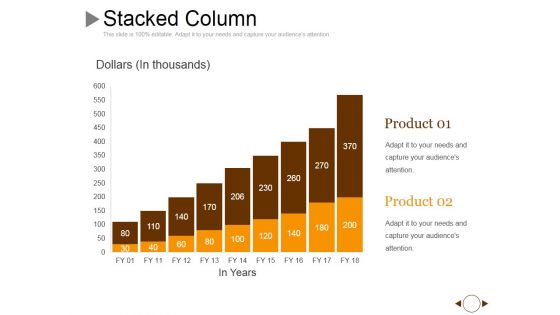
Stacked Column Ppt PowerPoint Presentation Infographic Template Master Slide
This is a stacked column ppt powerpoint presentation infographic template master slide. This is a nine stage process. The stages in this process are product, dollar, growth, success, graph.
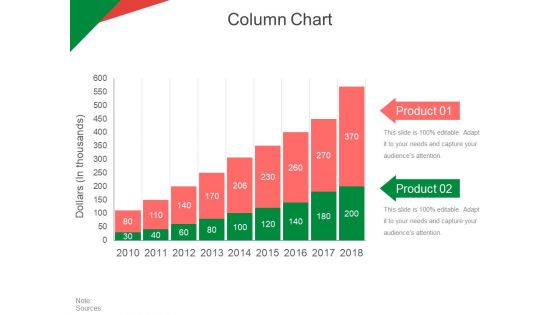
Column Chart Ppt PowerPoint Presentation Gallery Topics
This is a column chart ppt powerpoint presentation gallery topics. This is a two stage process. The stages in this process are dollars in thousands, product, business, marketing, strategy.
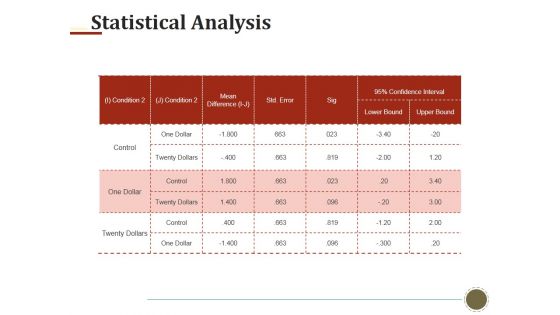
Statistical Analysis Template 2 Ppt PowerPoint Presentation Show Templates
This is a statistical analysis template 2 ppt powerpoint presentation show templates. This is a two stage process. The stages in this process are control, one dollar, lower bound, upper bound.
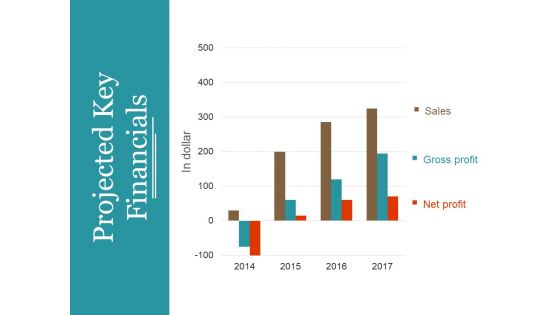
Projected Key Financials Template 1 Ppt PowerPoint Presentation Summary Professional
This is a projected key financials template 1 ppt powerpoint presentation summary professional. This is a three stage process. The stages in this process are in dollar, sales, gross profit, net profit, graph, year.
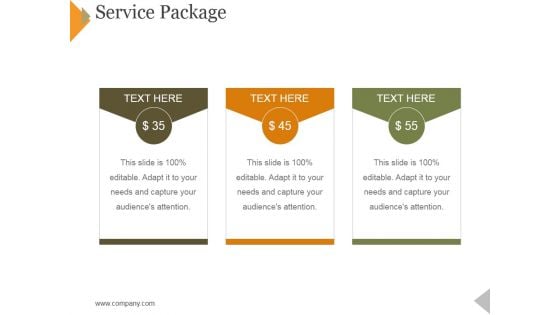
Service Package Template 1 Ppt PowerPoint Presentation Professional Topics
This is a service package template 1 ppt powerpoint presentation professional topics. This is a three stage process. The stages in this process are dollar, business, finance, marketing, management.
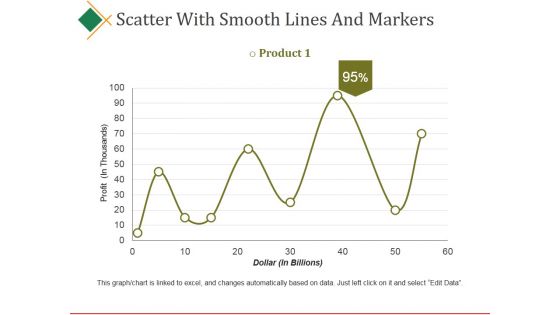
Scatter With Smooth Lines And Markers Ppt PowerPoint Presentation Visual Aids Ideas
This is a scatter with smooth lines and markers ppt powerpoint presentation visual aids ideas. This is a nine stage process. The stages in this process are product, profit, dollar, business, finance.

Column Chart Ppt PowerPoint Presentation Layouts Ideas
This is a column chart ppt powerpoint presentation layouts ideas. This is a two stage process. The stages in this process are dollars in thousands, strategy, business, graph, product.
Scatter Chart Ppt PowerPoint Presentation Professional Icons
This is a scatter chart ppt powerpoint presentation professional icons. This is a six stage process. The stages in this process are in dollars, in percentage, graph, business, marketing.
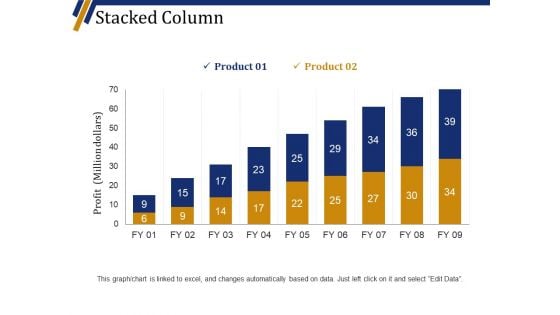
Stacked Column Ppt PowerPoint Presentation Professional Template
This is a stacked column ppt powerpoint presentation professional template. This is a nine stage process. The stages in this process are product, profit million dollars, business, marketing, graph.
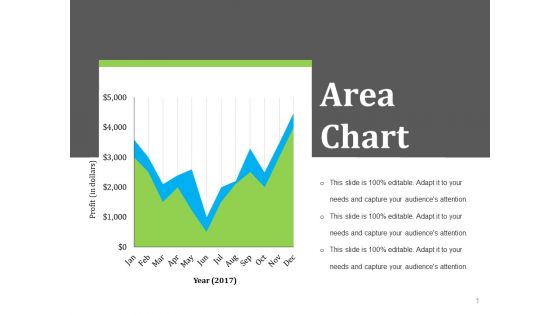
Area Chart Ppt PowerPoint Presentation Model Examples
This is a area chart ppt powerpoint presentation model examples. This is a two stage process. The stages in this process are year profit in dollars, business, strategy, growth.
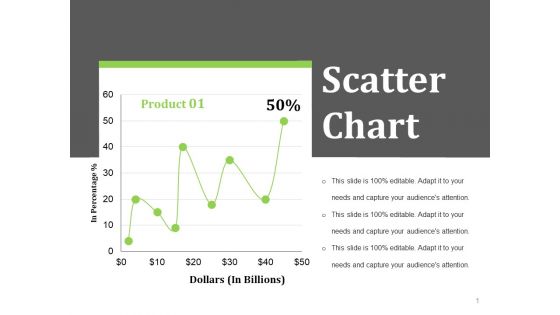
Scatter Chart Ppt PowerPoint Presentation Styles Layout Ideas
This is a scatter chart ppt powerpoint presentation styles layout ideas. This is a one stage process. The stages in this process are dollars in billions, in percentage, business, finance.
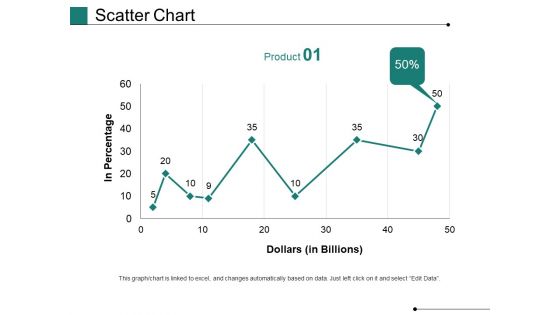
Scatter Chart Ppt PowerPoint Presentation Gallery Show
This is a scatter chart ppt powerpoint presentation gallery show. This is a one stage process. The stages in this process are in percentage, dollars, business, marketing, growth, graph.
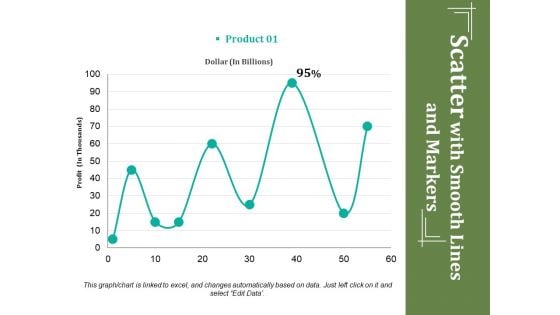
Scatter With Smooth Lines And Markers Ppt PowerPoint Presentation Ideas Deck
This is a scatter with smooth lines and markers ppt powerpoint presentation ideas deck. This is a one stage process. The stages in this process are profit, dollar, percentage, business, growth.
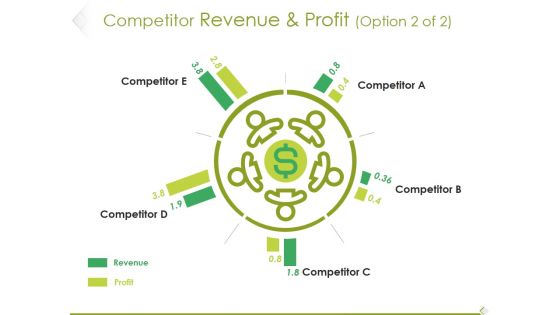
Competitor Revenue And Profit Template 1 Ppt PowerPoint Presentation File Infographic Template
This is a competitor revenue and profit template 1 ppt powerpoint presentation file infographic template. This is a five stage process. The stages in this process are competitor, revenue, profit, dollar, symbol.
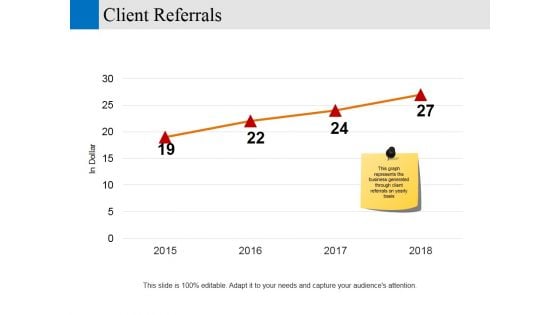
client referrals ppt powerpoint presentation visual aids show
This is a client referrals ppt powerpoint presentation visual aids show. This is a four stage process. The stages in this process are in dollar, years, business, marketing, growth.
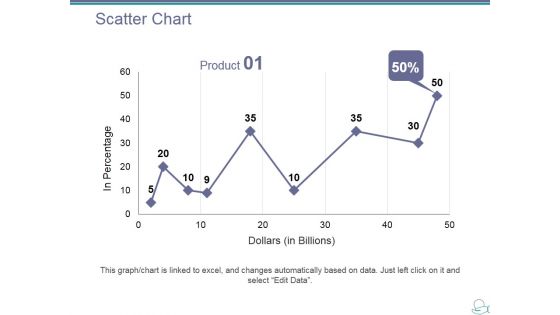
Scatter Chart Ppt PowerPoint Presentation Ideas Designs Download
This is a scatter chart ppt powerpoint presentation ideas designs download. This is a one stage process. The stages in this process are product, dollar, in percentage, growth, success.
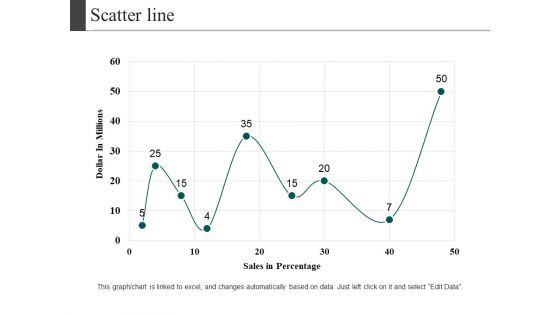
Scatter Line Ppt PowerPoint Presentation Visual Aids Diagrams
This is a scatter line ppt powerpoint presentation visual aids diagrams. This is a one stage process. The stages in this process are dollar in millions, sales in percentage, growth, business, marketing.
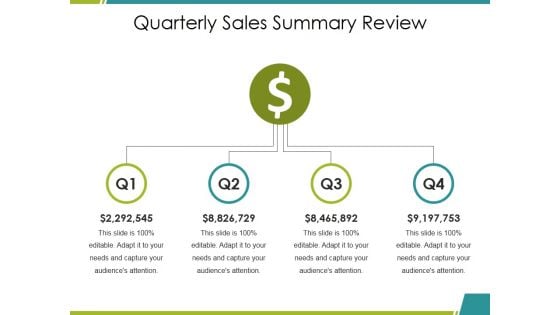
Quarterly Sales Summary Review Ppt PowerPoint Presentation Show Clipart
This is a quarterly sales summary review ppt powerpoint presentation show clipart. This is a four stage process. The stages in this process are dollar, business, finance, marketing, symbol.
Sales Budget Vs Actual Ppt PowerPoint Presentation Icon Display
This is a sales budget vs actual ppt powerpoint presentation icon display. This is a two stage process. The stages in this process are budget, actual, dollar, symbol, business.
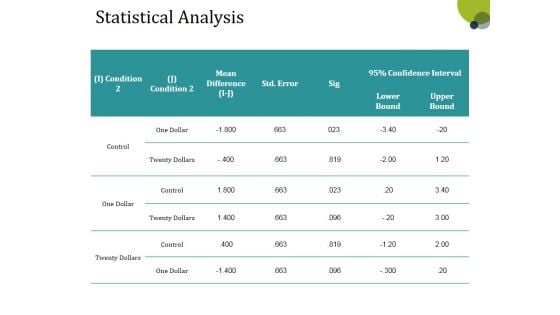
Statistical Analysis Template 1 Ppt PowerPoint Presentation Infographics Show
This is a statistical analysis template 1 ppt powerpoint presentation infographics show. This is a three stage process. The stages in this process are one dollar, control, condition, lower bound, upper bound.
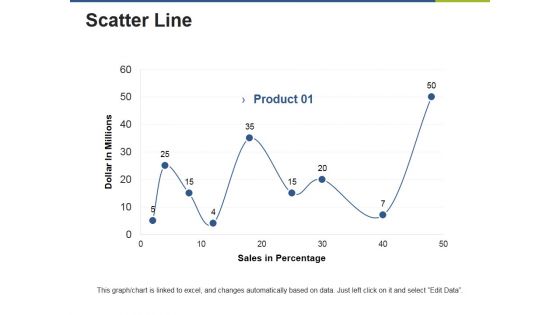
Scatter Line Ppt PowerPoint Presentation Gallery Clipart Images
This is a scatter line ppt powerpoint presentation gallery clipart images. This is a one stage process. The stages in this process are product, dollar in millions, sales in percentage.
Scatter Line Chart Ppt PowerPoint Presentation Icon Files
This is a scatter line chart ppt powerpoint presentation icon files. This is a one stage process. The stages in this process are dollar in millions, product, sales in percentage.
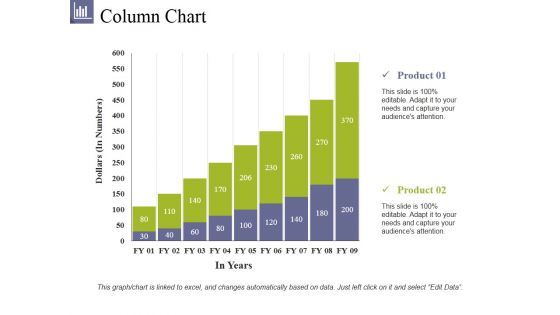
Column Chart Ppt PowerPoint Presentation File Summary
This is a column chart ppt powerpoint presentation file summary. This is a two stage process. The stages in this process are product, dollars, in years, bar graph, growth.
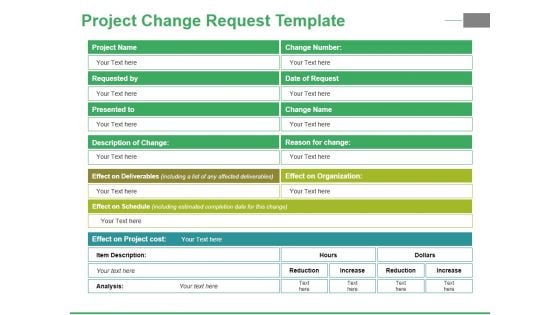
Project Change Request Template Ppt PowerPoint Presentation File Graphic Tips
This is a project change request template ppt powerpoint presentation file graphic tips. This is a two stage process. The stages in this process are hour, dollars, description, reduction, increase.

Scatter Line Ppt PowerPoint Presentation Professional Design Inspiration
This is a scatter line ppt powerpoint presentation professional design inspiration. This is a one stage process. The stages in this process are product, sales in percentage, dollar in millions.

Column Chart Ppt PowerPoint Presentation Inspiration Layout Ideas
This is a column chart ppt powerpoint presentation inspiration layout ideas. This is a two stage process. The stages in this process are in years, dollars, chart, business, marketing, finance.
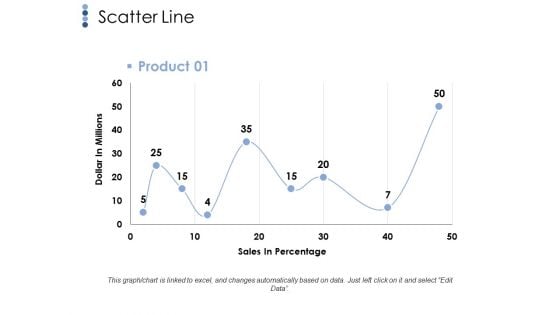
Scatter Line Ppt PowerPoint Presentation File Infographics
This is a scatter line ppt powerpoint presentation file infographics. This is a one stage process. The stages in this process are scatter line, dollar in millions, sales in percentage, business.

Financial Ppt PowerPoint Presentation Inspiration Brochure
This is a financial ppt powerpoint presentation inspiration brochure. This is a two stage process. The stages in this process are valuation of the company, investment terms, dollar, symbol, finance.


 Continue with Email

 Home
Home


