Execution Plan
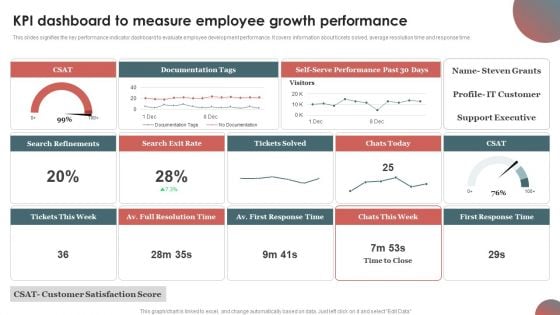
KPI Dashboard To Measure Employee Growth Performance Rules PDF
This slides signifies the key performance indicator dashboard to evaluate employee development performance. It covers information about tickets solved, average resolution time and response time.Showcasing this set of slides titled KPI Dashboard To Measure Employee Growth Performance Rules PDF. The topics addressed in these templates are Documentation Tags, Search Refinements, Full Resolution. All the content presented in this PPT design is completely editable. Download it and make adjustments in color, background, font etc. as per your unique business setting.
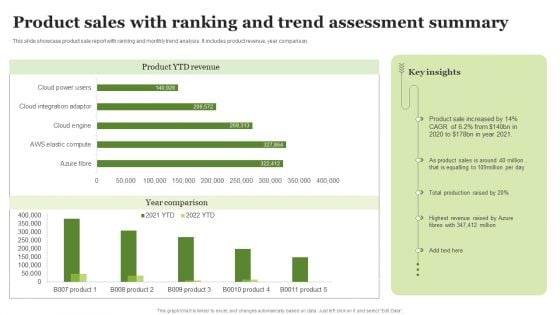
Product Sales With Ranking And Trend Assessment Summary Ppt PowerPoint Presentation Portfolio Images PDF
This slide showcase product sale report with ranking and monthly trend analysis. It includes product revenue, year comparison.Pitch your topic with ease and precision using this Product Sales With Ranking And Trend Assessment Summary Ppt PowerPoint Presentation Portfolio Images PDF. This layout presents information on Highest Revenue, Total Production, Product Sales. It is also available for immediate download and adjustment. So, changes can be made in the color, design, graphics or any other component to create a unique layout.
Enterprise Saas Vendor Market Share And Earnings Growth Icons PDF
This slide covers saas vendors comparative market share report. It also includes percentage of total annual revenue growth. Pitch your topic with ease and precision using this Enterprise Saas Vendor Market Share And Earnings Growth Icons PDF. This layout presents information on Annual Growth, Market Share, Revenue. It is also available for immediate download and adjustment. So, changes can be made in the color, design, graphics or any other component to create a unique layout.
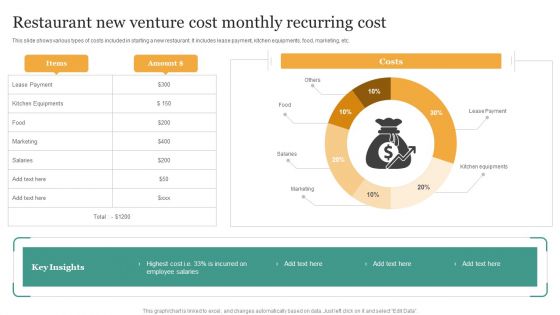
Restaurant New Venture Cost Monthly Recurring Cost Slides PDF
This slide shows various types of costs included in starting a new restaurant. It includes lease payment, kitchen equipments, food, marketing, etc. Showcasing this set of slides titled Restaurant New Venture Cost Monthly Recurring Cost Slides PDF. The topics addressed in these templates are Restaurant New Venture Cost, Monthly Recurring Cost. All the content presented in this PPT design is completely editable. Download it and make adjustments in color, background, font etc. as per your unique business setting.
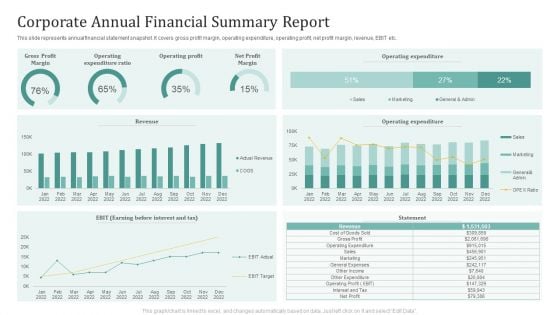
Corporate Annual Financial Summary Report Ppt Portfolio Skills PDF
This slide represents annual financial statement snapshot. It covers gross profit margin, operating expenditure, operating profit, net profit margin, revenue, EBIT etc. Pitch your topic with ease and precision using this Corporate Annual Financial Summary Report Ppt Portfolio Skills PDF. This layout presents information on Operating Expenditure Ratio, Operating Profit, Net Profit Margin. It is also available for immediate download and adjustment. So, changes can be made in the color, design, graphics or any other component to create a unique layout.
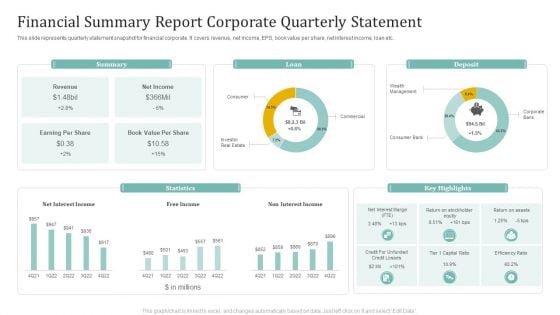
Financial Summary Report Corporate Quarterly Statement Ppt Slides Ideas PDF
This slide represents quarterly statement snapshot for financial corporate. It covers revenue, net income, EPS, book value per share, net interest income, loan etc. Showcasing this set of slides titled Financial Summary Report Corporate Quarterly Statement Ppt Slides Ideas PDF. The topics addressed in these templates are Summary, Loan, Deposit, Statistics. All the content presented in this PPT design is completely editable. Download it and make adjustments in color, background, font etc. as per your unique business setting.
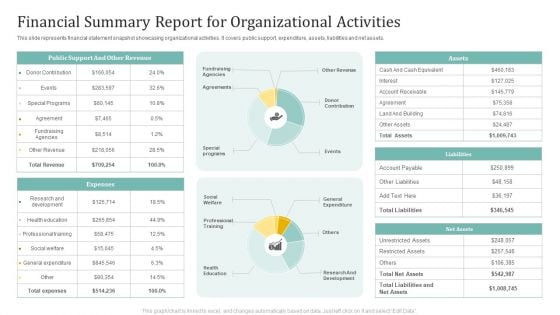
Financial Summary Report For Organizational Activities Ppt Summary Graphics Template PDF
This slide represents financial statement snapshot showcasing organizational activities. It covers public support, expenditure, assets, liabilities and net assets. Pitch your topic with ease and precision using this Financial Summary Report For Organizational Activities Ppt Summary Graphics Template PDF. This layout presents information on Public Support, Other Revenue, Expenses. It is also available for immediate download and adjustment. So, changes can be made in the color, design, graphics or any other component to create a unique layout.
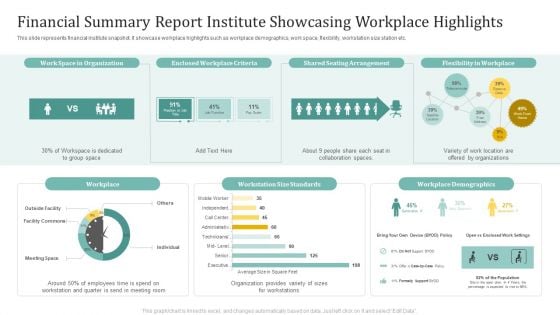
Financial Summary Report Institute Showcasing Workplace Highlights Ppt Infographics Inspiration PDF
This slide represents financial institute snapshot. It showcase workplace highlights such as workplace demographics, work space, flexibility, workstation size station etc. Pitch your topic with ease and precision using this Financial Summary Report Institute Showcasing Workplace Highlights Ppt Infographics Inspiration PDF. This layout presents information on Shared Seating Arrangement, Flexibility Workplace, Workplace. It is also available for immediate download and adjustment. So, changes can be made in the color, design, graphics or any other component to create a unique layout.
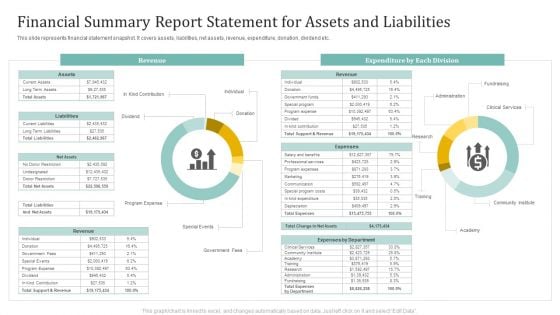
Financial Summary Report Statement For Assets And Liabilities Ppt Slides Guide PDF
This slide represents financial statement snapshot. It covers assets, liabilities, net assets, revenue, expenditure, donation, dividend etc. Pitch your topic with ease and precision using this Financial Summary Report Statement For Assets And Liabilities Ppt Slides Guide PDF. This layout presents information on Revenue, Expenditure Each Division, Fundraising. It is also available for immediate download and adjustment. So, changes can be made in the color, design, graphics or any other component to create a unique layout.
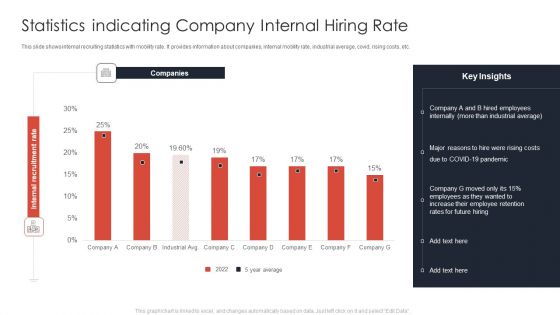
Statistics Indicating Company Internal Hiring Rate Ppt Ideas Templates PDF
This slide shows internal recruiting statistics with mobility rate. It provides information about companies, internal mobility rate, industrial average, covid, rising costs, etc. Showcasing this set of slides titled Statistics Indicating Company Internal Hiring Rate Ppt Ideas Templates PDF. The topics addressed in these templates are Companies, Employees Internally, COVID 19 Pandemic. All the content presented in this PPT design is completely editable. Download it and make adjustments in color, background, font etc. as per your unique business setting.
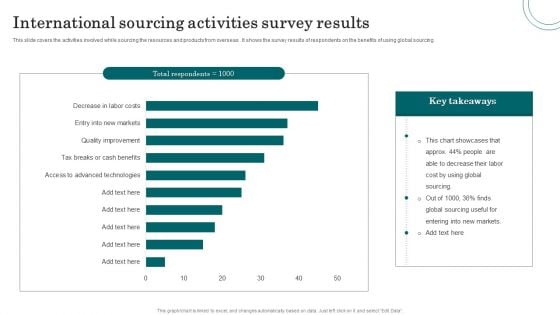
International Sourcing Activities Survey Results Microsoft PDF
This slide covers the activities involved while sourcing the resources and products from overseas . It shows the survey results of respondents on the benefits of using global sourcing. Pitch your topic with ease and precision using this International Sourcing Activities Survey Results Microsoft PDF. This layout presents information on Global Sourcing, Labor Cost, Markets. It is also available for immediate download and adjustment. So, changes can be made in the color, design, graphics or any other component to create a unique layout.
Five Years Sales Projection And Analysis Dashboard Icons PDF
This slide defines the dashboard for five years sales forecast and analysis . It includes information related to the estimated and actual sales. Pitch your topic with ease and precision using this Five Years Sales Projection And Analysis Dashboard Icons PDF. This layout presents information on Forecast Value, Forecast Accuracy, Won Opportunities. It is also available for immediate download and adjustment. So, changes can be made in the color, design, graphics or any other component to create a unique layout.
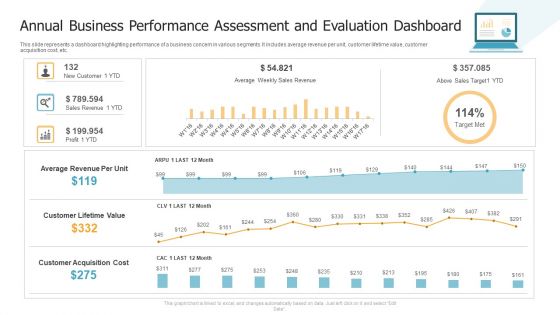
Annual Business Performance Assessment And Evaluation Dashboard Brochure PDF
This slide represents a dashboard highlighting performance of a business concern in various segments. It includes average revenue per unit, customer lifetime value, customer acquisition cost, etc. Showcasing this set of slides titled Annual Business Performance Assessment And Evaluation Dashboard Brochure PDF. The topics addressed in these templates are Profit, Sales Revenue, New Customer. All the content presented in this PPT design is completely editable. Download it and make adjustments in color, background, font etc. as per your unique business setting.
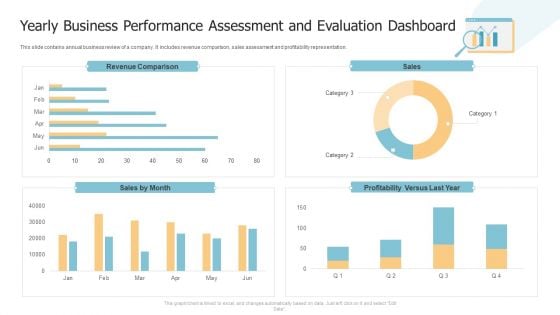
Yearly Business Performance Assessment And Evaluation Dashboard Structure PDF
This slide contains annual business review of a company. It includes revenue comparison, sales assessment and profitability representation. Showcasing this set of slides titled Yearly Business Performance Assessment And Evaluation Dashboard Structure PDF. The topics addressed in these templates are Revenue Comparison, Sales, Profitability. All the content presented in this PPT design is completely editable. Download it and make adjustments in color, background, font etc. as per your unique business setting.
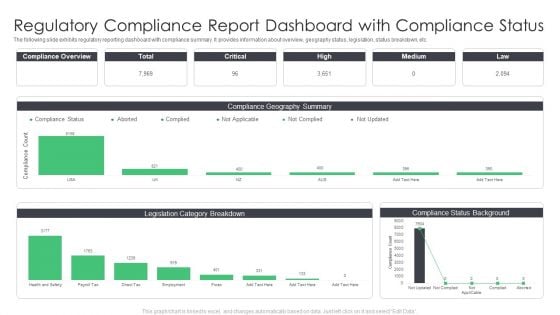
Regulatory Compliance Report Dashboard With Compliance Status Infographics PDF
The following slide exhibits regulatory reporting dashboard with compliance summary. It provides information about overview, geography status, legislation, status breakdown, etc. Pitch your topic with ease and precision using this Regulatory Compliance Report Dashboard With Compliance Status Infographics PDF. This layout presents information on Dashboard With Compliance Status, Regulatory Compliance Report. It is also available for immediate download and adjustment. So, changes can be made in the color, design, graphics or any other component to create a unique layout.
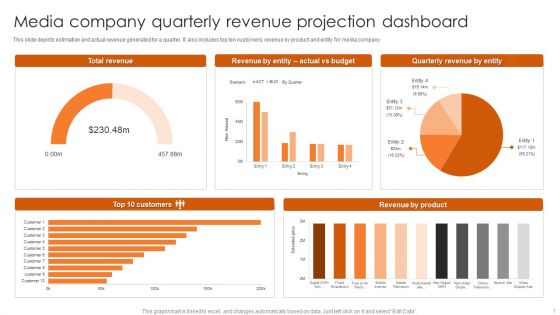
Media Company Quarterly Revenue Projection Dashboard Mockup PDF
This slide depicts estimation and actual revenue generated for a quarter. It also includes top ten customers, revenue by product and entity for media company. Pitch your topic with ease and precision using this Media Company Quarterly Revenue Projection Dashboard Mockup PDF. This layout presents information on Total Revenue, Quarterly Revenue Entity, Top 10 Customers. It is also available for immediate download and adjustment. So, changes can be made in the color, design, graphics or any other component to create a unique layout.
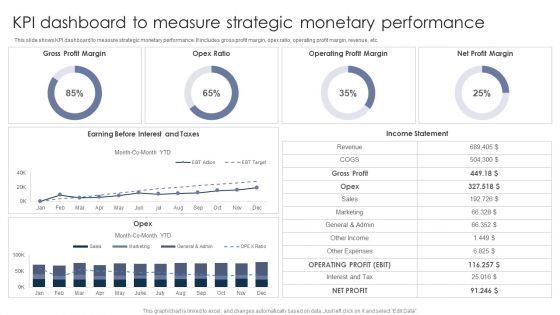
KPI Dashboard To Measure Strategic Monetary Performance Graphics PDF
This slide shows KPI dashboard to measure strategic monetary performance. It includes gross profit margin, opex ratio, operating profit margin, revenue, etc. Pitch your topic with ease and precision using this KPI Dashboard To Measure Strategic Monetary Performance Graphics PDF. This layout presents information on Gross Profit Margin, Opex Ratio, Operating Profit Margin. It is also available for immediate download and adjustment. So, changes can be made in the color, design, graphics or any other component to create a unique layout.
COVID Impact Analysis On Unemployment Rates Ppt Inspiration Icon PDF
This slide depicts unemployment rates on multiple industries impacted by Covid-19. It includes different industries with unemployment rates and number of unemployed individuals. Showcasing this set of slides titled COVID Impact Analysis On Unemployment Rates Ppt Inspiration Icon PDF. The topics addressed in these templates are Hotel Industry, Unemployment Rate, Construction Industry. All the content presented in this PPT design is completely editable. Download it and make adjustments in color, background, font etc. as per your unique business setting.
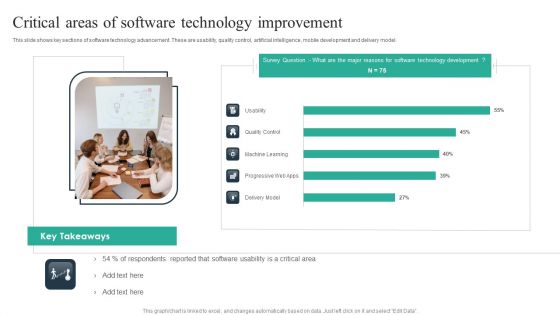
Critical Areas Of Software Technology Improvement Ppt Professional Infographics PDF
This slide shows key sections of software technology advancement. These are usability, quality control, artificial intelligence, mobile development and delivery model. Showcasing this set of slides titled Critical Areas Of Software Technology Improvement Ppt Professional Infographics PDF. The topics addressed in these templates are Usability, Quality Control, Machine Learning. All the content presented in this PPT design is completely editable. Download it and make adjustments in color, background, font etc. as per your unique business setting.
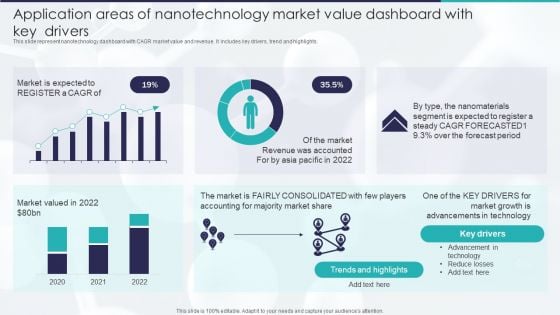
Application Areas Of Nanotechnology Market Value Dashboard With Key Drivers Topics PDF
This slide represent nanotechnology dashboard with CAGR market value and revenue. It includes key drivers, trend and highlights. Showcasing this set of slides titled Application Areas Of Nanotechnology Market Value Dashboard With Key Drivers Topics PDF. The topics addressed in these templates are Market Valued, Market Share, 2020 To 2022. All the content presented in this PPT design is completely editable. Download it and make adjustments in color, background, font etc. as per your unique business setting.
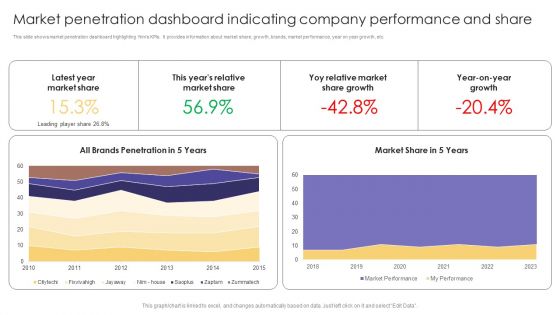
Market Penetration Dashboard Indicating Company Performance And Share Formats PDF
This slide shows market penetration dashboard highlighting firms KPIs. It provides information about market share, growth, brands, market performance, year on year growth, etc. Showcasing this set of slides titled Market Penetration Dashboard Indicating Company Performance And Share Formats PDF. The topics addressed in these templates are Latest Year, Market Share, Market Share Growth. All the content presented in this PPT design is completely editable. Download it and make adjustments in color, background, font etc. as per your unique business setting.
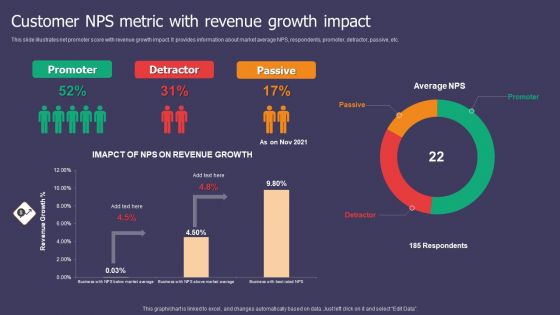
Customer NPS Metric With Revenue Growth Impact Ppt Show Portrait PDF
This slide illustrates net promoter score with revenue growth impact. It provides information about market average NPS, respondents, promoter, detractor, passive, etc. Pitch your topic with ease and precision using this Customer NPS Metric With Revenue Growth Impact Ppt Show Portrait PDF. This layout presents information on Promoter, Detractor, Passive. It is also available for immediate download and adjustment. So, changes can be made in the color, design, graphics or any other component to create a unique layout.
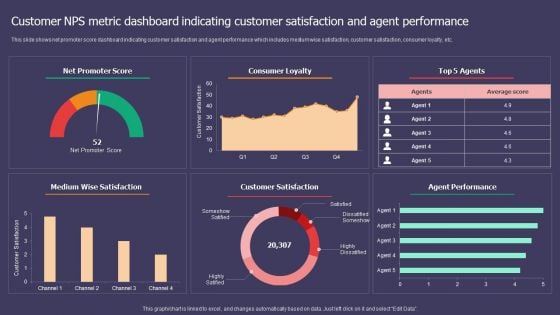
Customer NPS Metric Dashboard Indicating Customer Satisfaction And Agent Performance Template PDF
This slide shows net promoter score dashboard indicating customer satisfaction and agent performance which includes medium wise satisfaction, customer satisfaction, consumer loyalty, etc. Showcasing this set of slides titled Customer NPS Metric Dashboard Indicating Customer Satisfaction And Agent Performance Template PDF. The topics addressed in these templates are Net Promoter Score, Consumer Loyalty, Top 5 Agents. All the content presented in this PPT design is completely editable. Download it and make adjustments in color, background, font etc. as per your unique business setting.
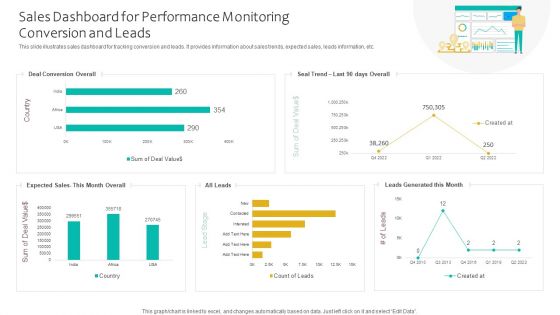
Sales Dashboard For Performance Monitoring Conversion And Leads Ppt Infographics Smartart PDF
This slide illustrates sales dashboard for tracking conversion and leads. It provides information about sales trends, expected sales, leads information, etc. Showcasing this set of slides titled Sales Dashboard For Performance Monitoring Conversion And Leads Ppt Infographics Smartart PDF. The topics addressed in these templates are Deal Conversion Overall, Expected Sales, Leads Generated. All the content presented in this PPT design is completely editable. Download it and make adjustments in color, background, font etc. as per your unique business setting.
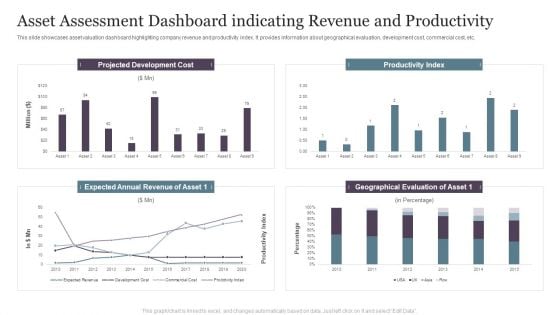
Asset Assessment Dashboard Indicating Revenue And Productivity Infographics PDF
This slide showcases asset valuation dashboard highlighting company revenue and productivity index. It provides information about geographical evaluation, development cost, commercial cost, etc.Pitch your topic with ease and precision using this Asset Assessment Dashboard Indicating Revenue And Productivity Infographics PDF. This layout presents information on Projected Development, Productivity Index, Geographical Evaluation. It is also available for immediate download and adjustment. So, changes can be made in the color, design, graphics or any other component to create a unique layout.

Asset Assessment Dashboard With Cash Flow And Market Value Summary PDF
This slide illustrates asset valuation dashboard with key financial metrics. It provides information about cash flow, market value, intrinsic value, assumptions, market cap, discount rate, etc.Showcasing this set of slides titled Asset Assessment Dashboard With Cash Flow And Market Value Summary PDF. The topics addressed in these templates are Discount Rate, Capital Expenditure, Market Capitalization. All the content presented in this PPT design is completely editable. Download it and make adjustments in color, background, font etc. as per your unique business setting.
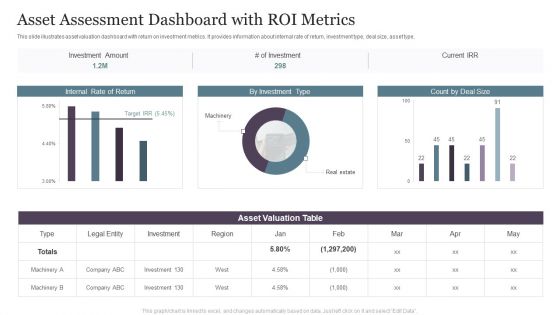
Asset Assessment Dashboard With ROI Metrics Topics PDF
This slide illustrates asset valuation dashboard with return on investment metrics. It provides information about internal rate of return, investment type, deal size, asset type, Pitch your topic with ease and precision using this Asset Assessment Dashboard With ROI Metrics Topics PDF. This layout presents information on Investment Amount, Asset Valuation, Internal Return. It is also available for immediate download and adjustment. So, changes can be made in the color, design, graphics or any other component to create a unique layout.
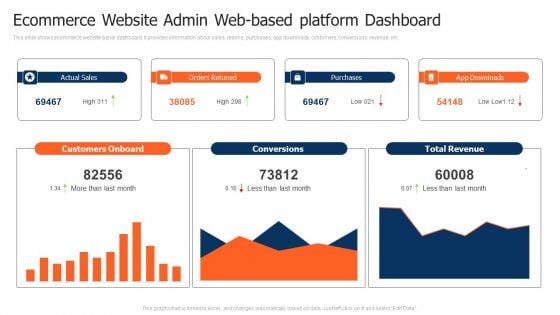
Ecommerce Website Admin Web Based Platform Dashboard Pictures PDF
This slide shows ecommerce website panel dashboard. It provides information about sales, returns, purchases, app downloads, customers, conversions, revenue, etc. Pitch your topic with ease and precision using this Ecommerce Website Admin Web Based Platform Dashboard Pictures PDF. This layout presents information on Customers Onboard, Purchases, Total Revenue. It is also available for immediate download and adjustment. So, changes can be made in the color, design, graphics or any other component to create a unique layout.
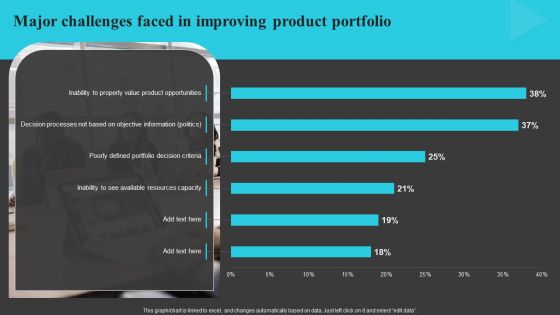
Major Challenges Faced In Improving Creating And Offering Multiple Product Ranges In New Business Territories Mockup PDF
If your project calls for a presentation, then Slidegeeks is your go-to partner because we have professionally designed, easy-to-edit templates that are perfect for any presentation. After downloading, you can easily edit Major Challenges Faced In Improving Creating And Offering Multiple Product Ranges In New Business Territories Mockup PDF and make the changes accordingly. You can rearrange slides or fill them with different images. Check out all the handy templates.
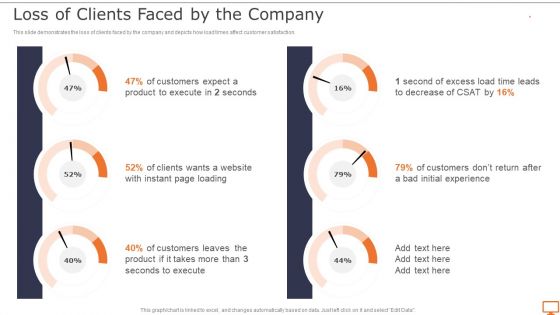
Deploying XP Practices To Enhance Operational Efficiency Loss Of Clients Faced By The Company Introduction PDF
This slide demonstrates the loss of clients faced by the company and depicts how load times affect customer satisfaction.Find a pre-designed and impeccable Deploying XP Practices To Enhance Operational Efficiency Loss Of Clients Faced By The Company Introduction PDF. The templates can ace your presentation without additional effort. You can download these easy-to-edit presentation templates to make your presentation stand out from others. So, what are you waiting for Download the template from Slidegeeks today and give a unique touch to your presentation.
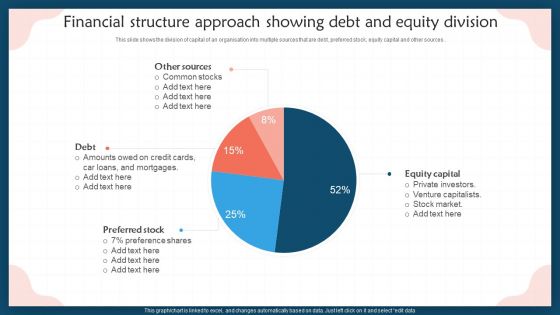
Financial Structure Approach Showing Debt And Equity Division Introduction PDF
This slide shows the division of capital of an organisation into multiple sources that are debt, preferred stock, equity capital and other sources . Pitch your topic with ease and precision using this Financial Structure Approach Showing Debt And Equity Division Introduction PDF. This layout presents information on Other Sources, Preferred Stock, Equity Capital, Debt. It is also available for immediate download and adjustment. So, changes can be made in the color, design, graphics or any other component to create a unique layout.
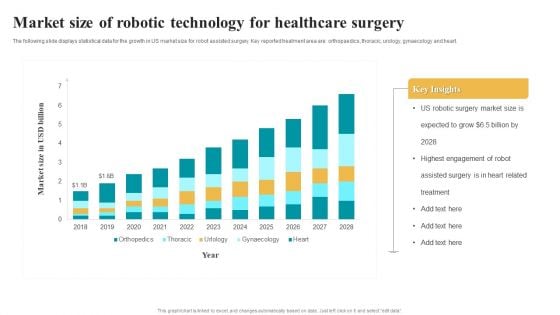
Market Size Of Robotic Technology For Healthcare Surgery Summary PDF
The following slide displays statistical data for the growth in US market size for robot assisted surgery. Key reported treatment area are orthopaedics, thoracic, urology, gynaecology and heart.Showcasing this set of slides titled Market Size Of Robotic Technology For Healthcare Surgery Summary PDF. The topics addressed in these templates are Robotic Surgery, Highest Engagement, Assisted Surgery. All the content presented in this PPT design is completely editable. Download it and make adjustments in color, background, font etc. as per your unique business setting.
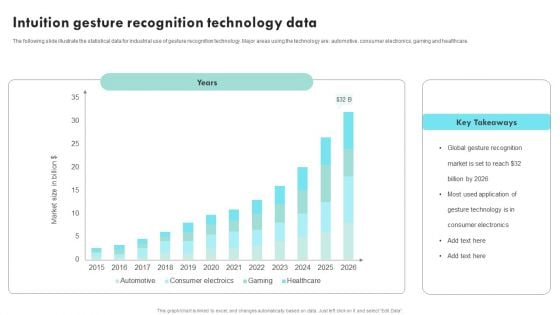
Intuition Gesture Recognition Technology Data Ppt Pictures Grid PDF
The following slide illustrate the statistical data for industrial use of gesture recognition technology. Major areas using the technology are automotive, consumer electronics, gaming and healthcare. Showcasing this set of slides titled Intuition Gesture Recognition Technology Data Ppt Pictures Grid PDF. The topics addressed in these templates are Global Gesture Recognition, Gesture Technology, Consumer Electronics. All the content presented in this PPT design is completely editable. Download it and make adjustments in color, background, font etc. as per your unique business setting.
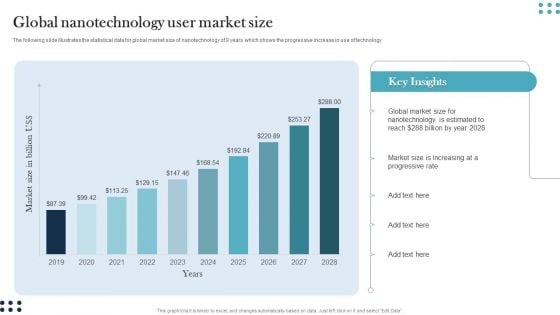
Global Nanotechnology User Market Size Guidelines PDF
The following slide illustrates the statistical data for global market size of nanotechnology of 9 years which shows the progressive increase in use of technology. Pitch your topic with ease and precision using this Global Nanotechnology User Market Size Guidelines PDF. This layout presents information on Global Market Size, Nanotechnology, Estimated To Reach. It is also available for immediate download and adjustment. So, changes can be made in the color, design, graphics or any other component to create a unique layout.
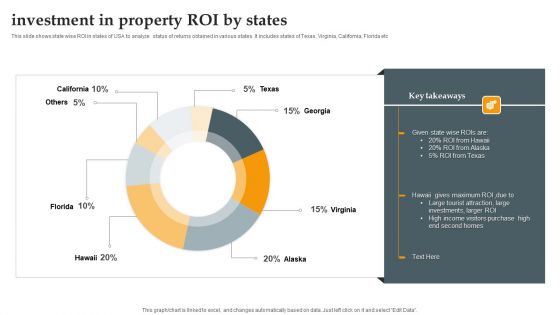
Investment In Property ROI By States Background PDF
This slide shows state wise ROI in states of USA to analyze status of returns obtained in various states. It includes states of Texas, Virginia, California, Florida etc. Showcasing this set of slides titled Investment In Property ROI By States Background PDF. The topics addressed in these templates are High Income, Investments, Larger ROI. All the content presented in this PPT design is completely editable. Download it and make adjustments in color, background, font etc. as per your unique business setting.
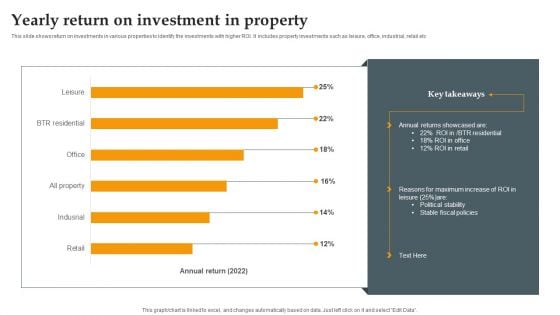
Yearly Return On Investment In Property Guidelines PDF
This slide shows return on investments in various properties to identify the investments with higher ROI. It includes property investments such as leisure, office, industrial, retail etc. Showcasing this set of slides titled Yearly Return On Investment In Property Guidelines PDF. The topics addressed in these templates are Yearly Return, Investment In Property. All the content presented in this PPT design is completely editable. Download it and make adjustments in color, background, font etc. as per your unique business setting.
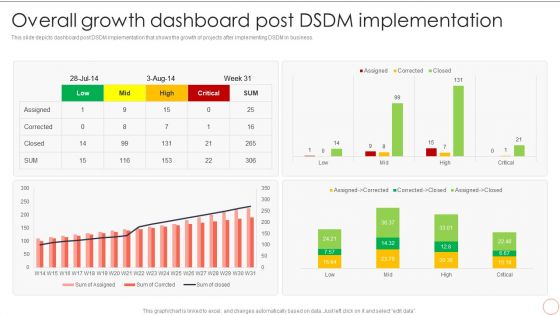
Overall Growth Dashboard Post DSDM Implementation Dynamic System Development Model Pictures PDF
This slide depicts dashboard post DSDM implementation that shows the growth of projects after implementing DSDM in business.If your project calls for a presentation, then Slidegeeks is your go-to partner because we have professionally designed, easy-to-edit templates that are perfect for any presentation. After downloading, you can easily edit Overall Growth Dashboard Post DSDM Implementation Dynamic System Development Model Pictures PDF and make the changes accordingly. You can rearrange slides or fill them with different images. Check out all the handy templates.
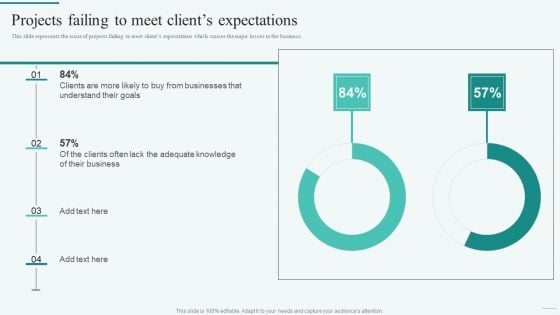
Projects Failing To Meet Clients Expectations Integration Of Dynamic System To Enhance Processes Guidelines PDF
This slide represents the issue of projects failing to meet clients expectations which causes the major losses to the business.Find a pre-designed and impeccable Projects Failing To Meet Clients Expectations Integration Of Dynamic System To Enhance Processes Guidelines PDF. The templates can ace your presentation without additional effort. You can download these easy-to-edit presentation templates to make your presentation stand out from others. So, what are you waiting for Download the template from Slidegeeks today and give a unique touch to your presentation.
Agile Product Development Tracking User Stories Across Agile Project Development Icons PDF
This slide provides information regarding dashboard for tracking user stories across agile project development including work items, etc. If your project calls for a presentation, then Slidegeeks is your go-to partner because we have professionally designed, easy-to-edit templates that are perfect for any presentation. After downloading, you can easily edit Agile Product Development Tracking User Stories Across Agile Project Development Icons PDF and make the changes accordingly. You can rearrange slides or fill them with different images. Check out all the handy templates.
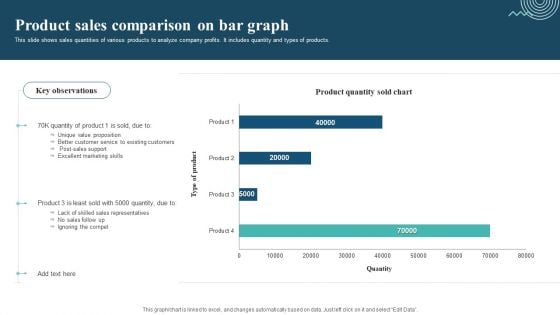
Product Sales Comparison On Bar Graph Sample PDF
This slide shows sales quantities of various products to analyze company profits. It includes quantity and types of products. Pitch your topic with ease and precision using this Product Sales Comparison On Bar Graph Sample PDF. This layout presents information on Unique Value Proposition, Excellent Marketing Skills, Ignoring The Compet. It is also available for immediate download and adjustment. So, changes can be made in the color, design, graphics or any other component to create a unique layout.

Annual Business Financial Summary Dashboard Themes PDF
This slide shows annual financial report dashboard of company to monitor yearly business performance. It includes various indicators such as revenue, net profits, costs and breakdown of cost. Showcasing this set of slides titled Annual Business Financial Summary Dashboard Themes PDF. The topics addressed in these templates are Revenue, Costs, Net Profit. All the content presented in this PPT design is completely editable. Download it and make adjustments in color, background, font etc. as per your unique business setting.
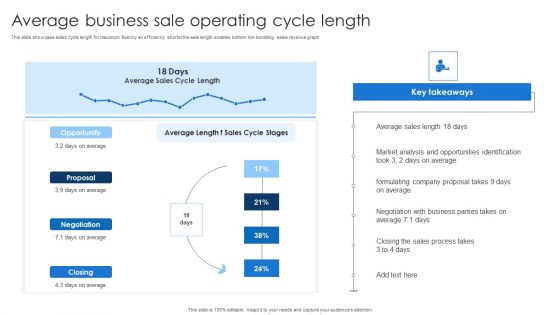
Average Business Sale Operating Cycle Length Ideas PDF
This slide showcase sales cycle length for maximum fluency an efficiency shorter the sale length enables bottom line boosting sales revenue graph.Showcasing this set of slides titled Average Business Sale Operating Cycle Length Ideas PDF. The topics addressed in these templates are Average Sales, Opportunities Identification, Negotiation Business. All the content presented in this PPT design is completely editable. Download it and make adjustments in color, background, font etc. as per your unique business setting.
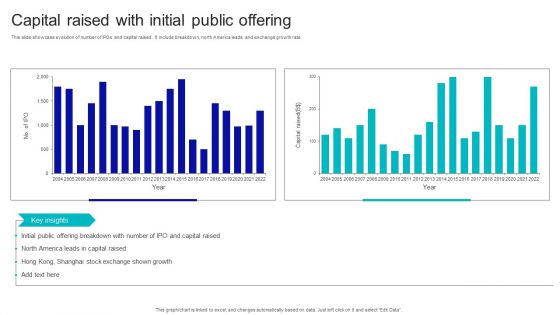
Capital Raised With Initial Public Offering Download PDF
This slide showcase evolution of number of IPOs and capital raised . It include breakdown, north America leads and exchange growth rate. Showcasing this set of slides titled Capital Raised With Initial Public Offering Download PDF. The topics addressed in these templates are Capital Raised, With Initial, Public Offering. All the content presented in this PPT design is completely editable. Download it and make adjustments in color, background, font etc. as per your unique business setting.
Employees Attrition Tracking Rate Stats Summary Report By Departments Slides PDF
This slide illustrates employees quarterly turnover rates for different departments. It also includes turnover rates on the basis of distinct positions and duration of retention in company. Showcasing this set of slides titled Employees Attrition Tracking Rate Stats Summary Report By Departments Slides PDF. The topics addressed in these templates are Employee Turnover, Involuntary. All the content presented in this PPT design is completely editable. Download it and make adjustments in color, background, font etc. as per your unique business setting.

KPI Dashboard Of Customer And Product Sales Performance Comparison Information PDF
This slide shows the KPI dashboard of client and product sales comparison. It also includes sales by location and total sales. Pitch your topic with ease and precision using this KPI Dashboard Of Customer And Product Sales Performance Comparison Information PDF. This layout presents information on Product Sales, Client Sales, Tim Santana. It is also available for immediate download and adjustment. So, changes can be made in the color, design, graphics or any other component to create a unique layout.
Sales Performance Comparison Graph Of Top Customer Icons PDF
This slide shows the customer sales comparison graph along with the units of product purchased by the clients. Showcasing this set of slides titled Sales Performance Comparison Graph Of Top Customer Icons PDF. The topics addressed in these templates are Highest Units, Customer, Product. All the content presented in this PPT design is completely editable. Download it and make adjustments in color, background, font etc. as per your unique business setting.
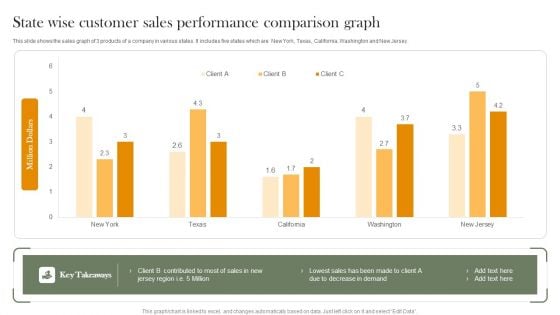
State Wise Customer Sales Performance Comparison Graph Introduction PDF
This slide shows the sales graph of 3 products of a company in various states. It includes five states which are New York, Texas, California, Washington and New Jersey. Showcasing this set of slides titled State Wise Customer Sales Performance Comparison Graph Introduction PDF. The topics addressed in these templates are Lowest Sales, Decrease Demand. All the content presented in this PPT design is completely editable. Download it and make adjustments in color, background, font etc. as per your unique business setting.
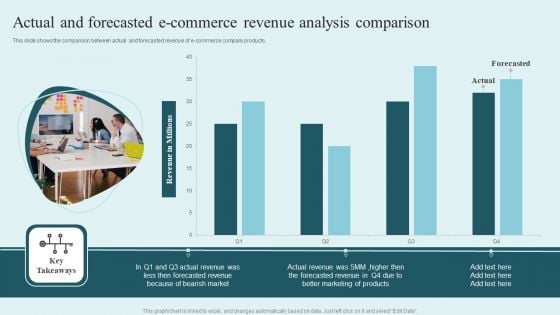
Actual And Forecasted E Commerce Revenue Analysis Comparison Clipart PDF
This slide shows the comparison between actual and forecasted revenue of e-commerce company products. Showcasing this set of slides titled Actual And Forecasted E Commerce Revenue Analysis Comparison Clipart PDF. The topics addressed in these templates are Actual Revenue, Forecasted Revenue, Bearish Market. All the content presented in this PPT design is completely editable. Download it and make adjustments in color, background, font etc. as per your unique business setting.
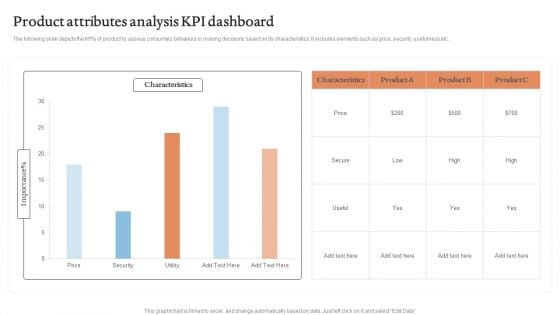
Product Attributes Analysis KPI Dashboard Graphics PDF
The following slide depicts the KPIs of product to assess consumers behaviour in making decisions based on its characteristics. It includes elements such as price, security, usefulness etc.Showcasing this set of slides titled Product Attributes Analysis KPI Dashboard Graphics PDF. The topics addressed in these templates are Characteristics, Product Attributes, Analysis KPI Dashboard. All the content presented in this PPT design is completely editable. Download it and make adjustments in color, background, font etc. as per your unique business setting.
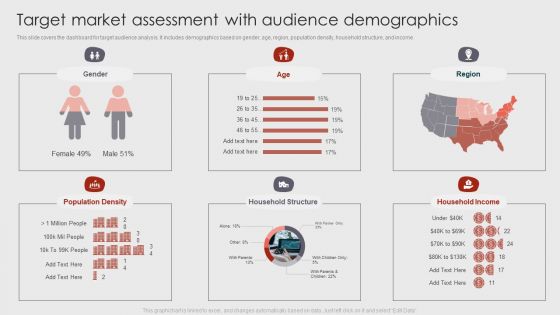
Target Market Assessment With Audience Demographics Inspiration PDF
This slide covers the dashboard for target audience analysis. It includes demographics based on gender, age, region, population density, household structure, and income. Pitch your topic with ease and precision using this Target Market Assessment With Audience Demographics Inspiration PDF. This layout presents information on Target Market Assessment, Audience Demographics . It is also available for immediate download and adjustment. So, changes can be made in the color, design, graphics or any other component to create a unique layout.
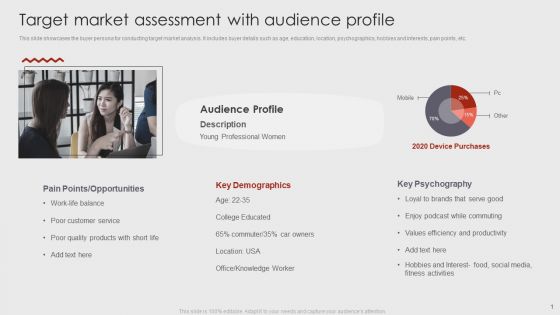
Target Market Assessment With Audience Profile Mockup PDF
This slide showcases the buyer persona for conducting target market analysis. It includes buyer details such as age, education, location, psychographics, hobbies and interests, pain points, etc. Showcasing this set of slides titled Target Market Assessment With Audience Profile Mockup PDF. The topics addressed in these templates are Opportunities, Key Demographics, Key Psychography. All the content presented in this PPT design is completely editable. Download it and make adjustments in color, background, font etc. as per your unique business setting.
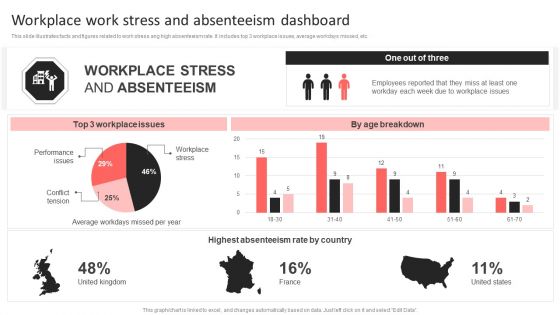
Workplace Work Stress And Absenteeism Dashboard Pictures PDF
This slide illustrates facts and figures related to work stress ang high absenteeism rate. It includes top 3 workplace issues, average workdays missed, etc.Showcasing this set of slides titled Workplace Work Stress And Absenteeism Dashboard Pictures PDF. The topics addressed in these templates are Employees Reported, Workplace Issues, Highest Absenteeism. All the content presented in this PPT design is completely editable. Download it and make adjustments in color, background, font etc. as per your unique business setting.
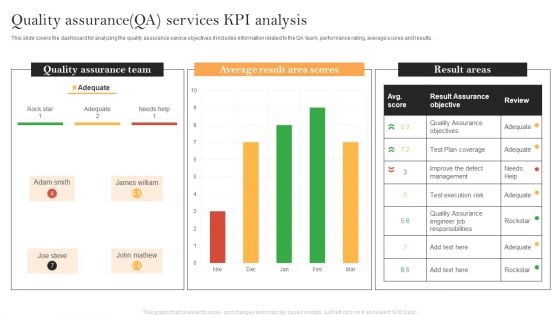
Quality Assurance QA Services KPI Analysis Demonstration PDF
This slide covers the dashboard for analyzing the quality assurance service objectives it includes information related to the QA team, performance rating, average scores and results. Showcasing this set of slides titled Quality Assurance QA Services KPI Analysis Demonstration PDF. The topics addressed in these templates are Quality Assurance Team, Average Result Area, Result Assurance Objective. All the content presented in this PPT design is completely editable. Download it and make adjustments in color, background, font etc. as per your unique business setting.
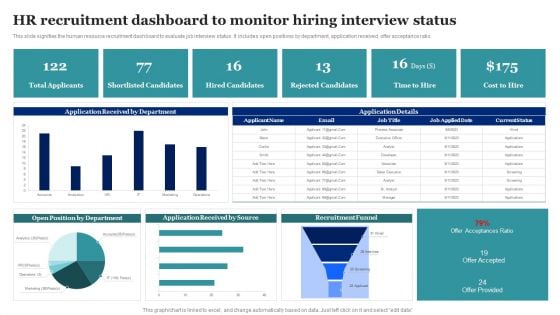
HR Recruitment Dashboard To Monitor Hiring Interview Status Ideas PDF
This slide signifies the human resource recruitment dashboard to evaluate job interview status. It includes open positions by department, application received, offer acceptance ratio. Showcasing this set of slides titled HR Recruitment Dashboard To Monitor Hiring Interview Status Ideas PDF. The topics addressed in these templates are Application Received Department, Total Applicants, Shortlisted Candidates, Hired Candidates. All the content presented in this PPT design is completely editable. Download it and make adjustments in color, background, font etc. as per your unique business setting.
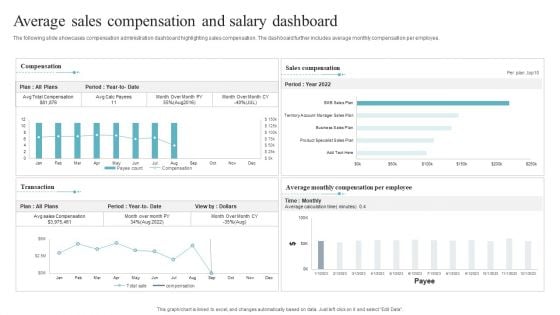
Average Sales Compensation And Salary Dashboard Introduction PDF
The following slide showcases compensation administration dashboard highlighting sales compensation. The dashboard further includes average monthly compensation per employee. Pitch your topic with ease and precision using this Average Sales Compensation And Salary Dashboard Introduction PDF. This layout presents information on Salary Dashboard, Average Sales Compensation. It is also available for immediate download and adjustment. So, changes can be made in the color, design, graphics or any other component to create a unique layout.
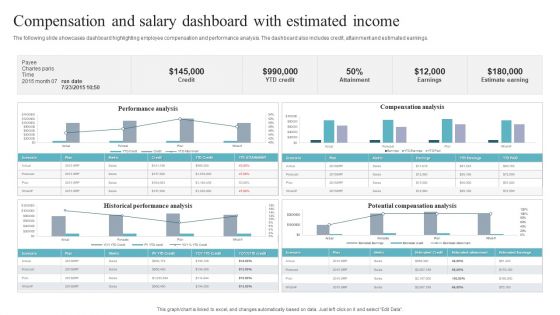
Compensation And Salary Dashboard With Estimated Income Ideas PDF
The following slide showcases dashboard highlighting employee compensation and performance analysis. The dashboard also includes credit, attainment and estimated earnings. Showcasing this set of slides titled Compensation And Salary Dashboard With Estimated Income Ideas PDF. The topics addressed in these templates are Performance Analysis, Compensation Analysis, Historical Performance Analysis. All the content presented in this PPT design is completely editable. Download it and make adjustments in color, background, font etc. as per your unique business setting.
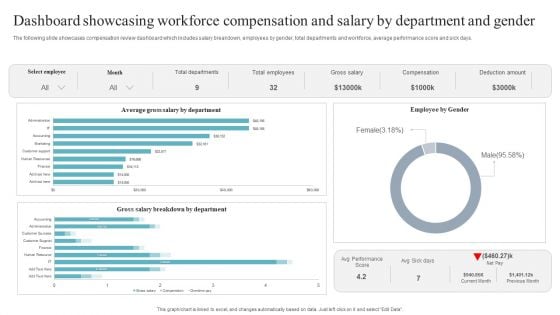
Dashboard Showcasing Workforce Compensation And Salary By Department And Gender Microsoft PDF
The following slide showcases compensation review dashboard which includes salary breakdown, employees by gender, total departments and workforce, average performance score and sick days. Showcasing this set of slides titled Dashboard Showcasing Workforce Compensation And Salary By Department And Gender Microsoft PDF. The topics addressed in these templates are Dashboard Showcasing, Workforce Compensation. All the content presented in this PPT design is completely editable. Download it and make adjustments in color, background, font etc. as per your unique business setting.
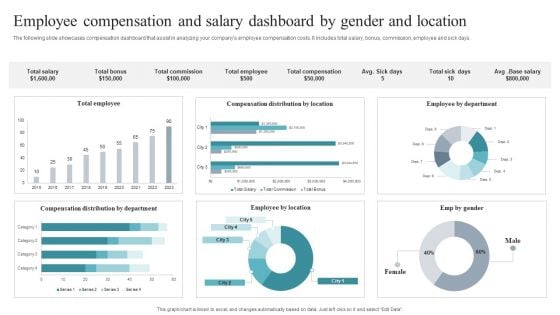
Employee Compensation And Salary Dashboard By Gender And Location Download PDF
The following slide showcases compensation dashboard that assist in analyzing your companys employee compensation costs. It includes total salary, bonus, commission, employee and sick days. Pitch your topic with ease and precision using this Employee Compensation And Salary Dashboard By Gender And Location Download PDF. This layout presents information on Employee By Location, Location, Employee. It is also available for immediate download and adjustment. So, changes can be made in the color, design, graphics or any other component to create a unique layout.
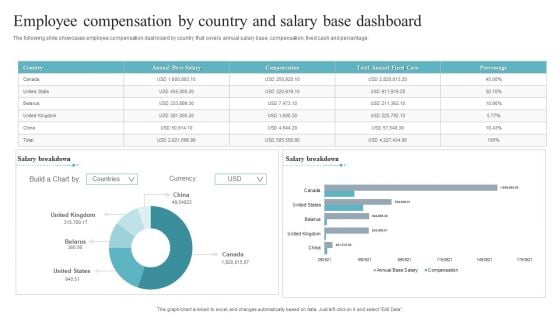
Employee Compensation By Country And Salary Base Dashboard Mockup PDF
The following slide showcases employee compensation dashboard by country that covers annual salary base, compensation, fixed cash and percentage. Pitch your topic with ease and precision using this Employee Compensation By Country And Salary Base Dashboard Mockup PDF. This layout presents information on Employee Compensation, Country Salary Base Dashboard. It is also available for immediate download and adjustment. So, changes can be made in the color, design, graphics or any other component to create a unique layout.
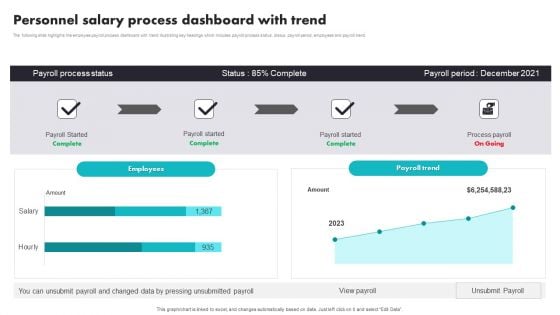
Personnel Salary Process Dashboard With Trend Brochure PDF
The following slide highlights the employee payroll process dashboard with trend illustrating key headings which includes payroll process status, status, payroll period, employees and payroll trend. Pitch your topic with ease and precision using this Personnel Salary Process Dashboard With Trend Brochure PDF. This layout presents information on Personnel Salary Process, Dashboard With Trend. It is also available for immediate download and adjustment. So, changes can be made in the color, design, graphics or any other component to create a unique layout.


 Continue with Email

 Home
Home


