Execution Plan
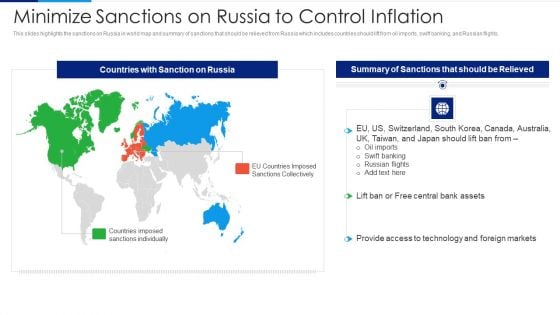
Russia Ukraine Conflict Effect Minimize Sanctions On Russia To Control Inflation Clipart PDF
This slides highlights the sanctions on Russia in world map and summary of sanctions that should be relieved from Russia which includes countries should lift from oil imports, swift banking, and Russian flights. Presenting Russia Ukraine Conflict Effect Minimize Sanctions On Russia To Control Inflation Clipart PDF to provide visual cues and insights. Share and navigate important information on one stages that need your due attention. This template can be used to pitch topics like Countries With Sanction On Russia, Summary Sanctions Relieved, Countries Imposed Sanctions Individually. In addtion, this PPT design contains high resolution images, graphics, etc, that are easily editable and available for immediate download.
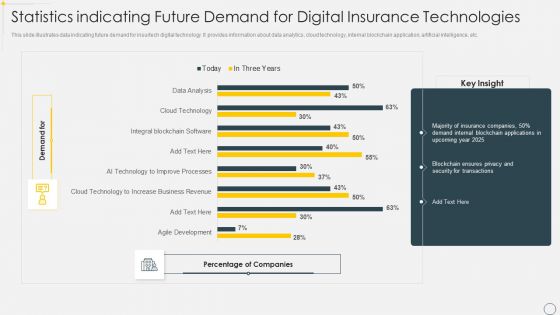
Statistics Indicating Future Demand For Digital Insurance Technologies Brochure PDF
This slide illustrates data indicating future demand for insurtech digital technology. It provides information about data analytics, cloud technology, internal blockchain application, artificial intelligence, etc. Pitch your topic with ease and precision using this Statistics Indicating Future Demand For Digital Insurance Technologies Brochure PDF. This layout presents information on Data Analytics, Cloud Technology, Internal Blockchain Application. It is also available for immediate download and adjustment. So, changes can be made in the color, design, graphics or any other component to create a unique layout.
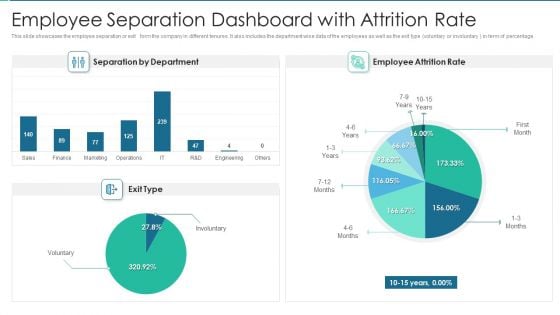
Employee Separation Dashboard With Attrition Rate Elements PDF
This slide showcases the employee separation or exit form the company in different tenures. It also includes the department wise data of the employees as well as the exit type voluntary or involuntary in term of percentage.Showcasing this set of slides titled Employee Separation Dashboard With Attrition Rate Elements PDF The topics addressed in these templates are Separation By Department, Employee Attrition Rate All the content presented in this PPT design is completely editable. Download it and make adjustments in color, background, font etc. as per your unique business setting.
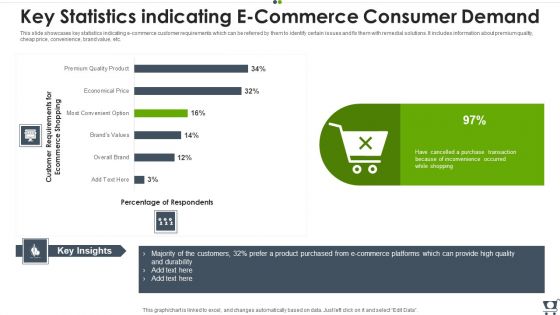
Key Statistics Indicating E Commerce Consumer Demand Professional PDF
This slide showcases key statistics indicating e commerce customer requirements which can be referred by them to identify certain issues and fix them with remedial solutions. It includes information about premium quality, cheap price, convenience, brand value, etc. Showcasing this set of slides titled Key Statistics Indicating E Commerce Consumer Demand Professional PDF. The topics addressed in these templates are E Commerce, Purchased, Product. All the content presented in this PPT design is completely editable. Download it and make adjustments in color, background, font etc. as per your unique business setting.
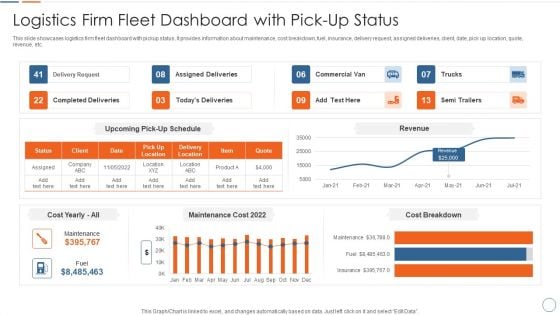
Logistics Firm Fleet Dashboard With Pick Up Status Introduction PDF
This slide showcases logistics firm fleet dashboard with pickup status. It provides information about maintenance, cost breakdown, fuel, insurance, delivery request, assigned deliveries, client, date, pick up location, quote, revenue, etc. Pitch your topic with ease and precision using this Logistics Firm Fleet Dashboard With Pick Up Status Introduction PDF. This layout presents information on Logistics Firm Fleet Dashboard With Pick Up Status. It is also available for immediate download and adjustment. So, changes can be made in the color, design, graphics or any other component to create a unique layout.
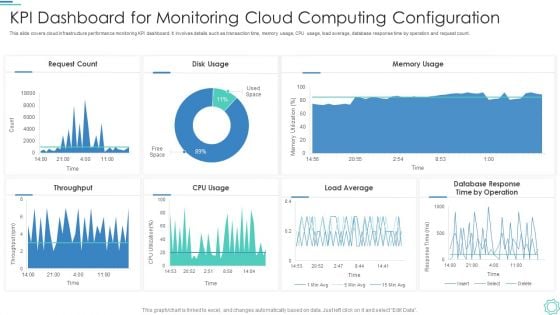
Kpi Dashboard For Monitoring Cloud Computing Configuration Portrait PDF
This slide covers cloud infrastructure performance monitoring KPI dashboard. It involves details such as transaction time, memory usage, CPU usage, load average, database response time by operation and request count.Showcasing this set of slides titled Kpi Dashboard For Monitoring Cloud Computing Configuration Portrait PDF. The topics addressed in these templates are Request Count, Disk Usage, Memory Usage. All the content presented in this PPT design is completely editable. Download it and make adjustments in color, background, font etc. as per your unique business setting.
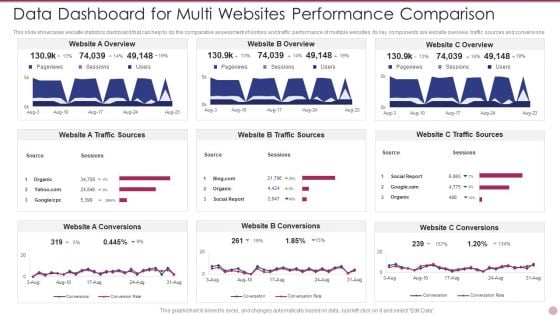
Data Dashboard For Multi Websites Performance Comparison Themes PDF
This slide showcases website statistics dashboard that can help to do the comparative assessment of visitors and traffic performance of multiple websites. Its key components are website overview, traffic sources and conversions. Showcasing this set of slides titled Data Dashboard For Multi Websites Performance Comparison Themes PDF. The topics addressed in these templates are Data Dashboard For Multi Websites Performance Comparison. All the content presented in this PPT design is completely editable. Download it and make adjustments in color, background, font etc. as per your unique business setting.
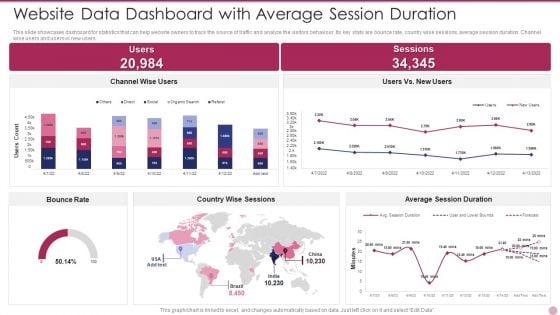
Website Data Dashboard With Average Session Duration Ideas PDF
This slide showcases dashboard for statistics that can help website owners to track the source of traffic and analyze the visitors behaviour. Its key stats are bounce rate, country wise sessions, average session duration. Channel wise users and users vs new users. Pitch your topic with ease and precision using this Website Data Dashboard With Average Session Duration Ideas PDF. This layout presents information on Website Data Dashboard With Average Session Duration. It is also available for immediate download and adjustment. So, changes can be made in the color, design, graphics or any other component to create a unique layout.
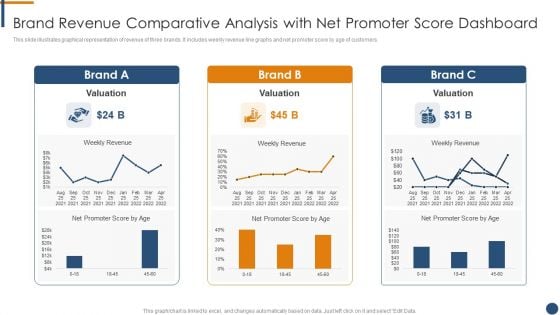
Brand Revenue Comparative Analysis With Net Promoter Score Dashboard Mockup PDF
This slide illustrates graphical representation of revenue of three brands. It includes weekly revenue line graphs and net promoter score by age of customers.Pitch your topic with ease and precision using this Brand Revenue Comparative Analysis With Net Promoter Score Dashboard Mockup PDF. This layout presents information on Brand Revenue Comparative Analysis With Net Promoter Score Dashboard. It is also available for immediate download and adjustment. So, changes can be made in the color, design, graphics or any other component to create a unique layout.
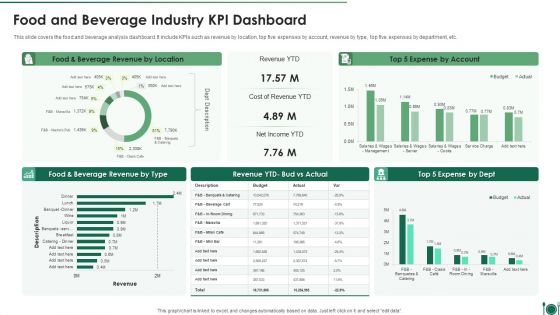
Food And Beverage Industry Kpi Dashboard Professional PDF
This slide covers the food and beverage analysis dashboard. It include KPIs such as revenue by location, top five expenses by account, revenue by type, top five expenses by department, etc.Showcasing this set of slides titled Food And Beverage Industry Kpi Dashboard Professional PDF. The topics addressed in these templates are Food And Beverage Industry KPI Dashboard. All the content presented in this PPT design is completely editable. Download it and make adjustments in color, background, font etc. as per your unique business setting
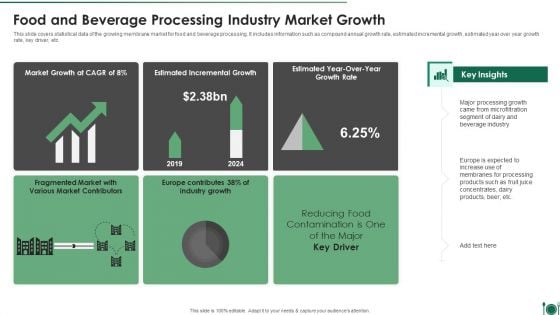
Food And Beverage Processing Industry Market Growth Themes PDF
This slide covers statistical data of the growing membrane market for food and beverage processing. It includes information such as compound annual growth rate, estimated incremental growth, estimated year over year growth rate, key driver, etc. Showcasing this set of slides titled Food And Beverage Processing Industry Market Growth Themes PDF. The topics addressed in these templates are Market Growth, Estimated Incremental Growth, Growth Rate. All the content presented in this PPT design is completely editable. Download it and make adjustments in color, background, font etc. as per your unique business setting.
Major Statistics Illustrating Digital Marketing Campaign Results Icons PDF
The purpose of this slide is to showcase major statistics of digital marketing results. The statistics covered in the slide are consumers who watch online videos by different age group and the various advertising channels which have the highest conversion rates. Showcasing this set of slides titled Major Statistics Illustrating Digital Marketing Campaign Results Icons PDF. The topics addressed in these templates are Major Statistics Illustrating Digital Marketing Campaign Results. All the content presented in this PPT design is completely editable. Download it and make adjustments in color, background, font etc. as per your unique business setting.
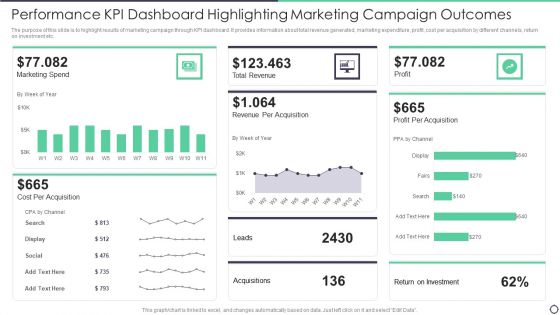
Performance Kpi Dashboard Highlighting Marketing Campaign Outcomes Topics PDF
The purpose of this slide is to highlight results of marketing campaign through KPI dashboard. It provides information about total revenue generated, marketing expenditure, profit, cost per acquisition by different channels, return on investment etc. Pitch your topic with ease and precision using this Performance Kpi Dashboard Highlighting Marketing Campaign Outcomes Topics PDF. This layout presents information on Cost, Marketing, Revenue. It is also available for immediate download and adjustment. So, changes can be made in the color, design, graphics or any other component to create a unique layout.
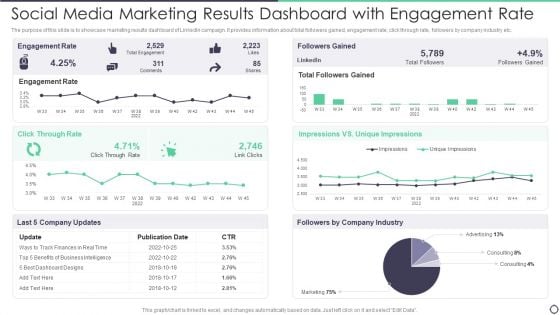
Social Media Marketing Results Dashboard With Engagement Rate Brochure PDF
The purpose of this slide is to showcase marketing results dashboard of LinkedIn campaign. It provides information about total followers gained, engagement rate, click through rate, followers by company industry etc. Pitch your topic with ease and precision using this Social Media Marketing Results Dashboard With Engagement Rate Brochure PDF. This layout presents information on Social Media Marketing Results Dashboard With Engagement Rate. It is also available for immediate download and adjustment. So, changes can be made in the color, design, graphics or any other component to create a unique layout.
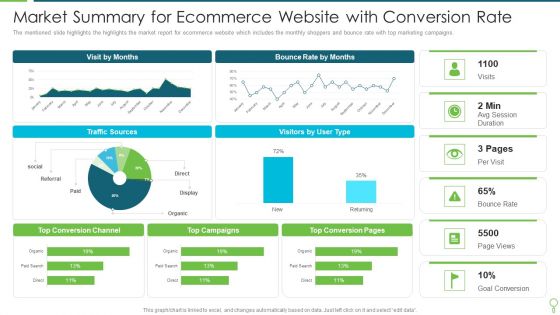
Market Summary For Ecommerce Website With Conversion Rate Diagrams PDF
The mentioned slide highlights the highlights the market report for ecommerce website which includes the monthly shoppers and bounce rate with top marketing campaigns. Pitch your topic with ease and precision using this Market Summary For Ecommerce Website With Conversion Rate Diagrams PDF. This layout presents information on Market Summary For Ecommerce Website With Conversion Rate. It is also available for immediate download and adjustment. So, changes can be made in the color, design, graphics or any other component to create a unique layout.
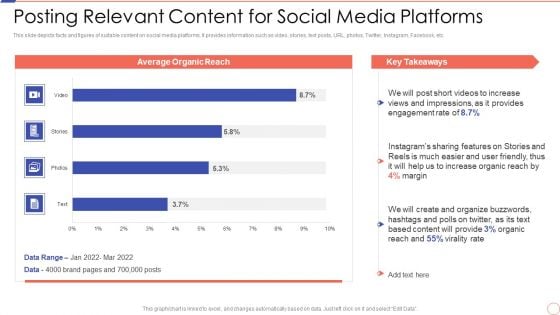
Social Media Engagement To Increase Customer Engagement Posting Relevant Content For Social Media Platforms Structure PDF
This slide depicts facts and figures of suitable content on social media platforms. It provides information such as video, stories, text posts, URL, photos, Twitter, Instagram, Facebook, etc. Showcasing this set of slides titled Social Media Engagement To Increase Customer Engagement Posting Relevant Content For Social Media Platforms Structure PDF. The topics addressed in these templates are Posting Relevant Content For Social Media Platforms. All the content presented in this PPT design is completely editable. Download it and make adjustments in color, background, font etc. as per your unique business setting.
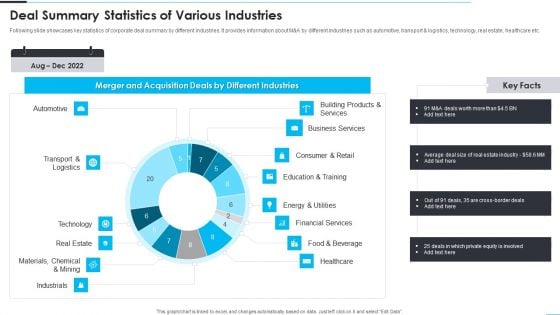
Deal Summary Statistics Of Various Industries Topics PDF
Following slide showcases key statistics of corporate deal summary by different industries. It provides information about M and A by different industries such as automotive, transport and logistics, technology, real estate, healthcare etc. Showcasing this set of slides titled Deal Summary Statistics Of Various Industries Topics PDF. The topics addressed in these templates are Technology, Materials, Industrials. All the content presented in this PPT design is completely editable. Download it and make adjustments in color, background, font etc. as per your unique business setting.
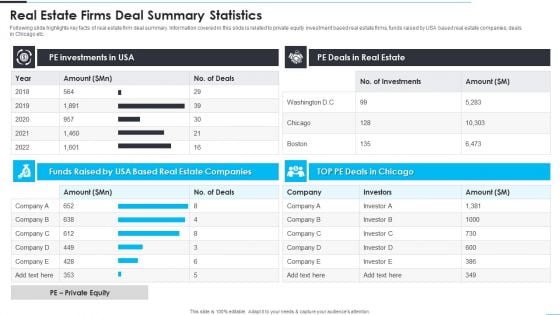
Real Estate Firms Deal Summary Statistics Demonstration PDF
Following slide highlights key facts of real estate firm deal summary. Information covered in this slide is related to private equity investment based real estate firms, funds raised by USA based real estate companies, deals in Chicago etc. Pitch your topic with ease and precision using this Real Estate Firms Deal Summary Statistics Demonstration PDF. This layout presents information on Real Estate Firms Deal Summary Statistics. It is also available for immediate download and adjustment. So, changes can be made in the color, design, graphics or any other component to create a unique layout.
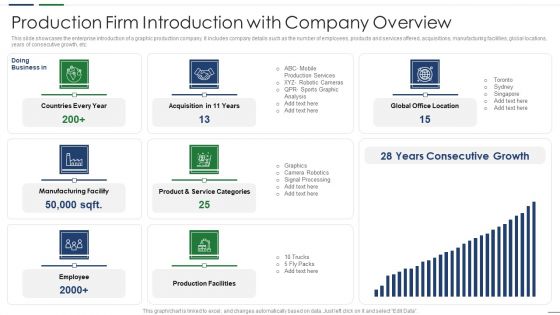
Production Firm Introduction With Company Overview Portrait PDF
This slide showcases the enterprise introduction of a graphic production company. It includes company details such as the number of employees, products and services offered, acquisitions, manufacturing facilities, global locations, years of consecutive growth, etc. Showcasing this set of slides titled Production Firm Introduction With Company Overview Portrait PDF. The topics addressed in these templates are Graphic, Services, Global. All the content presented in this PPT design is completely editable. Download it and make adjustments in color, background, font etc. as per your unique business setting.
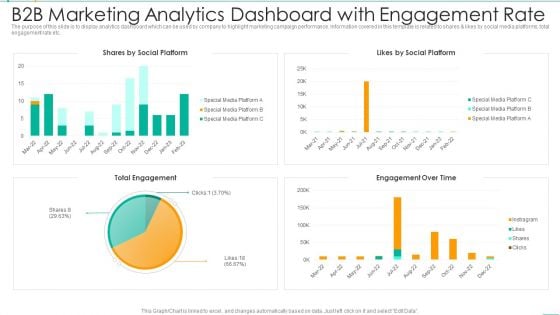
B2b Marketing Analytics Dashboard With Engagement Rate Microsoft PDF
The purpose of this slide is to display analytics dashboard which can be used by company to highlight marketing campaign performance. Information covered in this template is related to shares and likes by social media platforms, total engagement rate etc. Showcasing this set of slides titled B2b Marketing Analytics Dashboard With Engagement Rate Microsoft PDF. The topics addressed in these templates are B2b Marketing Analytics Dashboard With Engagement Rate. All the content presented in this PPT design is completely editable. Download it and make adjustments in color, background, font etc. as per your unique business setting.
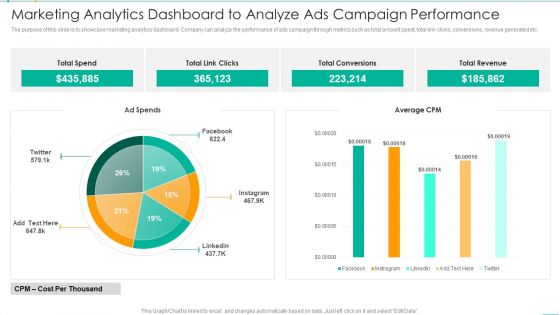
Marketing Analytics Dashboard To Analyze Ads Campaign Performance Microsoft PDF
The purpose of this slide is to showcase marketing analytics dashboard. Company can analyze the performance of ads campaign through metrics such as total amount spent, total link clicks, conversions, revenue generated etc. Showcasing this set of slides titled Marketing Analytics Dashboard To Analyze Ads Campaign Performance Microsoft PDF. The topics addressed in these templates are Marketing Analytics Dashboard To Analyze Ads Campaign Performance. All the content presented in this PPT design is completely editable. Download it and make adjustments in color, background, font etc. as per your unique business setting.
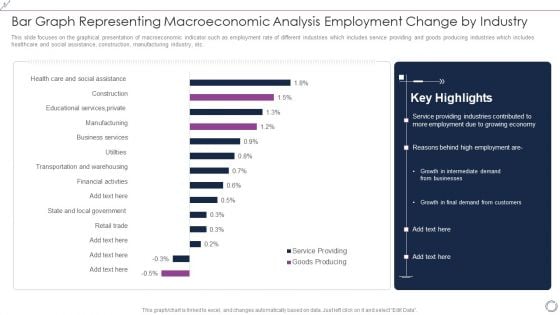
Bar Graph Representing Macroeconomic Analysis Employment Change By Industry Background PDF
This slide focuses on the graphical presentation of macroeconomic indicator such as employment rate of different industries which includes service providing and goods producing industries which includes healthcare and social assistance, construction, manufacturing industry, etc. Pitch your topic with ease and precision using this Bar Graph Representing Macroeconomic Analysis Employment Change By Industry Background PDF. This layout presents information on Goods Producing, Service Providing, Financial, Business. It is also available for immediate download and adjustment. So, changes can be made in the color, design, graphics or any other component to create a unique layout.
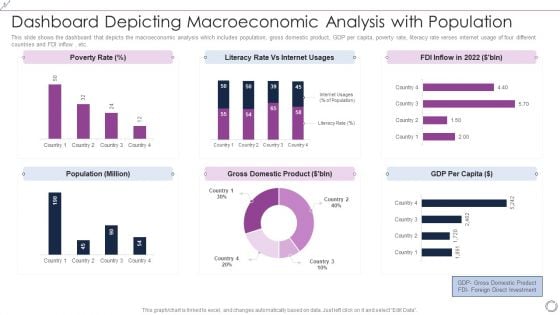
Dashboard Depicting Macroeconomic Analysis With Population Inspiration PDF
This slide shows the dashboard that depicts the macroeconomic analysis which includes population, gross domestic product, GDP per capita, poverty rate, literacy rate verses internet usage of four different countries and FDI inflow, etc. Pitch your topic with ease and precision using this Dashboard Depicting Macroeconomic Analysis With Population Inspiration PDF. This layout presents information on Poverty Rate, Literacy Rate Vs Internet Usages, FDI Inflow In 2022. It is also available for immediate download and adjustment. So, changes can be made in the color, design, graphics or any other component to create a unique layout.
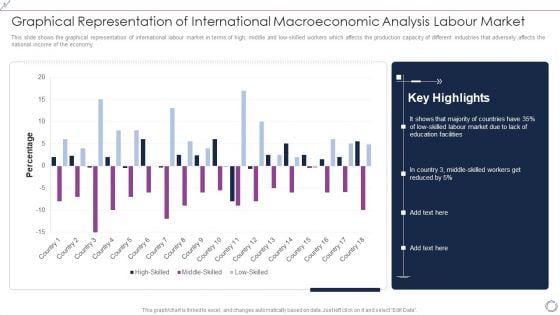
Graphical Representation Of International Macroeconomic Analysis Labour Market Diagrams PDF
This slide shows the graphical representation of international labour market in terms of high, middle and low-skilled workers which affects the production capacity of different industries that adversely affects the national income of the economy. Pitch your topic with ease and precision using this Graphical Representation Of International Macroeconomic Analysis Labour Market Diagrams PDF. This layout presents information on High Skilled, Middle Skilled, Low Skilled. It is also available for immediate download and adjustment. So, changes can be made in the color, design, graphics or any other component to create a unique layout.
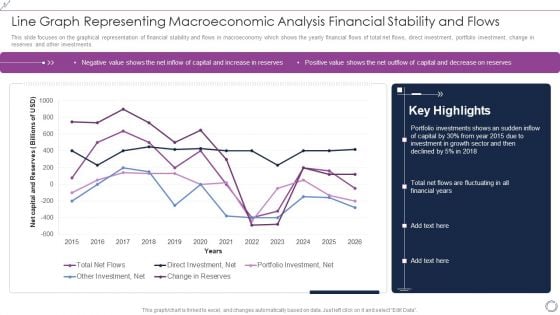
Line Graph Representing Macroeconomic Analysis Financial Stability And Flows Rules PDF
This slide focuses on the graphical representation of financial stability and flows in macroeconomy which shows the yearly financial flows of total net flows, direct investment, portfolio investment, change in reserves and other investments. Showcasing this set of slides titled Line Graph Representing Macroeconomic Analysis Financial Stability And Flows Rules PDF. The topics addressed in these templates are Total Net Flows, Direct Investment, Net, Portfolio Investment, Net. All the content presented in this PPT design is completely editable. Download it and make adjustments in color, background, font etc. as per your unique business setting.
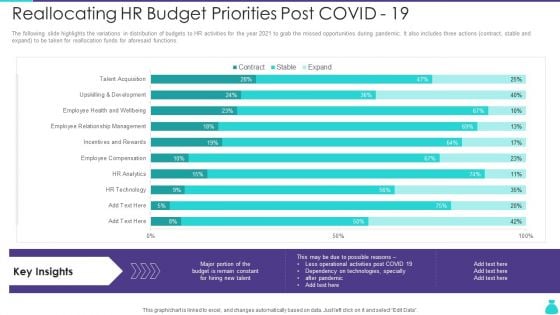
Reallocating HR Budget Priorities Post Covid 19 Ppt PowerPoint Presentation Gallery Graphics Download PDF
The following slide highlights the variations in distribution of budgets to HR activities for the year 2021 to grab the missed opportunities during pandemic. It also includes three actions contract, stable and expand to be taken for reallocation funds for aforesaid functions. Pitch your topic with ease and precision using this Reallocating HR Budget Priorities Post Covid 19 Ppt PowerPoint Presentation Gallery Graphics Download PDF. This layout presents information on HR Technology, HR Analytics, Employee Compensation. It is also available for immediate download and adjustment. So, changes can be made in the color, design, graphics or any other component to create a unique layout.
Real Estate Sales Tracking Dashboard With Inquiry Referrals Ppt PowerPoint Presentation File Samples PDF
This slide showcases dashboard to track property sales KPIs for smooth flow of operations. It includes information such as rent, social media, digital ads, agent wise sales, etc. Showcasing this set of slides titled Real Estate Sales Tracking Dashboard With Inquiry Referrals Ppt PowerPoint Presentation File Samples PDF. The topics addressed in these templates are Property Inquiry Referrals, Properties Sold And Rent By Agent, Sales By Religion, Sales Target. All the content presented in this PPT design is completely editable. Download it and make adjustments in color, background, font etc. as per your unique business setting.
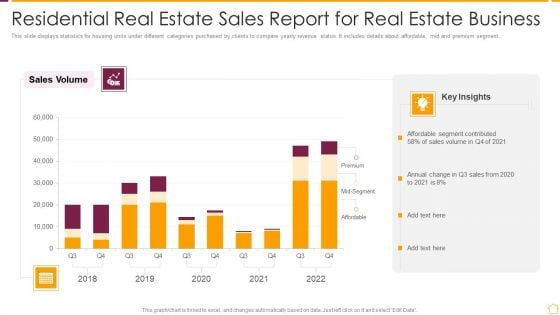
Residential Real Estate Sales Report For Real Estate Business Ppt PowerPoint Presentation File Master Slide PDF
This slide displays statistics for housing units under different categories purchased by clients to compare yearly revenue status. It includes details about affordable, mid and premium segment. Pitch your topic with ease and precision using this Residential Real Estate Sales Report For Real Estate Business Ppt PowerPoint Presentation File Master Slide PDF. This layout presents information on Affordable Segment Contributed, Sales Volume, 2018 To 2022. It is also available for immediate download and adjustment. So, changes can be made in the color, design, graphics or any other component to create a unique layout.
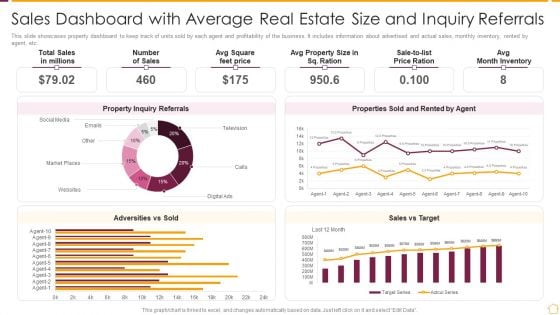
Sales Dashboard With Average Real Estate Size And Inquiry Referrals Ppt PowerPoint Presentation Gallery Slides PDF
This slide showcases property dashboard to keep track of units sold by each agent and profitability of the business. It includes information about advertised and actual sales, monthly inventory, rented by agent, etc. Showcasing this set of slides titled Sales Dashboard With Average Real Estate Size And Inquiry Referrals Ppt PowerPoint Presentation Gallery Slides PDF. The topics addressed in these templates are Month Inventory. All the content presented in this PPT design is completely editable. Download it and make adjustments in color, background, font etc. as per your unique business setting.
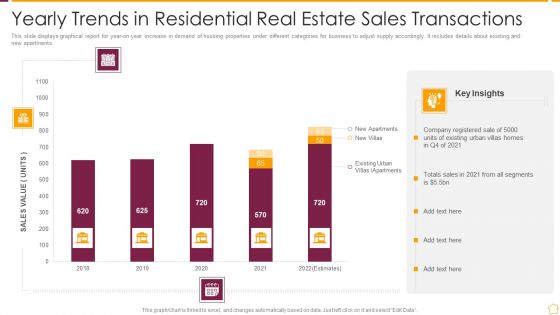
Yearly Trends In Residential Real Estate Sales Transactions Ppt PowerPoint Presentation Gallery Example PDF
This slide displays graphical report for year-on-year increase in demand of housing properties under different categories for business to adjust supply accordingly. It includes details about existing and new apartments. Showcasing this set of slides titled Yearly Trends In Residential Real Estate Sales Transactions Ppt PowerPoint Presentation Gallery Example PDF. The topics addressed in these templates are Company Registered Sale, Sales Value, 2018 To 2022. All the content presented in this PPT design is completely editable. Download it and make adjustments in color, background, font etc. as per your unique business setting.
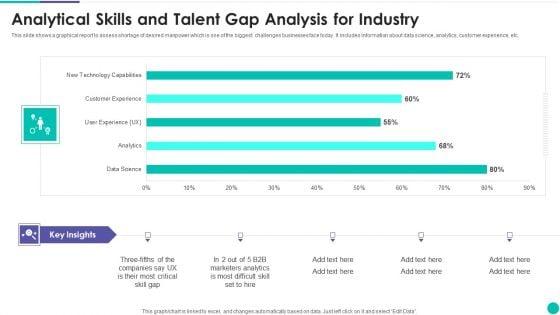
Analytical Skills And Talent Gap Analysis For Industry Template PDF
This slide shows a graphical report to assess shortage of desired manpower which is one of the biggest challenges businesses face today. It includes information about data science, analytics, customer experience, etc. Showcasing this set of slides titled Analytical Skills And Talent Gap Analysis For Industry Template PDF. The topics addressed in these templates are Marketers, Analytics, Data Science. All the content presented in this PPT design is completely editable. Download it and make adjustments in color, background, font etc. as per your unique business setting.
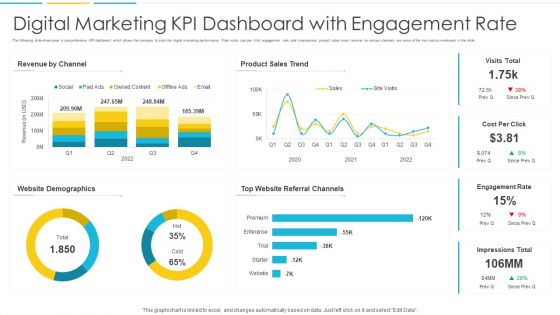
Digital Marketing KPI Dashboard With Engagement Rate Background PDF
The following slide showcases a comprehensive KPI dashboard which allows the company to track the digital marketing performance. Total visits, cost per click, engagement rate, total impressions, product sales trend, revenue by various channels are some of the key metrics mentioned in the slide. Showcasing this set of slides titled Digital Marketing KPI Dashboard With Engagement Rate Background PDF. The topics addressed in these templates are Demographics, Revenue, Sales. All the content presented in this PPT design is completely editable. Download it and make adjustments in color, background, font etc. as per your unique business setting.
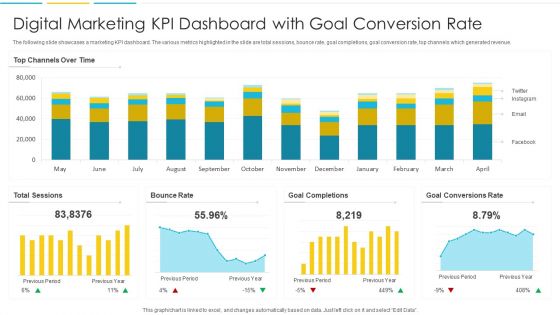
Digital Marketing KPI Dashboard With Goal Conversion Rate Ideas PDF
The following slide showcases a marketing KPI dashboard. The various metrics highlighted in the slide are total sessions, bounce rate, goal completions, goal conversion rate, top channels which generated revenue. Pitch your topic with ease and precision using this Digital Marketing KPI Dashboard With Goal Conversion Rate Ideas PDF. This layout presents information on Rate, Goal, Conversions. It is also available for immediate download and adjustment. So, changes can be made in the color, design, graphics or any other component to create a unique layout.
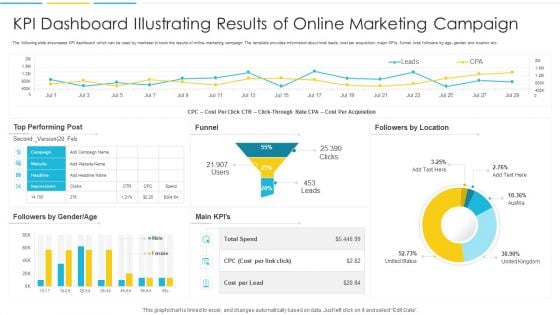
KPI Dashboard Illustrating Results Of Online Marketing Campaign Slides PDF
The following slide showcases KPI dashboard which can be used by marketer to track the results of online marketing campaign. The template provides information about total leads, cost per acquisition, major KPIs, funnel, total followers by age, gender and location etc. Showcasing this set of slides titled KPI Dashboard Illustrating Results Of Online Marketing Campaign Slides PDF. The topics addressed in these templates are Cost, Location, Performing. All the content presented in this PPT design is completely editable. Download it and make adjustments in color, background, font etc. as per your unique business setting
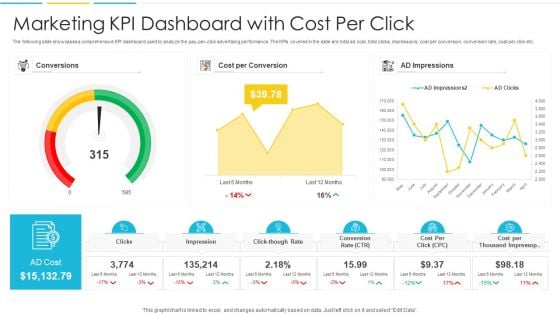
Marketing KPI Dashboard With Cost Per Click Infographics PDF
The following slide showcases a comprehensive KPI dashboard used to analyze the pay-per-click advertising performance. The KPIs covered in the slide are total ad cost, total clicks, impressions, cost per conversion, conversion rate, cost per click etc. Pitch your topic with ease and precision using this Marketing KPI Dashboard With Cost Per Click Infographics PDF. This layout presents information on Conversions, Cost, Impressions. It is also available for immediate download and adjustment. So, changes can be made in the color, design, graphics or any other component to create a unique layout.
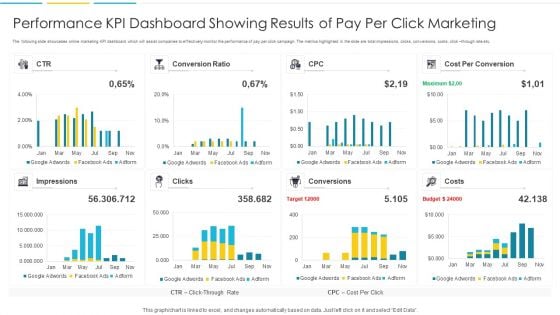
Performance KPI Dashboard Showing Results Of Pay Per Click Marketing Portrait PDF
The following slide showcases online marketing KPI dashboard which will assist companies to effectively monitor the performance of pay per click campaign. The metrics highlighted in the slide are total impressions, clicks, conversions, costs, click through rate etc. Pitch your topic with ease and precision using this Performance KPI Dashboard Showing Results Of Pay Per Click Marketing Portrait PDF. This layout presents information on Impressions, Target, Budget. It is also available for immediate download and adjustment. So, changes can be made in the color, design, graphics or any other component to create a unique layout.
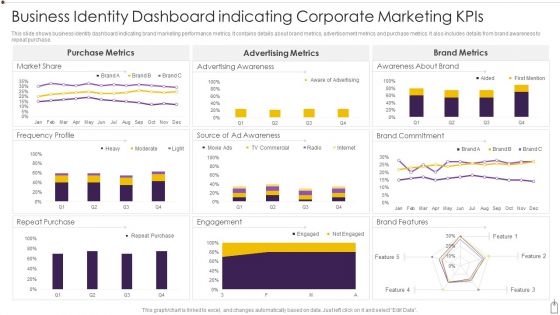
Business Identity Dashboard Indicating Corporate Marketing Kpis Diagrams PDF
This slide shows business identity dashboard indicating brand marketing performance metrics. It contains details about brand metrics, advertisement metrics and purchase metrics. It also includes details from brand awareness to repeat purchase. Showcasing this set of slides titled Business Identity Dashboard Indicating Corporate Marketing Kpis Diagrams PDF. The topics addressed in these templates are Purchase, Engagement, Market Share. All the content presented in this PPT design is completely editable. Download it and make adjustments in color, background, font etc. as per your unique business setting.
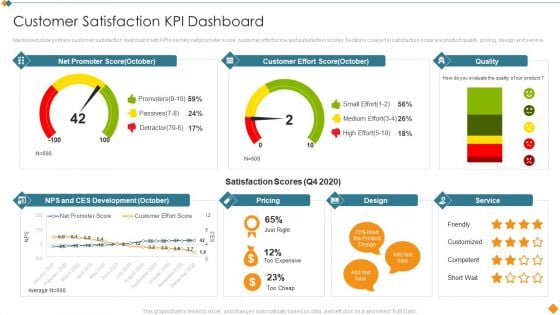
Maintaining Partner Relationships Customer Satisfaction KPI Dashboard Inspiration PDF
Mentioned slide portrays customer satisfaction dashboard with KPIs namely net promoter score, customer effort score and satisfaction scores. Sections covered in satisfaction score are product quality, pricing, design and service. Deliver and pitch your topic in the best possible manner with this Maintaining Partner Relationships Customer Satisfaction KPI Dashboard Inspiration PDF. Use them to share invaluable insights on Net Promoter Score, Customer Effort Score, Quality, Service, Pricing and impress your audience. This template can be altered and modified as per your expectations. So, grab it now.
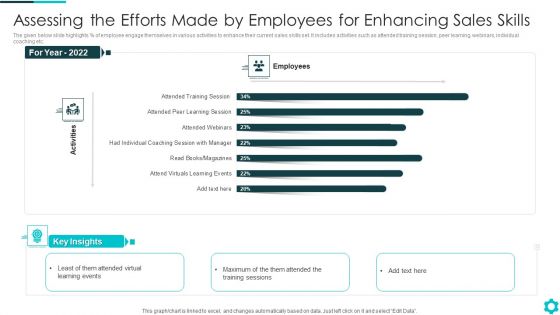
Assessing The Efforts Made By Employees For Enhancing Sales Skills Brochure PDF
The given below slide highlights of employee engage themselves in various activities to enhance their current sales skills set. It includes activities such as attended training session, peer learning, webinars, individual coaching etc.Pitch your topic with ease and precision using this Assessing The Efforts Made By Employees For Enhancing Sales Skills Brochure PDF This layout presents information on Learning Events, Maximum Of The Them Attended, Training Sessions It is also available for immediate download and adjustment. So, changes can be made in the color, design, graphics or any other component to create a unique layout.
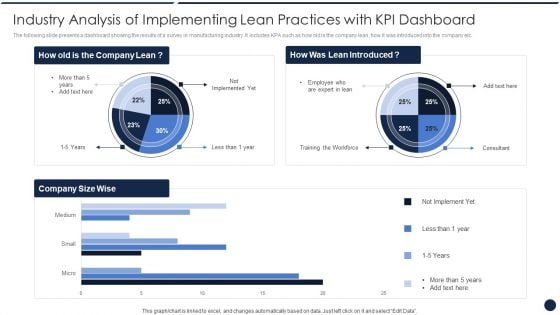
Industry Analysis Of Implementing Lean Practices With KPI Dashboard Sample PDF
The following slide presents a dashboard showing the results of a survey in manufacturing industry. It includes KPA such as how old is the company lean, how it was introduced into the company etc. Showcasing this set of slides titled Industry Analysis Of Implementing Lean Practices With KPI Dashboard Sample PDF The topics addressed in these templates are Industry Analysis, Implementing Lean, Practices With KPI Dashboard All the content presented in this PPT design is completely editable. Download it and make adjustments in color, background, font etc. as per your unique business setting.

Employee Feedback Dashboard With Key Metrics Elements PDF
The following slide depicts the key insights of the feedback survey to gauge employee engagement at different department levels. It includes metrics such as engagement score, response rate, no. of comments etc.Showcasing this set of slides titled Employee Feedback Dashboard With Key Metrics Elements PDF The topics addressed in these templates are Employee Feedback Dashboard With Key Metrics All the content presented in this PPT design is completely editable. Download it and make adjustments in color, background, font etc. as per your unique business setting.
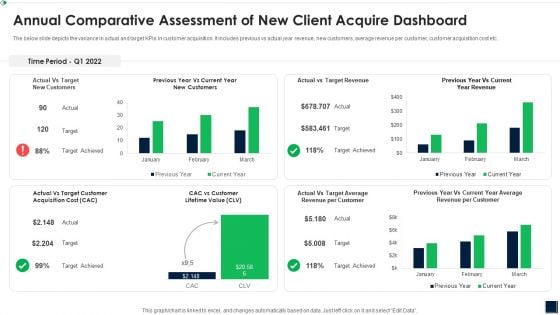
Annual Comparative Assessment Of New Client Acquire Dashboard Topics PDF
The below slide depicts the variance in actual and target KPIs in customer acquisition. It includes previous vs actual year revenue, new customers, average revenue per customer, customer acquisition cost etc. Showcasing this set of slides titled Annual Comparative Assessment Of New Client Acquire Dashboard Topics PDF The topics addressed in these templates are Annual Comparative Assessment OF New Client Acquire Dashboard All the content presented in this PPT design is completely editable. Download it and make adjustments in color, background, font etc. as per your unique business setting.
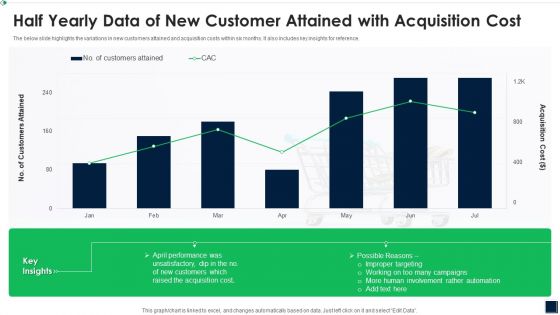
Half Yearly Data Of New Customer Attained With Acquisition Cost Mockup PDF
The below slide highlights the variations in new customers attained and acquisition costs within six months. It also includes key insights for reference.Showcasing this set of slides titled Half Yearly Data Of New Customer Attained With Acquisition Cost Mockup PDF The topics addressed in these templates are Half Yearly Data OF New Customer Attained WITH Acquisition Cost All the content presented in this PPT design is completely editable. Download it and make adjustments in color, background, font etc. as per your unique business setting.
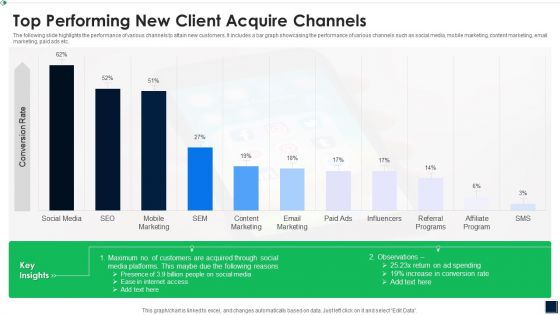
Top Performing New Client Acquire Channels Elements PDF
The following slide highlights the performance of various channels to attain new customers. It includes a bar graph showcasing the performance of various channels such as social media, mobile marketing, content marketing, email marketing, paid ads etc. Showcasing this set of slides titled Top Performing New Client Acquire Channels Elements PDF The topics addressed in these templates are Top Performing New Client Acquire Channels All the content presented in this PPT design is completely editable. Download it and make adjustments in color, background, font etc. as per your unique business setting.

Team Mentoring Dashboard With Client And Training Details Sample PDF
This slide covers all the information related to the clients to whom coaching has been provided and in certain number of hours how many sessions they attended. It also includes the total earnings , coaching hours and the name of top clients.Pitch your topic with ease and precision using this Team Mentoring Dashboard With Client And Training Details Sample PDF This layout presents information on Team Mentoring Dashboard With Client And Training Details It is also available for immediate download and adjustment. So, changes can be made in the color, design, graphics or any other component to create a unique layout.
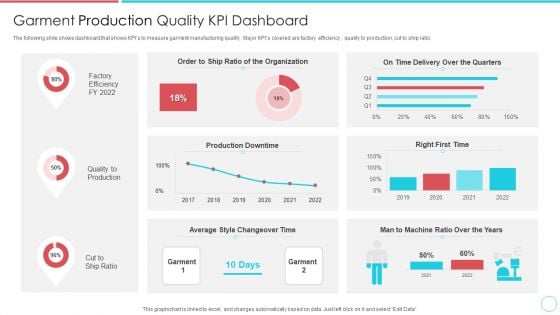
Garment Production Quality KPI Dashboard Portrait PDF
The following slide shows dashboard that shows KPIs to measure garment manufacturing quality . Major KPIs covered are factory efficiency , quality to production, cut to ship ratio.Pitch your topic with ease and precision using this Garment Production Quality KPI Dashboard Portrait PDF This layout presents information on Production Downtime, Time Delivery Over The Quarters, Average Style Changeover Time It is also available for immediate download and adjustment. So, changes can be made in the color, design, graphics or any other component to create a unique layout.
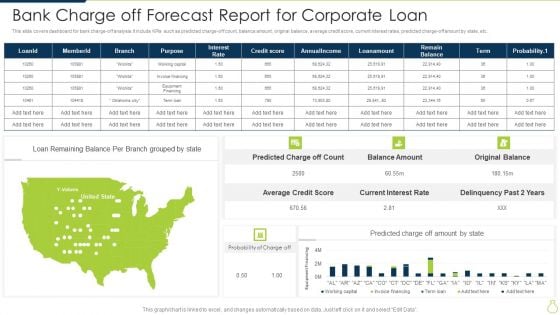
Bank Charge Off Forecast Report For Corporate Loan Diagrams PDF
This slide covers dashboard for bank charge-off analysis. It include KPIs such as predicted charge-off count, balance amount, original balance, average credit score, current interest rates, predicted charge off amount by state, etc. Showcasing this set of slides titled Bank Charge Off Forecast Report For Corporate Loan Diagrams PDF. The topics addressed in these templates are Balance Amount, Original Balance, Delinquency Past. All the content presented in this PPT design is completely editable. Download it and make adjustments in color, background, font etc. as per your unique business setting.
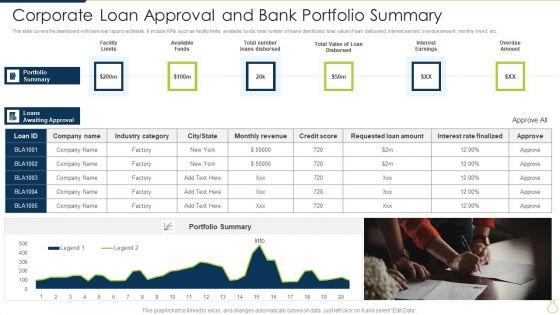
Corporate Loan Approval And Bank Portfolio Summary Portrait PDF
This slide covers the dashboard with bank loan approval details. It include KPIs such as facility limits, available funds, total number of loans distributed, total value of loan disbursed, interest earned, overdue amount, monthly trend, etc. Pitch your topic with ease and precision using this Corporate Loan Approval And Bank Portfolio Summary Portrait PDF. This layout presents information on Interest Earnings, Available Funds, Facility Limits. It is also available for immediate download and adjustment. So, changes can be made in the color, design, graphics or any other component to create a unique layout.
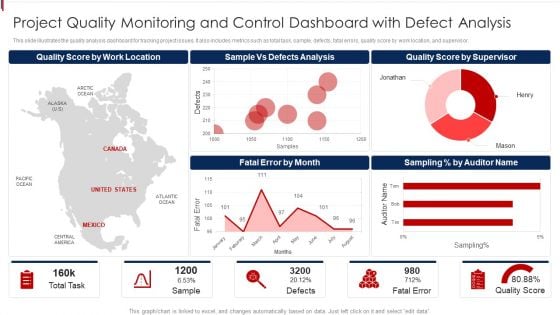
Project Quality Monitoring And Control Dashboard With Defect Analysis Demonstration PDF
This slide illustrates the quality analysis dashboard for tracking project issues. It also includes metrics such as total task, sample, defects, fatal errors, quality score by work location, and supervisor. Pitch your topic with ease and precision using this Project Quality Monitoring And Control Dashboard With Defect Analysis Demonstration PDF. This layout presents information on Location, Analysis, Supervisor. It is also available for immediate download and adjustment. So, changes can be made in the color, design, graphics or any other component to create a unique layout.
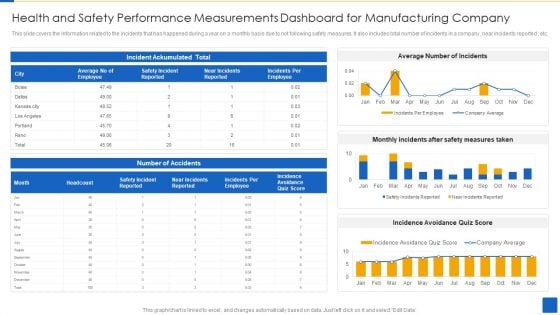
Health And Safety Performance Measurements Dashboard For Manufacturing Company Guidelines PDF
This slide covers the information related to the incidents that has happened during a year on a monthly basis due to not following safety measures. It also includes total number of incidents in a company, near incidents reported , etc. Showcasing this set of slides titled Health And Safety Performance Measurements Dashboard For Manufacturing Company Guidelines PDF The topics addressed in these templates are Incident Ackumulated , Incidents After Safety, Incidence Avoidance All the content presented in this PPT design is completely editable. Download it and make adjustments in color, background, font etc. as per your unique business setting.
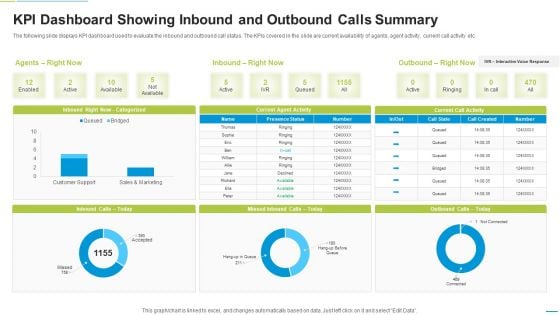
KPI Dashboard Showing Inbound And Outbound Calls Summary Formats PDF
The following slide displays KPI dashboard used to evaluate the inbound and outbound call status. The KPIs covered in the slide are current availability of agents, agent activity, current call activity etc. Showcasing this set of slides titled KPI Dashboard Showing Inbound And Outbound Calls Summary Formats PDF. The topics addressed in these templates are Current Agent Activity, Current Call Activity, Inbound Categorized. All the content presented in this PPT design is completely editable. Download it and make adjustments in color, background, font etc. as per your unique business setting.
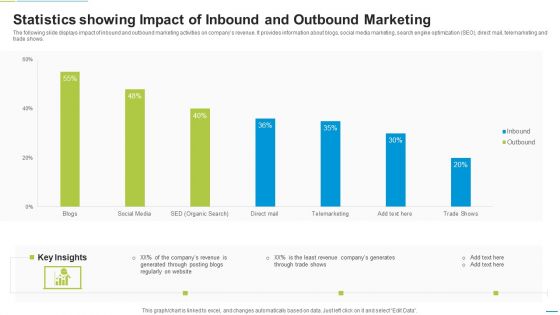
Statistics Showing Impact Of Inbound And Outbound Marketing Diagrams PDF
The following slide displays impact of inbound and outbound marketing activities on companys revenue. It provides information about blogs, social media marketing, search engine optimization SEO, direct mail, telemarketing and trade shows. Pitch your topic with ease and precision using this Statistics Showing Impact Of Inbound And Outbound Marketing Diagrams PDF. This layout presents information on Telemarketing, Social Media, Blogs. It is also available for immediate download and adjustment. So, changes can be made in the color, design, graphics or any other component to create a unique layout.
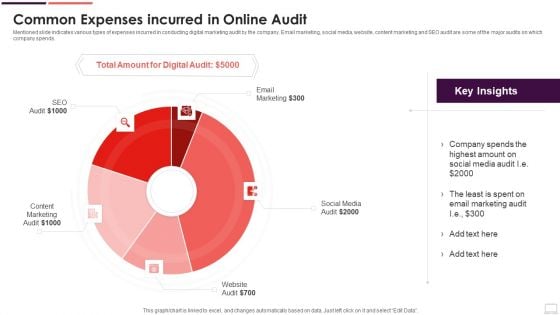
Common Expenses Incurred In Online Audit Clipart PDF
Mentioned slide indicates various types of expenses incurred in conducting digital marketing audit by the company. Email marketing, social media, website, content marketing and SEO audit are some of the major audits on which company spends. Pitch your topic with ease and precision using this Common Expenses Incurred In Online Audit Clipart PDF. This layout presents information on Marketing Audit, Social Media, Email Marketing. It is also available for immediate download and adjustment. So, changes can be made in the color, design, graphics or any other component to create a unique layout.
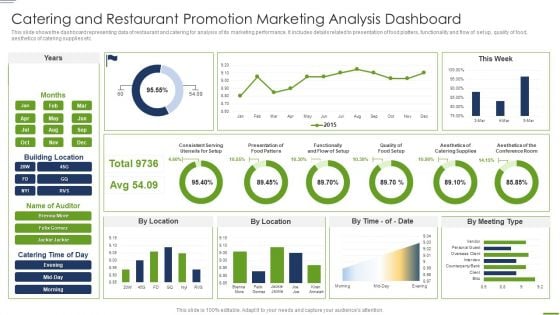
Catering And Restaurant Promotion Marketing Analysis Dashboard Graphics PDF
This slide shows the dashboard representing data of restaurant and catering for analysis of its marketing performance. It includes details related to presentation of food platters, functionality and flow of set up, quality of food, aesthetics of catering supplies etc.Showcasing this set of slides titled Catering And Restaurant Promotion Marketing Analysis Dashboard Graphics PDF The topics addressed in these templates are Consistent Serving, Functionally, Quality Food All the content presented in this PPT design is completely editable. Download it and make adjustments in color, background, font etc. as per your unique business setting.

Restaurant Promotion Marketing Analysis Dashboard For Hospitality Company Microsoft PDF
This slide shows the dashboard to be used by the hospitality company for analyzing the restaurant marketing. It includes details related to revenue, cost of revenue, net income, food and beverage revenue by location and type etc.Showcasing this set of slides titled Restaurant Promotion Marketing Analysis Dashboard For Hospitality Company Microsoft PDF The topics addressed in these templates are Beverage Revenue, Food Beverage, Expenses Account All the content presented in this PPT design is completely editable. Download it and make adjustments in color, background, font etc. as per your unique business setting.
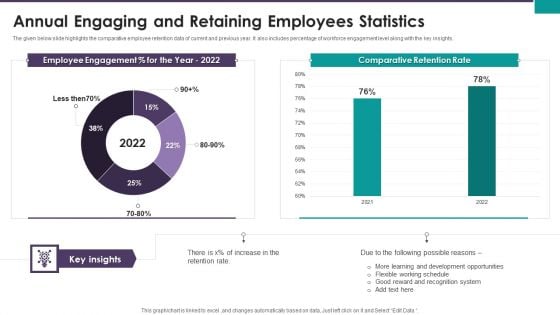
Annual Engaging And Retaining Employees Statistics Ppt Styles Example PDF
The given below slide highlights the comparative employee retention data of current and previous year. It also includes percentage of workforce engagement level along with the key insights. Showcasing this set of slides titled Annual Engaging And Retaining Employees Statistics Ppt Styles Example PDF. The topics addressed in these templates are Employee Engagement Percent, Comparative Retention Rate. All the content presented in this PPT design is completely editable. Download it and make adjustments in color, background, font etc. as per your unique business setting.
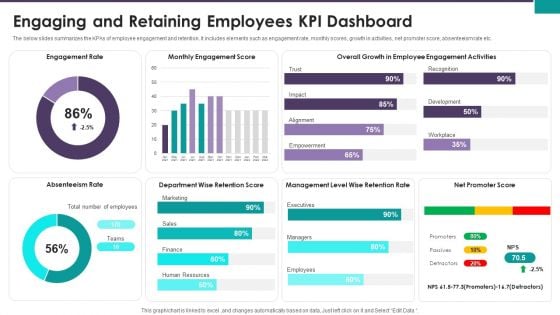
Engaging And Retaining Employees KPI Dashboard Ppt Slides Show PDF
The below slides summarizes the KPAs of employee engagement and retention. It includes elements such as engagement rate, monthly scores, growth in activities, net promoter score, absenteeism rate etc. Pitch your topic with ease and precision using this Engaging And Retaining Employees KPI Dashboard Ppt Slides Show PDF. This layout presents information on Engagement Rate Monthly, Engagement Score Overall, Growth Employee Engagement. It is also available for immediate download and adjustment. So, changes can be made in the color, design, graphics or any other component to create a unique layout.
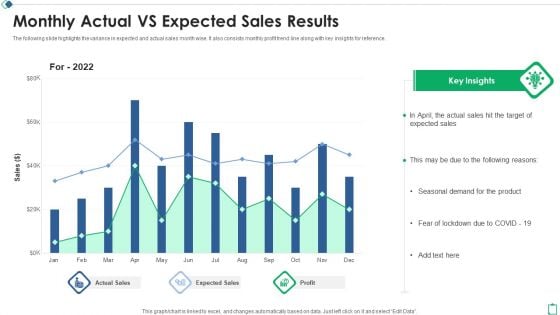
Monthly Actual Vs Expected Sales Results Ppt Show Deck PDF
The following slide highlights the variance in expected and actual sales month wise. It also consists monthly profit trend line along with key insights for reference. Showcasing this set of slides titled Monthly Actual Vs Expected Sales Results Ppt Show Deck PDF. The topics addressed in these templates are Target Expected Sales, Actual Sales Profit, Expected Sales 2022. All the content presented in this PPT design is completely editable. Download it and make adjustments in color, background, font etc. as per your unique business setting.
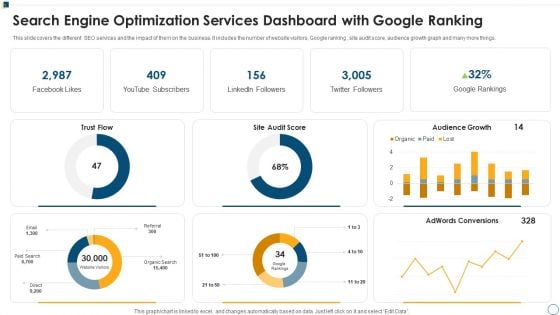
Search Engine Optimization Services Dashboard With Google Ranking Ppt Gallery Demonstration PDF
This slide covers the different SEO services and the impact of them on the business. It includes the number of website visitors, Google ranking , site audit score, audience growth graph and many more things. Pitch your topic with ease and precision using this Search Engine Optimization Services Dashboard With Google Ranking Ppt Gallery Demonstration PDF. This layout presents information on Audience Growth Paid, Adwords Conversions Score. It is also available for immediate download and adjustment. So, changes can be made in the color, design, graphics or any other component to create a unique layout.
Performance Evaluation KPI Dashboard For 360 Degree Review Icons PDF
This slide covers 360 degree employee feedback dashboard. It includes metrics such as highest rated area, lowest rated area, potential blind spots, peer ratings, self rating, gap analysis, etc. Showcasing this set of slides titled Performance Evaluation KPI Dashboard For 360 Degree Review Icons PDF. The topics addressed in these templates are Highest Rated, Lowest Areas, Potential Spots. All the content presented in this PPT design is completely editable. Download it and make adjustments in color, background, font etc. as per your unique business setting.


 Continue with Email

 Home
Home


