Executive Dashboard
Sales Leads Online Ppt Powerpoint Presentation Styles Graphics Download Cpb
This is a sales leads online ppt powerpoint presentation styles graphics download cpb. This is a two stage process. The stages in this process are sales leads online.
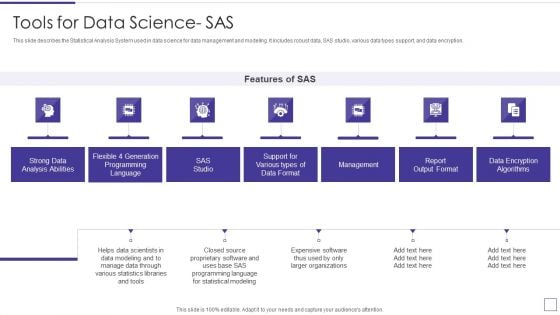
Data Mining Implementation Tools For Data Science SAS Template PDF
This slide describes the Statistical Analysis System used in data science for data management and modeling. It includes robust data, SAS studio, various data types support, and data encryption.This is a data mining implementation tools for data science sas template pdf template with various stages. Focus and dispense information on seven stages using this creative set, that comes with editable features. It contains large content boxes to add your information on topics like strong data analysis abilities, report output format, data encryption algorithms You can also showcase facts, figures, and other relevant content using this PPT layout. Grab it now.
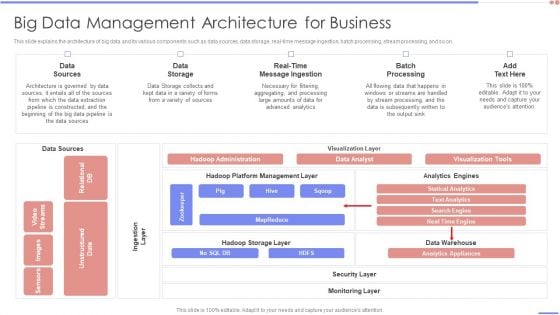
Data Analytics Management Big Data Management Architecture For Business Template PDF
This slide explains the architecture of big data and its various components such as data sources, data storage, real-time message ingestion, batch processing, stream processing, and so on.deliver an awe inspiring pitch with this creative Data Analytics Management Big Data Management Architecture For Business Template PDF bundle. Topics like Data Sources, Data Storage, Batch Processing can be discussed with this completely editable template. It is available for immediate download depending on the needs and requirements of the user.
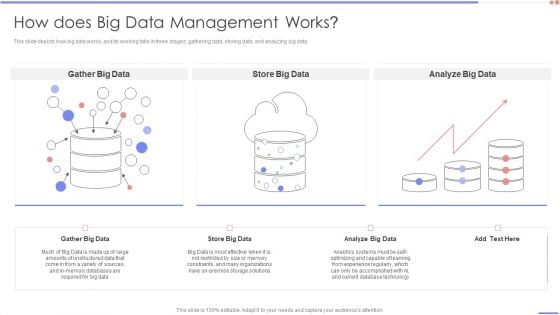
Data Analytics Management How Does Big Data Management Works Demonstration PDF
This slide depicts how big data works, and its working falls in three stages gathering data, storing data, and analyzing big data.Deliver an awe inspiring pitch with this creative Data Analytics Management How Does Big Data Management Works Demonstration PDF bundle. Topics like Unstructured Data, Memory Databases, Many Organizations can be discussed with this completely editable template. It is available for immediate download depending on the needs and requirements of the user.
Personal Data Visualization On Computer Screen Ppt PowerPoint Presentation Show Layout Ideas
Presenting this set of slides with name personal data visualization on computer screen ppt powerpoint presentation show layout ideas. This is a one stage process. The stages in this process are data visualization icon, research analysis, business focus. This is a completely editable PowerPoint presentation and is available for immediate download. Download now and impress your audience.
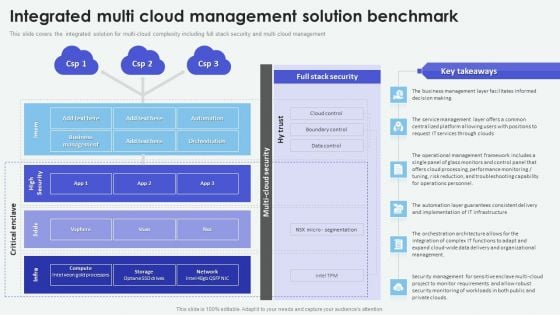
Cloud Based Computing Analysis Integrated Multi Cloud Management Solution Inspiration PDF
This slide covers the integrated solution for multi-cloud complexity including full stack security and multi cloud management. Are you in need of a template that can accommodate all of your creative concepts This one is crafted professionally and can be altered to fit any style. Use it with Google Slides or PowerPoint. Include striking photographs, symbols, depictions, and other visuals. Fill, move around, or remove text boxes as desired. Test out color palettes and font mixtures. Edit and save your work, or work with colleagues. Download Cloud Based Computing Analysis Integrated Multi Cloud Management Solution Inspiration PDF and observe how to make your presentation outstanding. Give an impeccable presentation to your group and make your presentation unforgettable.
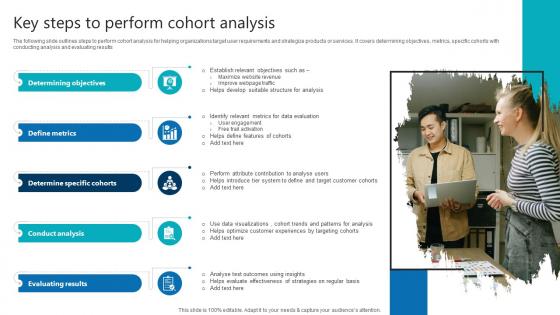
Key Steps To Perform Cohort Analysis Product Analytics Implementation Data Analytics V
The following slide outlines steps to perform cohort analysis for helping organizations target user requirements and strategize products or services. It covers determining objectives, metrics, specific cohorts with conducting analysis and evaluating results Find a pre-designed and impeccable Key Steps To Perform Cohort Analysis Product Analytics Implementation Data Analytics V. The templates can ace your presentation without additional effort. You can download these easy-to-edit presentation templates to make your presentation stand out from others. So, what are you waiting for Download the template from Slidegeeks today and give a unique touch to your presentation. The following slide outlines steps to perform cohort analysis for helping organizations target user requirements and strategize products or services. It covers determining objectives, metrics, specific cohorts with conducting analysis and evaluating results
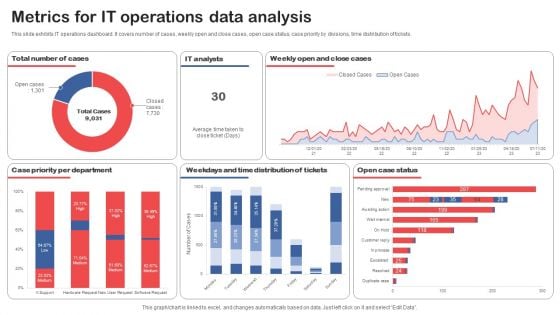
Metrics For IT Operations Data Analysis Topics PDF
This slide exhibits IT operations dashboard. It covers number of cases, weekly open and close cases, open case status, case priority by divisions, time distribution of tickets. Pitch your topic with ease and precision using this Metrics For IT Operations Data Analysis Topics PDF. This layout presents information on Case Priority Per Department, Distribution Of Tickets, Open Case Status. It is also available for immediate download and adjustment. So, changes can be made in the color, design, graphics or any other component to create a unique layout.
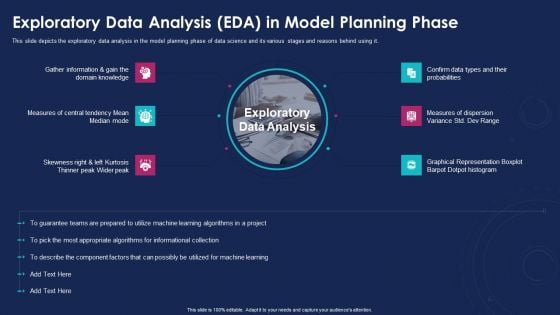
Data Analytics IT Exploratory Data Analysis EDA In Model Ppt Outline Inspiration PDF
This slide depicts the exploratory data analysis in the model planning phase of data science and its various stages and reasons behind using it. This is a data analytics it exploratory data analysis eda in model ppt outline inspiration pdf template with various stages. Focus and dispense information on six stages using this creative set, that comes with editable features. It contains large content boxes to add your information on topics like measures, probabilities, graphical representation. You can also showcase facts, figures, and other relevant content using this PPT layout. Grab it now.
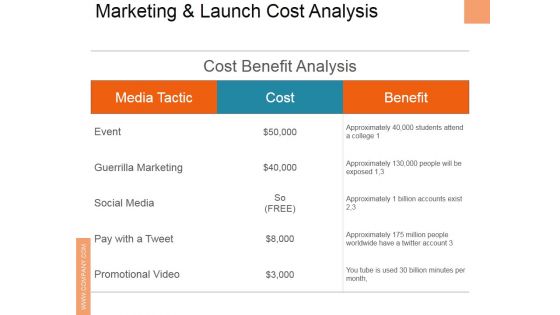
Marketing And Launch Cost Analysis Ppt PowerPoint Presentation Professional Background Image
This is a marketing and launch cost analysis ppt powerpoint presentation professional background image. This is a three stage process. The stages in this process are media tactic, cost, benefit, event, guerrilla marketing.
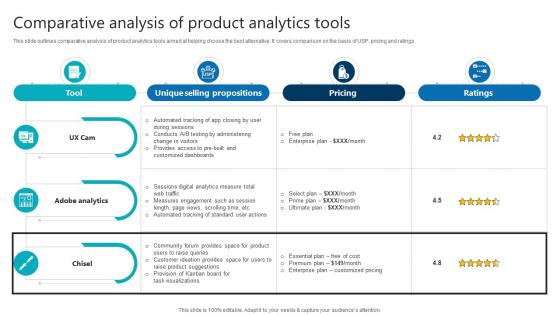
Comparative Analysis Of Product Analytics Tools Product Analytics Implementation Data Analytics V
This slide outlines comparative analysis of product analytics tools aimed at helping choose the best alternative. It covers comparison on the basis of USP, pricing and ratings If your project calls for a presentation, then Slidegeeks is your go-to partner because we have professionally designed, easy-to-edit templates that are perfect for any presentation. After downloading, you can easily edit Comparative Analysis Of Product Analytics Tools Product Analytics Implementation Data Analytics V and make the changes accordingly. You can rearrange slides or fill them with different images. Check out all the handy templates This slide outlines comparative analysis of product analytics tools aimed at helping choose the best alternative. It covers comparison on the basis of USP, pricing and ratings
Big Data Analysis Icon Data Analytic Business Ppt PowerPoint Presentation Complete Deck
Presenting this set of slides with name big data analysis icon data analytic business ppt powerpoint presentation complete deck. The topics discussed in these slides are data analytic, business, growth, gear, magnifying glass. This is a completely editable PowerPoint presentation and is available for immediate download. Download now and impress your audience.
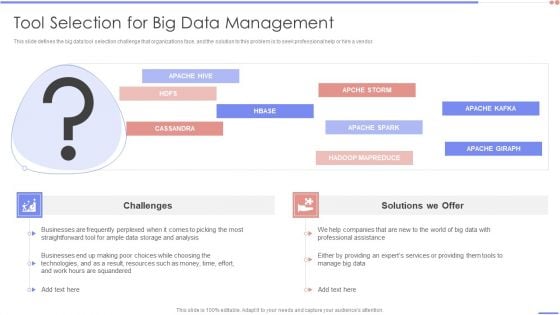
Data Analytics Management Tool Selection For Big Data Management Professional PDF
This slide defines the big data tool selection challenge that organizations face, and the solution to this problem is to seek professional help or hire a vendor.Deliver and pitch your topic in the best possible manner with this Data Analytics Management Tool Selection For Big Data Management Professional PDF. Use them to share invaluable insights on Businesses Frequently, Storage Analysis, Squandered and impress your audience. This template can be altered and modified as per your expectations. So, grab it now.
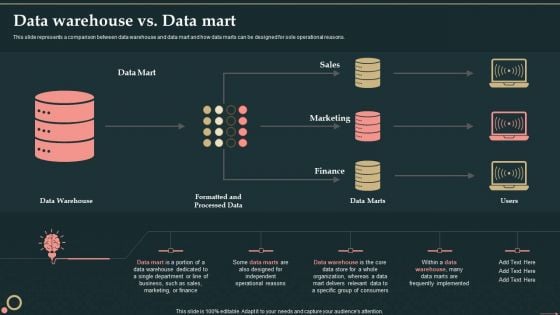
Management Information System Data Warehouse Vs Data Mart Inspiration PDF
This slide represents a comparison between data warehouse and data mart and how data marts can be designed for sole operational reasons.Deliver an awe inspiring pitch with this creative Management Information System Data Warehouse Vs Data Mart Inspiration PDF bundle. Topics like Frequently Implemented, Organization Whereas, Operational Reasons can be discussed with this completely editable template. It is available for immediate download depending on the needs and requirements of the user.
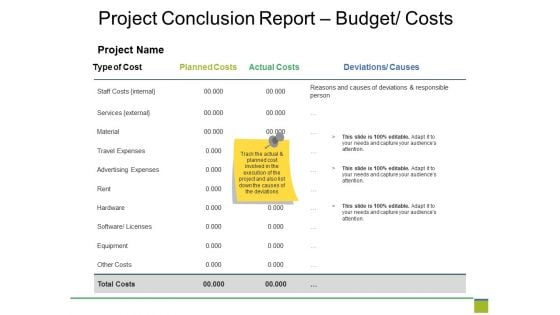
Project Conclusion Report Budget Costs Ppt PowerPoint Presentation Ideas Graphics Template
This is a project conclusion report budget costs ppt powerpoint presentation ideas graphics template. This is a four stage process. The stages in this process are type of cost, planned costs, actual costs, deviations.
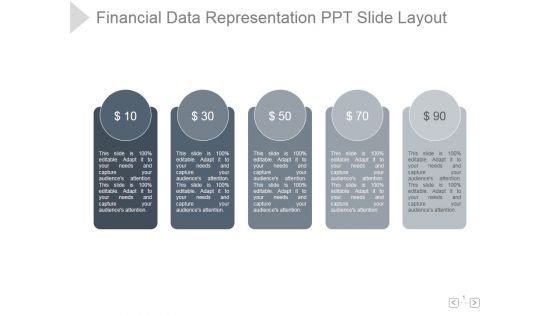
Financial Data Representation Ppt PowerPoint Presentation Rules
This is a financial data representation ppt powerpoint presentation rules. This is a five stage process. The stages in this process are financial, data, representation, marketing, management, business.
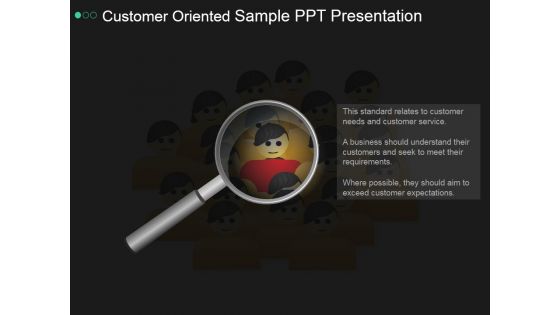
Customer Oriented Sample Ppt PowerPoint Presentation Graphics
This is a customer oriented sample ppt powerpoint presentation graphics. This is a two stage process. The stages in this process are business, marketing, big data, strategy, success, management.
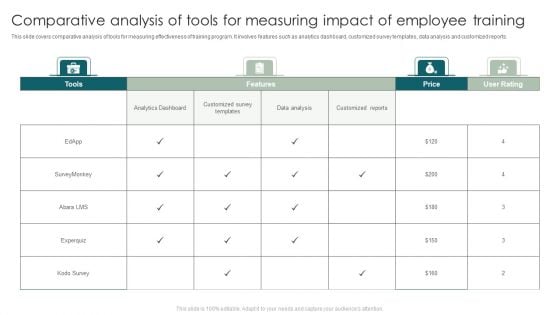
Comparative Analysis Of Tools For Measuring Impact Of Employee Training Template PDF
This slide covers comparative analysis of tools for measuring effectiveness of training program. It involves features such as analytics dashboard, customized survey templates, data analysis and customized reports. Showcasing this set of slides titled Comparative Analysis Of Tools For Measuring Impact Of Employee Training Template PDF. The topics addressed in these templates are Analytics Dashboard, Customized Survey Templates, Data Analysis. All the content presented in this PPT design is completely editable. Download it and make adjustments in color, background, font etc. as per your unique business setting.
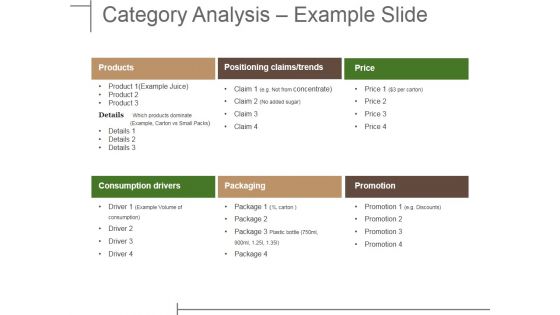
Category Analysis Example Slide Ppt PowerPoint Presentation Ideas Gridlines
This is a category analysis example slide ppt powerpoint presentation ideas gridlines. This is a six stage process. The stages in this process are products, positioning claims trends, price, consumption drivers, packaging, promotion.
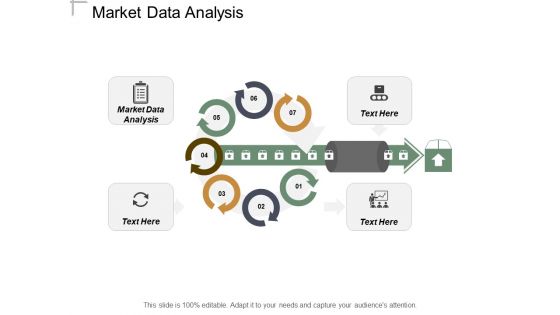
Market Data Analysis Ppt PowerPoint Presentation Slides Graphic Tips Cpb
This is a market data analysis ppt powerpoint presentation slides graphic tips cpb. This is a seven stage process. The stages in this process are market data analysis.
Data Analysis Marketing Ppt PowerPoint Presentation Ideas Examples Cpb
This is a data analysis marketing ppt powerpoint presentation ideas examples cpb. This is a two stage process. The stages in this process are data analysis marketing.

Marketers Guide To Data Analysis Optimization Introduction To SEO Analytics For Improving Websites Organic Structure PDF
This slide covers an overview of search engine optimization analytics. It also includes steps to perform website SEO analytics, such as checking the speed of your website, identifying your key competitors, analyzing best-performing pages, performing a competition backlink profile analysis, etc. The Marketers Guide To Data Analysis Optimization Introduction To SEO Analytics For Improving Websites Organic Structure PDF is a compilation of the most recent design trends as a series of slides. It is suitable for any subject or industry presentation, containing attractive visuals and photo spots for businesses to clearly express their messages. This template contains a variety of slides for the user to input data, such as structures to contrast two elements, bullet points, and slides for written information. Slidegeeks is prepared to create an impression.
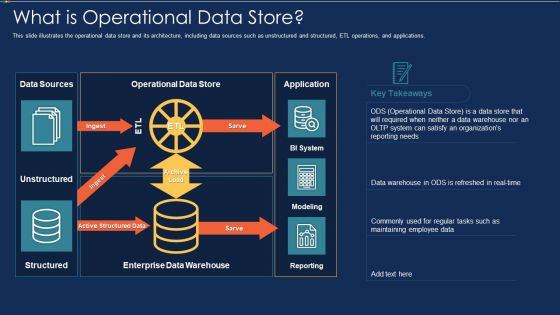
Data Warehousing IT What Is Operational Data Store Ppt Infographic Template Images PDF
This slide illustrates the operational data store and its architecture, including data sources such as unstructured and structured, ETL operations, and applications. Deliver and pitch your topic in the best possible manner with this data warehousing it what is operational data store ppt infographic template images pdf. Use them to share invaluable insights on modeling, reporting, bi system, application, data sources, operational data store, enterprise data warehouse and impress your audience. This template can be altered and modified as per your expectations. So, grab it now.
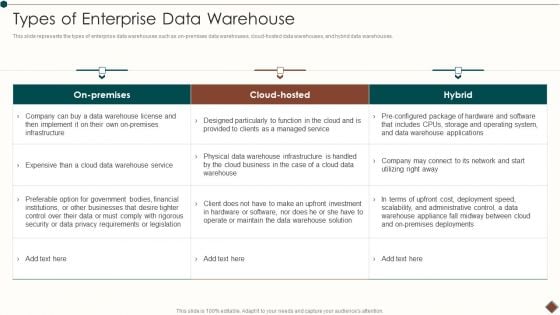
Data Warehouse Implementation Types Of Enterprise Data Warehouse Demonstration PDF
This slide represents the types of enterprise data warehouses such as on premises data warehouses, cloud hosted data warehouses, and hybrid data warehouses.Deliver an awe inspiring pitch with this creative Data Warehouse Implementation Types Of Enterprise Data Warehouse Demonstration PDF bundle. Topics like Preferable Option, Government Bodies, Financial Institutions can be discussed with this completely editable template. It is available for immediate download depending on the needs and requirements of the user.
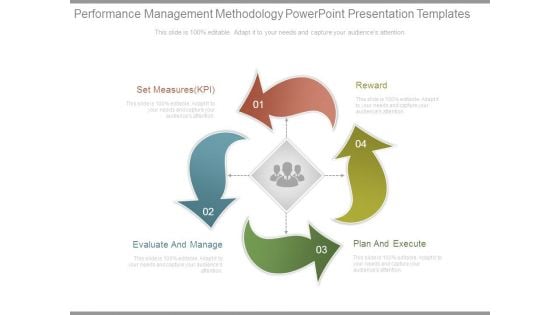
Performance Management Methodology Powerpoint Presentation Templates
This is a performance management methodology powerpoint presentation templates. This is a four stage process. The stages in this process are set measures kpi, evaluate and manage, reward, plan and execute.
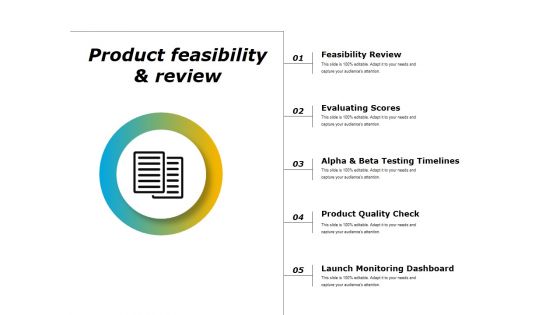
Product Feasibility And Review Ppt PowerPoint Presentation Infographics Design Inspiration
This is a product feasibility and review ppt powerpoint presentation infographics design inspiration. This is a five stage process. The stages in this process are feasibility review, evaluating scores, alpha and beta testing timelines, product quality check, launch monitoring dashboard.
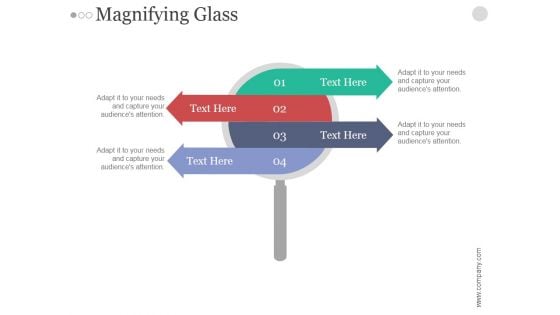
Magnifying Glass Ppt PowerPoint Presentation Styles
This is a magnifying glass ppt powerpoint presentation styles. This is a four stage process. The stages in this process are arrows, magnifier, marketing, analysis, search, business, management.
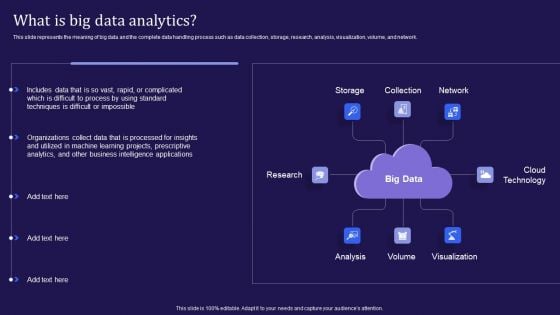
Big Data Analytics Lifecycle What Is Big Data Analytics Ppt Layouts Portrait PDF
This slide represents the meaning of big data and the complete data handling process such as data collection, storage, research, analysis, visualization, volume, and network. Present like a pro with Big Data Analytics Lifecycle What Is Big Data Analytics Ppt Layouts Portrait PDF Create beautiful presentations together with your team, using our easy-to-use presentation slides. Share your ideas in real-time and make changes on the fly by downloading our templates. So whether youre in the office, on the go, or in a remote location, you can stay in sync with your team and present your ideas with confidence. With Slidegeeks presentation got a whole lot easier. Grab these presentations today.
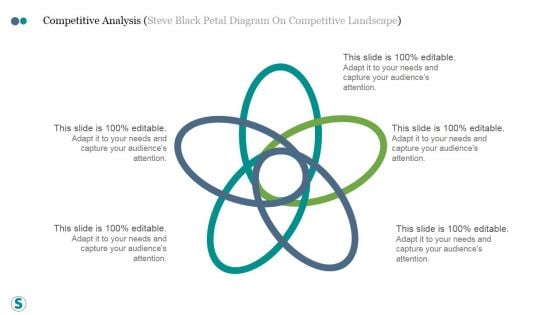
Competitive Analysis Steve Black Petal Diagram On Competitive Landscape Ppt PowerPoint Presentation Visuals
This is a competitive analysis steve black petal diagram on competitive landscape ppt powerpoint presentation visuals. This is a five stage process. The stages in this process are business, strategy, marketing, success, process, analysis.
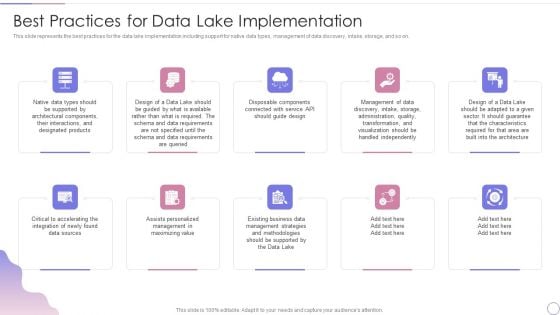
Data Lake Architecture Future Of Data Analysis Best Practices For Data Lake Implementation Diagrams PDF
This slide represents the best practices for the data lake implementation including support for native data types, management of data discovery, intake, storage, and so on.Presenting Data Lake Architecture Future Of Data Analysis Best Practices For Data Lake Implementation Diagrams PDF to provide visual cues and insights. Share and navigate important information on ten stages that need your due attention. This template can be used to pitch topics like Architectural Components, Critical To Accelerating, Management Strategies. In addtion, this PPT design contains high resolution images, graphics, etc, that are easily editable and available for immediate download.
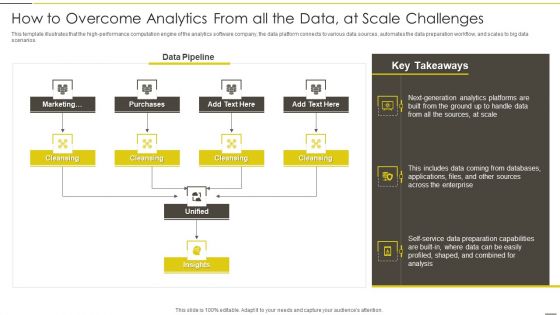
Administered Data And Analytic Quality Playbook How To Overcome Analytics From All The Data Guidelines PDF
This template illustrates that the high performance computation engine of the analytics software company, the data platform connects to various data sources, automates the data preparation workflow, and scales to big data scenarios.Deliver and pitch your topic in the best possible manner with this Administered Data And Analytic Quality Playbook How To Overcome Analytics From All The Data Guidelines PDF Use them to share invaluable insights on Generation Analytics, Across Enterprise, Preparation Capabilities and impress your audience. This template can be altered and modified as per your expectations. So, grab it now.

Business Diagram Three Staged Pencil Diagram For Graph Formation PowerPoint Slide
This business diagram displays set of pencils. This Power Point template has been designed to compare and present business data. Download this diagram to represent stages of business growth.
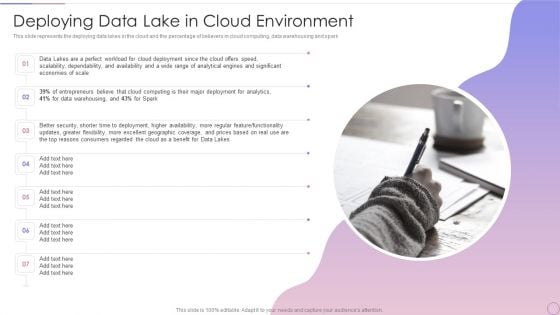
Data Lake Architecture Future Of Data Analysis Deploying Data Lake In Cloud Environment Background PDF
This slide represents the deploying data lakes in the cloud and the percentage of believers in cloud computing, data warehousing and spark.This is a Data Lake Architecture Future Of Data Analysis Deploying Data Lake In Cloud Environment Background PDF template with various stages. Focus and dispense information on Seven stages using this creative set, that comes with editable features. It contains large content boxes to add your information on topics like Scalability Dependability, Economies Of Scale, Entrepreneurs Believe. You can also showcase facts, figures, and other relevant content using this PPT layout. Grab it now.
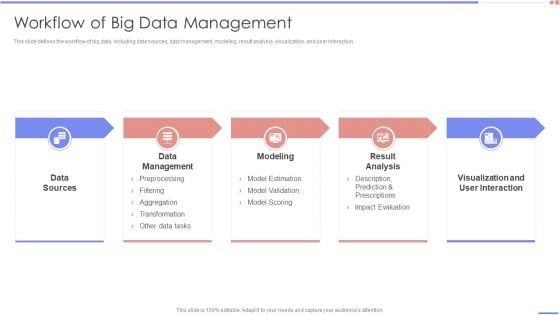
Data Analytics Management Workflow Of Big Data Management Infographics PDF
This slide defines the workflow of big data, including data sources, data management, modeling, result analysis, visualization, and user interaction.This is a Data Analytics Management Workflow Of Big Data Management Infographics PDF template with various stages. Focus and dispense information on five stages using this creative set, that comes with editable features. It contains large content boxes to add your information on topics like Data Management, Visualization Interaction, Result Analysis. You can also showcase facts, figures, and other relevant content using this PPT layout. Grab it now.
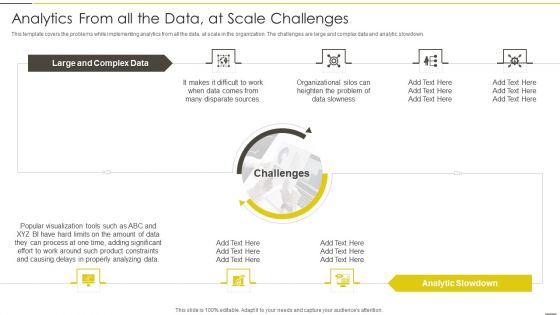
Administered Data And Analytic Quality Playbook Analytics From All The Data Information PDF
This template covers the problems while implementing analytics from all the data, at scale in the organization. The challenges are large and complex data and analytic slowdown.Deliver an awe inspiring pitch with this creative Administered Data And Analytic Quality Playbook Analytics From All The Data Information PDF bundle. Topics like Disparate Sources, Organizational Silos, Heighten Problem can be discussed with this completely editable template. It is available for immediate download depending on the needs and requirements of the user.
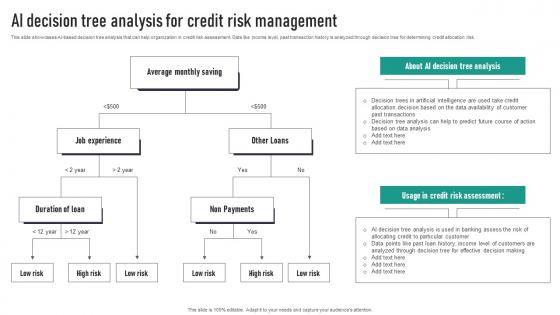
AI Decision Tree Analysis For Credit Risk Management Portrait Pdf
This slide showcases AI-based decision tree analysis that can help organization in credit risk assessment. Data like income level, past transaction history is analyzed through decision tree for determining credit allocation risk. Whether you have daily or monthly meetings, a brilliant presentation is necessary. AI Decision Tree Analysis For Credit Risk Management Portrait Pdf can be your best option for delivering a presentation. Represent everything in detail using AI Decision Tree Analysis For Credit Risk Management Portrait Pdf and make yourself stand out in meetings. The template is versatile and follows a structure that will cater to your requirements. All the templates prepared by Slidegeeks are easy to download and edit. Our research experts have taken care of the corporate themes as well. So, give it a try and see the results. This slide showcases AI-based decision tree analysis that can help organization in credit risk assessment. Data like income level, past transaction history is analyzed through decision tree for determining credit allocation risk.
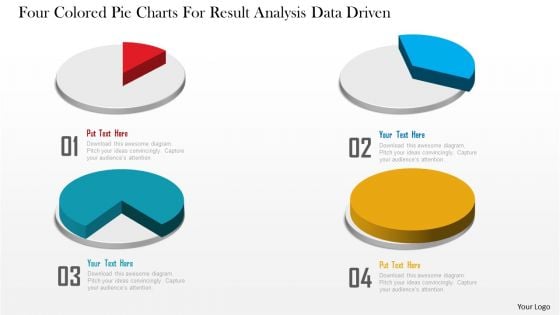
Business Diagram Four Colored Pie Charts For Result Analysis Data Driven PowerPoint Slide
This business diagram displays graphic of pie charts. This business slide is suitable to present and compare business data. Use this diagram to build professional presentations for your viewers.
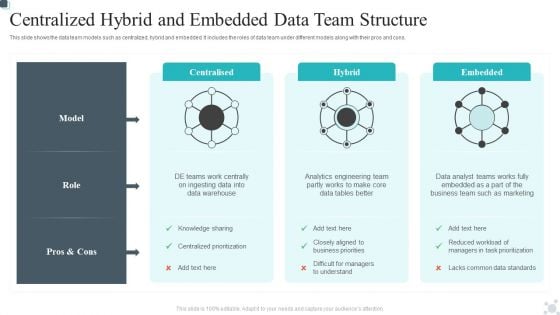
Centralized Hybrid And Embedded Data Team Structure Elements PDF
This slide shows the data team models such as centralized, hybrid and embedded. It includes the roles of data team under different models along with their pros and cons.Pitch your topic with ease and precision using this Centralized Hybrid And Embedded Data Team Structure Elements PDF. This layout presents information on Centralized Prioritization, Difficult Managers, Analytics Engineering. It is also available for immediate download and adjustment. So, changes can be made in the color, design, graphics or any other component to create a unique layout.
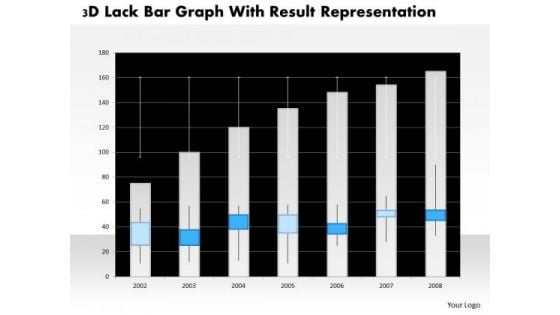
Business Diagram 3d Lack Bar Graph With Result Representation PowerPoint Slide
This business diagram has graphic of 3d lack bar graph. This diagram is a data visualization tool that gives you a simple way to present statistical information. This slide helps your audience examine and interpret the data you present.
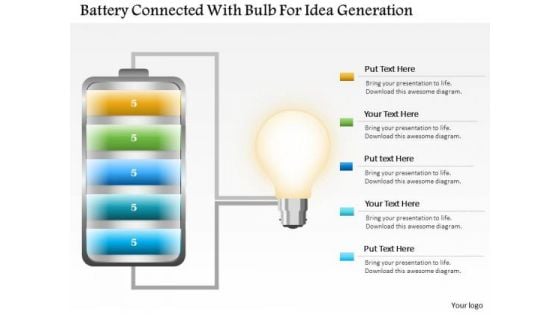
Business Diagram Battery Connected With Bulb For Idea Generation PowerPoint Slide
This business slide displays battery icon connected with bulb. This diagram is a data visualization tool that gives you a simple way to present statistical information. This slide helps your audience examine and interpret the data you present.
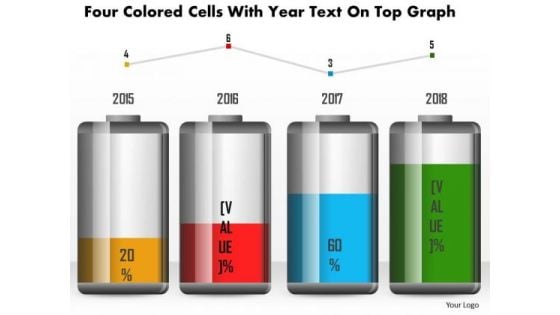
Business Diagram Four Colored Cells With Year Text On Top Graph PowerPoint Slide
This business diagram has been designed with battery cell graphic for business timeline. This slide can be used for business planning and management. Use this diagram for your business and success milestones related presentations.
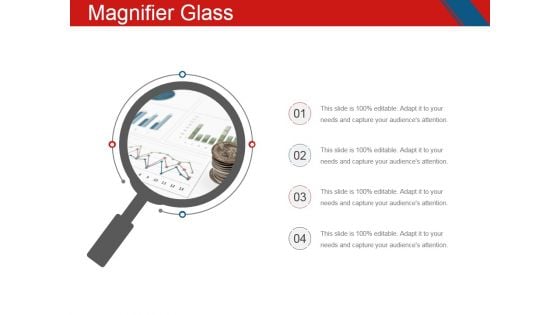
Magnifier Glass Ppt PowerPoint Presentation Inspiration Example
This is a magnifier glass ppt powerpoint presentation inspiration example. This is a four stage process. The stages in this process are magnifying glass, business, marketing, management, planning.
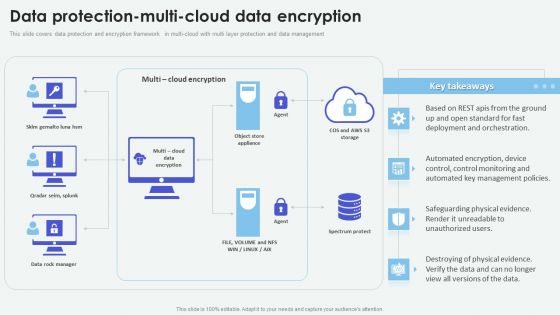
Cloud Based Computing Analysis Data Protection Multi Cloud Data Encryption Background PDF
This slide covers data protection and encryption framework in multi-cloud with multi layer protection and data management. Whether you have daily or monthly meetings, a brilliant presentation is necessary. Cloud Based Computing Analysis Data Protection Multi Cloud Data Encryption Background PDF can be your best option for delivering a presentation. Represent everything in detail using Cloud Based Computing Analysis Data Protection Multi Cloud Data Encryption Background PDF and make yourself stand out in meetings. The template is versatile and follows a structure that will cater to your requirements. All the templates prepared by Slidegeeks are easy to download and edit. Our research experts have taken care of the corporate themes as well. So, give it a try and see the results.
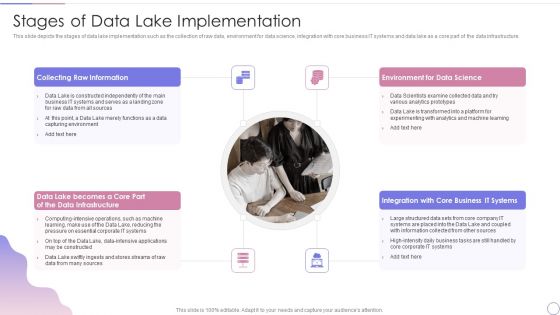
Data Lake Architecture Future Of Data Analysis Stages Of Data Lake Implementation Topics PDF
This slide depicts the stages of data lake implementation such as the collection of raw data, environment for data science, integration with core business IT systems and data lake as a core part of the data infrastructure.Presenting Data Lake Architecture Future Of Data Analysis Stages Of Data Lake Implementation Topics PDF to provide visual cues and insights. Share and navigate important information on four stages that need your due attention. This template can be used to pitch topics like Raw Information, Data Science, Business It Systems. In addtion, this PPT design contains high resolution images, graphics, etc, that are easily editable and available for immediate download.
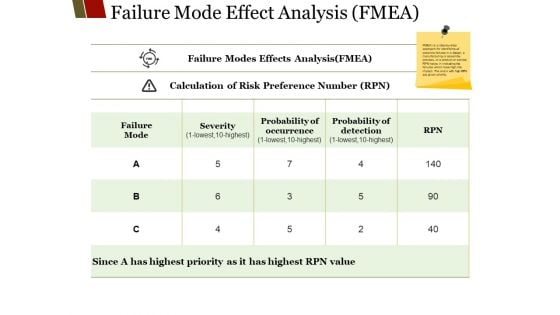
Failure Mode Effect Analysis Fmea Ppt PowerPoint Presentation Show Example
This is a failure mode effect analysis fmea ppt powerpoint presentation show example. This is a five stage process. The stages in this process are failure mode, severity, probability of occurrence, probability of detection, business.
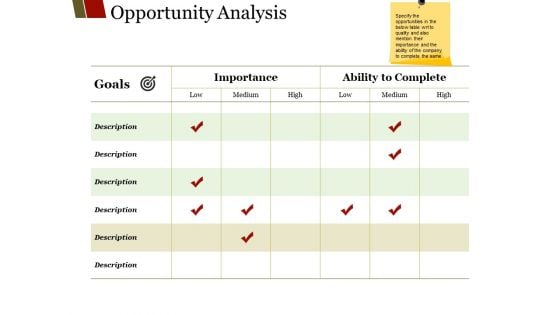
Opportunity Analysis Ppt PowerPoint Presentation Infographic Template Master Slide
This is a opportunity analysis ppt powerpoint presentation infographic template master slide. This is a six stage process. The stages in this process are description, importance, ability to complete, low, medium.
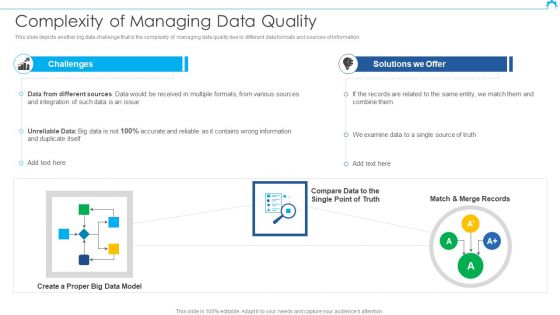
Big Data Architect Complexity Of Managing Data Quality Introduction PDF
This slide depicts another big data challenge that is the complexity of managing data quality due to different data formats and sources of information.Deliver an awe inspiring pitch with this creative Big Data Architect Complexity Of Managing Data Quality Introduction PDF bundle. Topics like Different Sources, Wrong Information, Solutions can be discussed with this completely editable template. It is available for immediate download depending on the needs and requirements of the user.
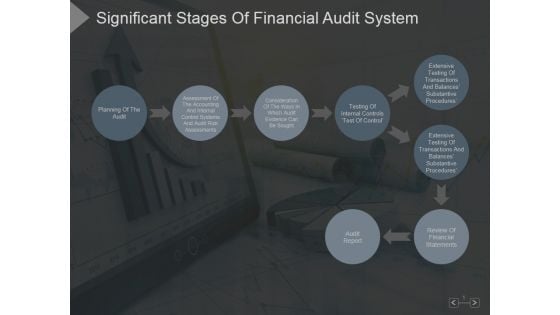
Significant Stages Of Financial Audit System Ppt PowerPoint Presentation Backgrounds
This is a significant stages of financial audit system ppt powerpoint presentation backgrounds. This is a eight stage process. The stages in this process are planning of the audit, audit report, review of financial statements, testing of internal controls.
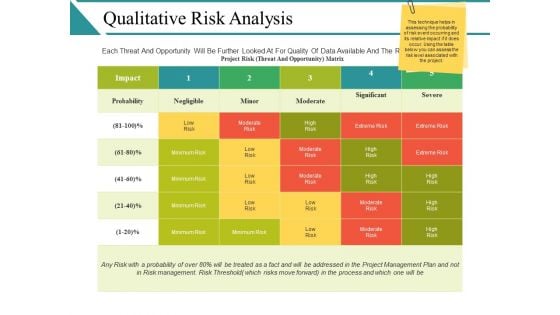
Qualitative Risk Analysis Ppt PowerPoint Presentation Infographics Show
This is a qualitative risk analysis ppt powerpoint presentation infographics show. This is a five stage process. The stages in this process are probability, negligible, minor, moderate, significant.

Data Lake Architecture Future Of Data Analysis Why Use Centralized Repository Data Lake Formats PDF
This slide represents why organizations should use data lakes based on their features including business agility, beneficial forecasts, competitive edge, 360 degree perspective, and so on.This is a Data Lake Architecture Future Of Data Analysis Why Use Centralized Repository Data Lake Formats PDF template with various stages. Focus and dispense information on nine stages using this creative set, that comes with editable features. It contains large content boxes to add your information on topics like Outperform Competitors, Enterprises In Organic, Provides Competitive. You can also showcase facts, figures, and other relevant content using this PPT layout. Grab it now.
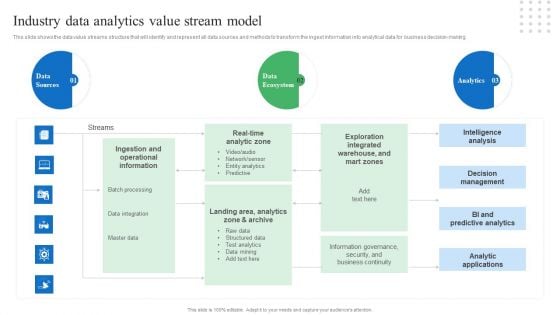
Toolkit For Data Science And Analytics Transition Industry Data Analytics Value Stream Model Brochure PDF
This slide shows the data value streams structure that will identify and represent all data sources and methods to transform the ingest information into analytical data for business decision-making. Whether you have daily or monthly meetings, a brilliant presentation is necessary. Toolkit For Data Science And Analytics Transition Industry Data Analytics Value Stream Model Brochure PDF can be your best option for delivering a presentation. Represent everything in detail using Toolkit For Data Science And Analytics Transition Industry Data Analytics Value Stream Model Brochure PDF and make yourself stand out in meetings. The template is versatile and follows a structure that will cater to your requirements. All the templates prepared by Slidegeeks are easy to download and edit. Our research experts have taken care of the corporate themes as well. So, give it a try and see the results.
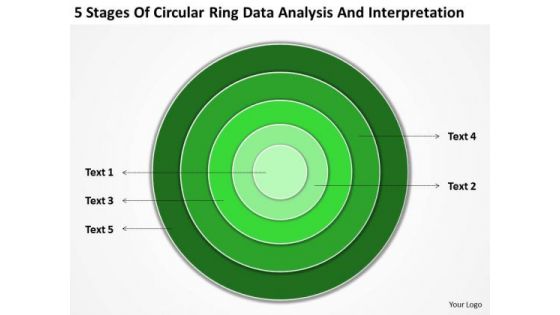
Ring Data Analysis And Interpretation Business Plan Template PowerPoint Templates
We present our ring data analysis and interpretation business plan template PowerPoint templates.Present our Circle Charts PowerPoint Templates because Our PowerPoint Templates and Slides are a sure bet. Gauranteed to win against all odds. Download and present our Business PowerPoint Templates because you should once Tap the ingenuity of our PowerPoint Templates and Slides. They are programmed to succeed. Download our Shapes PowerPoint Templates because Our PowerPoint Templates and Slides are truly out of this world. Even the MIB duo has been keeping tabs on our team. Present our Signs PowerPoint Templates because They will Put your wonderful verbal artistry on display. Our PowerPoint Templates and Slides will provide you the necessary glam and glitter. Download our Metaphors-Visual Concepts PowerPoint Templates because Our PowerPoint Templates and Slides are Clear and concise. Use them and dispel any doubts your team may have.Use these PowerPoint slides for presentations relating to metal, wallpaper, decoration, chrome, vivid, blank, glossy, bright, template, curvy, copyspace, circle, light, decor, element, digital, card, simple, wavy, shape, abstract, wave, modern, creative, circular, round, shiny, backdrop, reflection, design, abstraction, gold, cover, color, colorful, empty, picture, banner, twirl, art, golden, background, border, vortex. The prominent colors used in the PowerPoint template are Green dark , Green, Green lime . Carry your team with our Ring Data Analysis And Interpretation Business Plan Template PowerPoint Templates. You will come out on top.
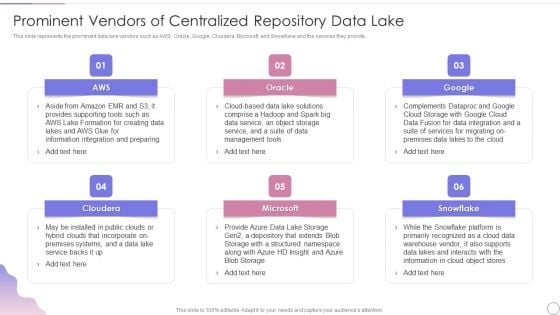
Data Lake Architecture Future Of Data Analysis Prominent Vendors Of Centralized Repository Data Lake Topics PDF
Presenting Data Lake Architecture Future Of Data Analysis Prominent Vendors Of Centralized Repository Data Lake Topics PDF to provide visual cues and insights. Share and navigate important information on six stages that need your due attention. This template can be used to pitch topics like Provides Supporting, Information Integration, Management Tools. In addtion, this PPT design contains high resolution images, graphics, etc, that are easily editable and available for immediate download.
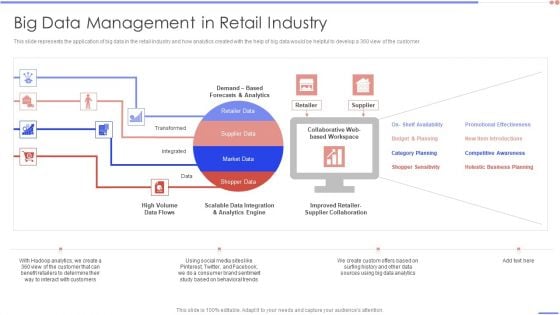
Data Analytics Management Big Data Management In Retail Industry Template PDF
This slide represents the application of big data in the retail industry and how analytics created with the help of big data would be helpful to develop a 360 view of the customer.Deliver and pitch your topic in the best possible manner with this Data Analytics Management Big Data Management In Retail Industry Template PDF. Use them to share invaluable insights on Data Integration, Retailer Supplier, Category Planning and impress your audience. This template can be altered and modified as per your expectations. So, grab it now.
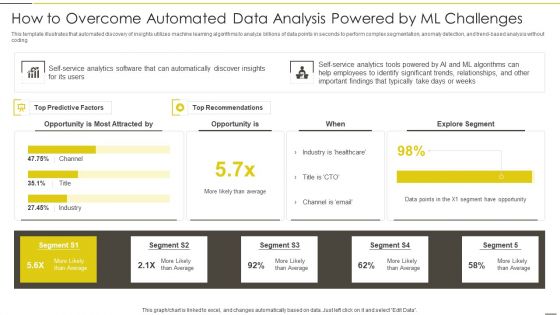
Administered Data And Analytic Quality Playbook How To Overcome Automated Data Analysis Sample PDF
This template illustrates that automated discovery of insights utilizes machine learning algorithms to analyze billions of data points in seconds to perform complex segmentation, anomaly detection, and trend-based analysis without codingDeliver and pitch your topic in the best possible manner with this Administered Data And Analytic Quality Playbook How To Overcome Automated Data Analysis Sample PDF Use them to share invaluable insights on Predictive Factors, Recommendations, Explore Segment and impress your audience. This template can be altered and modified as per your expectations. So, grab it now.

Data Designing Ppt PowerPoint Presentation Complete Deck With Slides
This is a data designing ppt powerpoint presentation complete deck with slides. This is a one stage process. The stages in this process are business, management, planning, strategy, marketing.
Environmental Scanning Icon For Data Analysis Graphics PDF
Persuade your audience using this Environmental Scanning Icon For Data Analysis Graphics PDF. This PPT design covers four stages, thus making it a great tool to use. It also caters to a variety of topics including Environmental Scanning Icon For Data Analysis. Download this PPT design now to present a convincing pitch that not only emphasizes the topic but also showcases your presentation skills.
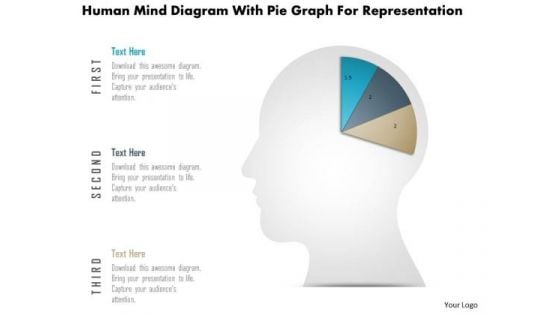
Business Diagram Human Mind Diagram With Pie Graph For Representation PowerPoint Slide
This diagram displays human face graphic divided into sections. This section can be used for data display. Use this diagram to build professional presentations for your viewers.

Business Diagram Six Staged Pie Charts For Text Representation PowerPoint Slide
This slide displays graphic six staged pie charts. Download this diagram to present and compare business data. Use this diagram to display business process workflows in any presentation.
Magnifying Glass Inbound And Outbound Marketing Tactics For Start Ups To Drive Business Clipart PDF
Whether you have daily or monthly meetings, a brilliant presentation is necessary. Magnifying Glass Inbound And Outbound Marketing Tactics For Start Ups To Drive Business Clipart PDF can be your best option for delivering a presentation. Represent everything in detail using Magnifying Glass Inbound And Outbound Marketing Tactics For Start Ups To Drive Business Clipart PDF and make yourself stand out in meetings. The template is versatile and follows a structure that will cater to your requirements. All the templates prepared by Slidegeeks are easy to download and edit. Our research experts have taken care of the corporate themes as well. So, give it a try and see the results.


 Continue with Email

 Home
Home


