Executive Dashboard
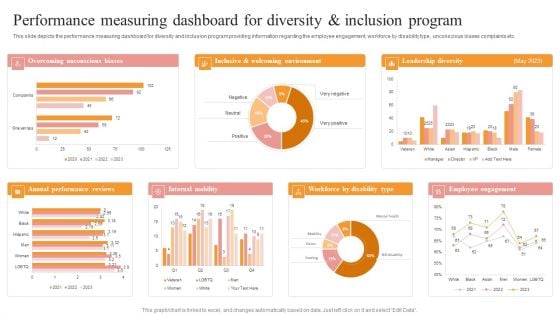
Performance Measuring Dashboard For Diversity And Inclusion Program Summary PDF
This slide depicts the performance measuring dashboard for diversity and inclusion program providing information regarding the employee engagement, workforce by disability type, unconscious biases complaints etc. Explore a selection of the finest Performance Measuring Dashboard For Diversity And Inclusion Program Summary PDF here. With a plethora of professionally designed and pre made slide templates, you can quickly and easily find the right one for your upcoming presentation. You can use our Performance Measuring Dashboard For Diversity And Inclusion Program Summary PDF to effectively convey your message to a wider audience. Slidegeeks has done a lot of research before preparing these presentation templates. The content can be personalized and the slides are highly editable. Grab templates today from Slidegeeks.
Cost And Purchase Order Procurement Dashboard Icons PDF
This slide provides an overview of the cost and purchase order-related performance indicators to improve efficiency and optimize processes. The dashboard includes the cost of the purchase order, cost reduction, savings, procurement ROI and top 5 suppliers. If you are looking for a format to display your unique thoughts, then the professionally designed Cost And Purchase Order Procurement Dashboard Icons PDF is the one for you. You can use it as a Google Slides template or a PowerPoint template. Incorporate impressive visuals, symbols, images, and other charts. Modify or reorganize the text boxes as you desire. Experiment with shade schemes and font pairings. Alter, share or cooperate with other people on your work. Download Cost And Purchase Order Procurement Dashboard Icons PDF and find out how to give a successful presentation. Present a perfect display to your team and make your presentation unforgettable.
Product And Customer Performance Tracking Dashboard Summary PDF
This slide provides information regarding dashboard utilized by firm to monitor performance of products offered and customer associated. The performance is tracked through revenues generated, new customer acquired, customer satisfaction, sales comparison, etc. If you are looking for a format to display your unique thoughts, then the professionally designed Product And Customer Performance Tracking Dashboard Summary PDF is the one for you. You can use it as a Google Slides template or a PowerPoint template. Incorporate impressive visuals, symbols, images, and other charts. Modify or reorganize the text boxes as you desire. Experiment with shade schemes and font pairings. Alter, share or cooperate with other people on your work. Download Product And Customer Performance Tracking Dashboard Summary PDF and find out how to give a successful presentation. Present a perfect display to your team and make your presentation unforgettable.
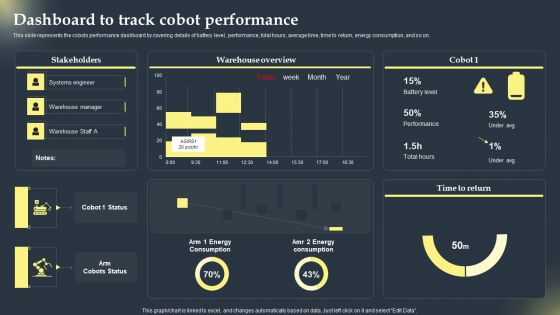
Cobots Global Statistics Dashboard To Track Cobot Performance Mockup PDF
This slide represents the cobots performance dashboard by covering details of battery level, performance, total hours, average time, time to return, energy consumption, and so on. If you are looking for a format to display your unique thoughts, then the professionally designed Cobots Global Statistics Dashboard To Track Cobot Performance Mockup PDF is the one for you. You can use it as a Google Slides template or a PowerPoint template. Incorporate impressive visuals, symbols, images, and other charts. Modify or reorganize the text boxes as you desire. Experiment with shade schemes and font pairings. Alter, share or cooperate with other people on your work. Download Cobots Global Statistics Dashboard To Track Cobot Performance Mockup PDF and find out how to give a successful presentation. Present a perfect display to your team and make your presentation unforgettable.

Dashboard To Measure Workflow Performance Post RPA Implementation Demonstration PDF
This slide presents a dashboard to measure the overall operation performance after RPA implementation. It includes return on investment, bot numbers, saved hours, capital, bots runtime, time saved by bots, and workflow processes. If you are looking for a format to display your unique thoughts, then the professionally designed Dashboard To Measure Workflow Performance Post RPA Implementation Demonstration PDF is the one for you. You can use it as a Google Slides template or a PowerPoint template. Incorporate impressive visuals, symbols, images, and other charts. Modify or reorganize the text boxes as you desire. Experiment with shade schemes and font pairings. Alter, share or cooperate with other people on your work. Download Dashboard To Measure Workflow Performance Post RPA Implementation Demonstration PDF and find out how to give a successful presentation. Present a perfect display to your team and make your presentation unforgettable.
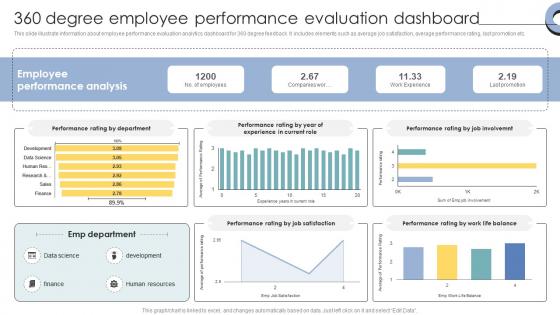
Skill Enhancement Performance 360 Degree Employee Performance Evaluation Dashboard
This slide illustrate information about employee performance evaluation analytics dashboard for 360 degree feedback. It includes elements such as average job satisfaction, average performance rating, last promotion etc. If your project calls for a presentation, then Slidegeeks is your go-to partner because we have professionally designed, easy-to-edit templates that are perfect for any presentation. After downloading, you can easily edit Skill Enhancement Performance 360 Degree Employee Performance Evaluation Dashboard and make the changes accordingly. You can rearrange slides or fill them with different images. Check out all the handy templates This slide illustrate information about employee performance evaluation analytics dashboard for 360 degree feedback. It includes elements such as average job satisfaction, average performance rating, last promotion etc.
Building Quality Inspection Dashboard With Customer Satisfaction Ratio Icons PDF
The following slide showcases dashboard of construction company exhibiting quality KPIs regarding safety, workmanship and customer satisfaction. Key indicators covered are site inspection success level, CSR, defect count, net promoter score, promotors, passives, defectors, total rework cost, safety meetings and average time taken to fix defects. Showcasing this set of slides titled Building Quality Inspection Dashboard With Customer Satisfaction Ratio Icons PDF. The topics addressed in these templates are Construction Project, Customer Satisfaction Ratio, Promoters. All the content presented in this PPT design is completely editable. Download it and make adjustments in color, background, font etc. as per your unique business setting.
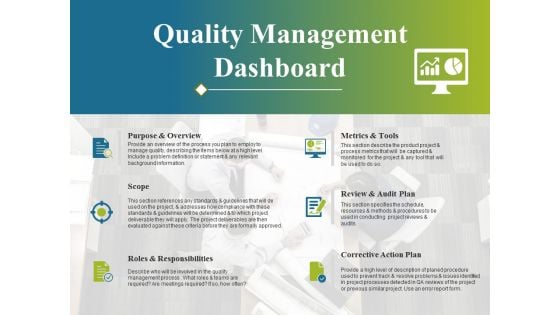
Quality Management Dashboard Ppt PowerPoint Presentation Summary Graphic Tips
This is a quality management dashboard ppt powerpoint presentation summary graphic tips. This is a six stage process. The stages in this process are purpose and overview, scope, roles and responsibilities, metrics and tools, review and audit plan, corrective action plan.
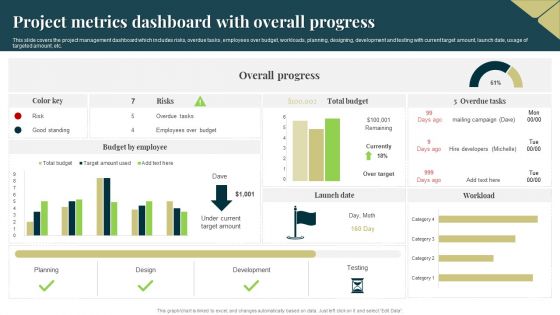
Project Metrics Dashboard With Overall Progress Brochure PDF
This slide covers the project management dashboard which includes risks, overdue tasks, employees over budget, workloads, planning, designing, development and testing with current target amount, launch date, usage of targeted amount, etc. Pitch your topic with ease and precision using this Project Metrics Dashboard With Overall Progress Brochure PDF. This layout presents information on Design, Planning, Development. It is also available for immediate download and adjustment. So, changes can be made in the color, design, graphics or any other component to create a unique layout.

Internal Audit Metrics Analysis Dashboard Ppt Ideas Clipart Images PDF
This slide depicts the key performance indicator dashboard and status for internal audit. It includes information related to the audit observations and plan status. Pitch your topic with ease and precision using this Internal Audit Metrics Analysis Dashboard Ppt Ideas Clipart Images PDF. This layout presents information on Quarterly Audit Observations, Financial Year Internal, Audit Plan Status. It is also available for immediate download and adjustment. So, changes can be made in the color, design, graphics or any other component to create a unique layout.
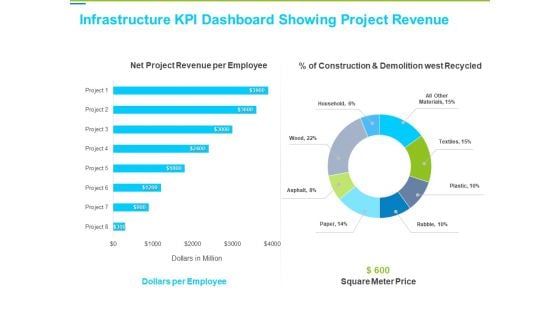
Framework Administration Infrastructure KPI Dashboard Showing Project Revenue Background PDF
Deliver an awe-inspiring pitch with this creative framework administration infrastructure kpi dashboard showing project revenue background pdf bundle. Topics like net project revenue per employee, dollars per employee, square meter price can be discussed with this completely editable template. It is available for immediate download depending on the needs and requirements of the user.
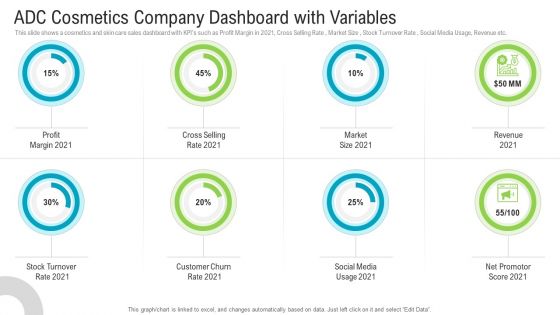
ADC Cosmetics Company Dashboard With Variables Summary PDF
This slide shows a cosmetics and skin care sales dashboard with KPIs such as Profit Margin in 2021, Cross Selling Rate , Market Size , Stock Turnover Rate , Social Media Usage, Revenue etc. Presenting adc cosmetics company dashboard with variables summary pdf to provide visual cues and insights. Share and navigate important information on eight stages that need your due attention. This template can be used to pitch topics like profit margin, cross selling rate, market size, revenue, stock turnover rate. In addtion, this PPT design contains high resolution images, graphics, etc, that are easily editable and available for immediate download.
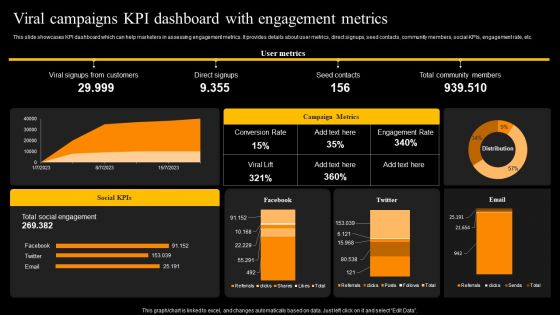
Viral Campaigns Kpi Dashboard With Engagement Metrics Template PDF
This slide showcases KPI dashboard which can help marketers in assessing engagement metrics. It provides details about user metrics, direct signups, seed contacts, community members, social KPIs, engagement rate, etc. Want to ace your presentation in front of a live audience Our Viral Campaigns Kpi Dashboard With Engagement Metrics Template PDF can help you do that by engaging all the users towards you. Slidegeeks experts have put their efforts and expertise into creating these impeccable powerpoint presentations so that you can communicate your ideas clearly. Moreover, all the templates are customizable, and easy to edit and downloadable. Use these for both personal and commercial use.
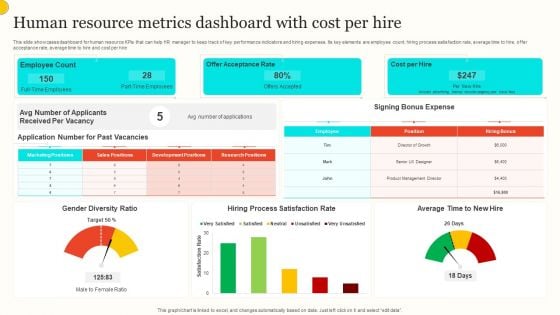
Human Resource Metrics Dashboard With Cost Per Hire Portrait PDF
This slide showcases dashboard for human resource KPIs that can help HR manager to keep track of key performance indicators and hiring expenses. Its key elements are employee count, hiring process satisfaction rate, average time to hire, offer acceptance rate, average time to hire and cost per hire. Showcasing this set of slides titled Human Resource Metrics Dashboard With Cost Per Hire Portrait PDF. The topics addressed in these templates are Employee Count, Offer Acceptance Rate, Cost Per Hire. All the content presented in this PPT design is completely editable. Download it and make adjustments in color, background, font etc. as per your unique business setting.
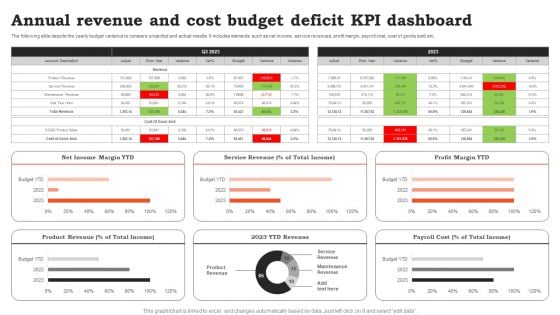
Annual Revenue And Cost Budget Deficit KPI Dashboard Ideas PDF
The following slide depicts the yearly budget variance to compare projected and actual results. It includes elements such as net income, service revenues, profit margin, payroll cost, cost of goods sold etc. Showcasing this set of slides titled Annual Revenue And Cost Budget Deficit KPI Dashboard Ideas PDF. The topics addressed in these templates are Cost Budget, Deficit KPI Dashboard. All the content presented in this PPT design is completely editable. Download it and make adjustments in color, background, font etc. as per your unique business setting.
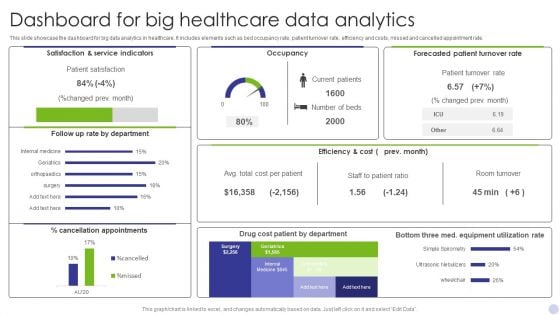
Dashboard For Big Healthcare Data Analytics Graphics PDF
This slide showcase the dashboard for big data analytics in healthcare. It includes elements such as bed occupancy rate, patient turnover rate, efficiency and costs, missed and cancelled appointment rate. Showcasing this set of slides titled Dashboard For Big Healthcare Data Analytics Graphics PDF. The topics addressed in these templates are Satisfaction Service Indicators, Occupancy, Forecasted Patient Turnover. All the content presented in this PPT design is completely editable. Download it and make adjustments in color, background, font etc. as per your unique business setting.
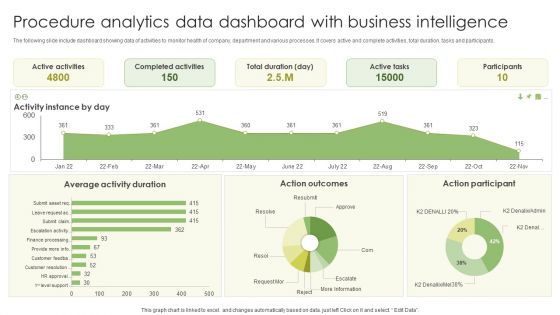
Procedure Analytics Data Dashboard With Business Intelligence Slides PDF
The following slide include dashboard showing data of activities to monitor health of company, department and various processes. It covers active and complete activities, total duration, tasks and participants. Pitch your topic with ease and precision using this Procedure Analytics Data Dashboard With Business Intelligence Slides PDF. This layout presents information on Active Activities, Completed Activities, Active Tasks . It is also available for immediate download and adjustment. So, changes can be made in the color, design, graphics or any other component to create a unique layout.
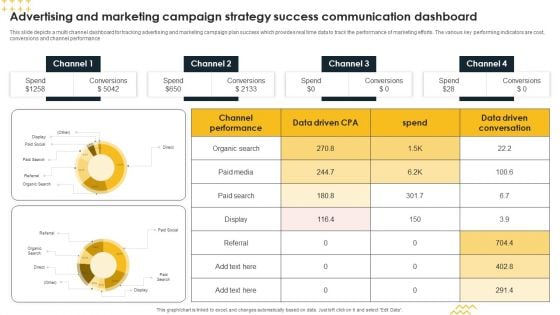
Advertising And Marketing Campaign Strategy Success Communication Dashboard Inspiration PDF
This slide depicts a multi channel dashboard for tracking advertising and marketing campaign plan success which provides real time data to track the performance of marketing efforts. The various key performing indicators are cost, conversions and channel performance Showcasing this set of slides titled Advertising And Marketing Campaign Strategy Success Communication Dashboard Inspiration PDF. The topics addressed in these templates are Conversions, Spend, Channel. All the content presented in this PPT design is completely editable. Download it and make adjustments in color, background, font etc. as per your unique business setting.
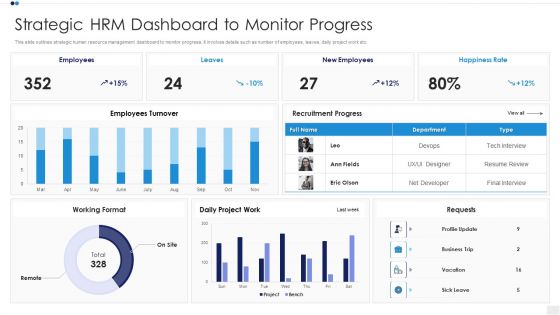
Strategic HRM Dashboard To Monitor Progress Designs PDF
Showcasing this set of slides titled trategic HRM Dashboard To Monitor Progress Designs PDF The topics addressed in these templates are Employees Turnover, Recruitment Progress, Working Format All the content presented in this PPT design is completely editable. Download it and make adjustments in color, background, font etc. as per your unique business setting.
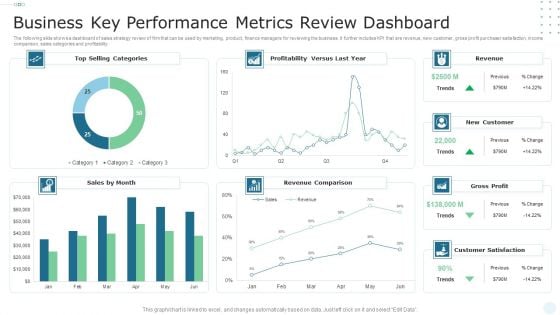
Business Key Performance Metrics Review Dashboard Portrait PDF
The following slide shows a dashboard of sales strategy review of firm that can be used by marketing, product, finance managers for reviewing the business. It further includes KPI that are revenue, new customer, gross profit purchaser satisfaction, income comparison, sales categories and profitability. Showcasing this set of slides titled Business Key Performance Metrics Review Dashboard Portrait PDF. The topics addressed in these templates are Sales, Revenue Comparison, Profitability. All the content presented in this PPT design is completely editable. Download it and make adjustments in color, background, font etc. as per your unique business setting.
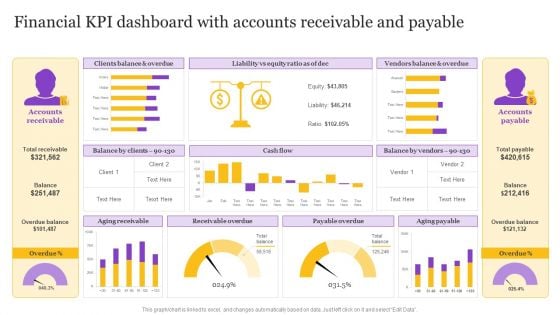
Financial KPI Dashboard With Accounts Receivable And Payable Designs PDF
Showcasing this set of slides titled Financial KPI Dashboard With Accounts Receivable And Payable Designs PDF. The topics addressed in these templates are Receivable Overdue, Aging Receivable, Payable Overdue. All the content presented in this PPT design is completely editable. Download it and make adjustments in color, background, font etc. as per your unique business setting.

Financial KPI Dashboard With Profit And Loss Analysis Designs PDF
Showcasing this set of slides titled Financial KPI Dashboard With Profit And Loss Analysis Designs PDF. The topics addressed in these templates are Assets And Liabilities, Cash Flow Analysis, Income And Expenses. All the content presented in this PPT design is completely editable. Download it and make adjustments in color, background, font etc. as per your unique business setting.
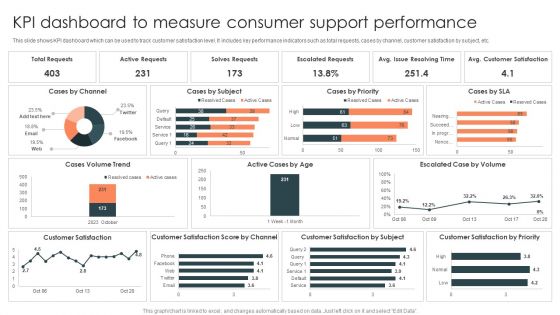
KPI Dashboard To Measure Consumer Support Performance Designs PDF
Showcasing this set of slides titled KPI Dashboard To Measure Consumer Support Performance Designs PDF. The topics addressed in these templates are Active Requests, Solves Requests, Escalated Requests. All the content presented in this PPT design is completely editable. Download it and make adjustments in color, background, font etc. as per your unique business setting.
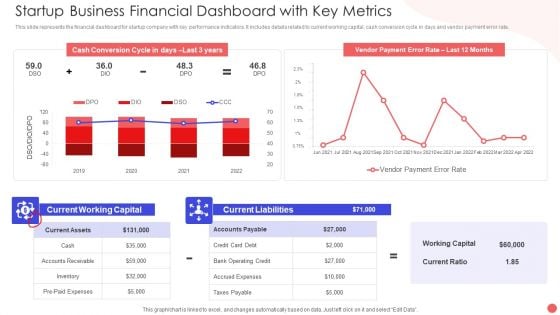
Startup Business Financial Dashboard With Key Metrics Sample PDF
This slide represents the financial dashboard for startup company with key performance indicators. It includes details related to current working capital, cash conversion cycle in days and vendor payment error rate. Pitch your topic with ease and precision using this Startup Business Financial Dashboard With Key Metrics Sample PDF. This layout presents information on Cash Conversion Cycle, Current Working Capital, Current Liabilities Debt. It is also available for immediate download and adjustment. So, changes can be made in the color, design, graphics or any other component to create a unique layout.
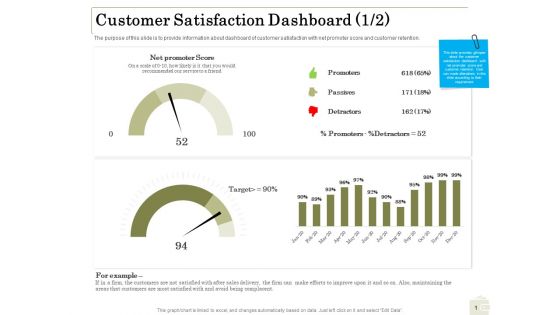
Percentage Share Customer Expenditure Customer Satisfaction Dashboard Areas Designs PDF
Presenting this set of slides with name percentage share customer expenditure customer satisfaction dashboard areas designs pdf. The topics discussed in these slides are promoters, passives, detractors, target. This is a completely editable PowerPoint presentation and is available for immediate download. Download now and impress your audience.
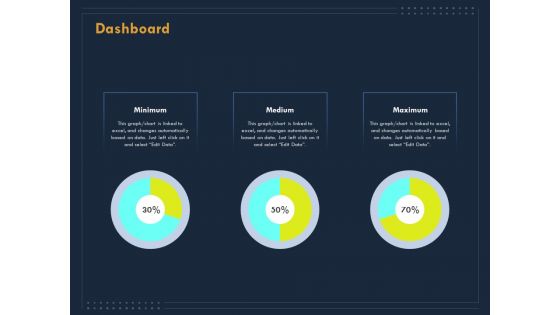
Enterprise Review Dashboard Ppt Infographics Design Inspiration PDF
Deliver an awe inspiring pitch with this creative enterprise review dashboard ppt infographics design inspiration pdf bundle. Topics like minimum, medium, maximum can be discussed with this completely editable template. It is available for immediate download depending on the needs and requirements of the user.
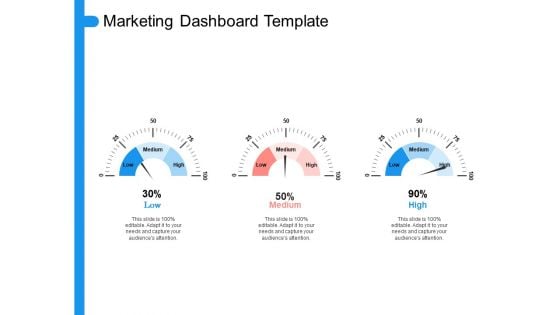
Target Persona Marketing Dashboard Template Ppt Layouts Design Inspiration PDF
Deliver and pitch your topic in the best possible manner with this target persona marketing dashboard template ppt layouts design inspiration pdf. Use them to share invaluable insights on low, medium, high and impress your audience. This template can be altered and modified as per your expectations. So, grab it now.
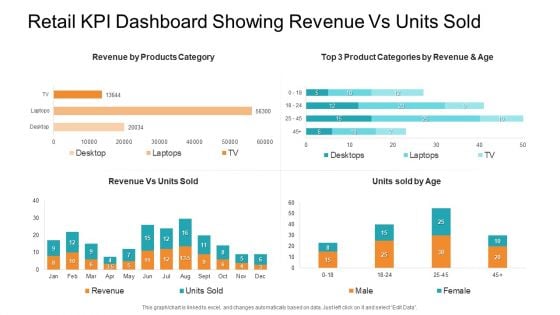
Retail KPI Dashboard Showing Revenue Vs Units Sold Designs PDF
Deliver and pitch your topic in the best possible manner with this retail KPI dashboard showing revenue vs units sold designs pdf. Use them to share invaluable insights on revenue vs units sold, male female and impress your audience. This template can be altered and modified as per your expectations. So, grab it now.
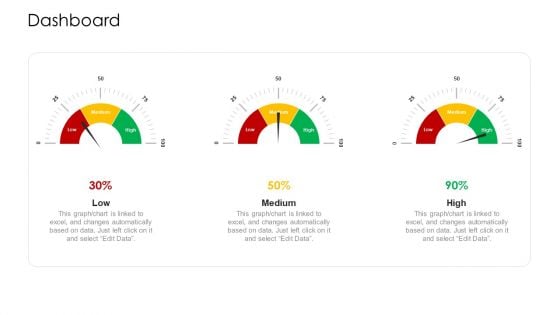
Logistic Network Administration Solutions Dashboard Ppt Professional Designs PDF
Deliver an awe inspiring pitch with this creative logistic network administration solutions dashboard ppt professional designs pdf bundle. Topics like low, medium, high can be discussed with this completely editable template. It is available for immediate download depending on the needs and requirements of the user.
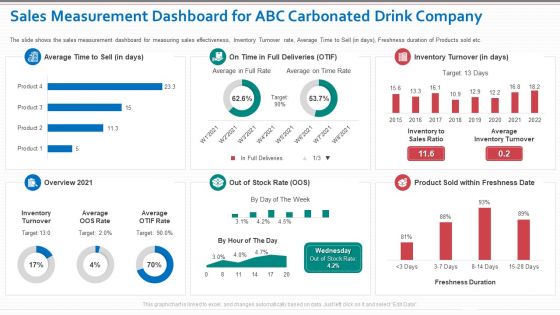
Sales Measurement Dashboard For ABC Carbonated Drink Company Designs PDF
Deliver an awe inspiring pitch with this creative sales measurement dashboard for abc carbonated drink company designs pdf bundle. Topics like inventory turnover, product sold within freshness date, freshness duration can be discussed with this completely editable template. It is available for immediate download depending on the needs and requirements of the user.
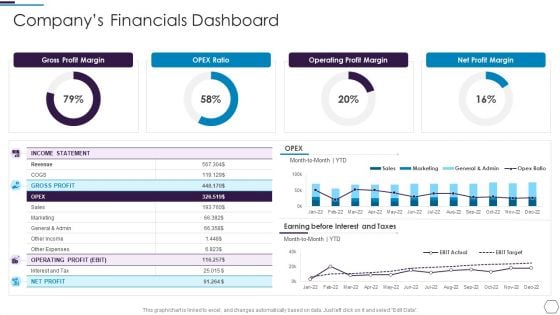
Information Technology Firm Report Example Companys Financials Dashboard Designs PDF
Deliver an awe inspiring pitch with this creative Information Technology Firm Report Example Companys Financials Dashboard Designs PDF bundle. Topics like Gross Profit, Operating Profit, Profit Margin can be discussed with this completely editable template. It is available for immediate download depending on the needs and requirements of the user.
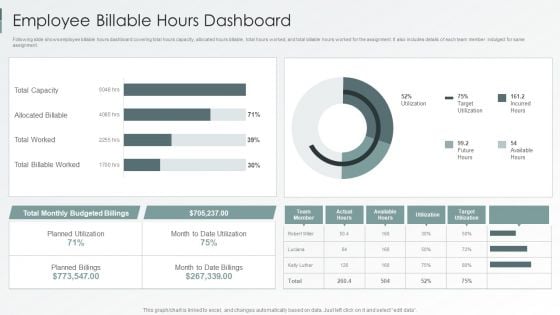
Enterprise Sustainability Performance Metrics Employee Billable Hours Dashboard Information PDF
Following slide shows employee billable hours dashboard covering total hours capacity, allocated hours billable, total hours worked, and total billable hours worked for the assignment. It also includes details of each team member indulged for same assignment.Deliver an awe inspiring pitch with this creative Enterprise Sustainability Performance Metrics Employee Billable Hours Dashboard Information PDF bundle. Topics like Billable Worked, Allocated Billable, Total Capacity can be discussed with this completely editable template. It is available for immediate download depending on the needs and requirements of the user.
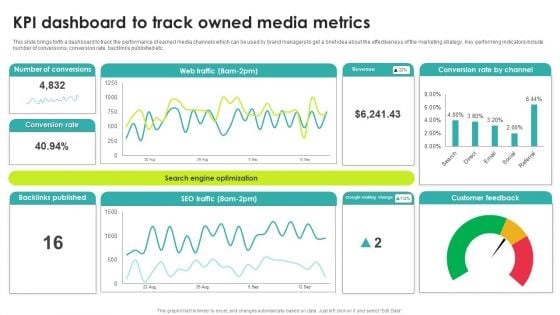
Kpi Dashboard To Track Owned Media Metrics Rules PDF
This slide brings forth a dashboard to track the performance of earned media channels which can be used by brand managers to get a brief idea about the effectiveness of the marketing strategy. Key performing indicators include number of conversions, conversion rate, backlinks published etc. Pitch your topic with ease and precision using this Kpi Dashboard To Track Owned Media Metrics Rules PDF. This layout presents information on Conversions, Backlinks Published, Metrics. It is also available for immediate download and adjustment. So, changes can be made in the color, design, graphics or any other component to create a unique layout.
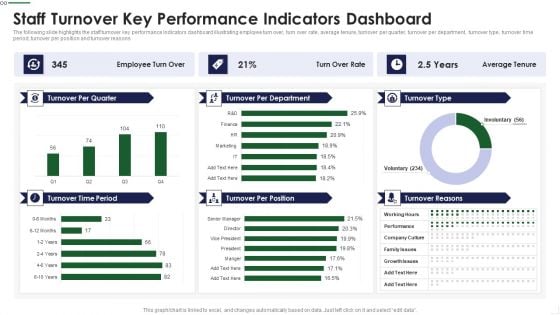
Staff Turnover Key Performance Indicators Dashboard Sample PDF
The following slide highlights the staff turnover key performance Indicators dashboard illustrating employee turn over, turn over rate, average tenure, turnover per quarter, turnover per department, turnover type, turnover time period, turnover per position and turnover reasons Deliver and pitch your topic in the best possible manner with this Staff Turnover Key Performance Indicators Dashboard Sample PDF Use them to share invaluable insights on Management Goals, Subjective Appraisal, Product Defects and impress your audience. This template can be altered and modified as per your expectations. So, grab it now.
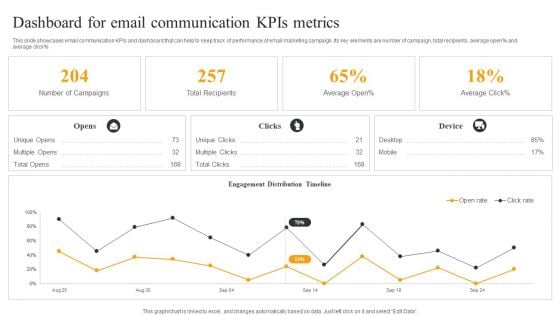
Dashboard For Email Communication Kpis Metrics Topics PDF
This slide showcases email communication KPIs and dashboard that can help to keep track of performance of email marketing campaign. Its key elements are number of campaign, total recipients, average open percent and average click percent. Showcasing this set of slides titled Dashboard For Email Communication Kpis Metrics Topics PDF. The topics addressed in these templates are Number Campaigns, Total Recipients, Engagement Distribution. All the content presented in this PPT design is completely editable. Download it and make adjustments in color, background, font etc. as per your unique business setting.
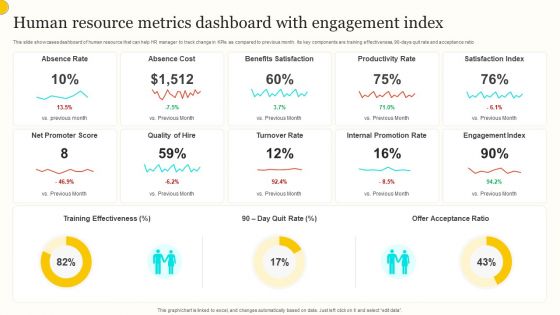
Human Resource Metrics Dashboard With Engagement Index Guidelines PDF
This slide showcases dashboard of human resource that can help HR manager to track change in KPIs as compared to previous month. Its key components are training effectiveness, 90 days quit rate and acceptance ratio. Pitch your topic with ease and precision using this Human Resource Metrics Dashboard With Engagement Index Guidelines PDF. This layout presents information on Absence Rate, Absence Cost, Benefits Satisfaction. It is also available for immediate download and adjustment. So, changes can be made in the color, design, graphics or any other component to create a unique layout.
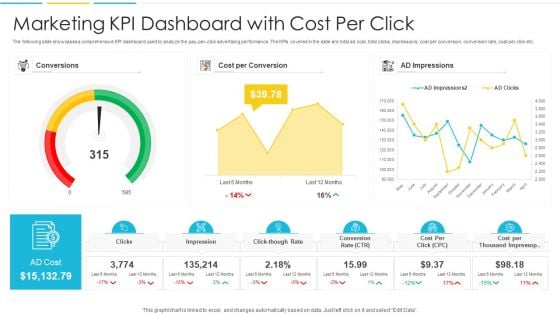
Marketing KPI Dashboard With Cost Per Click Infographics PDF
The following slide showcases a comprehensive KPI dashboard used to analyze the pay-per-click advertising performance. The KPIs covered in the slide are total ad cost, total clicks, impressions, cost per conversion, conversion rate, cost per click etc. Pitch your topic with ease and precision using this Marketing KPI Dashboard With Cost Per Click Infographics PDF. This layout presents information on Conversions, Cost, Impressions. It is also available for immediate download and adjustment. So, changes can be made in the color, design, graphics or any other component to create a unique layout.
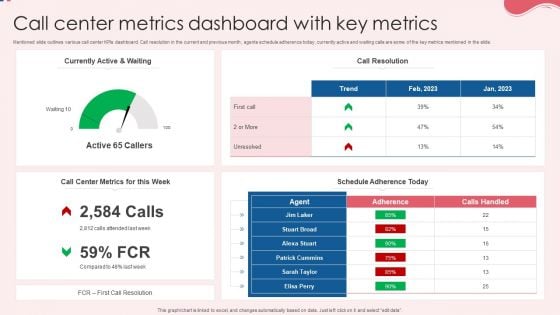
Call Center Metrics Dashboard With Key Metrics Information PDF
Mentioned slide outlines various call center KPIs dashboard. Call resolution in the current and previous month, agents schedule adherence today, currently active and waiting calls are some of the key metrics mentioned in the slide. Showcasing this set of slides titled Call Center Metrics Dashboard With Key Metrics Information PDF. The topics addressed in these templates are Currently Active, Call Resolution, Key Metrics. All the content presented in this PPT design is completely editable. Download it and make adjustments in color, background, font etc. as per your unique business setting.
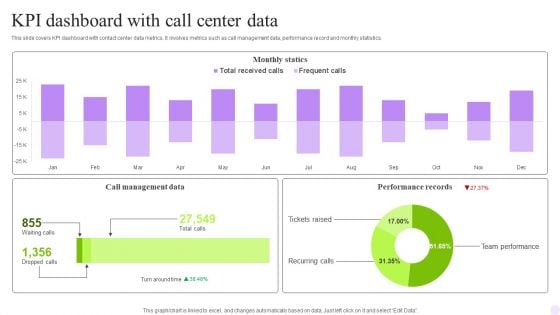
KPI Dashboard With Call Center Data Rules PDF
This slide covers contact center performance metrics KPI dashboard. It involves details such as number of total calls, average answer speed, abandon rate, data of agents performance and call abandon rate by departments. Pitch your topic with ease and precision using this KPI Dashboard With Call Center Data Rules PDF. This layout presents information on Monthly Statics, Management Data, Performance Records. It is also available for immediate download and adjustment. So, changes can be made in the color, design, graphics or any other component to create a unique layout.
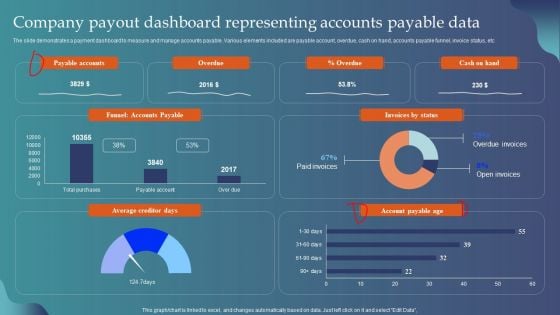
Company Payout Dashboard Representing Accounts Payable Data Introduction PDF
The slide demonstrates a payment dashboard to measure and manage accounts payable. Various elements included are payable account, overdue, cash on hand, accounts payable funnel, invoice status, etc. Pitch your topic with ease and precision using this Company Payout Dashboard Representing Accounts Payable Data Introduction PDF. This layout presents information on Payable Accounts, Overdue, Invoices By Status, Account Payable Age. It is also available for immediate download and adjustment. So, changes can be made in the color, design, graphics or any other component to create a unique layout.
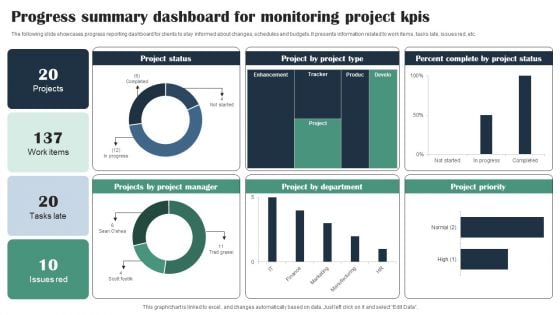
Progress Summary Dashboard For Monitoring Project Kpis Infographics PDF
The following slide showcases progress reporting dashboard for clients to stay informed about changes, schedules and budgets. It presents information related to work items, tasks late, issues red, etc. Pitch your topic with ease and precision using this Progress Summary Dashboard For Monitoring Project Kpis Infographics PDF. This layout presents information on Project Status, Project Manager, Project Type, Percent Complete. It is also available for immediate download and adjustment. So, changes can be made in the color, design, graphics or any other component to create a unique layout.
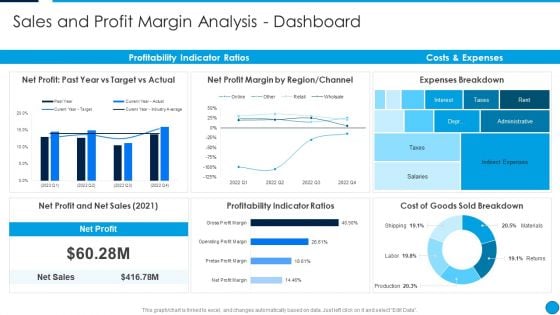
Summary Financial Sales And Profit Margin Analysis Dashboard Pictures PDF
This graph or chart is linked to excel, and changes automatically based on data. Just left click on it and select Edit Data. Deliver an awe inspiring pitch with this creative Summary Financial Sales And Profit Margin Analysis Dashboard Pictures PDF bundle. Topics like Net Profit, Past Year Vs Target Vs Actual, Net Profit Margin By Region, Channel, Expenses Breakdown, Costs And Expenses, Profitability Indicator Ratios can be discussed with this completely editable template. It is available for immediate download depending on the needs and requirements of the user.
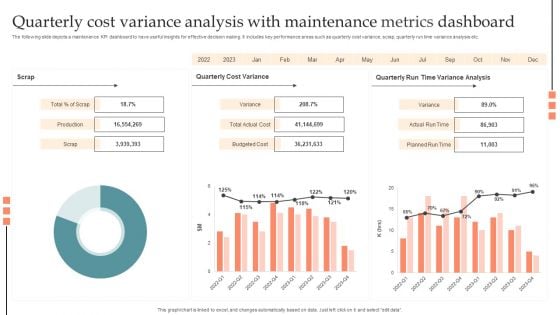
Quarterly Cost Variance Analysis With Maintenance Metrics Dashboard Information PDF
The following slide depicts a maintenance KPI dashboard to have useful insights for effective decision making. It includes key performance areas such as quarterly cost variance, scrap, quarterly run time variance analysis etc. Pitch your topic with ease and precision using this Quarterly Cost Variance Analysis With Maintenance Metrics Dashboard Information PDF. This layout presents information on Production, Budgeted Cost, Planned Run Time, Actual Run Time. It is also available for immediate download and adjustment. So, changes can be made in the color, design, graphics or any other component to create a unique layout.
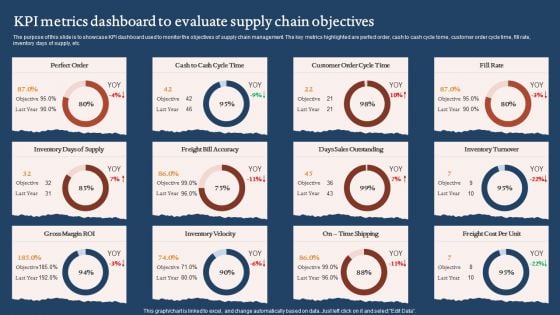
KPI Metrics Dashboard To Evaluate Supply Chain Objectives Graphics PDF
The purpose of this slide is to showcase KPI dashboard used to monitor the objectives of supply chain management. The key metrics highlighted are perfect order, cash to cash cycle tome, customer order cycle time, fill rate, inventory days of supply, etc. Pitch your topic with ease and precision using this KPI Metrics Dashboard To Evaluate Supply Chain Objectives Graphics PDF. This layout presents information on Days Sales Outstanding, Inventory Velocity, Gross Margin Roi. It is also available for immediate download and adjustment. So, changes can be made in the color, design, graphics or any other component to create a unique layout.
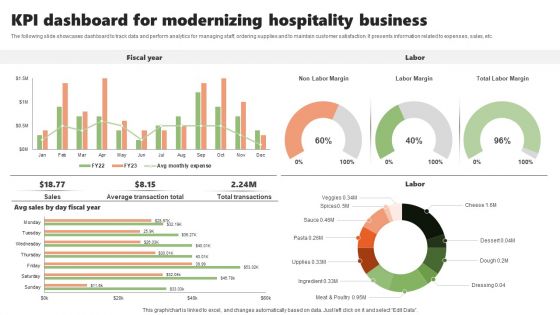
KPI Dashboard For Modernizing Hospitality Business Inspiration PDF
The following slide showcases dashboard to track data and perform analytics for managing staff, ordering supplies and to maintain customer satisfaction. It presents information related to expenses, sales, etc. Pitch your topic with ease and precision using this KPI Dashboard For Modernizing Hospitality Business Inspiration PDF. This layout presents information on Fiscal Year, Labor, Modernizing Hospitality. It is also available for immediate download and adjustment. So, changes can be made in the color, design, graphics or any other component to create a unique layout.
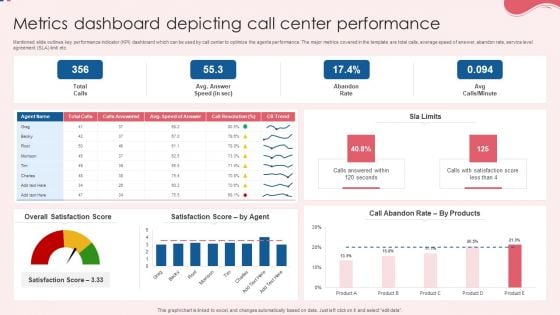
Metrics Dashboard Depicting Call Center Performance Pictures PDF
Mentioned slide outlines key performance indicator KPI dashboard which can be used by call center to optimize the agents performance. The major metrics covered in the template are total calls, average speed of answer, abandon rate, service level agreement SLA limit etc. Pitch your topic with ease and precision using this Metrics Dashboard Depicting Call Center Performance Pictures PDF. This layout presents information on Overall Satisfaction Score, Satisfaction Score, Performance. It is also available for immediate download and adjustment. So, changes can be made in the color, design, graphics or any other component to create a unique layout.
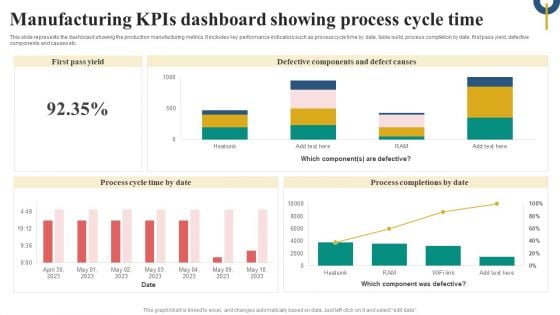
Manufacturing Kpis Dashboard Showing Process Cycle Time Microsoft PDF
This slide represents the dashboard showing the production manufacturing metrics. It includes key performance indicators such as process cycle time by date, table build, process completion by date, first pass yield, defective components and causes etc. Pitch your topic with ease and precision using this Manufacturing Kpis Dashboard Showing Process Cycle Time Microsoft PDF. This layout presents information on Defective Components Defect Causes, Process Cycle, Time By Date, Process Completions By Date. It is also available for immediate download and adjustment. So, changes can be made in the color, design, graphics or any other component to create a unique layout.
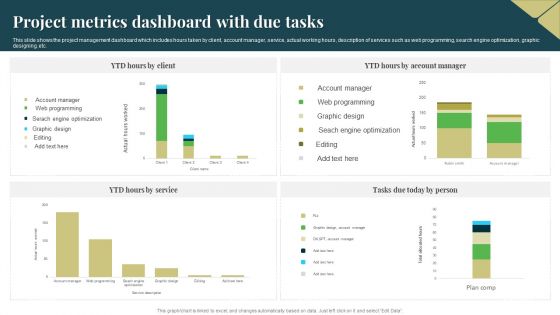
Project Metrics Dashboard With Due Tasks Microsoft PDF
This slide shows the project management dashboard which includes hours taken by client, account manager, service, actual working hours, description of services such as web programming, search engine optimization, graphic designing, etc. Pitch your topic with ease and precision using this Project Metrics Dashboard With Due Tasks Microsoft PDF. This layout presents information on Service, Optimization, Graphic Design. It is also available for immediate download and adjustment. So, changes can be made in the color, design, graphics or any other component to create a unique layout.
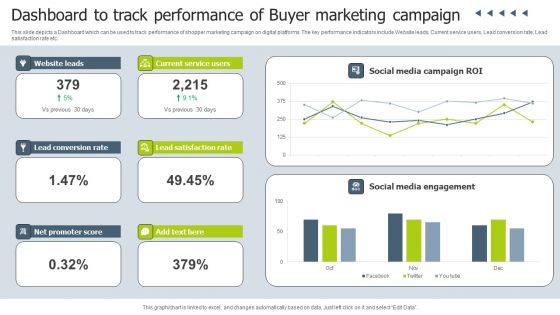
Dashboard To Track Performance Of Buyer Marketing Campaign Infographics PDF
This slide depicts a Dashboard which can be used to track performance of shopper marketing campaign on digital platforms. The key performance indicators include Website leads, Current service users, Lead conversion rate, Lead satisfaction rate etc. Pitch your topic with ease and precision using this Dashboard To Track Performance Of Buyer Marketing Campaign Infographics PDF. This layout presents information on Social Media Campaign, Social Media Engagement, Current Service Users. It is also available for immediate download and adjustment. So, changes can be made in the color, design, graphics or any other component to create a unique layout.

Project Metrics Dashboard With Average Margin Sample PDF
This slide focuses on project management dashboard which covers number of active projects, average margin, revenues, costs, tasks status, resources with planned and actual efforts, available hours, tasks assignments with project deadlines, client, etc. Pitch your topic with ease and precision using this Project Metrics Dashboard With Average Margin Sample PDF. This layout presents information on Average Margin, Revenue, Cost. It is also available for immediate download and adjustment. So, changes can be made in the color, design, graphics or any other component to create a unique layout.
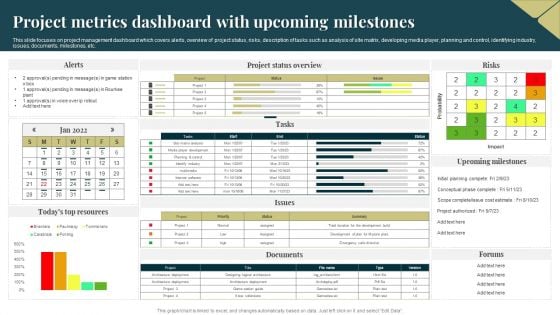
Project Metrics Dashboard With Upcoming Milestones Demonstration PDF
This slide focuses on project management dashboard which covers alerts, overview of project status, risks, description of tasks such as analysis of site matrix, developing media player, planning and control, identifying industry, issues, documents, milestones, etc. Pitch your topic with ease and precision using this Project Metrics Dashboard With Upcoming Milestones Demonstration PDF. This layout presents information on Probability, Project, Risks. It is also available for immediate download and adjustment. So, changes can be made in the color, design, graphics or any other component to create a unique layout.
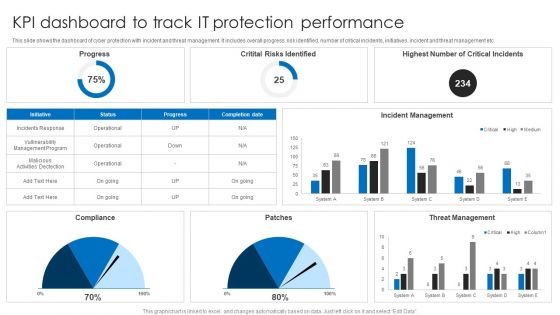
KPI Dashboard To Track IT Protection Performance Elements PDF
This slide shows the dashboard of cyber protection with incident and threat management. It includes overall progress, risk identified, number of critical incidents, initiatives, incident and threat management etc. Pitch your topic with ease and precision using this KPI Dashboard To Track IT Protection Performance Elements PDF. This layout presents information on Incident Management, Threat Management, Critital Risks Identified. It is also available for immediate download and adjustment. So, changes can be made in the color, design, graphics or any other component to create a unique layout.
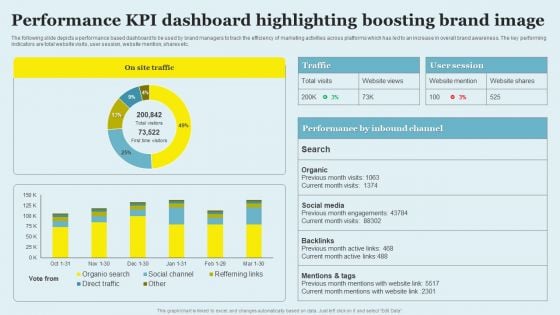
Performance KPI Dashboard Highlighting Boosting Brand Image Sample PDF
The following slide depicts a performance based dashboard to be used by brand managers to track the efficiency of marketing activities across platforms which has led to an increase in overall brand awareness. The key performing indicators are total website visits, user session, website mention, shares etc. Showcasing this set of slides titled Performance KPI Dashboard Highlighting Boosting Brand Image Sample PDF. The topics addressed in these templates are Social Media, Backlinks, Mentions Tags. All the content presented in this PPT design is completely editable. Download it and make adjustments in color, background, font etc. as per your unique business setting.
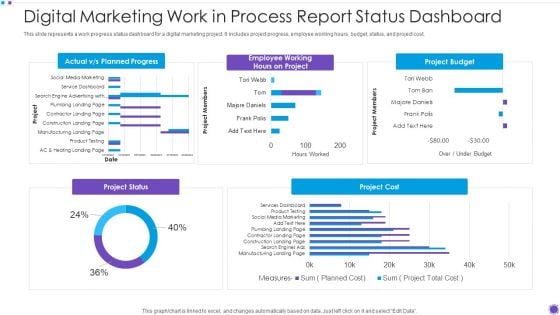
Digital Marketing Work In Process Report Status Dashboard Background PDF
Showcasing this set of slides titled digital marketing work in process report status dashboard background pdf. The topics addressed in these templates are project budget, planned, project cost. All the content presented in this PPT design is completely editable. Download it and make adjustments in color, background, font etc. as per your unique business setting.
KPI Dashboard For Tracking Project Summary Ppt Status Themes PDF
This slide brings forth dashboard which assists project managers in tracking the status of projects . The key performance indicators are project title, tag, responsibility, date assigned, project team, progress, deadline and status. Persuade your audience using this KPI Dashboard For Tracking Project Summary Ppt Status Themes PDF. This PPT design covers one stages, thus making it a great tool to use. It also caters to a variety of topics including Project Title, Responsibility, Date Assigned. Download this PPT design now to present a convincing pitch that not only emphasizes the topic but also showcases your presentation skills.
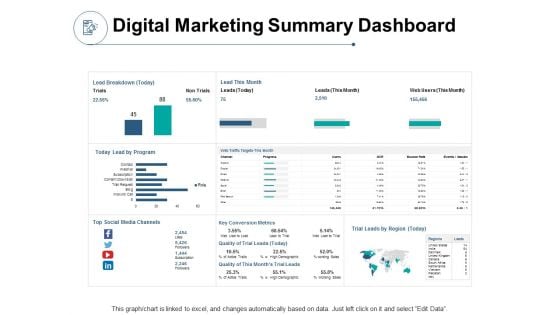
Digital Marketing Summary Dashboard Ppt PowerPoint Presentation Ideas Structure
Presenting this set of slides with name digital marketing summary dashboard ppt powerpoint presentation ideas structure. The topics discussed in these slides are finance, marketing, management, investment, analysis. This is a completely editable PowerPoint presentation and is available for immediate download. Download now and impress your audience.
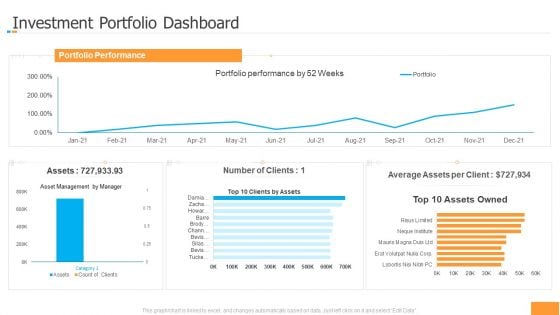
Funding Pitch Book Outline Investment Portfolio Dashboard Structure PDF
Deliver an awe inspiring pitch with this creative funding pitch book outline investment portfolio dashboard structure pdf bundle. Topics like portfolio, performance, management can be discussed with this completely editable template. It is available for immediate download depending on the needs and requirements of the user.

PMO KPI Dashboard With Completion Timeline Background PDF
Showcasing this set of slides titled PMO KPI Dashboard With Completion Timeline Background PDF The topics addressed in these templates are Projects Completion Timeline, Projects Performance Snapshot, Project Health All the content presented in this PPT design is completely editable. Download it and make adjustments in color, background, font etc. as per your unique business setting.
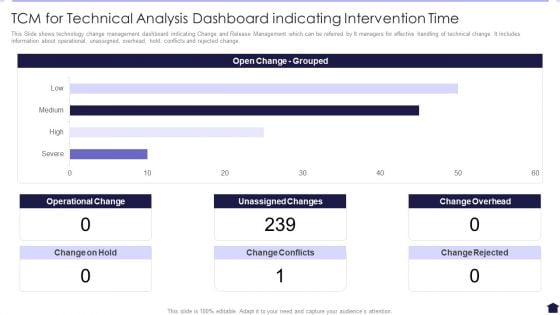
TCM For Technical Analysis Dashboard Indicating Intervention Time Background PDF
This Slide shows technology change management dashboard indicating Change and Release Management which can be referred by It managers for effective handling of technical change. It includes information about operational, unassigned, overhead, hold, conflicts and rejected change. Showcasing this set of slides titled TCM For Technical Analysis Dashboard Indicating Intervention Time Background PDF. The topics addressed in these templates are Operational Change, Unassigned Changes, Change Overhead. All the content presented in this PPT design is completely editable. Download it and make adjustments in color, background, font etc. as per your unique business setting.
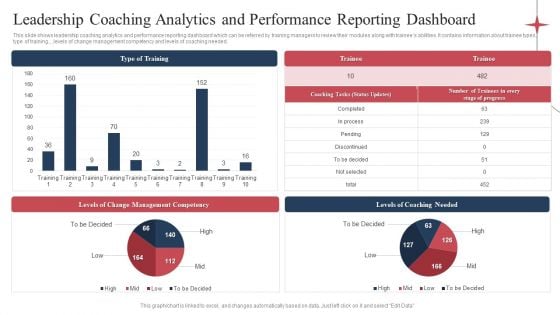
Leadership Coaching Analytics And Performance Reporting Dashboard Demonstration PDF
This slide shows leadership coaching analytics and performance reporting dashboard which can be referred by training managers to review their modules along with trainees abilities. It contains information about trainee types, type of training., ,levels of change management competency and levels of coaching needed. Pitch your topic with ease and precision using this Leadership Coaching Analytics And Performance Reporting Dashboard Demonstration PDF. This layout presents information on Levels Coaching Needed, Levels Change Management, Type Training. It is also available for immediate download and adjustment. So, changes can be made in the color, design, graphics or any other component to create a unique layout.


 Continue with Email

 Home
Home


