Executive Dashboard
Fuel Meter Vector Icon Ppt PowerPoint Presentation Professional Examples PDF
Persuade your audience using this fuel meter vector icon ppt powerpoint presentation professional examples pdf. This PPT design covers four stages, thus making it a great tool to use. It also caters to a variety of topics including fuel meter vector icon. Download this PPT design now to present a convincing pitch that not only emphasizes the topic but also showcases your presentation skills.
Disaster Threat Severity Assessment Icon Ppt Show Slides PDF
Persuade your audience using this Disaster Threat Severity Assessment Icon Ppt Show Slides PDF. This PPT design covers four stages, thus making it a great tool to use. It also caters to a variety of topics including Disaster Threat, Severity Assessment, Icon. Download this PPT design now to present a convincing pitch that not only emphasizes the topic but also showcases your presentation skills.
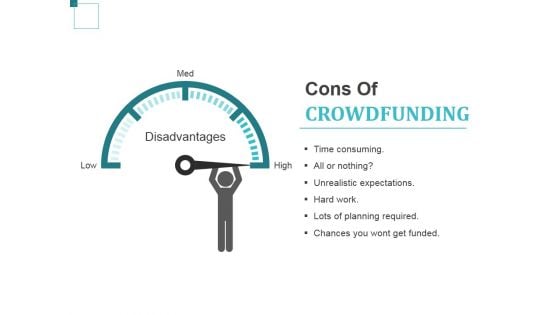
Cons Of Crowdfunding Ppt PowerPoint Presentation Gallery Layout Ideas
This is a cons of crowdfunding ppt powerpoint presentation gallery layout ideas. This is a five stage process. The stages in this process are disadvantages, time consuming, unrealistic expectations, hard work, chances you wont get funded, lots of planning required.
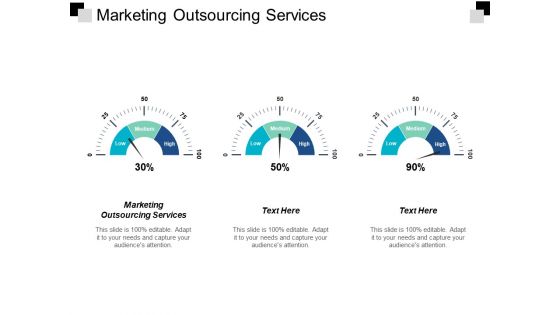
Marketing Outsourcing Services Ppt PowerPoint Presentation Professional Grid Cpb
This is a marketing outsourcing services ppt powerpoint presentation professional grid cpb. This is a three stage process. The stages in this process are marketing outsourcing services, business, management, marketing.
Business Partnership Trust Vector Icon Ppt PowerPoint Presentation Inspiration Slides PDF
Persuade your audience using this business partnership trust vector icon ppt powerpoint presentation inspiration slides pdf. This PPT design covers three stages, thus making it a great tool to use. It also caters to a variety of topics including business partnership trust vector icon. Download this PPT design now to present a convincing pitch that not only emphasizes the topic but also showcases your presentation skills.
Company Website Trust Meter Vector Icon Ppt PowerPoint Presentation Infographics Example PDF
Persuade your audience using this company website trust meter vector icon ppt powerpoint presentation infographics example pdf. This PPT design covers two stages, thus making it a great tool to use. It also caters to a variety of topics including company website trust meter vector icon. Download this PPT design now to present a convincing pitch that not only emphasizes the topic but also showcases your presentation skills.
Employee Trust Meter Vector Icon Ppt PowerPoint Presentation Infographics Good PDF
Persuade your audience using this employee trust meter vector icon ppt powerpoint presentation infographics good pdf. This PPT design covers three stages, thus making it a great tool to use. It also caters to a variety of topics including employee trust meter vector icon. Download this PPT design now to present a convincing pitch that not only emphasizes the topic but also showcases your presentation skills.
Security Shield And Meter Vector Icon Ppt PowerPoint Presentation Styles Summary PDF
Persuade your audience using this security shield and meter vector icon ppt powerpoint presentation styles summary pdf. This PPT design covers three stages, thus making it a great tool to use. It also caters to a variety of topics including security shield and meter vector icon. Download this PPT design now to present a convincing pitch that not only emphasizes the topic but also showcases your presentation skills.

Picture Of Fuel Gauge With Pointing Level Ppt PowerPoint Presentation Infographic Template Graphics PDF
Persuade your audience using this picture of fuel gauge with pointing level ppt powerpoint presentation infographic template graphics pdf. This PPT design covers two stages, thus making it a great tool to use. It also caters to a variety of topics including picture of fuel gauge with pointing level. Download this PPT design now to present a convincing pitch that not only emphasizes the topic but also showcases your presentation skills.
Deal Assessment Audit Process Customer Satisfaction Icons PDF
Presenting deal assessment audit process customer satisfaction icons pdf to provide visual cues and insights. Share and navigate important information on three stages that need your due attention. This template can be used to pitch topics like overall satisfaction with service, satisfaction with value for money, overall satisfaction with relationship. In addition, this PPT design contains high-resolution images, graphics, etc, that are easily editable and available for immediate download.
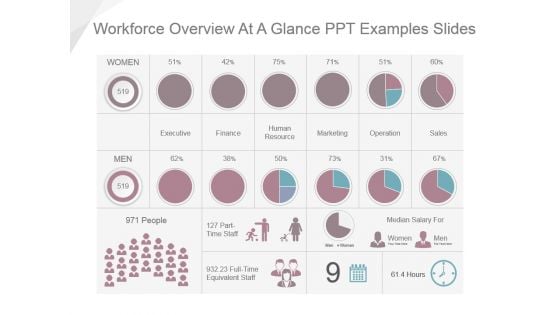
Workforce Overview At A Glance Ppt Examples Slides
This is a workforce overview at a glance ppt examples slides. This is a seven stage process. The stages in this process are executive, finance, human resource, marketing, operation, sales, median salary for.
Stopwatch For Speed Calculation Powerpoint Slides
This innovative, stunningly beautiful dashboard has been designed for speed calculation. It contains graphics of stopwatch. This PowerPoint template helps to display your information in a useful, simple and orderly way.
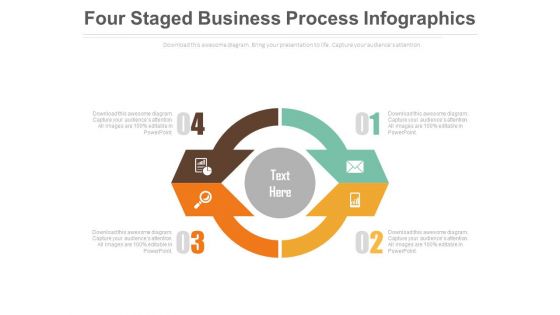
Four Steps Circular Infographic Powerpoint Slides
This innovative, stunningly beautiful dashboard has been designed for data visualization. It contains circular infographic design. This PowerPoint template helps to display your information in a useful, simple and orderly way.
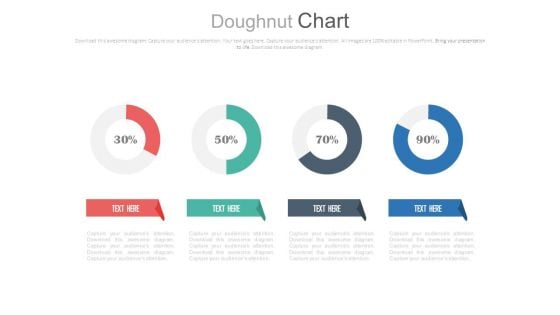
Four Circle Chart With Percentage Ratios Powerpoint Slides
This PowerPoint template has been designed with graphics of four circles and percentage ratios. You may use this dashboard slide design for topics like profit growth and financial planning. This PPT slide is powerful tool to describe your ideas.
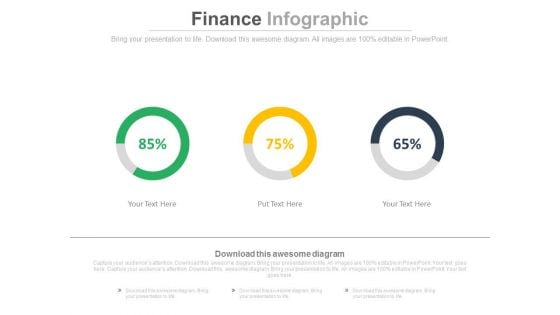
Linear Circles Percentage Analysis Charts Powerpoint Slides
This PowerPoint template has been designed with graphics of three circles and percentage ratios. You may use this dashboard slide design for topics like profit growth and financial planning. This PPT slide is powerful tool to describe your ideas.
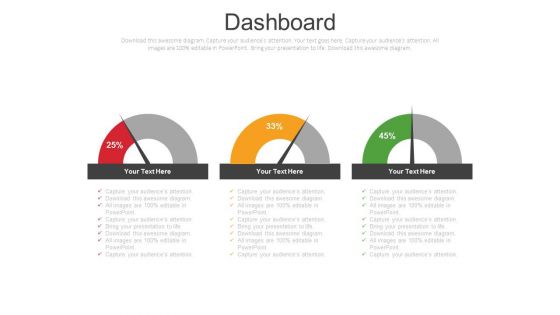
Parameters Of Growth And Development Powerpoint Slides
Dashboard design has been displayed in this business slide. This business diagram helps to exhibit parameters of growth and development. Download this PowerPoint template to build an exclusive presentation.
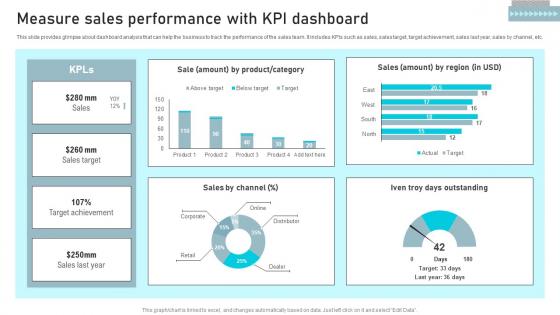
Measure Sales Performance With Business Sales Enhancement Campaign Inspiration Pdf
This slide provides glimpse about dashboard analysis that can help the business to track the performance of the sales team. It includes KPIs such as sales, sales target, target achievement, sales last year, sales by channel, etc. The Measure Sales Performance With Business Sales Enhancement Campaign Inspiration Pdf is a compilation of the most recent design trends as a series of slides. It is suitable for any subject or industry presentation, containing attractive visuals and photo spots for businesses to clearly express their messages. This template contains a variety of slides for the user to input data, such as structures to contrast two elements, bullet points, and slides for written information. Slidegeeks is prepared to create an impression. This slide provides glimpse about dashboard analysis that can help the business to track the performance of the sales team. It includes KPIs such as sales, sales target, target achievement, sales last year, sales by channel, etc.
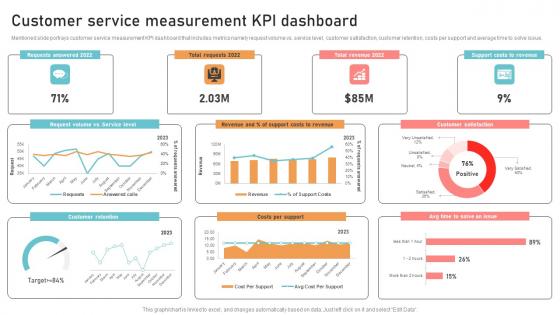
Optimizing Business Integration Customer Service Measurement KPI Template Pdf
Mentioned slide portrays customer service measurement KPI dashboard that includes metrics namely request volume vs. service level, customer satisfaction, customer retention, costs per support and average time to solve issue. Slidegeeks is here to make your presentations a breeze with Optimizing Business Integration Customer Service Measurement KPI Template Pdf With our easy to use and customizable templates, you can focus on delivering your ideas rather than worrying about formatting. With a variety of designs to choose from, you are sure to find one that suits your needs. And with animations and unique photos, illustrations, and fonts, you can make your presentation pop. So whether you are giving a sales pitch or presenting to the board, make sure to check out Slidegeeks first. Mentioned slide portrays customer service measurement KPI dashboard that includes metrics namely request volume vs. service level, customer satisfaction, customer retention, costs per support and average time to solve issue.
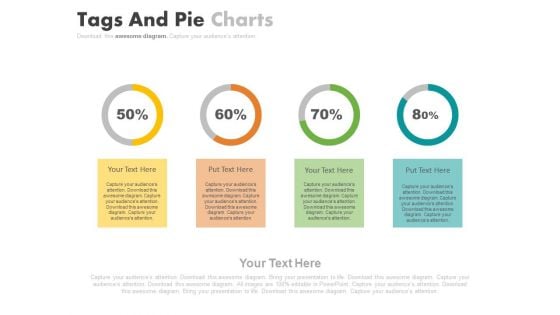
Four Steps For Financial Data Analysis Powerpoint Slides
This PowerPoint contains four circles with percentage values. Download this diagram slide to display financial data analysis. This template is editable, You can edit text, color, shade and style of this diagram as per you need.

Operational Performance Management Powerpoint Layout
This is a operational performance management powerpoint layout. This is a one stage process. The stages in this process are dashboard, measure, business.
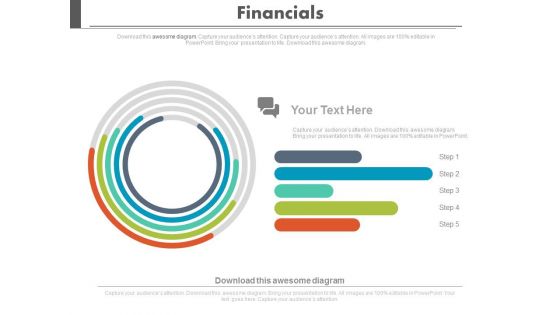
Financial Growth Analysis Circular Chart Powerpoint Slides
Visually support your presentation with our above template containing graphics of circular chart. This diagram slide helps to display financial growth analysis. Etch your views in the brains of your audience with this diagram slide.
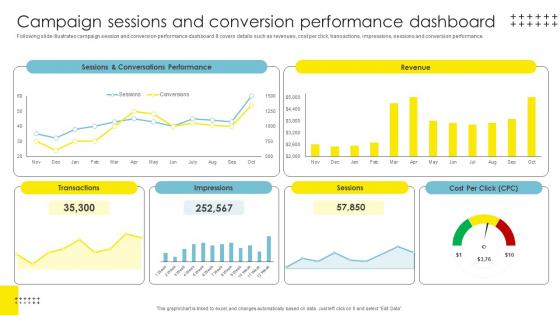
Campaign Sessions And Conversion Strategic Brand Management Template Pdf
Following slide illustrates campaign session and conversion performance dashboard. It covers details such as revenues, cost per click, transactions, impressions, sessions and conversion performance. Get a simple yet stunning designed Campaign Sessions And Conversion Strategic Brand Management Template Pdf. It is the best one to establish the tone in your meetings. It is an excellent way to make your presentations highly effective. So, download this PPT today from Slidegeeks and see the positive impacts. Our easy to edit Campaign Sessions And Conversion Strategic Brand Management Template Pdf can be your go to option for all upcoming conferences and meetings. So, what are you waiting for Grab this template today. Following slide illustrates campaign session and conversion performance dashboard. It covers details such as revenues, cost per click, transactions, impressions, sessions and conversion performance.
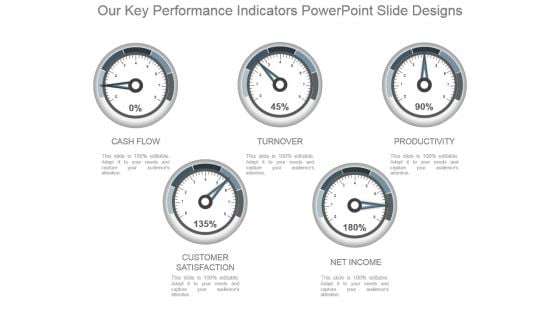
Our Key Performance Indicators Powerpoint Slide Designs
This is a our key performance indicators powerpoint slide designs. This is a five stage process. The stages in this process are cash flow, turnover, productivity, customer satisfaction, net income.
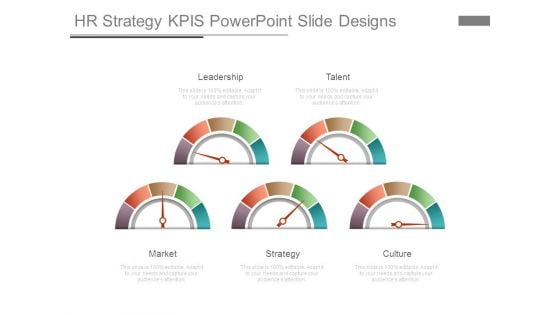
Hr Strategy Kpis Powerpoint Slide Designs
This is a hr strategy kpis powerpoint slide designs. This is a five stage process. The stages in this process are leadership, talent, market, strategy, culture.
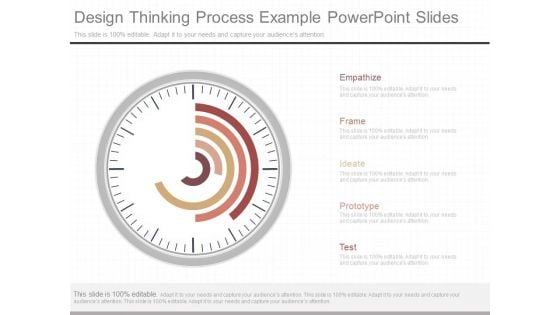
Design Thinking Process Example Powerpoint Slides
This is a design thinking process example powerpoint slides. This is a five stage process. The stages in this process are empathize, frame, ideate, prototype, test.
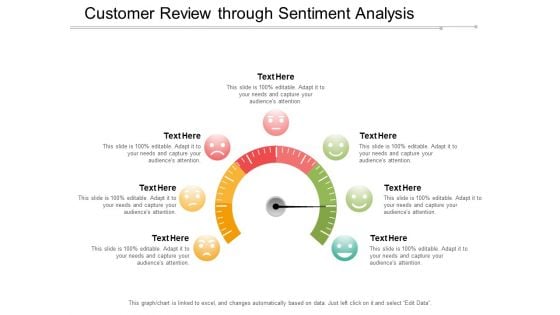
Customer Review Through Sentiment Analysis Ppt Powerpoint Presentation Show Design Templates
This is a customer review through sentiment analysis ppt powerpoint presentation show design templates. This is a six stage process. The stages in this process are feeling, emotion, sentiment.
Entrepreneurship And Innovation Management Ppt Icon
This is a entrepreneurship and innovation management ppt icon. This is a four stage process. The stages in this process are vision, mission, strategy, action plan.
Architecture Plan Powerpoint Slide Backgrounds
This is a architecture plan powerpoint slide backgrounds. This is a two stage process. The stages in this process are architecture plan, platforms release.
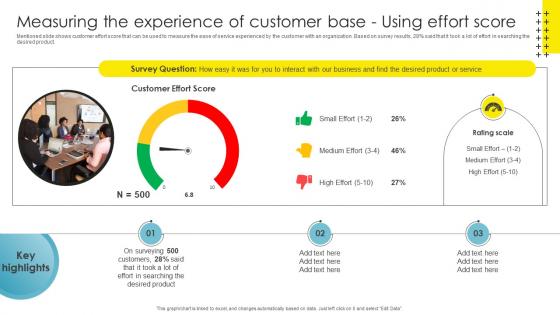
Measuring The Experience Of Customer Strategic Brand Management Infographics Pdf
Mentioned slide shows customer effort score that can be used to measure the ease of service experienced by the customer with an organization. Based on survey results, 28 percentage said that it took a lot of effort in searching the desired product. Crafting an eye catching presentation has never been more straightforward. Let your presentation shine with this tasteful yet straightforward Measuring The Experience Of Customer Strategic Brand Management Infographics Pdf template. It offers a minimalistic and classy look that is great for making a statement. The colors have been employed intelligently to add a bit of playfulness while still remaining professional. Construct the ideal Measuring The Experience Of Customer Strategic Brand Management Infographics Pdf that effortlessly grabs the attention of your audience. Begin now and be certain to wow your customers. Mentioned slide shows customer effort score that can be used to measure the ease of service experienced by the customer with an organization. Based on survey results, 28 percentage said that it took a lot of effort in searching the desired product.
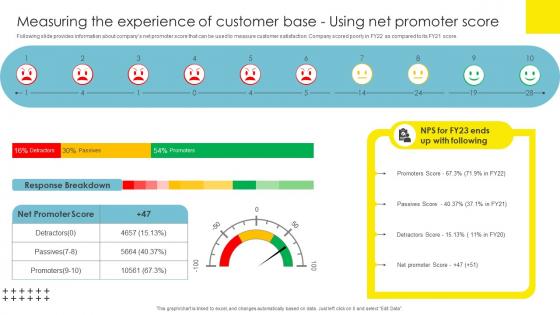
Measuring The Experience Of Strategic Brand Management Themes Pdf
Following slide provides information about companys net promoter score that can be used to measure customer satisfaction. Company scored poorly in FY22 as compared to its FY21 score. Make sure to capture your audiences attention in your business displays with our gratis customizable Measuring The Experience Of Strategic Brand Management Themes Pdf. These are great for business strategies, office conferences, capital raising or task suggestions. If you desire to acquire more customers for your tech business and ensure they stay satisfied, create your own sales presentation with these plain slides. Following slide provides information about companys net promoter score that can be used to measure customer satisfaction. Company scored poorly in FY22 as compared to its FY21 score.
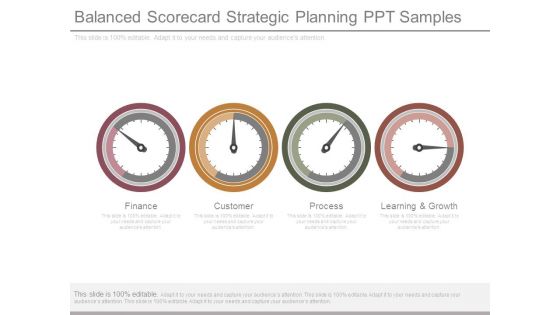
Balanced Scorecard Strategic Planning Ppt Samples
This is a balanced scorecard strategic planning ppt samples. This is a four stage process. The stages in this process are finance, customer, process, learning and growth.
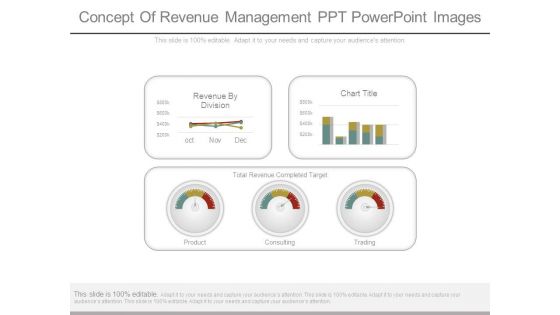
Concept Of Revenue Management Ppt Powerpoint Images
This is a concept of revenue management ppt powerpoint images. This is a five stage process. The stages in this process are revenue by division, chart title, total revenue completed target, product, consulting, trading.
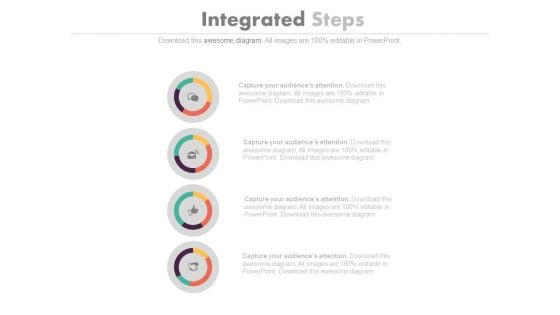
Four Steps For Business Plans Outline Powerpoint Slides
Visually support your presentation with our above template containing four circles with icons. This diagram slide helps to display business plan outline. Etch your views in the brains of your audience with this diagram slide.
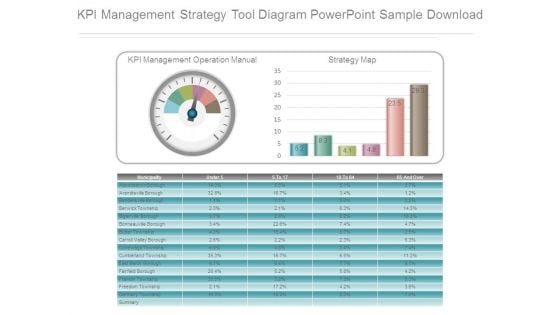
Kpi Management Strategy Tool Diagram Powerpoint Sample Download
This is a kpi management strategy tool diagram powerpoint sample download. This is a one stage process. The stages in this process are kpi management operation manual, strategy map.
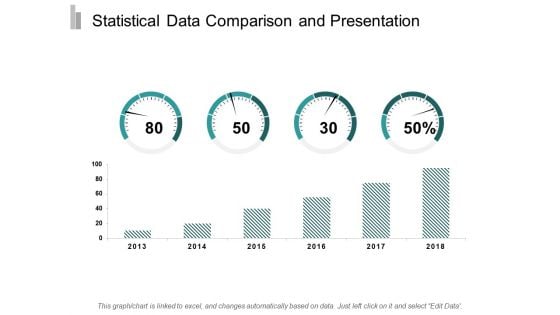
Statistical Data Comparison And Presentation Ppt Powerpoint Presentation Gallery Backgrounds
This is a statistical data comparison and presentation ppt powerpoint presentation gallery backgrounds. This is a two stage process. The stages in this process are data presentation, content presentation, information presentation.
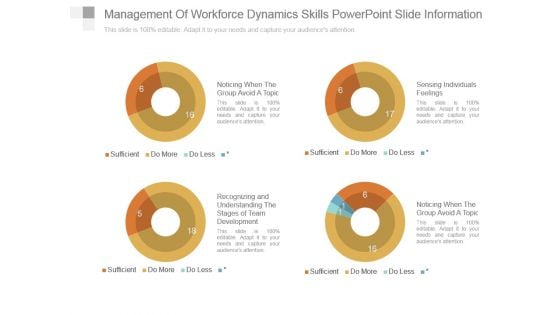
Management Of Workforce Dynamics Skills Powerpoint Slide Information
This is a management of workforce dynamics skills powerpoint slide information. This is a four stage process. The stages in this process are noticing when the group avoid a topic, recognizing and understanding the, stages of team development, sensing individuals feelings, noticing when the group avoid a topic.
Market Trends Chart With Icons Powerpoint Slides
This PowerPoint template has been designed with business info graphic chart. You may use this business slide design to display market trends. This PPT slide is powerful tool to describe your ideas.
Circle Diagram With Team Icon Powerpoint Slides
This PowerPoint template has been designed with circle diagram and team icons. You may download this PPT slide to display team planning and strategy. This PowerPoint template helps to display your information in a useful, simple and orderly way.
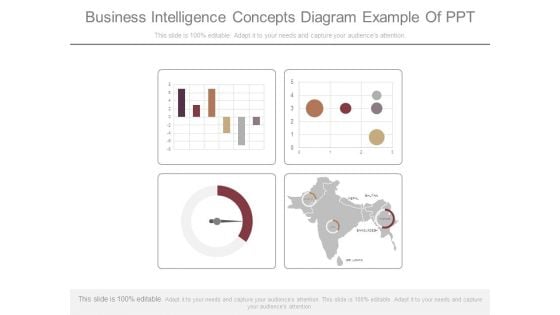
Business Intelligence Concepts Diagram Example Of Ppt
This is a business intelligence concepts diagram example of ppt. This is a four stage process. The stages in this process are location, measuring, business, strategy, management.
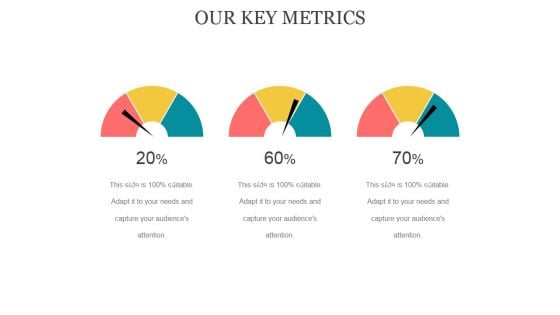
Our Key Metrics Ppt PowerPoint Presentation Styles
This is a our key metrics ppt powerpoint presentation styles. This is a three stage process. The stages in this process are business, marketing, dashboard, planning, analysis.
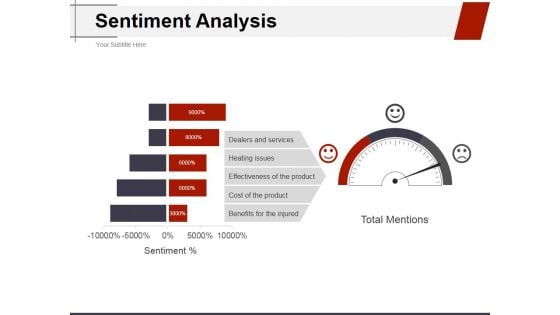
Sentiment Analysis Ppt PowerPoint Presentation Ideas Structure
This is a sentiment analysis ppt powerpoint presentation ideas structure. This is a three stage process. The stages in this process are dealers and services, heating issues, effectiveness of the product, cost of the product, benefits for the injured.
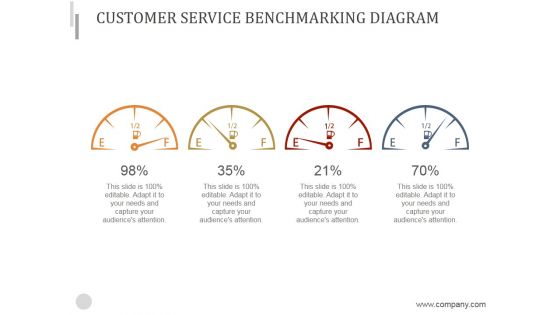
Customer Service Benchmarking Diagram Ppt PowerPoint Presentation Design Ideas
This is a customer service benchmarking diagram ppt powerpoint presentation design ideas. This is a four stage process. The stages in this process are benchmarking, dashbord, business, marketing, strategy.
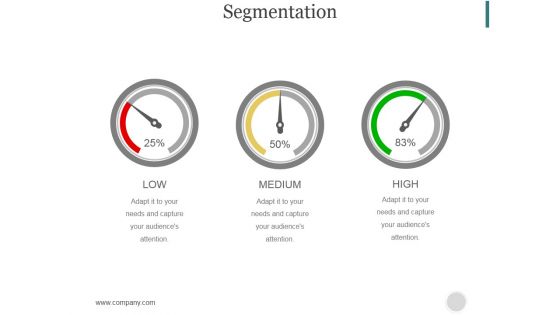
Segmentation Ppt PowerPoint Presentation Portfolio
This is a segmentation ppt powerpoint presentation portfolio. This is a three stage process. The stages in this process are low, medium, high.
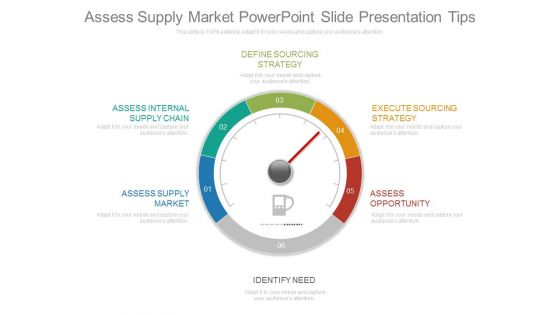
Assess Supply Market Powerpoint Slide Presentation Tips
This is a assess supply market powerpoint slide presentation tips. This is a six stage process. The stages in this process are define sourcing strategy, assess internal supply chain, execute sourcing strategy, assess supply market, assess opportunity, identify need.
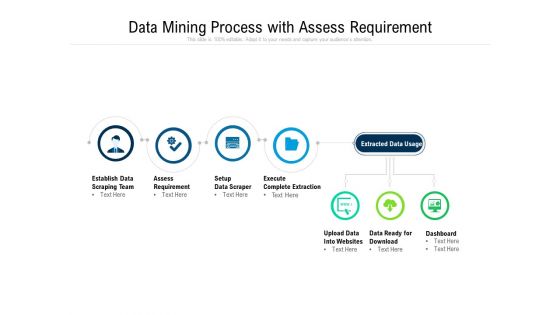
Data Mining Process With Assess Requirement Ppt PowerPoint Presentation Slides Format Ideas PDF
Persuade your audience using this data mining process with assess requirement ppt powerpoint presentation slides format ideas pdf. This PPT design covers eight stages, thus making it a great tool to use. It also caters to a variety of topics including establish data scraping team, assess requirement, setup, data scraper execute, complete extraction, data ready for download, dashboard, upload data into websites. Download this PPT design now to present a convincing pitch that not only emphasizes the topic but also showcases your presentation skills.
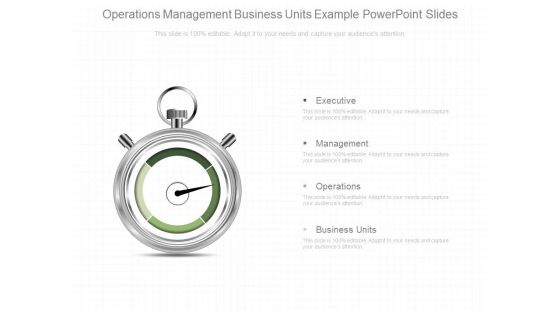
Operations Management Business Units Example Powerpoint Slides
This is a operations management business units example powerpoint slides. This is a four stage process. The stages in this process are executive, management, operations, business units.
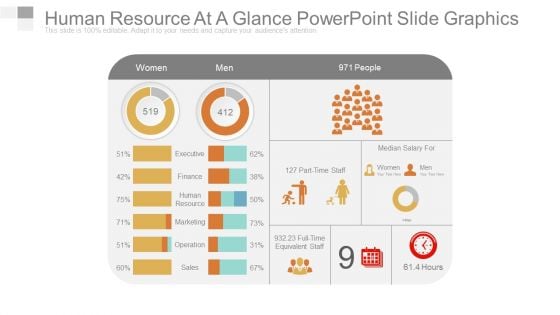
Human Resource At A Glance Powerpoint Slide Graphics
This is a human resource at a glance powerpoint slide graphics. This is a two stage process. The stages in this process are executive, finance, human, human resource, marketing, operation, sales.
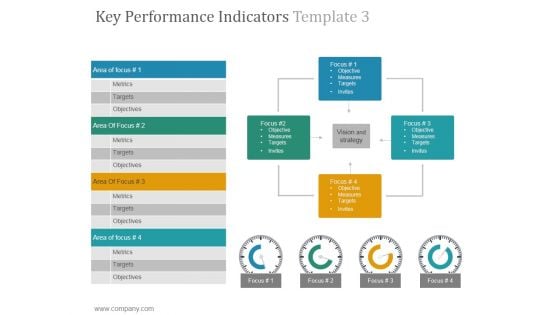
Key Performance Indicators Template 3 Ppt PowerPoint Presentation Graphics
This is a key performance indicators template 3 ppt powerpoint presentation graphics. This is a four stage process. The stages in this process are objective, measures, targets, invites, vision and strategy.
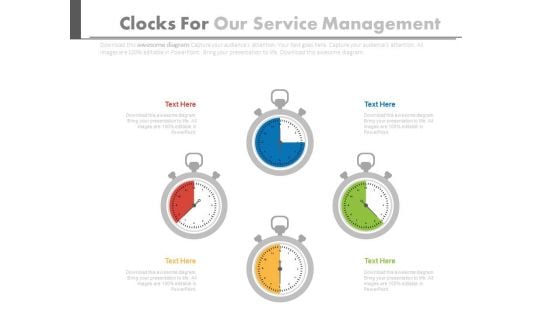
Four Stopwatches In Pie Chart Style Powerpoint Slides
This PPT slide has been designed with graphics of four stop watches in pie chart style. You may sue this PowerPoint template for time management. This dashboard slide may useful for multilevel status report creation and approval process.
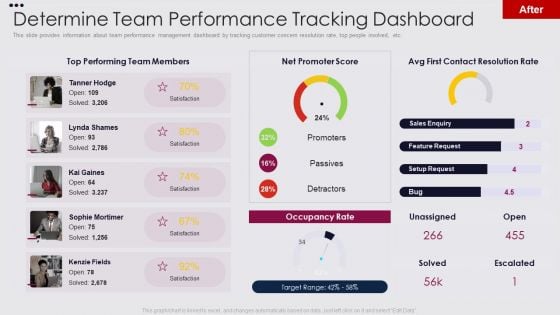
Employee Performance Improvement Framework Determine Team Performance Ideas PDF
This slide provides information about team performance management dashboard by tracking customer concern resolution rate, top people involved, etc. Deliver and pitch your topic in the best possible manner with this employee performance improvement framework determine team performance ideas pdf. Use them to share invaluable insights on determine team performance tracking dashboard and impress your audience. This template can be altered and modified as per your expectations. So, grab it now.
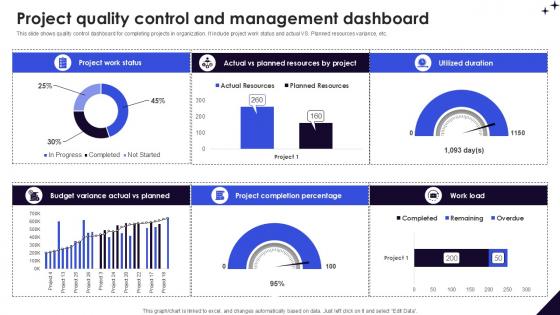
Project Quality Control And Management DMAIC Methodology To Maintain PPT Sample
This slide shows quality control dashboard for completing projects in organization. It include project work status and actual VS. Planned resources variance, etc. The Project Quality Control And Management DMAIC Methodology To Maintain PPT Sample is a compilation of the most recent design trends as a series of slides. It is suitable for any subject or industry presentation, containing attractive visuals and photo spots for businesses to clearly express their messages. This template contains a variety of slides for the user to input data, such as structures to contrast two elements, bullet points, and slides for written information. Slidegeeks is prepared to create an impression. This slide shows quality control dashboard for completing projects in organization. It include project work status and actual VS. Planned resources variance, etc.
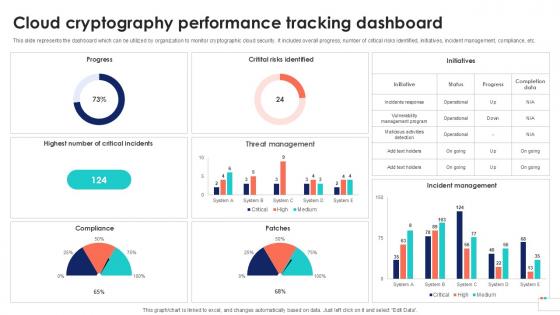
Cloud Cryptography Performance Data Security In Cloud Computing Ppt Presentation
This slide represents the dashboard which can be utilized by organization to monitor cryptographic cloud security. It includes overall progress, number of critical risks identified, initiatives, incident management, compliance, etc. If you are looking for a format to display your unique thoughts, then the professionally designed Cloud Cryptography Performance Data Security In Cloud Computing Ppt Presentation is the one for you. You can use it as a Google Slides template or a PowerPoint template. Incorporate impressive visuals, symbols, images, and other charts. Modify or reorganize the text boxes as you desire. Experiment with shade schemes and font pairings. Alter, share or cooperate with other people on your work. Download Cloud Cryptography Performance Data Security In Cloud Computing Ppt Presentation and find out how to give a successful presentation. Present a perfect display to your team and make your presentation unforgettable. This slide represents the dashboard which can be utilized by organization to monitor cryptographic cloud security. It includes overall progress, number of critical risks identified, initiatives, incident management, compliance, etc.
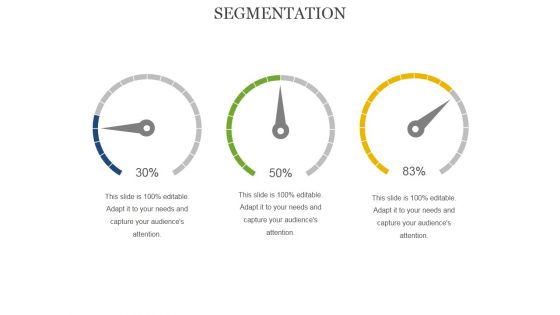
Segmentation Ppt PowerPoint Presentation Layouts Display
This is a segmentation ppt powerpoint presentation layouts display. This is a three stage process. The stages in this process are segmentation, dashboard, technology, communication, business.
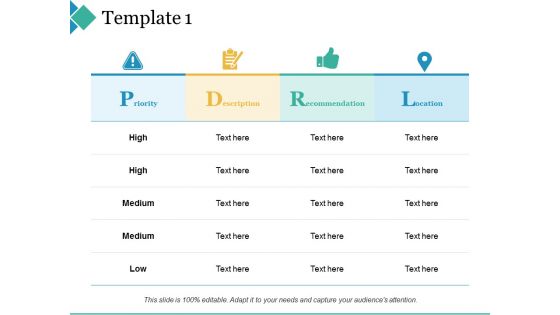
Template 1 Ppt PowerPoint Presentation Infographic Template Format Ideas
This is a template 1 ppt powerpoint presentation infographic template format ideas. This is a four stage process. The stages in this process are priority, description, recommendation, location.
Clock For Strategic Time Management And Business Vision Powerpoint Slides
Our above PPT slide contains flower clock design. This professional slide may be used to display strategic time management. Enlighten your audience with your breathtaking ideas.
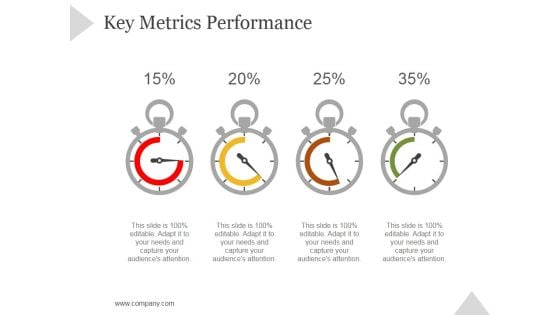
Key Metrics Performance Ppt PowerPoint Presentation Tips
This is a key metrics performance ppt powerpoint presentation tips. This is a four stage process. The stages in this process are business, strategy, marketing, success, dashboard, measuring.
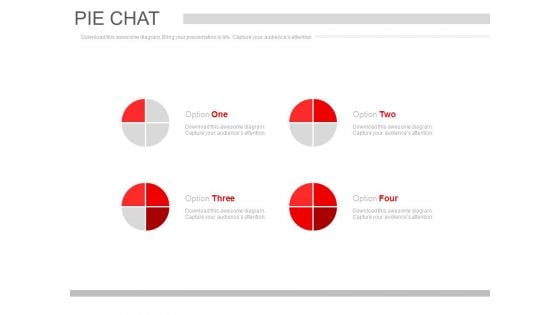
Pie Charts For Market Segmentation Powerpoint Slides
This PowerPoint contains graphics of pie charts. Download this diagram slide to display market segmentations. This template is editable, You can edit text, color, shade and style of this diagram as per you need.
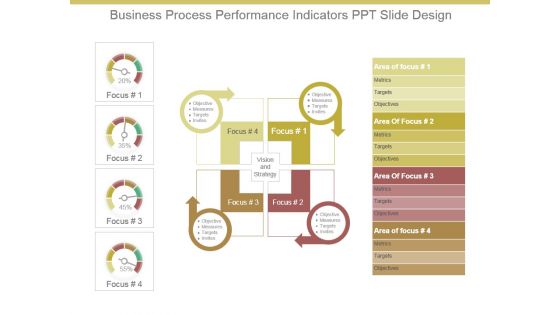
Business Process Performance Indicators Ppt Slide Design
This is a business process performance indicators ppt slide design. This is a four stage process. The stages in this process are focus, objective, measures, targets, invites, vision and strategy, area of focus, metrics, targets, objectives.
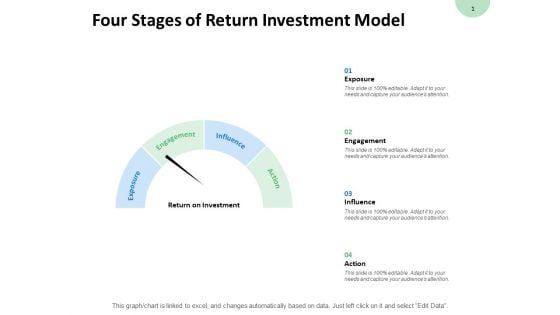
Four Stages Of Return Investment Model Engagement Ppt PowerPoint Presentation Inspiration Layout Ideas
Presenting this set of slides with name four stages of return investment model engagement ppt powerpoint presentation inspiration layout ideas. This is a four stage process. The stages in this process are dashboard, marketing, management, investment, analysis. This is a completely editable PowerPoint presentation and is available for immediate download. Download now and impress your audience.
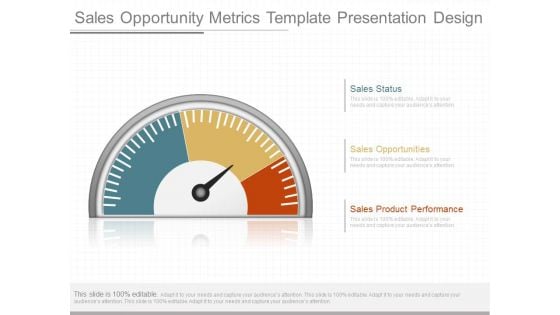
Sales Opportunity Metrics Template Presentation Design
This is a sales opportunity metrics template presentation design. This is a three stage process. The stages in this process are sales status, sales opportunities, sales product performance.


 Continue with Email

 Home
Home


