Executive Dashboard
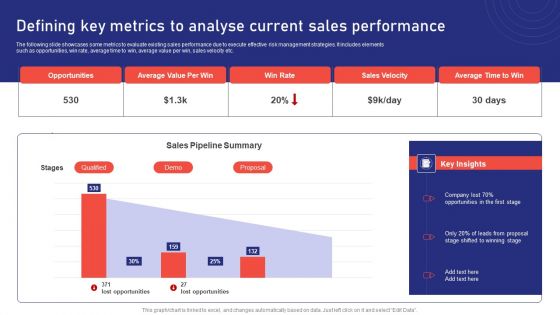
Sales Risk Assessment For Profit Maximization Defining Key Metrics To Analyse Current Sales Performance Pictures PDF
The following slide showcases some metrics to evaluate existing sales performance due to execute effective risk management strategies. It includes elements such as opportunities, win rate, average time to win, average value per win, sales velocity etc. Want to ace your presentation in front of a live audience Our Sales Risk Assessment For Profit Maximization Defining Key Metrics To Analyse Current Sales Performance Pictures PDF can help you do that by engaging all the users towards you. Slidegeeks experts have put their efforts and expertise into creating these impeccable powerpoint presentations so that you can communicate your ideas clearly. Moreover, all the templates are customizable, and easy to edit and downloadable. Use these for both personal and commercial use.
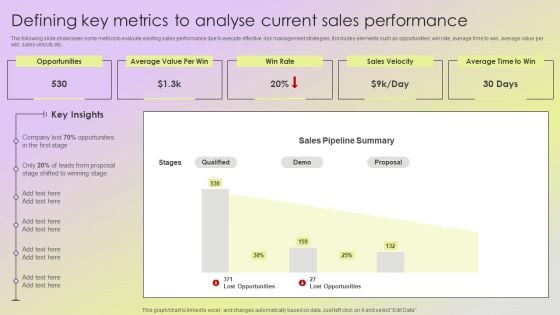
Mitigating Sales Risks With Strategic Action Planning Defining Key Metrics To Analyse Current Sales Performance Slides PDF
The following slide showcases some metrics to evaluate existing sales performance due to execute effective risk management strategies. It includes elements such as opportunities, win rate, average time to win, average value per win, sales velocity etc. This modern and well arranged Mitigating Sales Risks With Strategic Action Planning Defining Key Metrics To Analyse Current Sales Performance Slides PDF provides lots of creative possibilities. It is very simple to customize and edit with the Powerpoint Software. Just drag and drop your pictures into the shapes. All facets of this template can be edited with Powerpoint no extra software is necessary. Add your own material, put your images in the places assigned for them, adjust the colors, and then you can show your slides to the world, with an animated slide included.
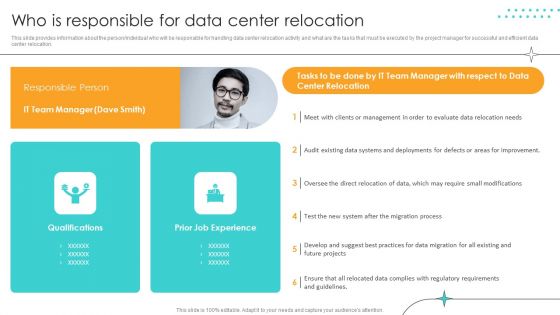
Cost Saving Benefits Of Implementing Data Center Who Is Responsible For Data Center Relocation Ideas PDF
This slide provides information about the person or individual who will be responsible for handling data center relocation activity and what are the tasks that must be executed by the project manager for successful and efficient data center relocation. Slidegeeks is here to make your presentations a breeze with Cost Saving Benefits Of Implementing Data Center Who Is Responsible For Data Center Relocation Ideas PDF With our easy to use and customizable templates, you can focus on delivering your ideas rather than worrying about formatting. With a variety of designs to choose from, you are sure to find one that suits your needs. And with animations and unique photos, illustrations, and fonts, you can make your presentation pop. So whether you are giving a sales pitch or presenting to the board, make sure to check out Slidegeeks first.
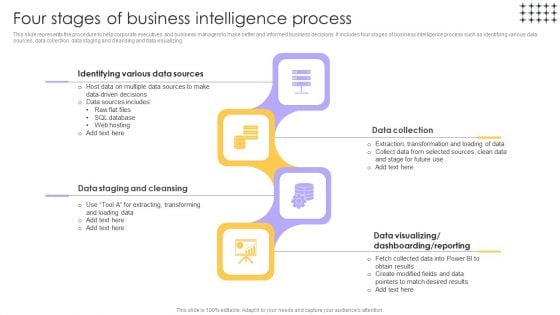
Tools For HR Business Analytics Four Stages Of Business Intelligence Process Rules PDF
This slide represents the procedure to help corporate executives and business managers to make better and informed business decisions. It includes four stages of business intelligence process such as identifying various data sources, data collection, data staging and cleansing and data visualizing. Formulating a presentation can take up a lot of effort and time, so the content and message should always be the primary focus. The visuals of the PowerPoint can enhance the presenters message, so our Tools For HR Business Analytics Four Stages Of Business Intelligence Process Rules PDF was created to help save time. Instead of worrying about the design, the presenter can concentrate on the message while our designers work on creating the ideal templates for whatever situation is needed. Slidegeeks has experts for everything from amazing designs to valuable content, we have put everything into Tools For HR Business Analytics Four Stages Of Business Intelligence Process Rules PDF.
Favorable Regulation Powerpoint Show
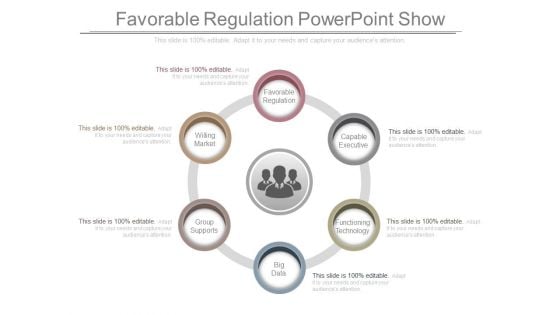
This is a favorable regulation powerpoint show. This is a six stage process. The stages in this process are favorable regulation, capable executive, functioning technology, big data, group supports, willing market.

Data Evaluation And Processing Toolkit Raci Matrix For Analyzing Data In Project Designs PDF
The slide explains the RACI matrix with the roles on vertical axis and tasks on horizontal axis for executing data analytics project. Do you have an important presentation coming up Are you looking for something that will make your presentation stand out from the rest Look no further than Data Evaluation And Processing Toolkit Raci Matrix For Analyzing Data In Project Designs PDF. With our professional designs, you can trust that your presentation will pop and make delivering it a smooth process. And with Slidegeeks, you can trust that your presentation will be unique and memorable. So why wait Grab Data Evaluation And Processing Toolkit Raci Matrix For Analyzing Data In Project Designs PDF today and make your presentation stand out from the rest.
Business Analytics Application Four Stages Of Business Intelligence Process Microsoft PDF
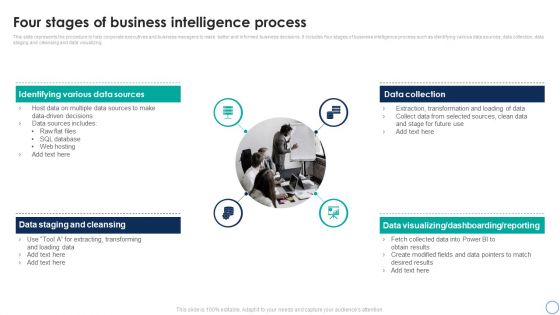
This slide represents the procedure to help corporate executives and business managers to make better and informed business decisions. It includes four stages of business intelligence process such as identifying various data sources, data collection, data staging and cleansing and data visualizing. Coming up with a presentation necessitates that the majority of the effort goes into the content and the message you intend to convey. The visuals of a PowerPoint presentation can only be effective if it supplements and supports the story that is being told. Keeping this in mind our experts created Business Analytics Application Four Stages Of Business Intelligence Process Microsoft PDF to reduce the time that goes into designing the presentation. This way, you can concentrate on the message while our designers take care of providing you with the right template for the situation.

Global Data Security Industry Report Strategies And Recommendations For Cybersecurity Industry IR SS V
The purpose of the slide is to provide valuable recommendations and effective strategies for cybersecurity industry players to succeed in a dynamic and competitive market. It covers strategies such as. The Global Data Security Industry Report Strategies And Recommendations For Cybersecurity Industry IR SS V is a compilation of the most recent design trends as a series of slides. It is suitable for any subject or industry presentation, containing attractive visuals and photo spots for businesses to clearly express their messages. This template contains a variety of slides for the user to input data, such as structures to contrast two elements, bullet points, and slides for written information. Slidegeeks is prepared to create an impression. The purpose of the slide is to provide valuable recommendations and effective strategies for cybersecurity industry players to succeed in a dynamic and competitive market. It covers strategies such as.
Determine Challenges And Solutions During Implementation Phase Infographics PDF
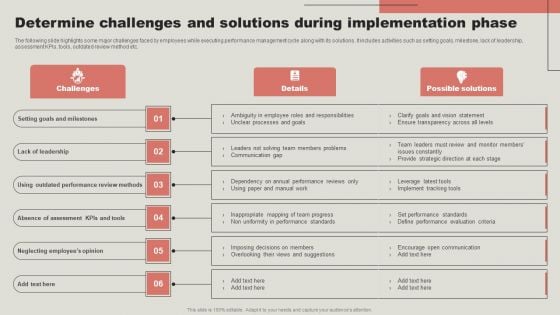
The following slide highlights some major challenges faced by employees while executing performance management cycle along with its solutions. It includes activities such as setting goals, milestone, lack of leadership, assessment KPIs, tools, outdated review method etc. This Determine Challenges And Solutions During Implementation Phase Infographics PDF from Slidegeeks makes it easy to present information on your topic with precision. It provides customization options, so you can make changes to the colors, design, graphics, or any other component to create a unique layout. It is also available for immediate download, so you can begin using it right away. Slidegeeks has done good research to ensure that you have everything you need to make your presentation stand out. Make a name out there for a brilliant performance.
Guide To Create Advertising Campaign For Client Engagement Activities Performed For Product Launch Campaign Infographics PDF
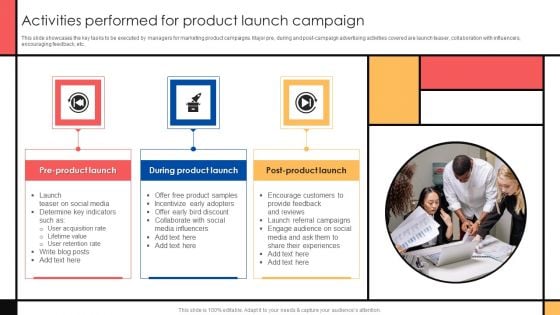
This slide showcases the key tasks to be executed by managers for marketing product campaigns. Major pre, during and post campaign advertising activities covered are launch teaser, collaboration with influencers, encouraging feedback, etc. Do you have an important presentation coming up. Are you looking for something that will make your presentation stand out from the rest Look no further than Guide To Create Advertising Campaign For Client Engagement Activities Performed For Product Launch Campaign Infographics PDF. With our professional designs, you can trust that your presentation will pop and make delivering it a smooth process. And with Slidegeeks, you can trust that your presentation will be unique and memorable. So why wait. Grab Guide To Create Advertising Campaign For Client Engagement Activities Performed For Product Launch Campaign Infographics PDF today and make your presentation stand out from the rest.
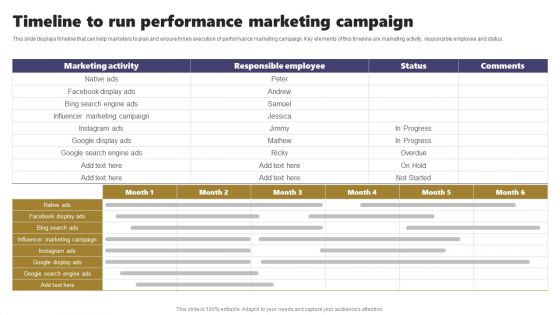
Acquiring Clients Through Search Engine And Native Ads Timeline To Run Performance Marketing Campaign Infographics PDF
This slide displays timeline that can help marketers to plan and ensure timely execution of performance marketing campaign. Key elements of this timeline are marketing activity, responsible employee and status. Slidegeeks is one of the best resources for PowerPoint templates. You can download easily and regulate Acquiring Clients Through Search Engine And Native Ads Timeline To Run Performance Marketing Campaign Infographics PDF for your personal presentations from our wonderful collection. A few clicks is all it takes to discover and get the most relevant and appropriate templates. Use our Templates to add a unique zing and appeal to your presentation and meetings. All the slides are easy to edit and you can use them even for advertisement purposes.
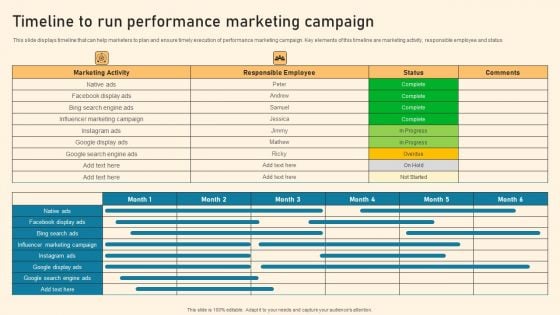
Timeline To Run Performance Marketing Campaign Ppt PowerPoint Presentation Diagram Graph Charts PDF
This slide displays timeline that can help marketers to plan and ensure timely execution of performance marketing campaign. Key elements of this timeline are marketing activity, responsible employee and status The Timeline To Run Performance Marketing Campaign Ppt PowerPoint Presentation Diagram Graph Charts PDF is a compilation of the most recent design trends as a series of slides. It is suitable for any subject or industry presentation, containing attractive visuals and photo spots for businesses to clearly express their messages. This template contains a variety of slides for the user to input data, such as structures to contrast two elements, bullet points, and slides for written information. Slidegeeks is prepared to create an impression.

Comprehensive Customer Data Platform Guide Optimizing Promotional Initiatives Challenges Solutions And Outcomes Designs PDF
The following slide covers MCM worldwides CDP execution strategy to have better customer understanding and facilitate purchase decisions. It includes elements such as customer personas, profile duplication, user experience, actionable insights, buying habits, transparency etc. If you are looking for a format to display your unique thoughts, then the professionally designed Comprehensive Customer Data Platform Guide Optimizing Promotional Initiatives Challenges Solutions And Outcomes Designs PDF is the one for you. You can use it as a Google Slides template or a PowerPoint template. Incorporate impressive visuals, symbols, images, and other charts. Modify or reorganize the text boxes as you desire. Experiment with shade schemes and font pairings. Alter, share or cooperate with other people on your work. Download Comprehensive Customer Data Platform Guide Optimizing Promotional Initiatives Challenges Solutions And Outcomes Designs PDF and find out how to give a successful presentation. Present a perfect display to your team and make your presentation unforgettable.

Mitigating Sales Risks With Strategic Action Planning Assessing Impact Of Sales Risk Management Diagrams PDF
The following slide highlights some key performance indicators KPIs to measure the influence of executing sales risk management strategies on revenue performance. It includes elements such as target attainment rate, gross profit, annual growth rate etc. If you are looking for a format to display your unique thoughts, then the professionally designed Mitigating Sales Risks With Strategic Action Planning Assessing Impact Of Sales Risk Management Diagrams PDF is the one for you. You can use it as a Google Slides template or a PowerPoint template. Incorporate impressive visuals, symbols, images, and other charts. Modify or reorganize the text boxes as you desire. Experiment with shade schemes and font pairings. Alter, share or cooperate with other people on your work. Download Mitigating Sales Risks With Strategic Action Planning Assessing Impact Of Sales Risk Management Diagrams PDF and find out how to give a successful presentation. Present a perfect display to your team and make your presentation unforgettable.
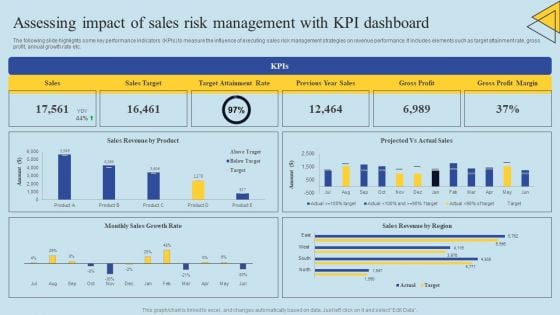
Determining Risks In Sales Administration Procedure Assessing Impact Of Sales Risk Management Sample PDF
The following slide highlights some key performance indicators KPIs to measure the influence of executing sales risk management strategies on revenue performance. It includes elements such as target attainment rate, gross profit, annual growth rate etc. If you are looking for a format to display your unique thoughts, then the professionally designed Determining Risks In Sales Administration Procedure Assessing Impact Of Sales Risk Management Sample PDF is the one for you. You can use it as a Google Slides template or a PowerPoint template. Incorporate impressive visuals, symbols, images, and other charts. Modify or reorganize the text boxes as you desire. Experiment with shade schemes and font pairings. Alter, share or cooperate with other people on your work. Download Determining Risks In Sales Administration Procedure Assessing Impact Of Sales Risk Management Sample PDF and find out how to give a successful presentation. Present a perfect display to your team and make your presentation unforgettable.
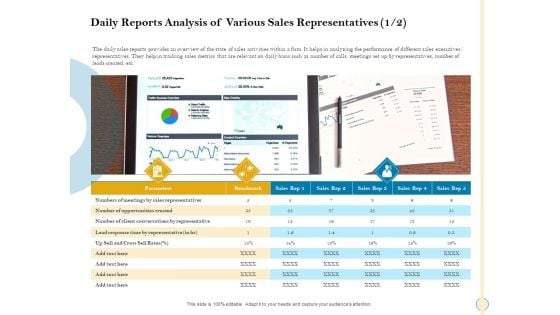
Sales Optimization Best Practices To Close More Deals Daily Reports Analysis Of Various Sales Representatives Client Professional PDF
The daily sales reports provides an overview of the state of sales activities within a firm. It helps in analyzing the performance of different sales executives or representatives. They help in tracking sales metrics that are relevant on daily basis such as number of calls, meetings set up by representatives, number of leads created, etc. This is a sales optimization best practices to close more deals daily reports analysis of various sales representatives client professional pdf template with various stages. Focus and dispense information on three stages using this creative set, that comes with editable features. It contains large content boxes to add your information on topics like cross sell rates, opportunities, sales, representatives, parameters. You can also showcase facts, figures, and other relevant content using this PPT layout. Grab it now.
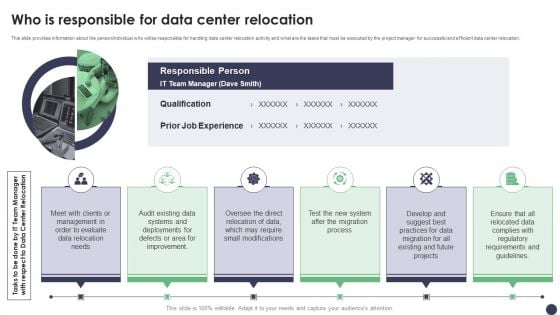
Who Is Responsible For Data Center Relocation Ppt PowerPoint Presentation File Model PDF
This slide provides information about the personindividual who will be responsible for handling data center relocation activity and what are the tasks that must be executed by the project manager for successful and efficient data center relocation. Crafting an eye catching presentation has never been more straightforward. Let your presentation shine with this tasteful yet straightforward Who Is Responsible For Data Center Relocation Ppt PowerPoint Presentation File Model PDF template. It offers a minimalistic and classy look that is great for making a statement. The colors have been employed intelligently to add a bit of playfulness while still remaining professional. Construct the ideal Who Is Responsible For Data Center Relocation Ppt PowerPoint Presentation File Model PDF that effortlessly grabs the attention of your audience. Begin now and be certain to wow your customers.
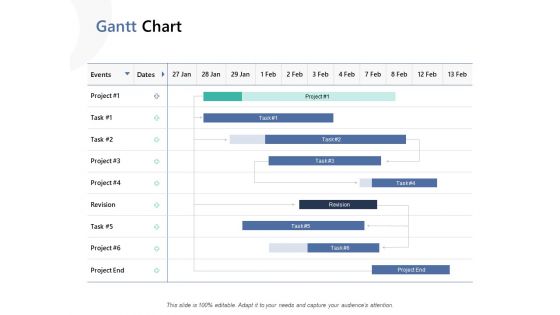
Gantt Chart Ppt PowerPoint Presentation Model Design Inspiration
Make a highly optimized project management report using this content-ready Gantt Chart PPT Diagram. Effortless yet very clear, this layout proves a useful tool to present the professional details of a task or activity. Showcase the activities and allotted time to the business executives with this Gantt Chart PowerPoint theme. List down the column tasks in various timeframes and the activities associated with each of them here. Further, plot time allocation for various tasks, monitor their actual time and make comparisons to interpret the final progress with this well-structured Gantt Chart Excel Template. You can add all the significant details of a particular project in this chart and showcase it to all the project members so that they can participate in the overall development. Not only this but also our PPT template can help you showcase the work breakdown structure of your project.
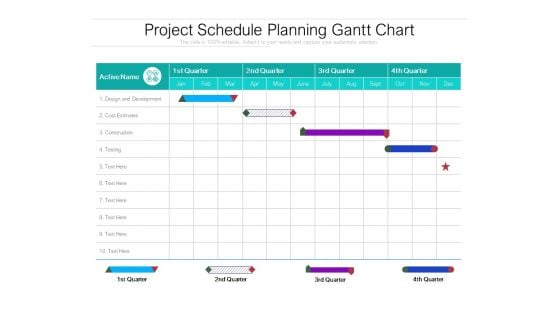
Project Schedule Planning Gantt Chart Ppt PowerPoint Presentation Pictures Guide
Make a highly optimized project management report using this content-ready Gantt Chart PPT Diagram. Effortless yet very clear, this layout proves a useful tool to present the professional details of a task or activity. Showcase the activities and allotted time to the business executives with this Gantt Chart PowerPoint theme. List down the column tasks in various timeframes and the activities associated with each of them here. Further, plot time allocation for various tasks, monitor their actual time and make comparisons to interpret the final progress with this well-structured Gantt Chart Excel Template. You can add all the significant details of a particular project in this chart and showcase it to all the project members so that they can participate in the overall development. Not only this but also our PPT template can help you showcase the work breakdown structure of your project.
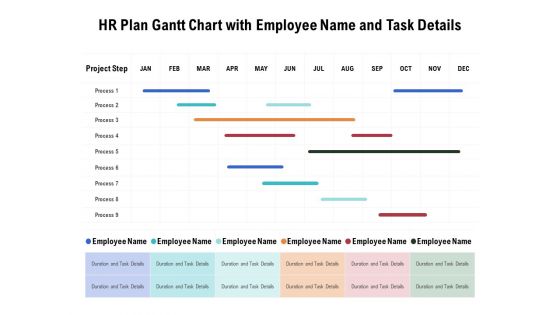
HR Plan Gantt Chart With Employee Name And Task Details Ppt PowerPoint Presentation Outline Graphics Pictures
Make a highly optimized project management report using this content-ready Gantt Chart PPT Diagram. Effortless yet very clear, this layout proves a useful tool to present the professional details of a task or activity. Showcase the activities and allotted time to the business executives with this Gantt Chart PowerPoint theme. List down the column tasks in various timeframes and the activities associated with each of them here. Further, plot time allocation for various tasks, monitor their actual time and make comparisons to interpret the final progress with this well-structured Gantt Chart Excel Template. You can add all the significant details of a particular project in this chart and showcase it to all the project members so that they can participate in the overall development. Not only this but also our PPT template can help you showcase the work breakdown structure of your project.
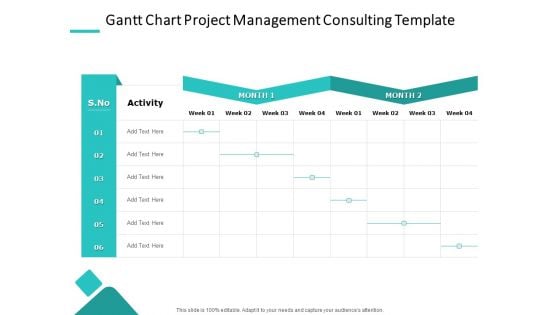
Gantt Chart Project Management Consulting Template Ppt PowerPoint Presentation Layouts Clipart Images PDF
Make a highly optimized project management report using this content-ready Gantt Chart PPT Diagram. Effortless yet very clear, this layout proves a useful tool to present the professional details of a task or activity. Showcase the activities and allotted time to the business executives with this Gantt Chart PowerPoint theme. List down the column tasks in various timeframes and the activities associated with each of them here. Further, plot time allocation for various tasks, monitor their actual time and make comparisons to interpret the final progress with this well-structured Gantt Chart Excel Template. You can add all the significant details of a particular project in this chart and showcase it to all the project members so that they can participate in the overall development. Not only this but also our PPT template can help you showcase the work breakdown structure of your project.
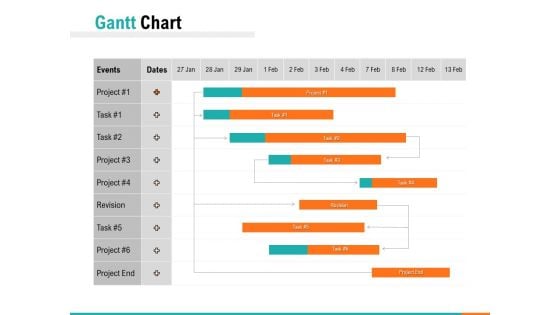
Gantt Chart Ppt PowerPoint Presentation Portfolio Clipart
Make a highly optimized project management report using this content-ready Gantt Chart PPT Diagram. Effortless yet very clear, this layout proves a useful tool to present the professional details of a task or activity. Showcase the activities and allotted time to the business executives with this Gantt Chart PowerPoint theme. List down the column tasks in various timeframes and the activities associated with each of them here. Further, plot time allocation for various tasks, monitor their actual time and make comparisons to interpret the final progress with this well-structured Gantt Chart Excel Template. You can add all the significant details of a particular project in this chart and showcase it to all the project members so that they can participate in the overall development. Not only this but also our PPT template can help you showcase the work breakdown structure of your project.
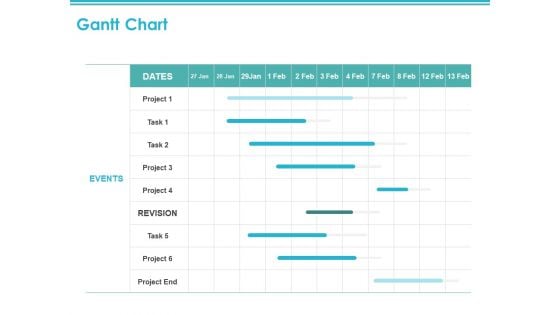
Gantt Chart Events Ppt PowerPoint Presentation Portfolio Graphics
Make a highly optimized project management report using this content-ready Gantt Chart PPT Diagram. Effortless yet very clear, this layout proves a useful tool to present the professional details of a task or activity. Showcase the activities and allotted time to the business executives with this Gantt Chart PowerPoint theme. List down the column tasks in various timeframes and the activities associated with each of them here. Further, plot time allocation for various tasks, monitor their actual time and make comparisons to interpret the final progress with this well-structured Gantt Chart Excel Template. You can add all the significant details of a particular project in this chart and showcase it to all the project members so that they can participate in the overall development. Not only this but also our PPT template can help you showcase the work breakdown structure of your project.
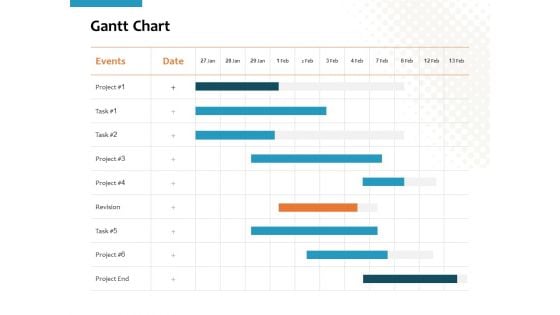
Gantt Chart Ppt PowerPoint Presentation Slides Themes
Make a highly optimized project management report using this content-ready Gantt Chart PPT Diagram. Effortless yet very clear, this layout proves a useful tool to present the professional details of a task or activity. Showcase the activities and allotted time to the business executives with this Gantt Chart PowerPoint theme. List down the column tasks in various timeframes and the activities associated with each of them here. Further, plot time allocation for various tasks, monitor their actual time and make comparisons to interpret the final progress with this well-structured Gantt Chart Excel Template. You can add all the significant details of a particular project in this chart and showcase it to all the project members so that they can participate in the overall development. Not only this but also our PPT template can help you showcase the work breakdown structure of your project.
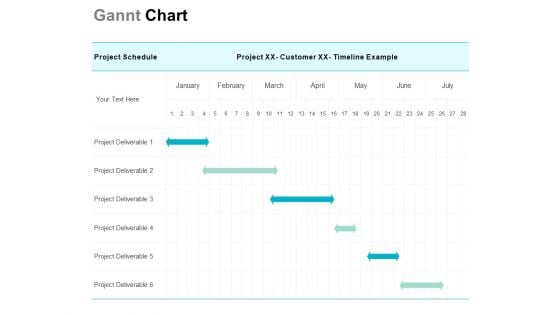
Gannt Chart Ppt PowerPoint Presentation Slides Outfit
Make a highly optimized project management report using this content-ready Gantt Chart PPT Diagram. Effortless yet very clear, this layout proves a useful tool to present the professional details of a task or activity. Showcase the activities and allotted time to the business executives with this Gantt Chart PowerPoint theme. List down the column tasks in various timeframes and the activities associated with each of them here. Further, plot time allocation for various tasks, monitor their actual time and make comparisons to interpret the final progress with this well-structured Gantt Chart Excel Template. You can add all the significant details of a particular project in this chart and showcase it to all the project members so that they can participate in the overall development. Not only this but also our PPT template can help you showcase the work breakdown structure of your project.
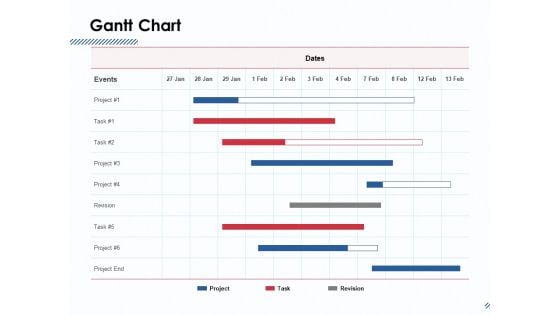
Gantt Chart Ppt PowerPoint Presentation Infographic Template Influencers
Make a highly optimized project management report using this content-ready Gantt Chart PPT Diagram. Effortless yet very clear, this layout proves a useful tool to present the professional details of a task or activity. Showcase the activities and allotted time to the business executives with this Gantt Chart PowerPoint theme. List down the column tasks in various timeframes and the activities associated with each of them here. Further, plot time allocation for various tasks, monitor their actual time and make comparisons to interpret the final progress with this well-structured Gantt Chart Excel Template. You can add all the significant details of a particular project in this chart and showcase it to all the project members so that they can participate in the overall development. Not only this but also our PPT template can help you showcase the work breakdown structure of your project.
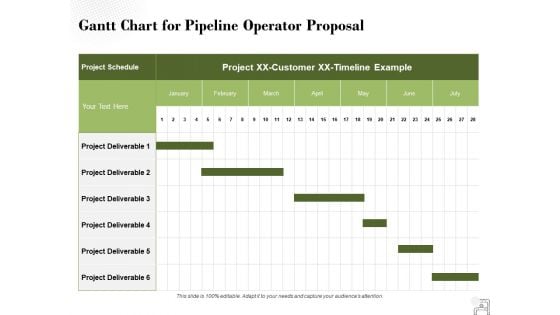
Gantt Chart For Pipeline Operator Proposal Ppt PowerPoint Presentation Styles Slide Portrait
Make a highly optimized project management report using this content-ready Gantt Chart PPT Diagram. Effortless yet very clear, this layout proves a useful tool to present the professional details of a task or activity. Showcase the activities and allotted time to the business executives with this Gantt Chart PowerPoint theme. List down the column tasks in various timeframes and the activities associated with each of them here. Further, plot time allocation for various tasks, monitor their actual time and make comparisons to interpret the final progress with this well-structured Gantt Chart Excel Template. You can add all the significant details of a particular project in this chart and showcase it to all the project members so that they can participate in the overall development. Not only this but also our PPT template can help you showcase the work breakdown structure of your project.
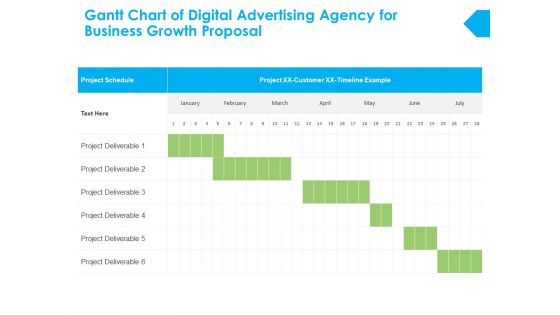
Gantt Chart Of Digital Advertising Agency For Business Growth Proposal Ppt PowerPoint Presentation Gallery Graphics
Make a highly optimized project management report using this content-ready Gantt Chart PPT Diagram. Effortless yet very clear, this layout proves a useful tool to present the professional details of a task or activity. Showcase the activities and allotted time to the business executives with this Gantt Chart PowerPoint theme. List down the column tasks in various timeframes and the activities associated with each of them here. Further, plot time allocation for various tasks, monitor their actual time and make comparisons to interpret the final progress with this well-structured Gantt Chart Excel Template. You can add all the significant details of a particular project in this chart and showcase it to all the project members so that they can participate in the overall development. Not only this but also our PPT template can help you showcase the work breakdown structure of your project.
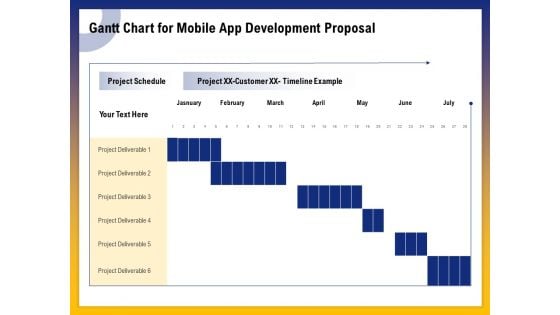
Phone Application Buildout Gantt Chart For Mobile App Development Proposal Ppt PowerPoint Presentation Gallery Vector PDF
Make a highly optimized project management report using this content-ready Gantt Chart PPT Diagram. Effortless yet very clear, this layout proves a useful tool to present the professional details of a task or activity. Showcase the activities and allotted time to the business executives with this Gantt Chart PowerPoint theme. List down the column tasks in various timeframes and the activities associated with each of them here. Further, plot time allocation for various tasks, monitor their actual time and make comparisons to interpret the final progress with this well-structured Gantt Chart Excel Template. You can add all the significant details of a particular project in this chart and showcase it to all the project members so that they can participate in the overall development. Not only this but also our PPT template can help you showcase the work breakdown structure of your project.
operating system application gantt chart for ios apps proposal ppt icon introduction pdf
Make a highly optimized project management report using this content-ready Gantt Chart PPT Diagram. Effortless yet very clear, this layout proves a useful tool to present the professional details of a task or activity. Showcase the activities and allotted time to the business executives with this Gantt Chart PowerPoint theme. List down the column tasks in various timeframes and the activities associated with each of them here. Further, plot time allocation for various tasks, monitor their actual time and make comparisons to interpret the final progress with this well-structured Gantt Chart Excel Template. You can add all the significant details of a particular project in this chart and showcase it to all the project members so that they can participate in the overall development. Not only this but also our PPT template can help you showcase the work breakdown structure of your project.
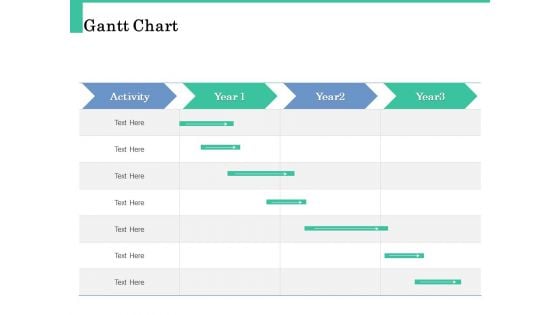
How A Corporate Life Coach Can Help Develop Your Company Gantt Chart Topics PDF
Make a highly optimized project management report using this content-ready Gantt Chart PPT Diagram. Effortless yet very clear, this layout proves a useful tool to present the professional details of a task or activity. Showcase the activities and allotted time to the business executives with this Gantt Chart PowerPoint theme. List down the column tasks in various timeframes and the activities associated with each of them here. Further, plot time allocation for various tasks, monitor their actual time and make comparisons to interpret the final progress with this well-structured Gantt Chart Excel Template. You can add all the significant details of a particular project in this chart and showcase it to all the project members so that they can participate in the overall development. Not only this but also our PPT template can help you showcase the work breakdown structure of your project.
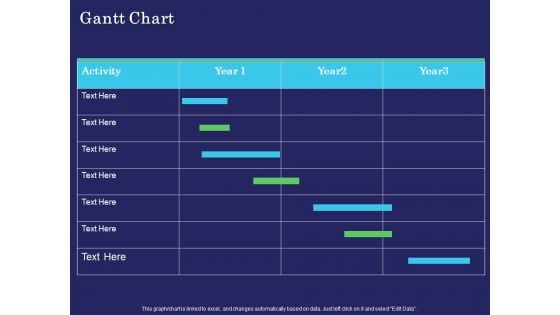
Business Coaching Gantt Chart Ppt PowerPoint Presentation Layouts Files PDF
Make a highly optimized project management report using this content-ready Gantt Chart PPT Diagram. Effortless yet very clear, this layout proves a useful tool to present the professional details of a task or activity. Showcase the activities and allotted time to the business executives with this Gantt Chart PowerPoint theme. List down the column tasks in various timeframes and the activities associated with each of them here. Further, plot time allocation for various tasks, monitor their actual time and make comparisons to interpret the final progress with this well-structured Gantt Chart Excel Template. You can add all the significant details of a particular project in this chart and showcase it to all the project members so that they can participate in the overall development. Not only this but also our PPT template can help you showcase the work breakdown structure of your project.

Key People Associated With Amazon Core Team To Mange Leadership Ppt PowerPoint Presentation File Infographic Template PDF
This slide provides information regarding key executives associated with core team of Amazon in terms of founder, CEO, CFO, CTO, CMO. The strong leadership team has leveraged the firms performance across marketplace and has led it to become market leader. Welcome to our selection of the Key People Associated With Amazon Core Team To Mange Leadership Ppt PowerPoint Presentation File Infographic Template PDF. These are designed to help you showcase your creativity and bring your sphere to life. Planning and Innovation are essential for any business that is just starting out. This collection contains the designs that you need for your everyday presentations. All of our PowerPoints are 100 percent editable, so you can customize them to suit your needs. This multi purpose template can be used in various situations. Grab these presentation templates today.
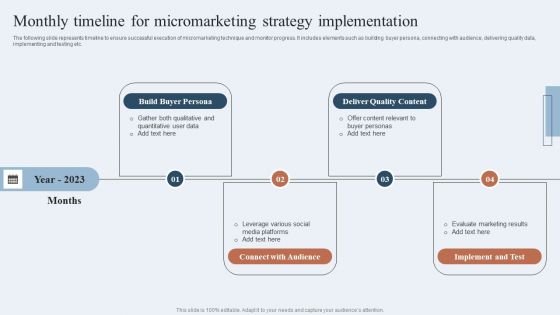
Niche Marketing Guide To Target Specific Customer Groups Monthly Timeline For Micromarketing Strategy Designs PDF
The following slide represents timeline to ensure successful execution of micromarketing technique and monitor progress. It includes elements such as building buyer persona, connecting with audience, delivering quality data, implementing and testing etc. Boost your pitch with our creative Niche Marketing Guide To Target Specific Customer Groups Monthly Timeline For Micromarketing Strategy Designs PDF. Deliver an awe-inspiring pitch that will mesmerize everyone. Using these presentation templates you will surely catch everyones attention. You can browse the ppts collection on our website. We have researchers who are experts at creating the right content for the templates. So you do not have to invest time in any additional work. Just grab the template now and use them.
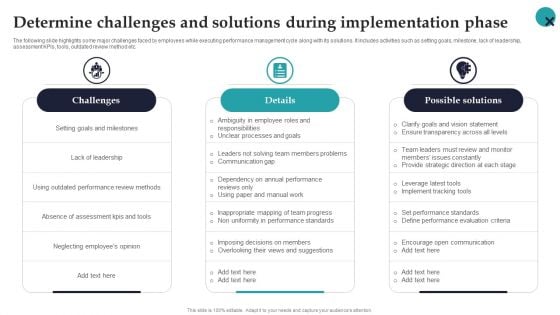
Determine Challenges And Solutions During Implementation Phase Employee Performance Management Clipart PDF
The following slide highlights some major challenges faced by employees while executing performance management cycle along with its solutions. It includes activities such as setting goals, milestone, lack of leadership, assessment KPIs, tools, outdated review method etc.Do you have to make sure that everyone on your team knows about any specific topic I yes, then you should give Determine Challenges And Solutions During Implementation Phase Employee Performance Management Clipart PDF a try. Our experts have put a lot of knowledge and effort into creating this impeccable Determine Challenges And Solutions During Implementation Phase Employee Performance Management Clipart PDF. You can use this template for your upcoming presentations, as the slides are perfect to represent even the tiniest detail. You can download these templates from the Slidegeeks website and these are easy to edit. So grab these today.
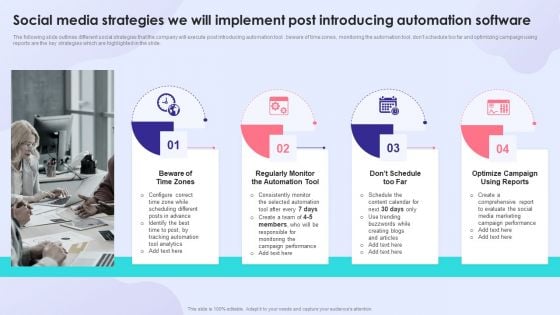
Social Media Strategies We Will Implement Post Introducing Automation Software Professional PDF
The following slide outlines different social strategies that the company will execute post introducing automation tool . beware of time zones, monitoring the automation tool, dont schedule too far and optimizing campaign using reports are the key strategies which are highlighted in the slide. Presenting Social Media Strategies We Will Implement Post Introducing Automation Software Professional PDF to provide visual cues and insights. Share and navigate important information on four stages that need your due attention. This template can be used to pitch topics like Beware Of Time Zones, Optimize Campaign, Social Media Marketing. In addtion, this PPT design contains high resolution images, graphics, etc, that are easily editable and available for immediate download.
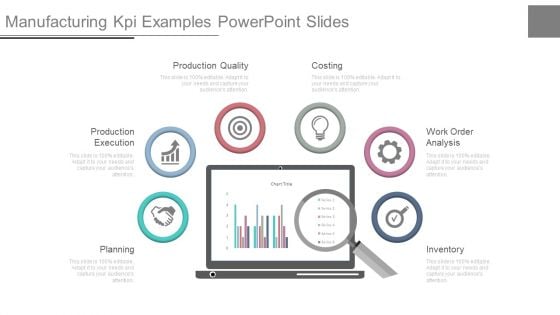
Manufacturing Kpi Examples Powerpoint Slides
This is a manufacturing kpi examples powerpoint slides. This is a six stage process. The stages in this process are planning, production execution, production quality, costing, work order analysis, inventory.
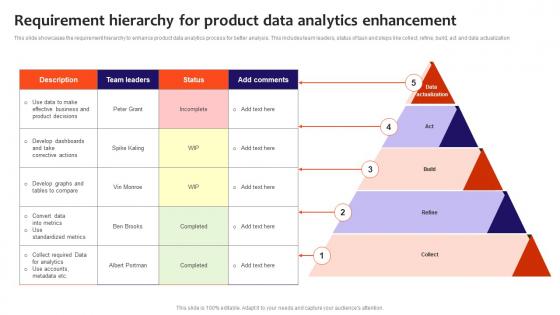
Requirement Hierarchy For Product Data Analytics Enhancement Clipart Pdf
This slide showcases the requirement hierarchy to enhance product data analytics process for better analysis. This includes team leaders, status of task and steps like collect, refine, build, act and data actualization Showcasing this set of slides titled Requirement Hierarchy For Product Data Analytics Enhancement Clipart Pdf. The topics addressed in these templates are Develop Graphs, Collect Required Data, Develop Dashboards. All the content presented in this PPT design is completely editable. Download it and make adjustments in color, background, font etc. as per your unique business setting. This slide showcases the requirement hierarchy to enhance product data analytics process for better analysis. This includes team leaders, status of task and steps like collect, refine, build, act and data actualization

Key Steps To Conduct Heuristic Analysis Data Analytics SS V
This slide outlines major steps to conduct heuristics analysis aimed at helping businesses conduct evaluation and generate meaningful changes. It covers steps such as define analysis scope, end user knowledge, define heuristics, choose reporting style, set up scoring system and analyze.Do you have an important presentation coming up Are you looking for something that will make your presentation stand out from the rest Look no further than Key Steps To Conduct Heuristic Analysis Data Analytics SS V. With our professional designs, you can trust that your presentation will pop and make delivering it a smooth process. And with Slidegeeks, you can trust that your presentation will be unique and memorable. So why wait Grab Key Steps To Conduct Heuristic Analysis Data Analytics SS V today and make your presentation stand out from the rest This slide outlines major steps to conduct heuristics analysis aimed at helping businesses conduct evaluation and generate meaningful changes. It covers steps such as define analysis scope, end user knowledge, define heuristics, choose reporting style, set up scoring system and analyze.
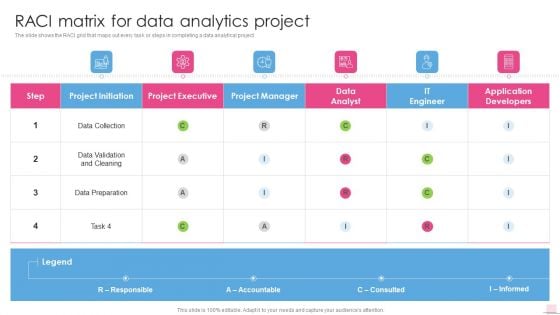
Raci Matrix For Data Analytics Project Business Analysis Modification Toolkit Template PDF
The slide shows the RACI grid that maps out every task or steps in completing a data analytical project.Deliver an awe inspiring pitch with this creative Raci Matrix For Data Analytics Project Business Analysis Modification Toolkit Template PDF bundle. Topics like Project Executive, Project Manager, Data Preparation can be discussed with this completely editable template. It is available for immediate download depending on the needs and requirements of the user.
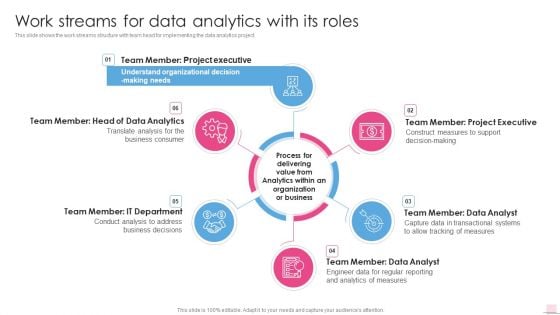
Work Streams For Data Analytics With Its Roles Business Analysis Modification Toolkit Topics PDF
Presenting Work Streams For Data Analytics With Its Roles Business Analysis Modification Toolkit Topics PDF to provide visual cues and insights. Share and navigate important information on six stages that need your due attention. This template can be used to pitch topics like Project Executive, Data Analytics, Organization Business. In addtion, this PPT design contains high resolution images, graphics, etc, that are easily editable and available for immediate download.
Comparative Analysis Of Data Driven Marketing Tools Guide For Data Driven Advertising Icons Pdf
This slide represents the comparison between varied data driven marketing tools based on their key attributes to help marketers choose the best tool for optimizing their marketing strategy. It includes comparison based on features such as marketing attribution, real-time reporting etc.Coming up with a presentation necessitates that the majority of the effort goes into the content and the message you intend to convey. The visuals of a PowerPoint presentation can only be effective if it supplements and supports the story that is being told. Keeping this in mind our experts created Comparative Analysis Of Data Driven Marketing Tools Guide For Data Driven Advertising Icons Pdf to reduce the time that goes into designing the presentation. This way, you can concentrate on the message while our designers take care of providing you with the right template for the situation. This slide represents the comparison between varied data driven marketing tools based on their key attributes to help marketers choose the best tool for optimizing their marketing strategy. It includes comparison based on features such as marketing attribution, real-time reporting etc.

Global Data Security Industry Report Cybersecurity Industry Competitor Analysis With Attributes IR SS V
The slide presents the key players in the cybersecurity industry. The purpose of the slide is to provide glimpse and competitor analysis of major players in the cybersecurity industry to gain insight into their products, services, and sales. It covers companies such as Palo alto networks, Inc, Fortinet, CrowdStrike, Checkpoint, and Zscaler, Inc. Present like a pro with Global Data Security Industry Report Cybersecurity Industry Competitor Analysis With Attributes IR SS V. Create beautiful presentations together with your team, using our easy-to-use presentation slides. Share your ideas in real-time and make changes on the fly by downloading our templates. So whether you are in the office, on the go, or in a remote location, you can stay in sync with your team and present your ideas with confidence. With Slidegeeks presentation got a whole lot easier. Grab these presentations today. The slide presents the key players in the cybersecurity industry. The purpose of the slide is to provide glimpse and competitor analysis of major players in the cybersecurity industry to gain insight into their products, services, and sales. It covers companies such as Palo alto networks, Inc, Fortinet, CrowdStrike, Checkpoint, and Zscaler, Inc.
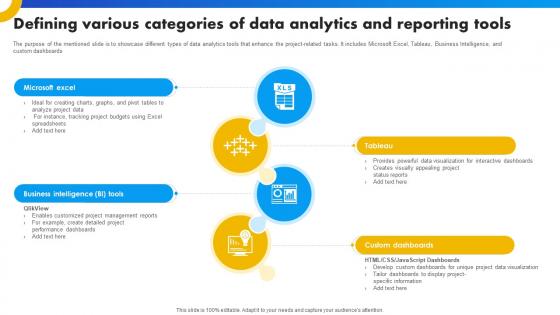
Defining Various Categories Of Data Analytics And Reporting Tools Strategies For Success In Digital
The purpose of the mentioned slide is to showcase different types of data analytics tools that enhance the project-related tasks. It includes Microsoft Excel, Tableau, Business Intelligence, and custom dashboards. Slidegeeks is here to make your presentations a breeze with Defining Various Categories Of Data Analytics And Reporting Tools Strategies For Success In Digital With our easy-to-use and customizable templates, you can focus on delivering your ideas rather than worrying about formatting. With a variety of designs to choose from, you are sure to find one that suits your needs. And with animations and unique photos, illustrations, and fonts, you can make your presentation pop. So whether you are giving a sales pitch or presenting to the board, make sure to check out Slidegeeks first The purpose of the mentioned slide is to showcase different types of data analytics tools that enhance the project-related tasks. It includes Microsoft Excel, Tableau, Business Intelligence, and custom dashboards.
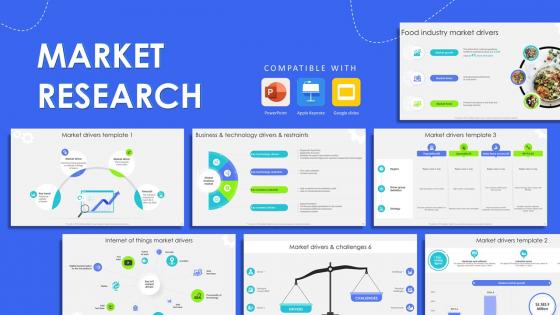
Market Research Power Point Presentation Slides
This Market Research Power Point Presentation Slides is a primer on how to capitalize on business opportunities through planning, innovation, and market intelligence. The content-ready format of the complete deck will make your job as a decision-maker a lot easier. Use this ready-made PowerPoint Template to help you outline an extensive and legible plan to capture markets and grow your company on the right path, at an exponential pace. What is even more amazing is that this presentation is completely editable and 100 percent customizable. This N-slide complete deck helps you impress a roomful of people with your expertise in business and even presentation. Craft such a professional and appealing presentation for that amazing recall value. Download now. Use our professionally designed presentation on Market Research that helps to shape shape your organizations strategy and evaluate the viability of business projects. This PPT covers key market drivers, constraints, forecasts, and industry-specific drivers such as the Internet of Things, the food industry, and technology market trends. Utilize data through visually appealing and easy to understand dashboards and KPI tracker sheet that allow you to effectively showcase research findings.Get access to this valuable tool by downloading this presentation that helps to drive sales, boost profits and foster strategic discussions.

Global Data Security Industry Report Comprehensive Swot Analysis For Cybersecurity Industry IR SS V
The slide covers the cybersecurity industrys strengths, weaknesses, opportunities, and threats. The slide aims to identify internal and external factors impacting the industrys functioning. It will help stakeholders to develop strategies to achieve their objectives and improve efficiency. Do you have to make sure that everyone on your team knows about any specific topic I yes, then you should give Global Data Security Industry Report Comprehensive Swot Analysis For Cybersecurity Industry IR SS V a try. Our experts have put a lot of knowledge and effort into creating this impeccable Global Data Security Industry Report Comprehensive Swot Analysis For Cybersecurity Industry IR SS V. You can use this template for your upcoming presentations, as the slides are perfect to represent even the tiniest detail. You can download these templates from the Slidegeeks website and these are easy to edit. So grab these today The slide covers the cybersecurity industrys strengths, weaknesses, opportunities, and threats. The slide aims to identify internal and external factors impacting the industrys functioning. It will help stakeholders to develop strategies to achieve their objectives and improve efficiency.
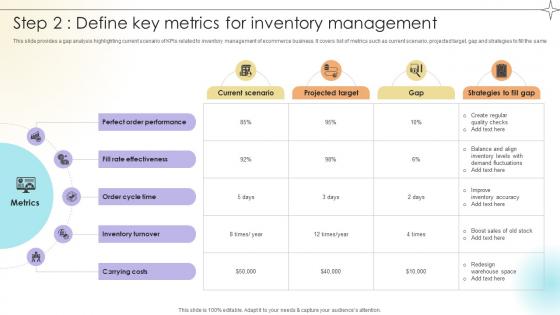
Step 2 Define Key Metrics For Inventory Management Data Analytics SS V
This slide provides a gap analysis highlighting current scenario of KPIs related to inventory management of ecommerce business. It covers list of metrics such as current scenario, projected target, gap and strategies to fill the same.Make sure to capture your audiences attention in your business displays with our gratis customizable Step 2 Define Key Metrics For Inventory Management Data Analytics SS V. These are great for business strategies, office conferences, capital raising or task suggestions. If you desire to acquire more customers for your tech business and ensure they stay satisfied, create your own sales presentation with these plain slides. This slide provides a gap analysis highlighting current scenario of KPIs related to inventory management of ecommerce business. It covers list of metrics such as current scenario, projected target, gap and strategies to fill the same.
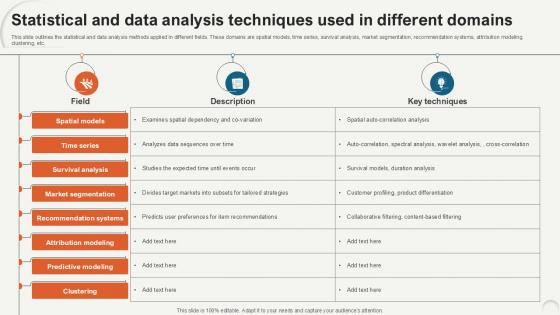
Statistical And Data Analysis Techniques Data Analytics For Informed Decision Ppt Sample
This slide outlines the statistical and data analysis methods applied in different fields. These domains are spatial models, time series, survival analysis, market segmentation, recommendation systems, attribution modeling, clustering, etc. Boost your pitch with our creative Statistical And Data Analysis Techniques Data Analytics For Informed Decision Ppt Sample. Deliver an awe-inspiring pitch that will mesmerize everyone. Using these presentation templates you will surely catch everyones attention. You can browse the ppts collection on our website. We have researchers who are experts at creating the right content for the templates. So you do not have to invest time in any additional work. Just grab the template now and use them. This slide outlines the statistical and data analysis methods applied in different fields. These domains are spatial models, time series, survival analysis, market segmentation, recommendation systems, attribution modeling, clustering, etc.
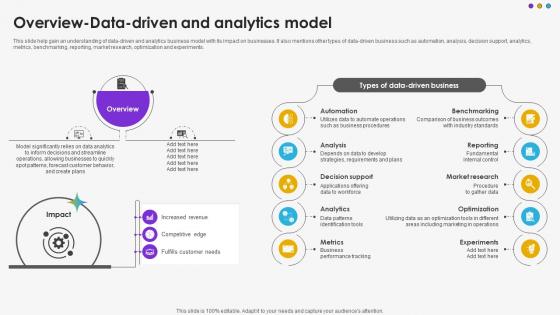
Overview Data Driven And Analytics Model DT SS V
This slide help gain an understanding of data-driven and analytics business model with its impact on businesses. It also mentions other types of data-driven business such as automation, analysis, decision support, analytics, metrics, benchmarking, reporting, market research, optimization and experiments.Explore a selection of the finest Overview Data Driven And Analytics Model DT SS V here. With a plethora of professionally designed and pre-made slide templates, you can quickly and easily find the right one for your upcoming presentation. You can use our Overview Data Driven And Analytics Model DT SS V to effectively convey your message to a wider audience. Slidegeeks has done a lot of research before preparing these presentation templates. The content can be personalized and the slides are highly editable. Grab templates today from Slidegeeks. This slide help gain an understanding of data-driven and analytics business model with its impact on businesses. It also mentions other types of data-driven business such as automation, analysis, decision support, analytics, metrics, benchmarking, reporting, market research, optimization and experiments.

Power BI Tool Powerpoint Ppt Template Bundles
This Power BI Tool Powerpoint Ppt Template Bundles is a primer on how to capitalize on business opportunities through planning, innovation, and market intelligence. The content-ready format of the complete deck will make your job as a decision-maker a lot easier. Use this ready-made PowerPoint Template to help you outline an extensive and legible plan to capture markets and grow your company on the right path, at an exponential pace. What is even more amazing is that this presentation is completely editable and 100 percent customizable. This Data Visualization, Project Report, Business Intelligence, Data Model, Machine Learning-slide complete deck helps you impress a roomful of people with your expertise in business and even presentation. Craft such a professional and appealing presentation for that amazing recall value. Download now. Introducing the game-changing Power BI solutions are the best solution for comprehensive data analysis and intelligent business intelligence. Power BI allows you to realize the full potential of your data by transforming it into relevant visualizations and interactive reports. Connect to numerous data sources seamlessly, combine them, and receive useful insights using Power BI analysis. Create attractive Power BI dashboards that provide a holistic perspective of your organizations performance, allowing you to confidently make educated decisions. Real-time data exploration, powerful analytics, and collaboration features may all help your team succeed. Power BI is your reliable partner for harnessing the power of data to drive growth and success. Power BI represents the future of data-driven decision-making.

Current Scenario Analysis Of Big Data Management And Analytics Streamlining Production Ppt Slide
The following slide showcases current scenario analysis of big data management to assess scope of improvement. It includes KPIs such as data accuracy, downtime reduction, etc. Make sure to capture your audiences attention in your business displays with our gratis customizable Current Scenario Analysis Of Big Data Management And Analytics Streamlining Production Ppt Slide These are great for business strategies, office conferences, capital raising or task suggestions. If you desire to acquire more customers for your tech business and ensure they stay satisfied, create your own sales presentation with these plain slides. The following slide showcases current scenario analysis of big data management to assess scope of improvement. It includes KPIs such as data accuracy, downtime reduction, etc.
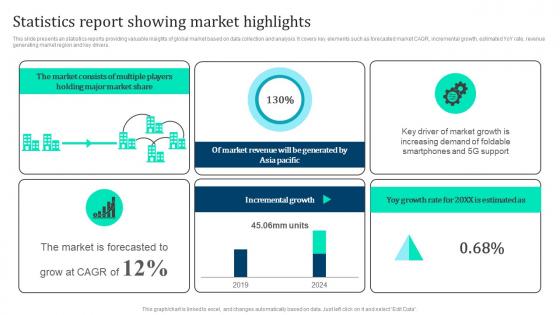
Statistics Report Showing Marketing Intelligence Guide Data Gathering Slides Pdf
This slide presents an statistics reports providing valuable insights of global market based on data collection and analysis. It covers key elements such as forecasted market CAGR, incremental growth, estimated YoY rate, revenue generating market region and key drivers. Get a simple yet stunning designed Statistics Report Showing Marketing Intelligence Guide Data Gathering Slides Pdf. It is the best one to establish the tone in your meetings. It is an excellent way to make your presentations highly effective. So, download this PPT today from Slidegeeks and see the positive impacts. Our easy to edit Statistics Report Showing Marketing Intelligence Guide Data Gathering Slides Pdf can be your go to option for all upcoming conferences and meetings. So, what are you waiting for Grab this template today. This slide presents an statistics reports providing valuable insights of global market based on data collection and analysis. It covers key elements such as forecasted market CAGR, incremental growth, estimated YoY rate, revenue generating market region and key drivers.
Data Analysis Reports Under Magnifying Glass Ppt PowerPoint Presentation Icon Graphic Tips
Presenting this set of slides with name data analysis reports under magnifying glass ppt powerpoint presentation icon graphic tips. This is a three stage process. The stages in this process are data visualization icon, research analysis, business focus. This is a completely editable PowerPoint presentation and is available for immediate download. Download now and impress your audience.
Data Reports Visualization Vector Ppt PowerPoint Presentation Visual Aids Deck
Presenting this set of slides with name data reports visualization vector ppt powerpoint presentation visual aids deck. The topics discussed in these slides are data visualization icon, research analysis, business focus. This is a completely editable PowerPoint presentation and is available for immediate download. Download now and impress your audience.
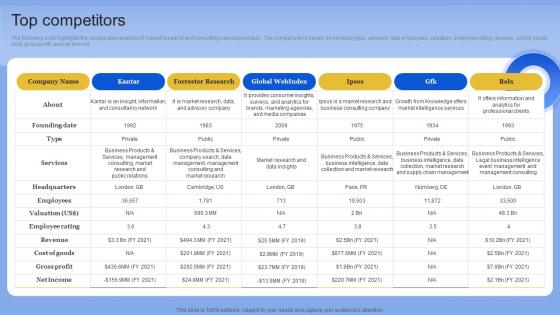
Top Competitors Data Analytics Company Outline Designs PDF
The following slide highlights the comparative analysis of market research and consulting service providers. The comparison is based on company type, services, total employees, valuation, employee rating, revenue, cost of goods sold, gross profit, and net income. Boost your pitch with our creative Top Competitors Data Analytics Company Outline Designs PDF Deliver an awe-inspiring pitch that will mesmerize everyone. Using these presentation templates you will surely catch everyones attention. You can browse the ppts collection on our website. We have researchers who are experts at creating the right content for the templates. So you do not have to invest time in any additional work. Just grab the template now and use them. The following slide highlights the comparative analysis of market research and consulting service providers. The comparison is based on company type, services, total employees, valuation, employee rating, revenue, cost of goods sold, gross profit, and net income
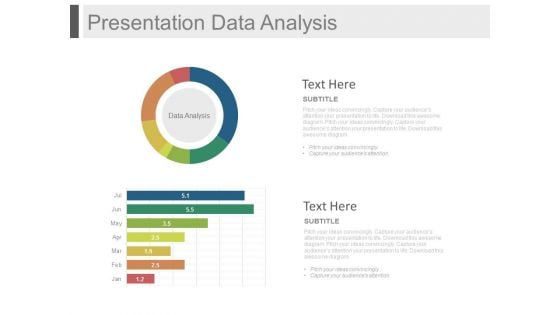
Presentation Data Analysis Ppt Slides
This is a presentation data analysis ppt slides. This is a two stage process. The stages in this process are business, finance, marketing.
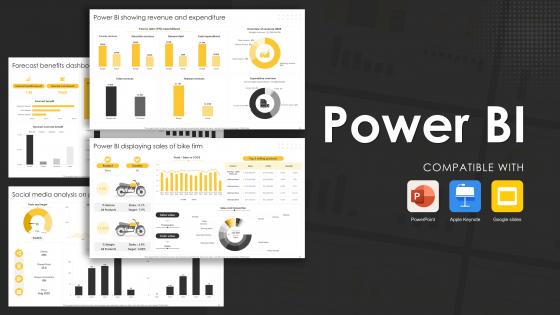
Power BI Powerpoint PPT Template Bundles
This Power BI Powerpoint PPT Template Bundles is a primer on how to capitalize on business opportunities through planning, innovation, and market intelligence. The content-ready format of the complete deck will make your job as a decision-maker a lot easier. Use this ready-made PowerPoint Template to help you outline an extensive and legible plan to capture markets and grow your company on the right path, at an exponential pace. What is even more amazing is that this presentation is completely editable and 100 percent customizable. This Data Visualization,Project Report,Business Intelligence,Data Model,Technology Project-slide complete deck helps you impress a roomful of people with your expertise in business and even presentation. Craft such a professional and appealing presentation for that amazing recall value. Download now. Our Power BI PowerPoint PPT Template Bundles are carefully crafted to provide a visually appealing and professional backdrop for any subject. These templates allow you to convey data insights and statistics with clarity and impact, making you appear professional and confident.
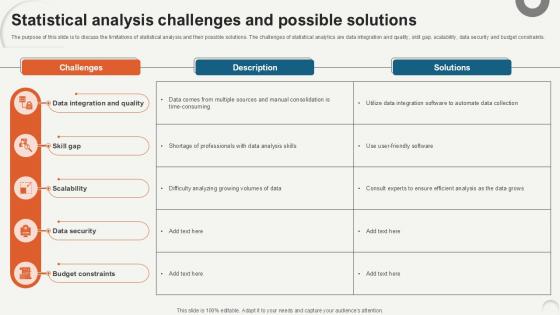
Statistical Analysis Challenges Data Analytics For Informed Decision Ppt Example
The purpose of this slide is to discuss the limitations of statistical analysis and their possible solutions. The challenges of statistical analytics are data integration and quality, skill gap, scalability, data security and budget constraints. Slidegeeks has constructed Statistical Analysis Challenges Data Analytics For Informed Decision Ppt Example after conducting extensive research and examination. These presentation templates are constantly being generated and modified based on user preferences and critiques from editors. Here, you will find the most attractive templates for a range of purposes while taking into account ratings and remarks from users regarding the content. This is an excellent jumping-off point to explore our content and will give new users an insight into our top-notch PowerPoint Templates. The purpose of this slide is to discuss the limitations of statistical analysis and their possible solutions. The challenges of statistical analytics are data integration and quality, skill gap, scalability, data security and budget constraints.
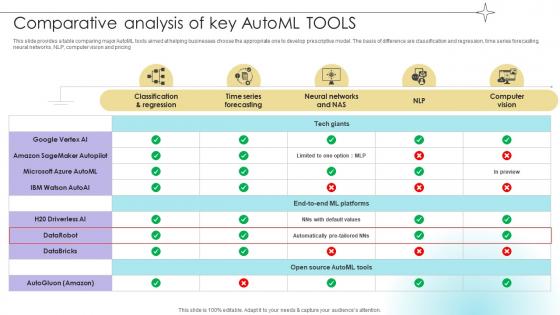
Comparative Analysis Of Key Automl Tools Data Analytics SS V
This slide provides a table comparing major AutoML tools aimed at helping businesses choose the appropriate one to develop prescriptive model. The basis of difference are classification and regression, time series forecasting, neural networks, NLP, computer vision and pricing.The Comparative Analysis Of Key Automl Tools Data Analytics SS V is a compilation of the most recent design trends as a series of slides. It is suitable for any subject or industry presentation, containing attractive visuals and photo spots for businesses to clearly express their messages. This template contains a variety of slides for the user to input data, such as structures to contrast two elements, bullet points, and slides for written information. Slidegeeks is prepared to create an impression. This slide provides a table comparing major AutoML tools aimed at helping businesses choose the appropriate one to develop prescriptive model. The basis of difference are classification and regression, time series forecasting, neural networks, NLP, computer vision and pricing.
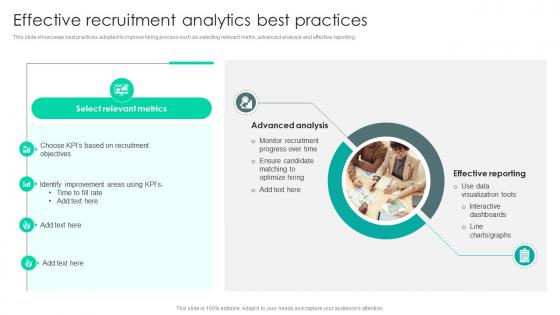
Strategic Staffing Using Data Effective Recruitment Analytics Best Practices CRP DK SS V
This slide showcases best practices adopted to improve hiring process such as selecting relevant metric, advanced analysis and effective reporting. Formulating a presentation can take up a lot of effort and time, so the content and message should always be the primary focus. The visuals of the PowerPoint can enhance the presenters message, so our Strategic Staffing Using Data Effective Recruitment Analytics Best Practices CRP DK SS V was created to help save time. Instead of worrying about the design, the presenter can concentrate on the message while our designers work on creating the ideal templates for whatever situation is needed. Slidegeeks has experts for everything from amazing designs to valuable content, we have put everything into Strategic Staffing Using Data Effective Recruitment Analytics Best Practices CRP DK SS V. This slide showcases best practices adopted to improve hiring process such as selecting relevant metric, advanced analysis and effective reporting.


 Continue with Email

 Home
Home


