Executive Icons
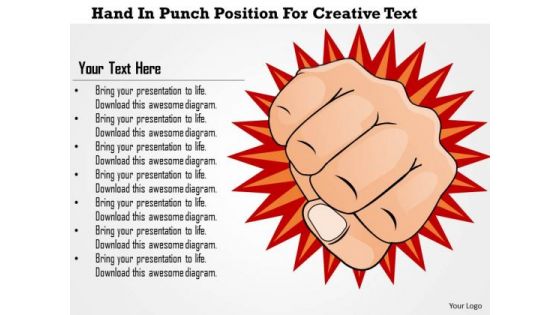
Business Diagram Hand In Punch Position For Creative Text Presentation Template
This business diagram has been designed with graphic of hand in punch position. This PPT slide contains the space to put text. Use this slide to accomplish your presentation needs at company or business presentations.
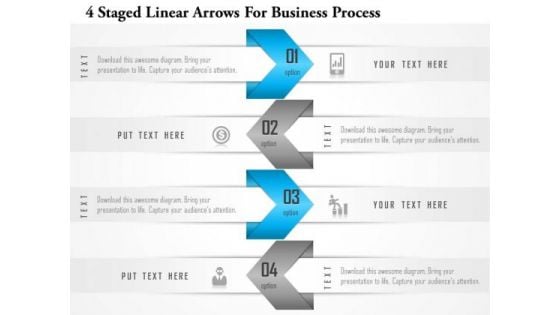
Business Diagram 4 Staged Linear Arrows For Business Process Presentation Template
This Power Point template has been designed with graphic of four staged linear arrow diagram. This PPT contains the concept of business and marketing process flow. Use this PPT for your business and marketing presentations.
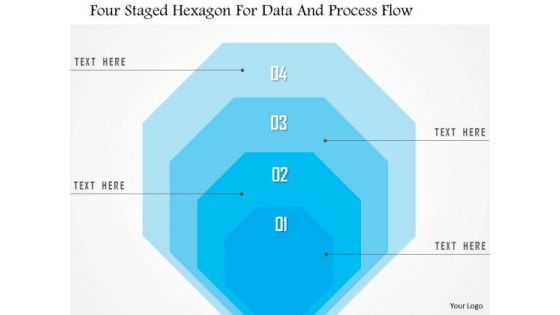
Business Diagram Four Staged Hexagon For Data And Process Flow Presentation Template
Four staged hexagon diagram has been used to design this power point template. This PPT contains the concept of data and process flow. Use this PPT and build professional presentation on business topics.
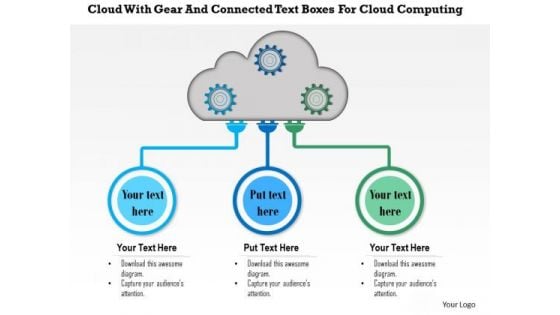
Business Diagram Cloud With Gear And Connected Text Boxes For Cloud Computing Presentation Template
Connected text boxes with clouds and gears are used to design this business diagram. This slide can be used to present statistical information in innovative manner. Download this slide to earn good impressions from the audience.
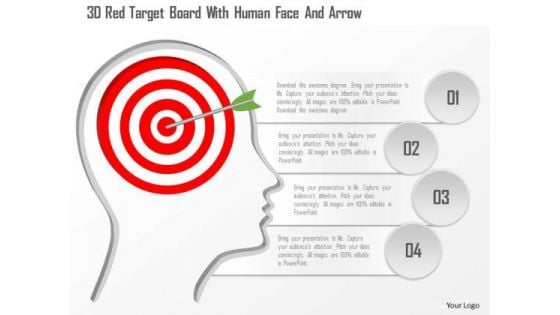
Busines Diagram 3d Red Target Board With Human Face And Arrow Presentation Template
This business diagram has been designed with graphic of 3d red target board on human face. This business slide helps to portray the concept of target achievement. Use this awesome slide for business and marketing target related presentations.
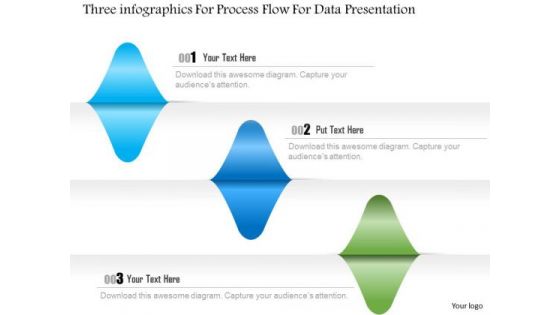
Busines Diagram Three Infographics For Process Flow For Data Presentation Template
Three info graphics has been used to design this business diagram. This slide helps to depict business process flow. This slide offers an excellent background to build professional presentations.
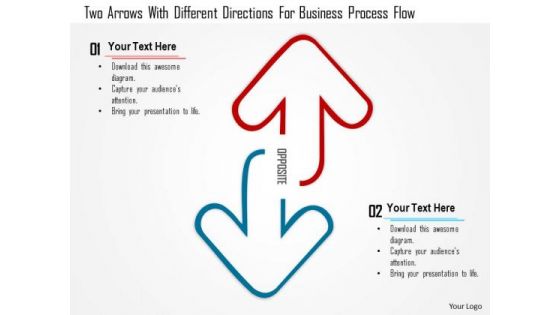
Busines Diagram Two Arrows With Different Directions For Business Process Flow Ppt Template
This business diagram has been designed with graphic of two arrows and different directions. This slide helps to depict business process flow. This slide offers an excellent background to build professional presentations.
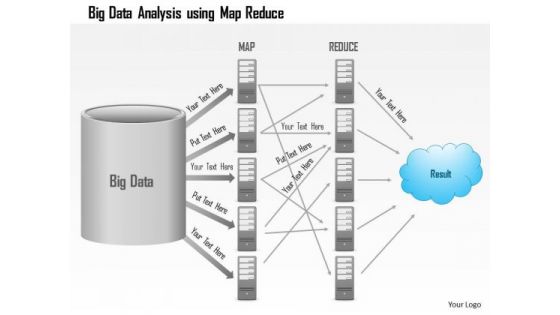
Business Diagram Big Data Analysis Using Map Reduce Batch Processing Ppt Slide
This PowerPoint template has been designed with graphic of server and data transfer network. This slide contains the steps of big data, map, reduce and result. Use this editable diagram for data technology related presentations.

Business Diagram Big Data Concept With Globe And Finger Clicking On Global Data Feeds Ppt Slide
This PowerPoint template has been designed with big data tag on globe. This graphic also displays the hand cursor on the big data text. This diagram can be used to display concept of global data transfer.
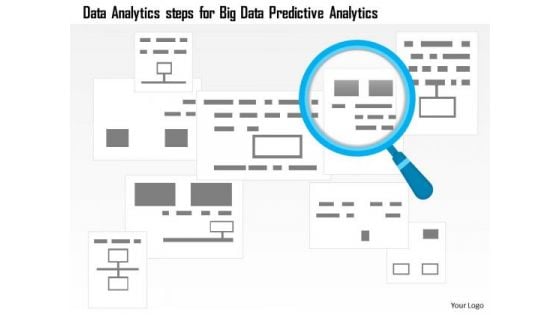
Business Diagram Data Analytics Steps For Big Data Predictive Analytics Ppt Slide
This power point template has been designed with graphic of magnifier over boxes. This slide contains the concept of predictive analytics of big data. This diagram can be used for data analytics related topics in any presentation.
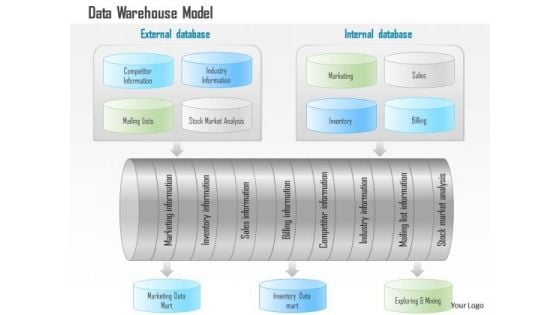
Business Diagram Data Warehouse Model With Analytics And Business Intelligence Ppt Slide
This technology diagram has been designed with graphic of data warehouse model. This model depicts concept of business intelligence and analysis. Download this editable slide build an exclusive presentation.

Business Diagram Extract Transform Load Etl Business Intelligence Bug Data Analysis Pipeline Ppt Sli
This PowerPoint template has been designed with graphic of server. This diagram depicts the concept of ETL business intelligence with extract transform load. This slide also helps to display the data analysis pipeline.
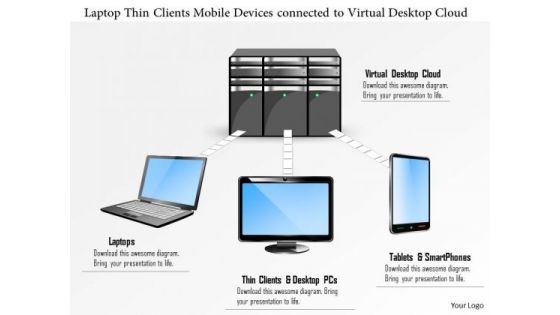
Business Diagram Laptop Thin Clients Mobile Devices Connected To Virtual Desktop Cloud Ppt Slide
This PowerPoint template has been designed with graphic of laptop and mobile devices. It depicts concept of network with interconnected devices. Use this diagram for technology and internet related topics.
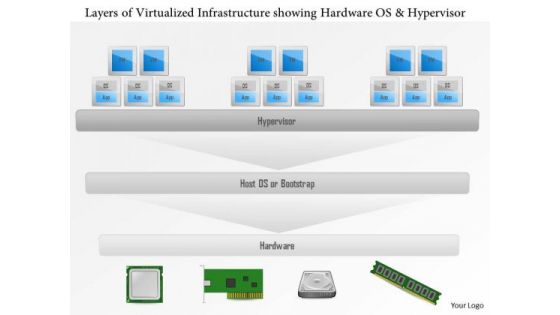
Business Diagram Layers Of A Virtualized Infrastructure Showing Hardware Os And Hypervisor Ppt Slide
This PowerPoint template has been designed with graphic of hardware. These devices are used to display concept of device infrastructure. This diagram slide may be used for cloud technology and business related presentations.
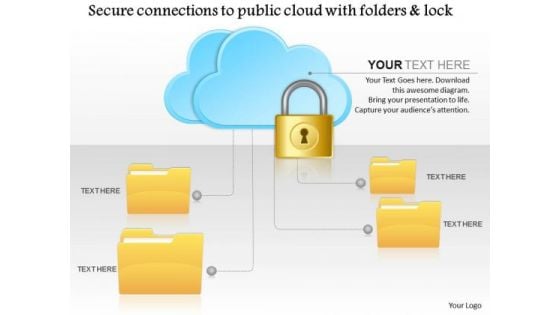
Business Diagram Secure Connections To The Public Cloud With Folders And Lock Ppt Slide
This technical slide has been designed with graphic of folders and cloud with lock. This PPT slide depicts the concept of secure connections. It focuses on the data safety in cloud technology. Use this diagram for data safety related presentations.
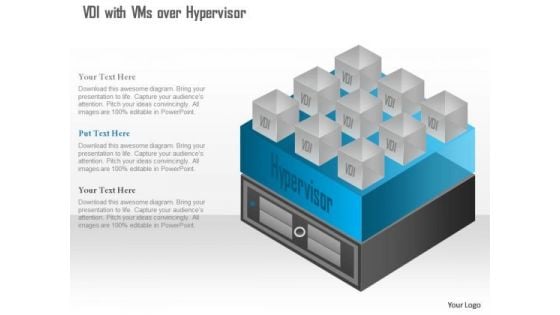
Business Diagram Virtual Desktip Infrastructure Vdi With Vms Over Hypervisor Ppt Slide
This PowerPoint template has been designed with graphic of virtual infrastructure. This diagram contains the VMS running on hardware. This slide may be used for computer technology related presentations.
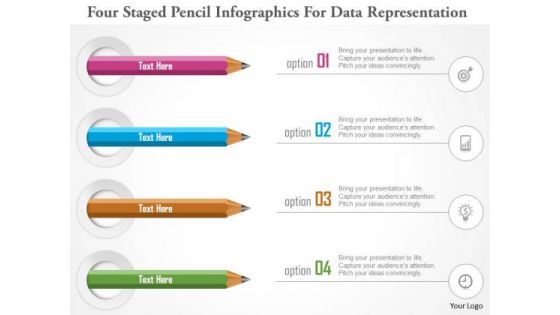
Business Diagram Four Staged Pencil Infographics For Data Representation PowerPoint Template
Four staged pencil info graphics has been used to design this power point template. This diagram template contains the concept of data representations. Use this PPT for your business and marketing presentations.

Business Diagram Three Colorful Bulb With Idea Text For Business PowerPoint Template
This power point template has been designed with graphic of three colorful bulbs and text boxes. These text boxes are used to show the concept of idea generation. Use this PPT diagram for business and marketing related presentations.
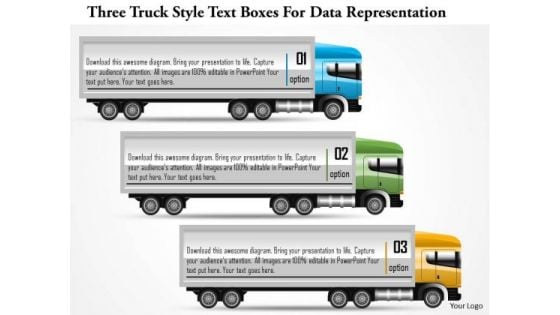
Business Diagram Three Truck Style Text Boxes For Data Representation PowerPoint Template
This power point template diagram has been designed with graphic of three truck style text boxes. These boxes are used to display the text and data. Use this PPT for your business presentation and get good comments from your viewers.

Business Diagram Yellow Smiley Bulb With Series Of White Bulbs Presentation Template
This business diagram has been designed with graphic of yellow smiley bulbs and white bulb. This slide depicts the concept of leadership. Use this slide to build quality presentation for your viewers.
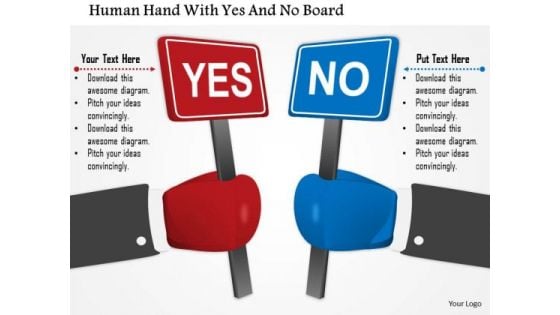
Business Diagram Human Hand With Yes And No Board Presentation Template
Graphic of human hands with yes and no boards has been used to design this power point template. This PPT contains the concept of decision making. Use this PPT diagram for business and marketing related presentations.
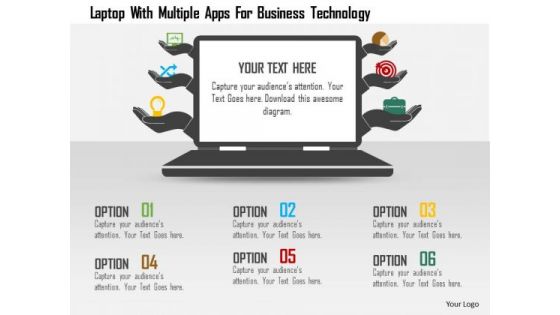
Business Diagram Laptop With Multiple Apps For Business Technology Presentation Template
This power point template diagram has been designed with graphic of laptop and multiple apps. This PPT can be used for technology and communication. Use this PPT for business and technology related presentations.
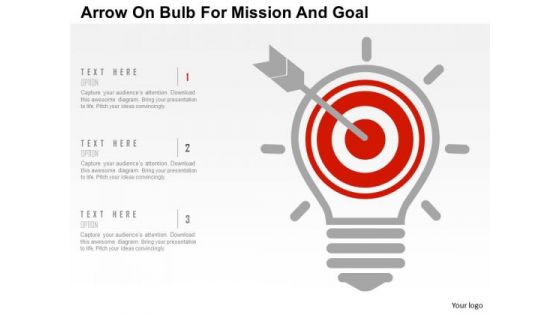
Business Diagram Arrow On Bulb For Mission And Goal Presentation Template
This business slide has been designed with graphics of arrow on target bulb. You may download this slide for mission and goal related topics. Mesmerize your audience with this unique diagram.
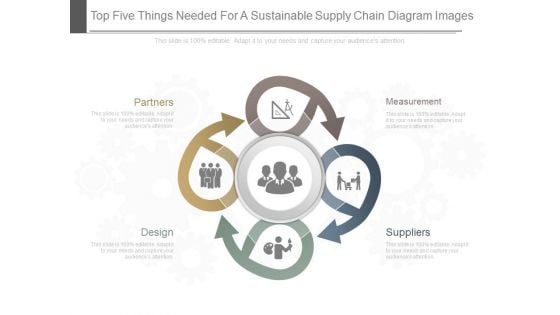
Top Five Things Needed For A Sustainable Supply Chain Diagram Images
This is a top five things needed for a sustainable supply chain diagram images. This is a four stage process. The stages in this process are partners, measurement, design, suppliers.
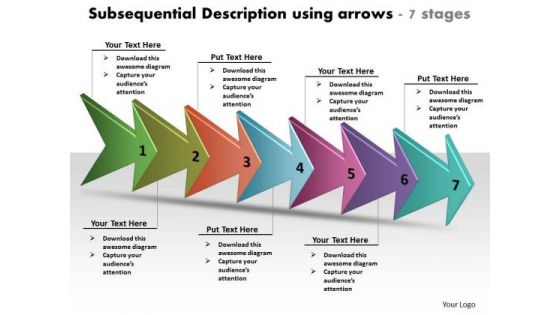
Subsequential Description Using Arrows 7 Stages Online Flowchart PowerPoint Slides
We present our subsequential description using arrows 7 stages online flowchart PowerPoint Slides.Use our Arrows PowerPoint Templates because,you can Master them all and you have it made. Use our Shapes PowerPoint Templates because,You can Signpost your preferred roadmap to your eager co- travellers and demonstrate clearly how you intend to navigate them towards the desired corporate goal. Use our Signs PowerPoint Templates because, You have the plans ready for them to absorb and understand. Use our Business PowerPoint Templates because, Infrastructure growth is an obvious requirement of today.Inform your group on how exactly this potential is tailor made for you Use our Process and Flows PowerPoint Templates because,It unravels each one for your audience while setting key timelines as you go along.Use these PowerPoint slides for presentations relating to arrow, arrows, block, business, chart, design, development, diagram, direction, element, flow, flowchart, graph, linear, management, organization, process, program, section, sign, solution, symbol. The prominent colors used in the PowerPoint template are Purple, Pink, Blue. People tell us our subsequential description using arrows 7 stages online flowchart PowerPoint Slides are Wonderful. The feedback we get is that our direction PowerPoint templates and PPT Slides are Cheerful. People tell us our subsequential description using arrows 7 stages online flowchart PowerPoint Slides look good visually. Presenters tell us our design PowerPoint templates and PPT Slides are Fancy. The feedback we get is that our subsequential description using arrows 7 stages online flowchart PowerPoint Slides are Luxurious. Professionals tell us our development PowerPoint templates and PPT Slides are Sparkling. Our Subsequential Description Using Arrows 7 Stages Online Flowchart PowerPoint Slides ensure a creditable performance. You will certainly recieve more than due applause.
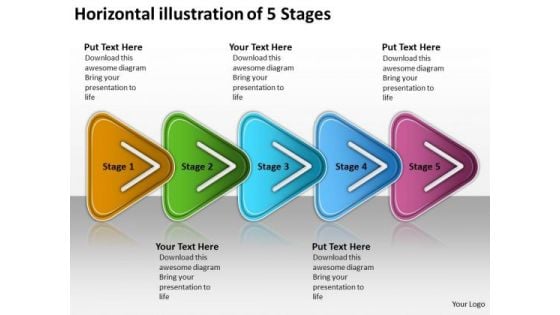
Horizontal Illustration Of 5 Stages Vision Office Stencils PowerPoint Templates
We present our horizontal illustration of 5 stages vision office stencils PowerPoint templates.Use our Arrows PowerPoint Templates because it can illustrate your chain of ideas focusing on that aspect or resource in order to enhance the quality of your product. Use our Success PowerPoint Templates because iT outlines the entire thought process for the benefit of others. Tell it to the world with your characteristic aplomb. Use our Process and Flows PowerPoint Templates because you have a handle on all the targets, a master of the game, the experienced and consummate juggler. Present our Shapes PowerPoint Templates because different people with differing ideas and priorities perform together to score. Use our Business PowerPoint Templates because like the famed William Tell, they put aside all emotions and concentrate on the target.Use these PowerPoint slides for presentations relating to abstract, arrow, arrows, business, chart, design, development, diagram, direction, element, flow, flowchart, graph, linear, management, model, motion, organization, plan, process, program, section, segment, set, sign, solution, strategy, symbol, technology. The prominent colors used in the PowerPoint template are Yellow, Green, Blue. Customers tell us our horizontal illustration of 5 stages vision office stencils PowerPoint templates are Appealing. The feedback we get is that our direction PowerPoint templates and PPT Slides are Wonderful. Professionals tell us our horizontal illustration of 5 stages vision office stencils PowerPoint templates will help them to explain complicated concepts. People tell us our design PowerPoint templates and PPT Slides are Delightful. Customers tell us our horizontal illustration of 5 stages vision office stencils PowerPoint templates are Splendid. Professionals tell us our development PowerPoint templates and PPT Slides are visually appealing. Back great ideas with our Horizontal Illustration Of 5 Stages Vision Office Stencils PowerPoint Templates. You will come out on top.
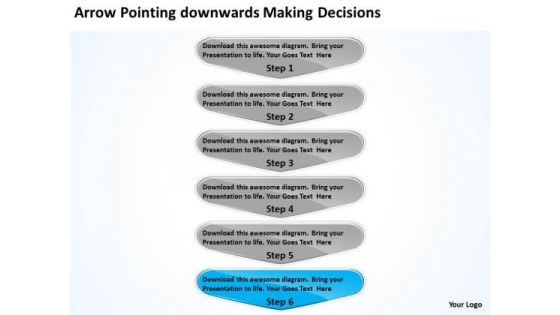
Arrow Pointing Downwards Making Decisions Flowchart PowerPoint Freeware Slides
We present our arrow pointing downwards making decisions flowchart PowerPoint freeware Slides.Download and present our Leadership PowerPoint Templates because you can put down your ideas and present them using our innovative templates. Download and present our Marketing PowerPoint Templates because The marketplace is the merger of your dreams and your ability. Present our Business PowerPoint Templates because you have analysed many global markets and come up with possibilities. Highlight the pros and cons of other likely business oppurtunities. Use our Shapes PowerPoint Templates because you can outline your targets to your team. Download our Arrows PowerPoint Templates because you can Show them the way, be Captain of the ship and lead them to new shores.Use these PowerPoint slides for presentations relating to Abstract, Arrow, Arrows, Business, Chart, Design, Development, Diagram, Direction, Element, Flow, Flowchart, Graph, Linear, Management, Model, Motion, Organization, Plan, Process, Program, Section, Segment, Set, Sign, Solution, Strategy, Symbol, Technology. The prominent colors used in the PowerPoint template are Blue light, Gray, White. Customers tell us our arrow pointing downwards making decisions flowchart PowerPoint freeware Slides are Adorable. You can be sure our Design PowerPoint templates and PPT Slides will make you look like a winner. Presenters tell us our arrow pointing downwards making decisions flowchart PowerPoint freeware Slides are Spiffy. Professionals tell us our Direction PowerPoint templates and PPT Slides are Appealing. Presenters tell us our arrow pointing downwards making decisions flowchart PowerPoint freeware Slides will get their audience's attention. Professionals tell us our Direction PowerPoint templates and PPT Slides provide great value for your money. Be assured of finding the best projection to highlight your words. Exhibit your charisma with our Arrow Pointing Downwards Making Decisions Flowchart PowerPoint Freeware Slides. They will add to your ample charm.
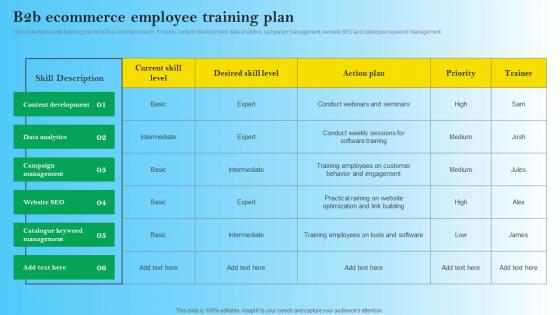
B2B Ecommerce Employee Training Plan B2B Digital Commerce Elements Pdf
This slide represents training plan for b2b e-commerce team. It covers content development, data analytics, campaign management, website SEO and catalogue keyword management. Are you searching for a B2B Ecommerce Employee Training Plan B2B Digital Commerce Elements Pdf that is uncluttered, straightforward, and original It is easy to edit, and you can change the colors to suit your personal or business branding. For a presentation that expresses how much effort you have put in, this template is ideal With all of its features, including tables, diagrams, statistics, and lists, it is perfect for a business plan presentation. Make your ideas more appealing with these professional slides. Download B2B Ecommerce Employee Training Plan B2B Digital Commerce Elements Pdf from Slidegeeks today. This slide represents training plan for b2b e-commerce team. It covers content development, data analytics, campaign management, website SEO and catalogue keyword management.
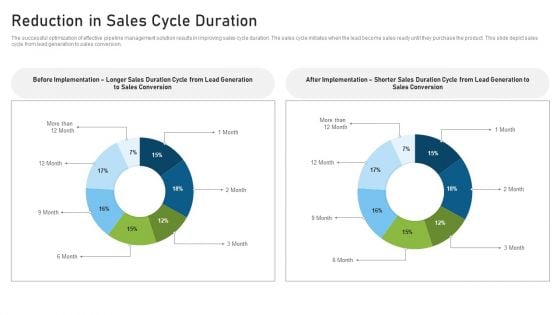
CRM Pipeline Administration Reduction In Sales Cycle Duration Formats PDF
The successful optimization of effective pipeline management solution results in improving sales cycle duration. The sales cycle initiates when the lead become sales ready until they purchase the product. This slide depict sales cycle from lead generation to sales conversion. Take your projects to the next level with our ultimate collection of CRM Pipeline Administration Reduction In Sales Cycle Duration Formats PDF. Slidegeeks has designed a range of layouts that are perfect for representing task or activity duration, keeping track of all your deadlines at a glance. Tailor these designs to your exact needs and give them a truly corporate look with your own brand colors theyll make your projects stand out from the rest.
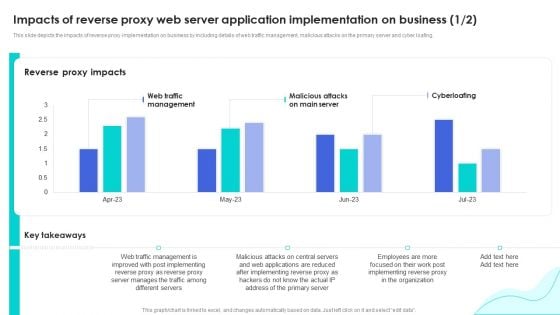
Reverse Proxy Web Server Impacts Of Reverse Proxy Web Server Application Inspiration PDF
This slide depicts the impacts of reverse proxy implementation on business by including details of web traffic management, malicious attacks on the primary server and cyber loafing. Coming up with a presentation necessitates that the majority of the effort goes into the content and the message you intend to convey. The visuals of a PowerPoint presentation can only be effective if it supplements and supports the story that is being told. Keeping this in mind our experts created Reverse Proxy Web Server Impacts Of Reverse Proxy Web Server Application Inspiration PDF to reduce the time that goes into designing the presentation. This way, you can concentrate on the message while our designers take care of providing you with the right template for the situation.
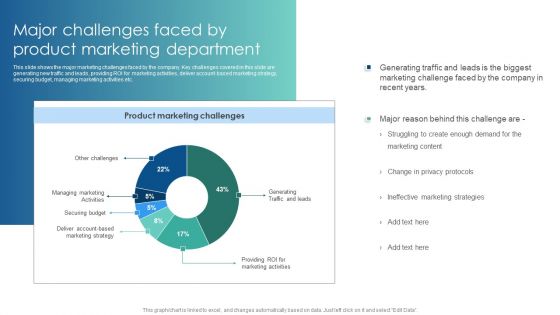
Major Challenges Faced By Product Marketing Department Customer Acquisition Through Advertising Pictures PDF
This slide shows the major marketing challenges faced by the company. Key challenges covered in this slide are generating new traffic and leads, providing ROI for marketing activities, deliver account based marketing strategy, securing budget, managing marketing activities etc. Coming up with a presentation necessitates that the majority of the effort goes into the content and the message you intend to convey. The visuals of a PowerPoint presentation can only be effective if it supplements and supports the story that is being told. Keeping this in mind our experts created Major Challenges Faced By Product Marketing Department Customer Acquisition Through Advertising Pictures PDF to reduce the time that goes into designing the presentation. This way, you can concentrate on the message while our designers take care of providing you with the right template for the situation.
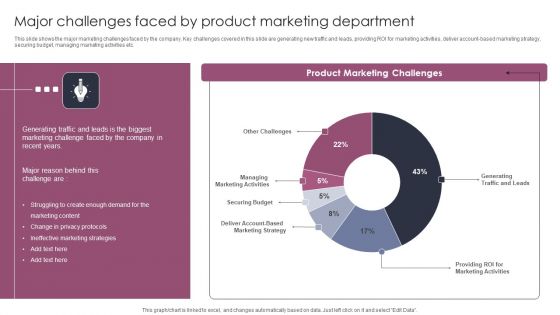
Major Challenges Faced By Product Marketing Department Stages To Develop Demand Generation Tactics Portrait PDF
This slide shows the major marketing challenges faced by the company. Key challenges covered in this slide are generating new traffic and leads, providing ROI for marketing activities, deliver account based marketing strategy, securing budget, managing marketing activities etc. Coming up with a presentation necessitates that the majority of the effort goes into the content and the message you intend to convey. The visuals of a PowerPoint presentation can only be effective if it supplements and supports the story that is being told. Keeping this in mind our experts created Major Challenges Faced By Product Marketing Department Stages To Develop Demand Generation Tactics Portrait PDF to reduce the time that goes into designing the presentation. This way, you can concentrate on the message while our designers take care of providing you with the right template for the situation.

Supply Chain Kpi Dashboard For Effective Financial Analysis Stand Out Digital Supply Chain Tactics Enhancing Graphics PDF
Mentioned slide illustrates KPI dashboard that can be used by managers to assess financial health of supply chain business. KPIs covered are supply chain costs versus sales, cash to order cycle, warehouse operating cost distribution etc.Coming up with a presentation necessitates that the majority of the effort goes into the content and the message you intend to convey. The visuals of a PowerPoint presentation can only be effective if it supplements and supports the story that is being told. Keeping this in mind our experts created Supply Chain Kpi Dashboard For Effective Financial Analysis Stand Out Digital Supply Chain Tactics Enhancing Graphics PDF to reduce the time that goes into designing the presentation. This way, you can concentrate on the message while our designers take care of providing you with the right template for the situation.
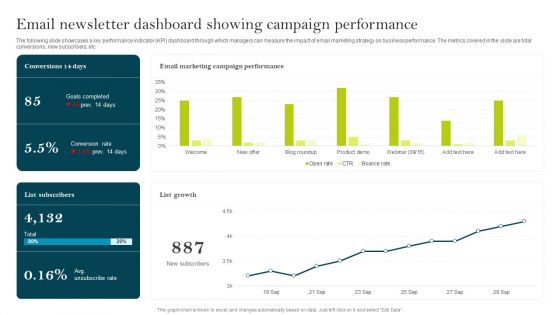
Email Newsletter Dashboard Showing Campaign Performance Ppt PowerPoint Presentation File Infographic Template PDF
The following slide showcases a key performance indicator KPI dashboard through which managers can measure the impact of email marketing strategy on business performance. The metrics covered in the slide are total conversions, new subscribers, etc. Coming up with a presentation necessitates that the majority of the effort goes into the content and the message you intend to convey. The visuals of a PowerPoint presentation can only be effective if it supplements and supports the story that is being told. Keeping this in mind our experts created Email Newsletter Dashboard Showing Campaign Performance Ppt PowerPoint Presentation File Infographic Template PDF to reduce the time that goes into designing the presentation. This way, you can concentrate on the message while our designers take care of providing you with the right template for the situation.
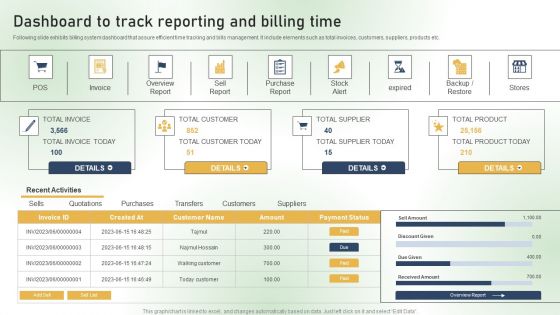
Dashboard To Track Reporting And Billing Time Ppt PowerPoint Presentation File Infographics PDF
Following slide exhibits billing system dashboard that assure efficient time tracking and bills management. It include elements such as total invoices, customers, suppliers, products etc. Coming up with a presentation necessitates that the majority of the effort goes into the content and the message you intend to convey. The visuals of a PowerPoint presentation can only be effective if it supplements and supports the story that is being told. Keeping this in mind our experts created Dashboard To Track Reporting And Billing Time Ppt PowerPoint Presentation File Infographics PDF to reduce the time that goes into designing the presentation. This way, you can concentrate on the message while our designers take care of providing you with the right template for the situation.
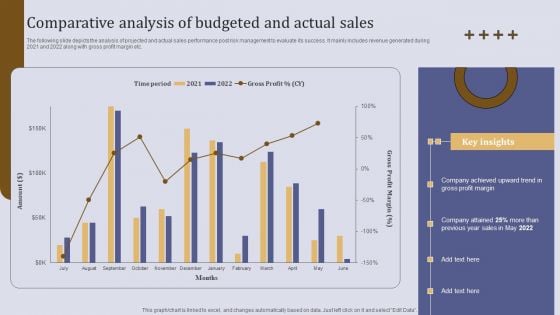
Comparative Analysis Of Budgeted And Actual Sales Ppt Slides Graphics Tutorials PDF
The following slide depicts the analysis of projected and actual sales performance post risk management to evaluate its success. It mainly includes revenue generated during 2021 and 2022 along with gross profit margin etc. Coming up with a presentation necessitates that the majority of the effort goes into the content and the message you intend to convey. The visuals of a PowerPoint presentation can only be effective if it supplements and supports the story that is being told. Keeping this in mind our experts created Comparative Analysis Of Budgeted And Actual Sales Ppt Slides Graphics Tutorials PDF to reduce the time that goes into designing the presentation. This way, you can concentrate on the message while our designers take care of providing you with the right template for the situation.
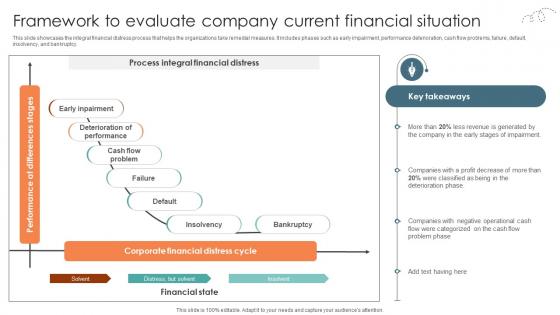
Framework To Evaluate Company Current Financial Situation Strategic Approaches To Corporate Financial
This slide showcases the integral financial distress process that helps the organizations take remedial measures. It includes phases such as early impairment, performance deterioration, cash flow problems, failure, default, insolvency, and bankruptcy. Whether you have daily or monthly meetings, a brilliant presentation is necessary. Framework To Evaluate Company Current Financial Situation Strategic Approaches To Corporate Financial can be your best option for delivering a presentation. Represent everything in detail using Framework To Evaluate Company Current Financial Situation Strategic Approaches To Corporate Financial and make yourself stand out in meetings. The template is versatile and follows a structure that will cater to your requirements. All the templates prepared by Slidegeeks are easy to download and edit. Our research experts have taken care of the corporate themes as well. So, give it a try and see the results. This slide showcases the integral financial distress process that helps the organizations take remedial measures. It includes phases such as early impairment, performance deterioration, cash flow problems, failure, default, insolvency, and bankruptcy.
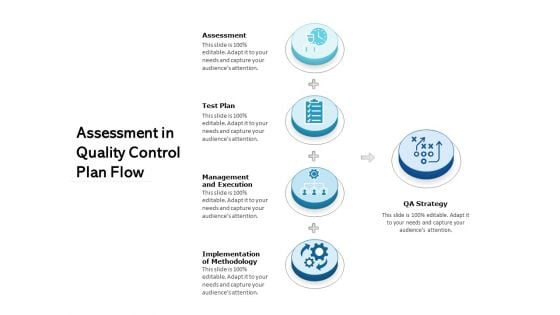
Assessment In Quality Control Plan Flow Ppt PowerPoint Presentation Gallery Information PDF
Presenting assessment in quality control plan flow ppt powerpoint presentation gallery information pdf to dispense important information. This template comprises four stages. It also presents valuable insights into the topics including plan, management, implementation. This is a completely customizable PowerPoint theme that can be put to use immediately. So, download it and address the topic impactfully.
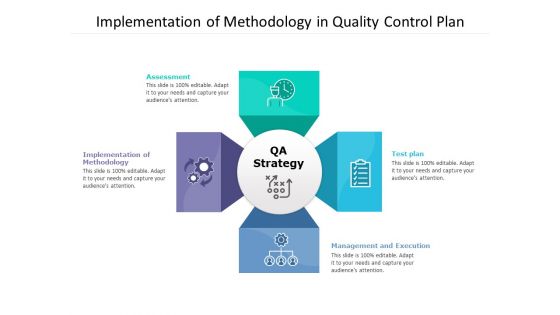
Implementation Of Methodology In Quality Control Plan Ppt PowerPoint Presentation File Summary PDF
Presenting implementation of methodology in quality control plan ppt powerpoint presentation file summary pdf to dispense important information. This template comprises four stages. It also presents valuable insights into the topics including plan, management, implementation. This is a completely customizable PowerPoint theme that can be put to use immediately. So, download it and address the topic impactfully.
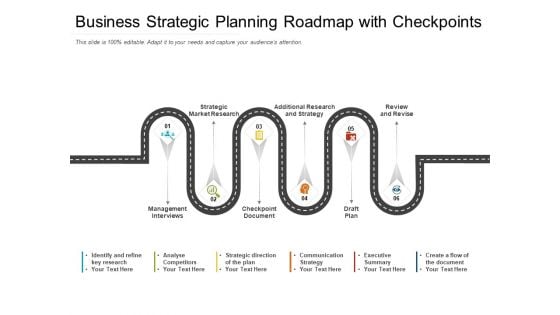
Business Strategic Planning Roadmap With Checkpoints Ppt PowerPoint Presentation Gallery Images PDF
Presenting business strategic planning roadmap with checkpoints ppt powerpoint presentation gallery images pdf to dispense important information. This template comprises six stages. It also presents valuable insights into the topics including strategic, plan, management. This is a completely customizable PowerPoint theme that can be put to use immediately. So, download it and address the topic impactfully.
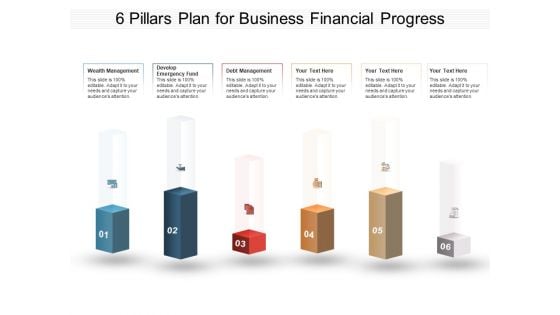
6 Pillars Plan For Business Financial Progress Ppt PowerPoint Presentation Outline Deck PDF
Presenting 6 pillars plan for business financial progress ppt powerpoint presentation outline deck pdf to dispense important information. This template comprises six stages. It also presents valuable insights into the topics including wealth management, develop emergency fund, debt management. This is a completely customizable PowerPoint theme that can be put to use immediately. So, download it and address the topic impactfully.
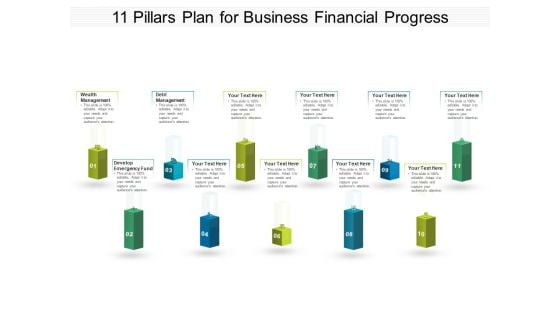
11 Pillars Plan For Business Financial Progress Ppt PowerPoint Presentation Professional Background Images PDF
Presenting 11 pillars plan for business financial progress ppt powerpoint presentation professional background images pdf to dispense important information. This template comprises eleven stages. It also presents valuable insights into the topics including wealth management, develop emergency fund, debt management. This is a completely customizable PowerPoint theme that can be put to use immediately. So, download it and address the topic impactfully.
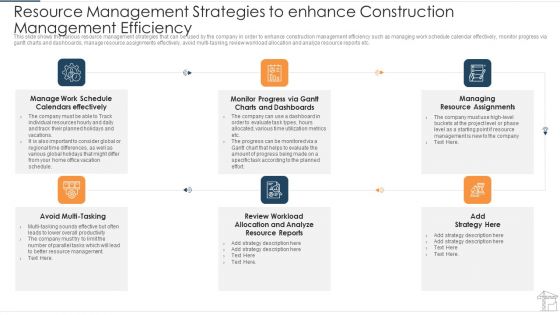
Resource Management Strategies To Enhance Construction Management Efficiency Demonstration PDF
This slide shows the various resource management strategies that can be used by the company in order to enhance construction management efficiency such as managing work schedule calendar effectively, monitor progress via gantt charts and dashboards, manage resource assignments effectively, avoid multi-tasking, review workload allocation and analyze resource reports etc.This is a resource management strategies to enhance construction management efficiency demonstration pdf template with various stages. Focus and dispense information on six stages using this creative set, that comes with editable features. It contains large content boxes to add your information on topics like manage work schedule calendars effectively, managing resource assignments, avoid multi tasking. You can also showcase facts, figures, and other relevant content using this PPT layout. Grab it now.
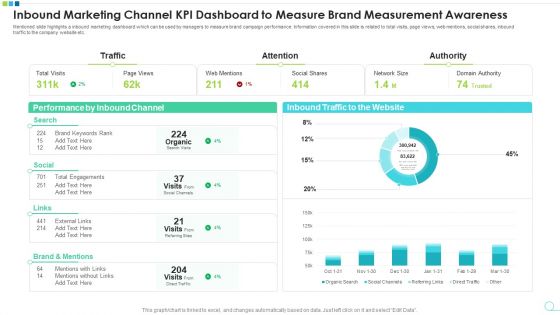
Inbound Marketing Channel KPI Dashboard To Measure Brand Measurement Awareness Pictures PDF
Mentioned slide highlights a inbound marketing dashboard which can be used by managers to measure brand campaign performance. Information covered in this slide is related to total visits, page views, web mentions, social shares, inbound traffic to the company website etc. Pitch your topic with ease and precision using this inbound marketing channel kpi dashboard to measure brand measurement awareness pictures pdf. This layout presents information on inbound marketing channel kpi dashboard to measure brand measurement awareness. It is also available for immediate download and adjustment. So, changes can be made in the color, design, graphics or any other component to create a unique layout.
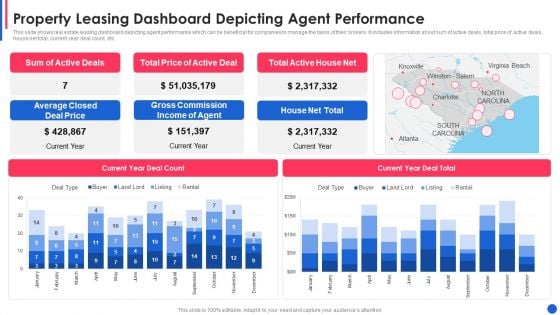
Property Leasing Dashboard Depicting Agent Performance Guidelines PDF
This slide shows real estate leasing dashboard depicting agent performance which can be beneficial for companies to manage the tasks of their brokers. It includes information about sum of active deals, total price of active deals, house net total, current year deal count, etc.Pitch your topic with ease and precision using this property leasing dashboard depicting agent performance guidelines pdf This layout presents information on average closed deal price, gross commission income, total active house net It is also available for immediate download and adjustment. So, changes can be made in the color, design, graphics or any other component to create a unique layout.
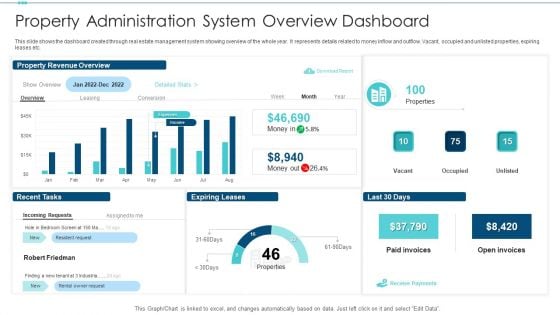
Property Administration System Overview Dashboard Demonstration PDF
This slide shows the dashboard created through real estate management system showing overview of the whole year. It represents details related to money inflow and outflow. Vacant, occupied and unlisted properties, expiring leases etc. Showcasing this set of slides titled property administration system overview dashboard demonstration pdf. The topics addressed in these templates are property administration system overview dashboard. All the content presented in this PPT design is completely editable. Download it and make adjustments in color, background, font etc. as per your unique business setting.
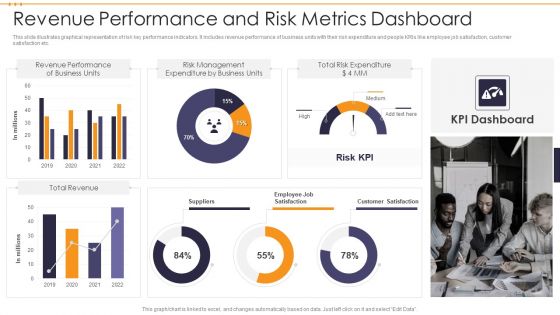
Revenue Performance And Risk Metrics Dashboard Demonstration PDF
This slide illustrates graphical representation of risk key performance indicators. It includes revenue performance of business units with their risk expenditure and people KRIs like employee job satisfaction, customer satisfaction etc. Showcasing this set of slides titled Revenue Performance And Risk Metrics Dashboard Demonstration PDF. The topics addressed in these templates are Total Risk Expenditure, Risk Management, Revenue Performance . All the content presented in this PPT design is completely editable. Download it and make adjustments in color, background, font etc. as per your unique business setting.
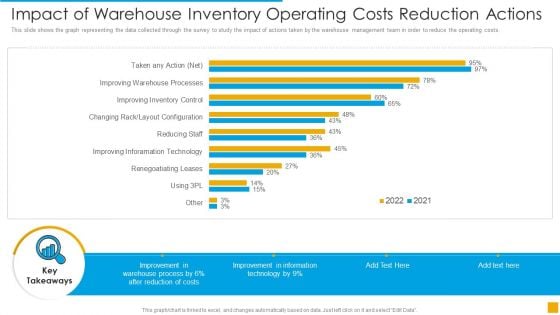
Impact Of Warehouse Inventory Operating Costs Reduction Actions Sample PDF
This slide shows the graph representing the data collected through the survey to study the impact of actions taken by the warehouse management team in order to reduce the operating costs Showcasing this set of slides titled Impact Of Warehouse Inventory Operating Costs Reduction Actions Sample PDF. The topics addressed in these templates are Information, Technology, Cost. All the content presented in this PPT design is completely editable. Download it and make adjustments in color, background, font etc. as per your unique business setting.
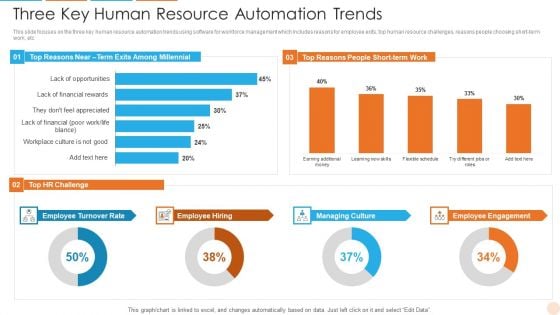
Three Key Human Resource Automation Trends Elements PDF
This slide focuses on the three key human resource automation trends using software for workforce management which includes reasons for employee exits, top human resource challenges, reasons people choosing short term work, etc. Showcasing this set of slides titled Three Key Human Resource Automation Trends Elements PDF. The topics addressed in these templates are Three Key Human Resource Automation Trends. All the content presented in this PPT design is completely editable. Download it and make adjustments in color, background, font etc. as per your unique business setting.
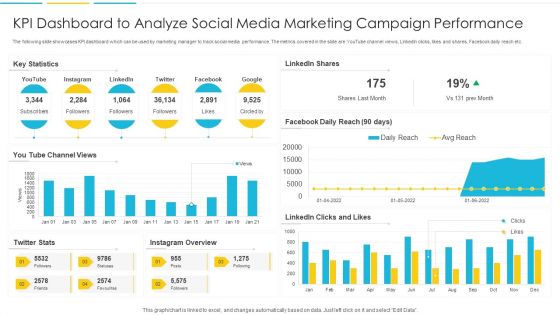
KPI Dashboard To Analyze Social Media Marketing Campaign Performance Rules PDF
The following slide showcases KPI dashboard which can be used by marketing manager to track social media performance. The metrics covered in the slide are YouTube channel views, LinkedIn clicks, likes and shares, Facebook daily reach etc. Pitch your topic with ease and precision using this KPI Dashboard To Analyze Social Media Marketing Campaign Performance Rules PDF. This layout presents information on Dashboard, Marketing, Analyze. It is also available for immediate download and adjustment. So, changes can be made in the color, design, graphics or any other component to create a unique layout.
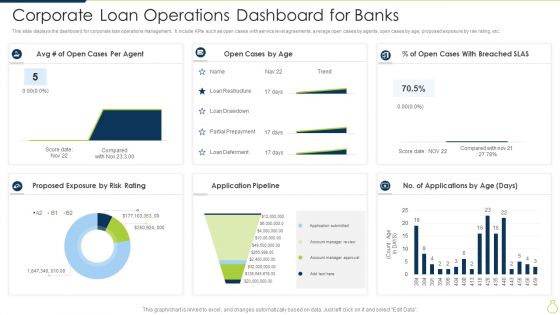
Corporate Loan Operations Dashboard For Banks Introduction PDF
This slide displays the dashboard for corporate loan operations management. It include KPIs such as open cases with service level agreements, average open cases by agents, open cases by age, proposed exposure by risk rating, etc. Pitch your topic with ease and precision using this Corporate Loan Operations Dashboard For Banks Introduction PDF. This layout presents information on Proposed Exposure By Risk Rating, Open Cases By Age, Application Pipeline. It is also available for immediate download and adjustment. So, changes can be made in the color, design, graphics or any other component to create a unique layout.
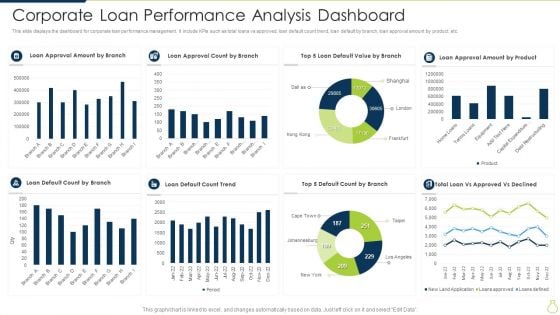
Corporate Loan Performance Analysis Dashboard Slides PDF
This slide displays the dashboard for corporate loan performance management. It include KPIs such as total loans vs approved, loan default count trend, loan default by branch, loan approval amount by product, etc. Showcasing this set of slides titled Corporate Loan Performance Analysis Dashboard Slides PDF. The topics addressed in these templates are Loan Default Count Trend, Loan Approval Count By Branch, Loan Approval Amount By Product. All the content presented in this PPT design is completely editable. Download it and make adjustments in color, background, font etc. as per your unique business setting.
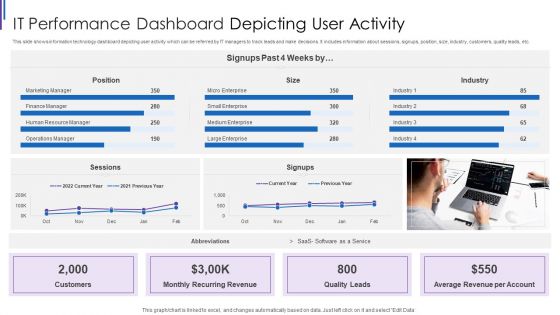
IT Performance Dashboard Depicting User Activity Inspiration PDF
This slide shows information technology dashboard depicting user activity which can be referred by IT managers to track leads and make decisions. It includes information about sessions, signups, position, size, industry, customers, quality leads, etc. Pitch your topic with ease and precision using this IT Performance Dashboard Depicting User Activity Inspiration PDF. This layout presents information on Monthly Recurring Revenue, Average Revenue Per, Account Quality Leads, Customers Position Sessions. It is also available for immediate download and adjustment. So, changes can be made in the color, design, graphics or any other component to create a unique layout.
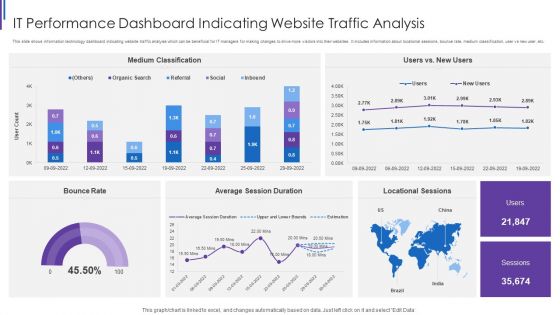
IT Performance Dashboard Indicating Website Traffic Analysis Background PDF
This slide shows information technology dashboard indicating website traffic analysis which can be beneficial for IT managers for making changes to drive more visitors into their websites. It includes information about locational sessions, bounce rate, medium classification, user vs new user, etc. Pitch your topic with ease and precision using this IT Performance Dashboard Indicating Website Traffic Analysis Background PDF. This layout presents information on Medium Classification Rate, Average Session Duration, Locational Sessions Bounce. It is also available for immediate download and adjustment. So, changes can be made in the color, design, graphics or any other component to create a unique layout.
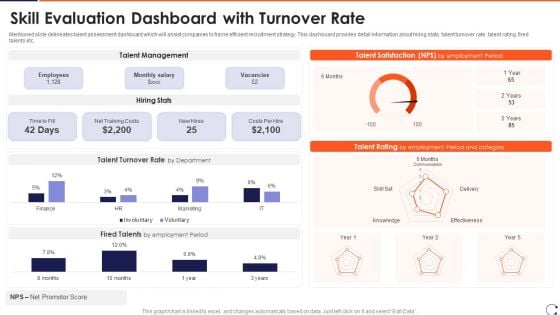
Skill Evaluation Dashboard With Turnover Rate Ideas PDF
Mentioned slide delineates talent assessment dashboard which will assist companies to frame efficient recruitment strategy. This dashboard provides detail information about hiring stats, talent turnover rate, talent rating, fired talents etc.Pitch your topic with ease and precision using this Skill Evaluation Dashboard With Turnover Rate Ideas PDF This layout presents information on Talent Management, Talent Satisfaction, Talent Rating It is also available for immediate download and adjustment. So, changes can be made in the color, design, graphics or any other component to create a unique layout.
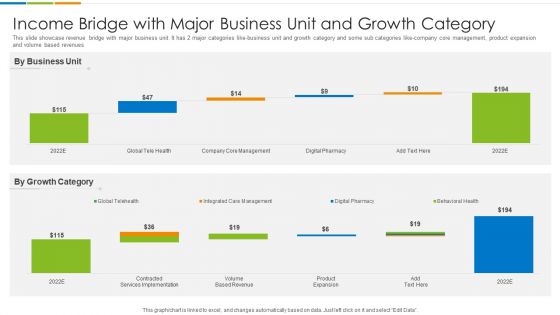
Income Bridge With Major Business Unit And Growth Category Ppt PowerPoint Presentation Gallery Format PDF
This slide showcase revenue bridge with major business unit. It has 2 major categories like-business unit and growth category and some sub categories like-company core management, product expansion and volume based revenues. Showcasing this set of slides titled Income Bridge With Major Business Unit And Growth Category Ppt PowerPoint Presentation Gallery Format PDF. The topics addressed in these templates are Business Unit, Growth Category, Product Expansion. All the content presented in this PPT design is completely editable. Download it and make adjustments in color, background, font etc. as per your unique business setting.
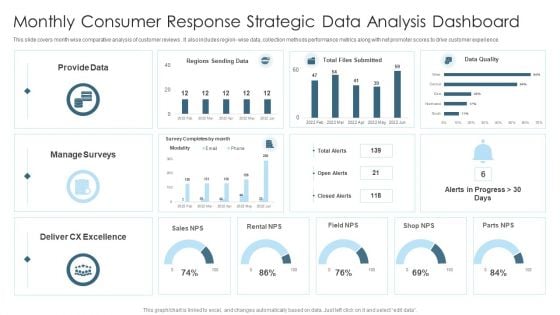
Monthly Consumer Response Strategic Data Analysis Dashboard Graphics PDF
This slide covers month wise comparative analysis of customer reviews . It also includes region wise data, collection methods performance metrics along with net promoter scores to drive customer experience. Showcasing this set of slides titled Monthly Consumer Response Strategic Data Analysis Dashboard Graphics PDF. The topics addressed in these templates are Provide Data, Sales, Manage Surveys. All the content presented in this PPT design is completely editable. Download it and make adjustments in color, background, font etc. as per your unique business setting.
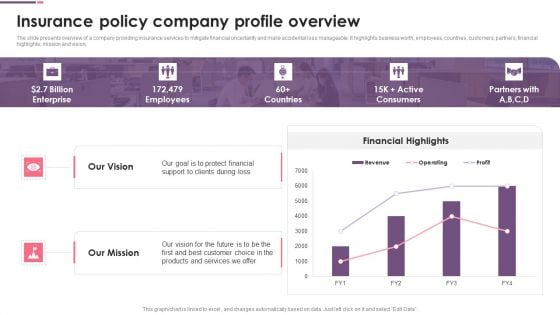
Insurance Policy Company Profile Overview Ppt Clipart PDF
The slide presents overview of a company providing insurance services to mitigate financial uncertainty and make accidental loss manageable. It highlights business worth, employees, countries, customers, partners, financial highlights, mission and vision, Showcasing this set of slides titled Insurance Policy Company Profile Overview Ppt Clipart PDF. The topics addressed in these templates are Countries, Consumers, Employees, Enterprise, Our Vision, Our Mission. All the content presented in this PPT design is completely editable. Download it and make adjustments in color, background, font etc. as per your unique business setting.
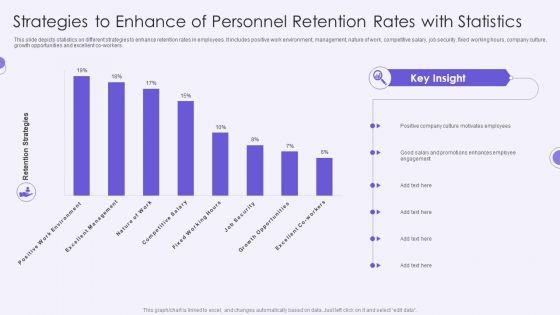
Strategies To Enhance Of Personnel Retention Rates With Statistics Summary PDF
This slide depicts statistics on different strategies to enhance retention rates in employees. It includes positive work environment, management, nature of work, competitive salary, job security, fixed working hours, company culture, growth opportunities and excellent co-workers.Pitch your topic with ease and precision using this Strategies To Enhance Of Personnel Retention Rates With Statistics Summary PDF. This layout presents information on Positive Company, Culture Motivates, Employees Promotions . It is also available for immediate download and adjustment. So, changes can be made in the color, design, graphics or any other component to create a unique layout.
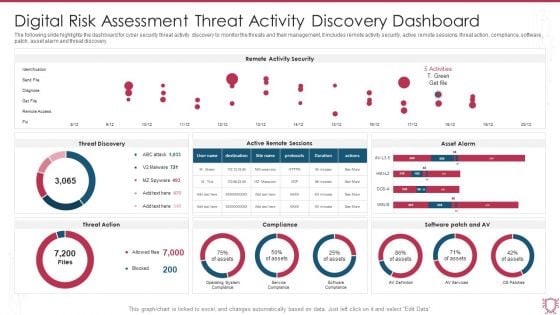
Digital Risk Assessment Threat Activity Discovery Dashboard Ppt Ideas Skills PDF
The following slide highlights the dashboard for cyber security threat activity discovery to monitor the threats and their management, it includes remote activity security, active remote sessions, threat action, compliance, software patch, asset alarm and threat discovery. Pitch your topic with ease and precision using this Digital Risk Assessment Threat Activity Discovery Dashboard Ppt Ideas Skills PDF. This layout presents information on Remote Activity Security, Threat Discovery, Asset Alarm. It is also available for immediate download and adjustment. So, changes can be made in the color, design, graphics or any other component to create a unique layout.

Healthcare Big Data Assessment Dashboard Slide2 Introduction PDF
This slide covers the records about the patients used to describe massive volumes of information created by the adoption of digital technologies that collect patients records and help in managing hospital performance. Showcasing this set of slides titled Healthcare Big Data Assessment Dashboard Slide2 Introduction PDF. The topics addressed in these templates are Forecasted Patient Turnover, Service Indicators, Occupancy. All the content presented in this PPT design is completely editable. Download it and make adjustments in color, background, font etc. as per your unique business setting.
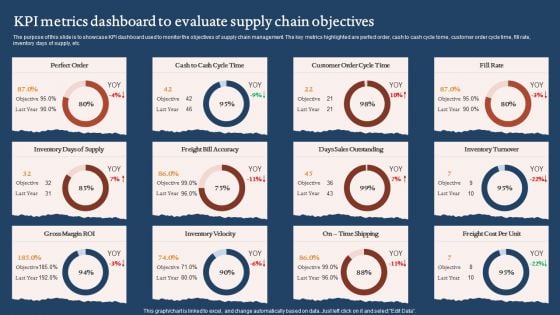
KPI Metrics Dashboard To Evaluate Supply Chain Objectives Graphics PDF
The purpose of this slide is to showcase KPI dashboard used to monitor the objectives of supply chain management. The key metrics highlighted are perfect order, cash to cash cycle tome, customer order cycle time, fill rate, inventory days of supply, etc. Pitch your topic with ease and precision using this KPI Metrics Dashboard To Evaluate Supply Chain Objectives Graphics PDF. This layout presents information on Days Sales Outstanding, Inventory Velocity, Gross Margin Roi. It is also available for immediate download and adjustment. So, changes can be made in the color, design, graphics or any other component to create a unique layout.
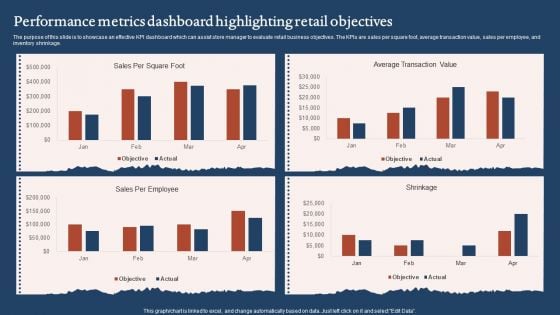
Performance Metrics Dashboard Highlighting Retail Objectives Sample PDF
The purpose of this slide is to showcase an effective KPI dashboard which can assist store manager to evaluate retail business objectives. The KPIs are sales per square foot, average transaction value, sales per employee, and inventory shrinkage. Pitch your topic with ease and precision using this Performance Metrics Dashboard Highlighting Retail Objectives Sample PDF. This layout presents information on Average Transaction Value, Sales Per Employee. It is also available for immediate download and adjustment. So, changes can be made in the color, design, graphics or any other component to create a unique layout.
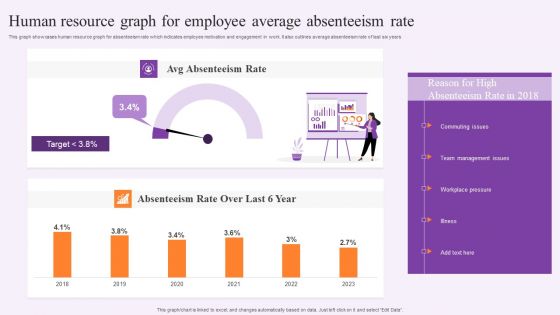
Human Resource Graph For Employee Average Absenteeism Rate Information PDF
This graph showcases human resource graph for absenteeism rate which indicates employee motivation and engagement in work. It also outlines average absenteeism rate of last six years. Showcasing this set of slides titled Human Resource Graph For Employee Average Absenteeism Rate Information PDF. The topics addressed in these templates are Team Management Issues, Workplace Pressure, Absenteeism Rate. All the content presented in this PPT design is completely editable. Download it and make adjustments in color, background, font etc. as per your unique business setting.
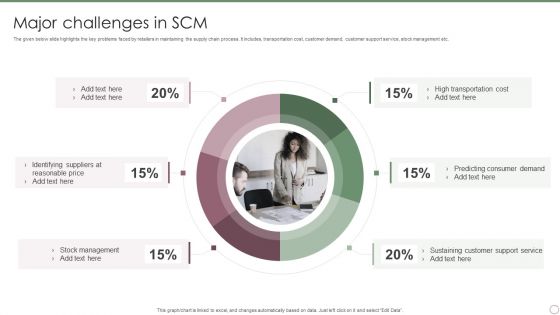
Major Challenges In SCM Ppt PowerPoint Presentation Gallery Pictures PDF
The given below slide highlights the key problems faced by retailers in maintaining the supply chain process. It includes, transportation cost, customer demand, customer support service, stock management etc. Pitch your topic with ease and precision using this Major Challenges In SCM Ppt PowerPoint Presentation Gallery Pictures PDF. This layout presents information on High Transportation Cost, Predicting Consumer Demand, Sustaining Customer, Support Service. It is also available for immediate download and adjustment. So, changes can be made in the color, design, graphics or any other component to create a unique layout.
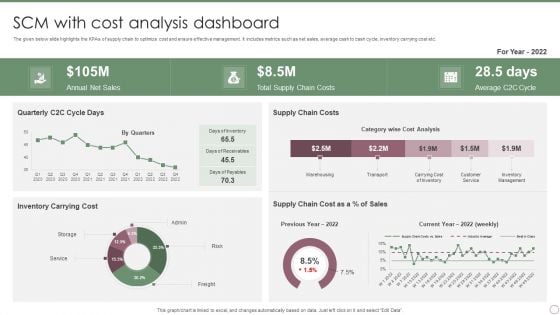
SCM With Cost Analysis Dashboard Ppt PowerPoint Presentation File Slides PDF
The given below slide highlights the KPAs of supply chain to optimize cost and ensure effective management. It includes metrics such as net sales, average cash to cash cycle, inventory carrying cost etc. Showcasing this set of slides titled SCM With Cost Analysis Dashboard Ppt PowerPoint Presentation File Slides PDF. The topics addressed in these templates are Annual Net Sales, Total Supply Chain, Costs, Average C2C Cycle. All the content presented in this PPT design is completely editable. Download it and make adjustments in color, background, font etc. as per your unique business setting.
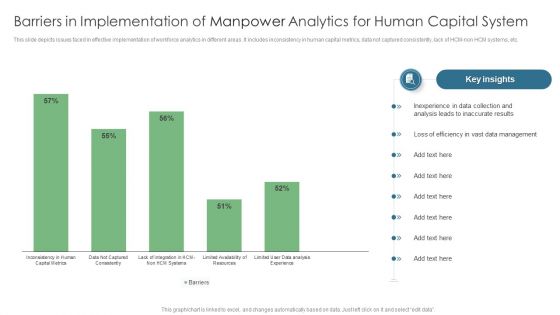
Barriers In Implementation Of Manpower Analytics For Human Capital System Ideas PDF
This slide depicts issues faced in effective implementation of workforce analytics in different areas. It includes inconsistency in human capital metrics, data not captured consistently, lack of HCM-non HCM systems, etc. Showcasing this set of slides titled Barriers In Implementation Of Manpower Analytics For Human Capital System Ideas PDF. The topics addressed in these templates are Data Collection, Analysis Leads, Data Management. All the content presented in this PPT design is completely editable. Download it and make adjustments in color, background, font etc. as per your unique business setting.
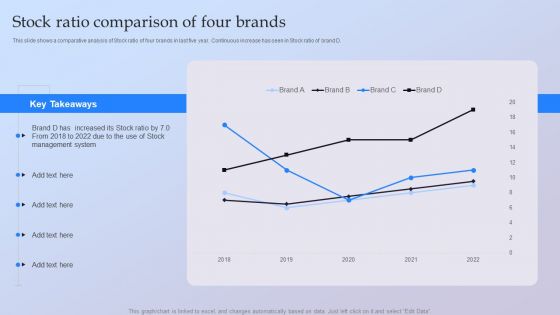
Stock Ratio Comparison Of Four Brands Ppt Model Layout Ideas PDF
This slide shows a comparative analysis of Stock ratio of four brands in last five year. Continuous increase has seen in Stock ratio of brand D. Showcasing this set of slides titled Stock Ratio Comparison Of Four Brands Ppt Model Layout Ideas PDF. The topics addressed in these templates are 2018 To 2022, Stock Ratio, Stock Management System. All the content presented in this PPT design is completely editable. Download it and make adjustments in color, background, font etc. as per your unique business setting.

Departmental Operations Training Department Program Status Dashboard Mockup PDF
This slide covers employees training status dashboard for HR manager. It includes KPIs such as training cost, cost per participant, training type, number of participants, training hours, occupancy rates, etc. Showcasing this set of slides titled Departmental Operations Training Department Program Status Dashboard Mockup PDF. The topics addressed in these templates are Number Of Participants, Hours Of Training, Total Completed Training. All the content presented in this PPT design is completely editable. Download it and make adjustments in color, background, font etc. as per your unique business setting.
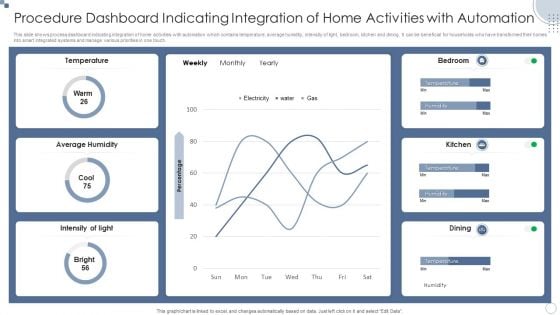
Procedure Dashboard Indicating Integration Of Home Activities With Automation Ppt PowerPoint Presentation File Files PDF
This slide shows process dashboard indicating integration of home activities with automation which contains temperature, average humidity, intensity of light, bedroom, kitchen and dining. It can be beneficial for households who have transformed their homes into smart integrated systems and manage various priorities in one touch.Showcasing this set of slides titled Procedure Dashboard Indicating Integration Of Home Activities With Automation Ppt PowerPoint Presentation File Files PDF. The topics addressed in these templates are Average Humidity, Temperature, Intensity Light. All the content presented in this PPT design is completely editable. Download it and make adjustments in color, background, font etc. as per your unique business setting.
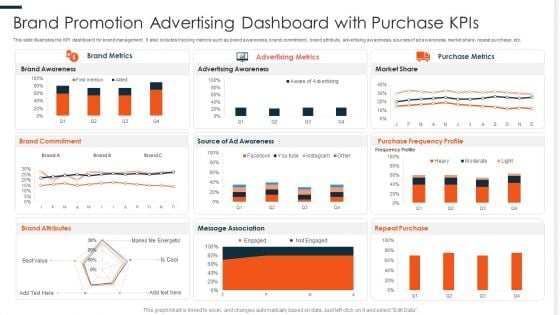
Brand Promotion Advertising Dashboard With Purchase Kpis Ppt PowerPoint Presentation File Format PDF
This slide illustrates the KPI dashboard for brand management. It also includes tracking metrics such as brand awareness, brand commitment, brand attribute, advertising awareness, sources of ad awareness, market share, repeat purchase, etc. Showcasing this set of slides titled Brand Promotion Advertising Dashboard With Purchase Kpis Ppt PowerPoint Presentation File Format PDF. The topics addressed in these templates are Brand Awareness, Advertising Awareness, Purchase Frequency. All the content presented in this PPT design is completely editable. Download it and make adjustments in color, background, font etc. as per your unique business setting.
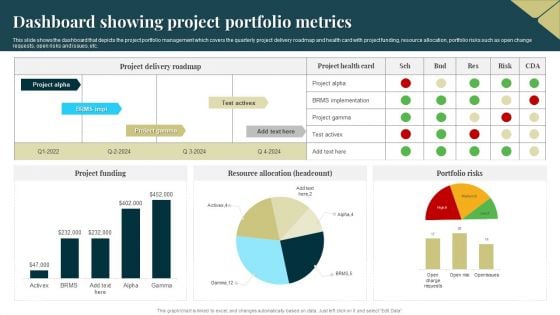
Dashboard Showing Project Portfolio Metrics Microsoft PDF
This slide shows the dashboard that depicts the project portfolio management which covers the quarterly project delivery roadmap and health card with project funding, resource allocation, portfolio risks such as open change requests, open risks and issues, etc. Pitch your topic with ease and precision using this Dashboard Showing Project Portfolio Metrics Microsoft PDF. This layout presents information on Resource Allocation, Portfolio Risks, Project Funding. It is also available for immediate download and adjustment. So, changes can be made in the color, design, graphics or any other component to create a unique layout.
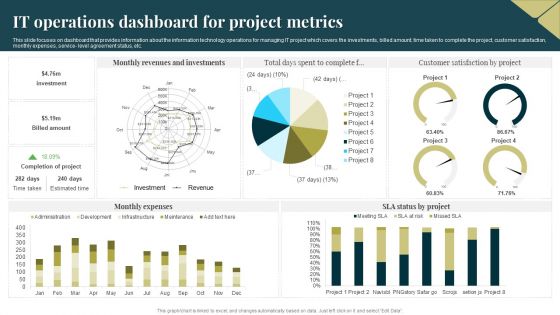
IT Operations Dashboard For Project Metrics Portrait PDF
This slide focuses on dashboard that provides information about the information technology operations for managing IT project which covers the investments, billed amount, time taken to complete the project, customer satisfaction, monthly expenses, service level agreement status, etc. Pitch your topic with ease and precision using this IT Operations Dashboard For Project Metrics Portrait PDF. This layout presents information on Revenues, Investments, Monthly Expenses. It is also available for immediate download and adjustment. So, changes can be made in the color, design, graphics or any other component to create a unique layout.
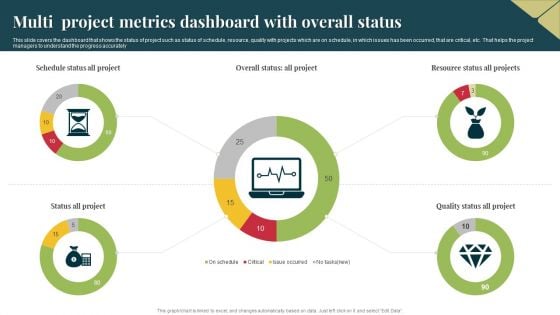
Multi Project Metrics Dashboard With Overall Status Pictures PDF
This slide covers the dashboard that shows the status of project such as status of schedule, resource, quality with projects which are on schedule, in which issues has been occurred, that are critical, etc. That helps the project managers to understand the progress accurately. Pitch your topic with ease and precision using this Multi Project Metrics Dashboard With Overall Status Pictures PDF. This layout presents information on Multi Project, Metrics Dashboard. It is also available for immediate download and adjustment. So, changes can be made in the color, design, graphics or any other component to create a unique layout.
Project Metrics Dashboard Depicting Tracking System Inspiration PDF
This slide focuses on project management dashboard which covers the four spirit teams, iteration defects by priority with quarterly roadmap with legends such as high attention, low, none, normal and resolved immediately with time in iteration, etc. Pitch your topic with ease and precision using this Project Metrics Dashboard Depicting Tracking System Inspiration PDF. This layout presents information on Project Metrics, Dashboard Depicting, Tracking System. It is also available for immediate download and adjustment. So, changes can be made in the color, design, graphics or any other component to create a unique layout.
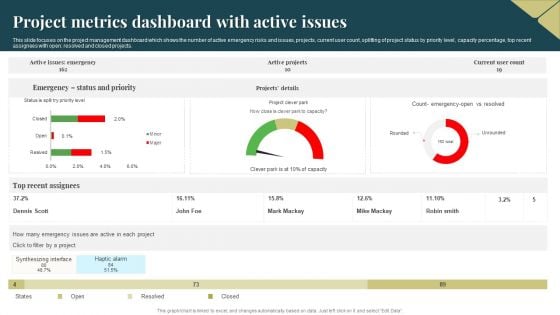
Project Metrics Dashboard With Active Issues Topics PDF
This slide focuses on the project management dashboard which shows the number of active emergency risks and issues, projects, current user count, splitting of project status by priority level, capacity percentage, top recent assignees with open, resolved and closed projects. Pitch your topic with ease and precision using this Project Metrics Dashboard With Active Issues Topics PDF. This layout presents information on Project Metrics, Dashboard With Active Issues. It is also available for immediate download and adjustment. So, changes can be made in the color, design, graphics or any other component to create a unique layout.
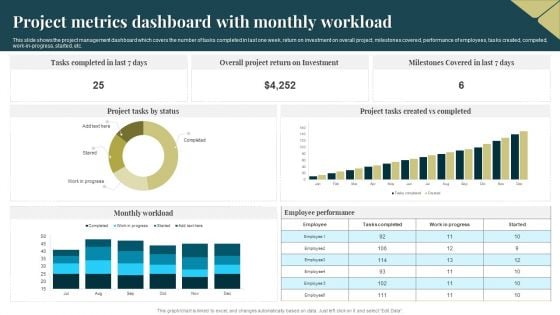
Project Metrics Dashboard With Monthly Workload Topics PDF
This slide shows the project management dashboard which covers the number of tasks completed in last one week, return on investment on overall project, milestones covered, performance of employees, tasks created, competed, work in progress, started, etc. Pitch your topic with ease and precision using this Project Metrics Dashboard With Monthly Workload Topics PDF. This layout presents information on Investment, Employee Performance, Project Metrics Dashboard. It is also available for immediate download and adjustment. So, changes can be made in the color, design, graphics or any other component to create a unique layout.
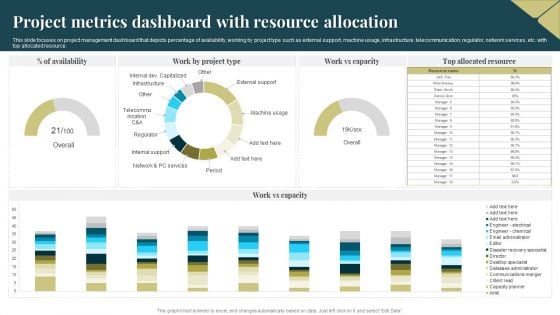
Project Metrics Dashboard With Resource Allocation Portrait PDF
This slide focuses on project management dashboard that depicts percentage of availability, working by project type such as external support, machine usage, infrastructure, telecommunication, regulator, network services, etc. with top allocated resource. Pitch your topic with ease and precision using this Project Metrics Dashboard With Resource Allocation Portrait PDF. This layout presents information on Project Metrics Dashboard, Resource Allocation. It is also available for immediate download and adjustment. So, changes can be made in the color, design, graphics or any other component to create a unique layout.
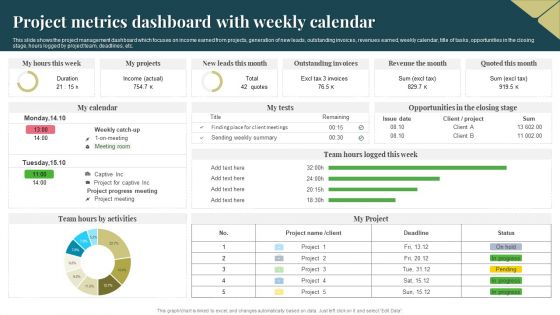
Project Metrics Dashboard With Weekly Calendar Download PDF
This slide shows the project management dashboard which focuses on income earned from projects, generation of new leads, outstanding invoices, revenues earned, weekly calendar, title of tasks, opportunities in the closing stage, hours logged by project team, deadlines, etc. Pitch your topic with ease and precision using this Project Metrics Dashboard With Weekly Calendar Download PDF. This layout presents information on Income, Revenue, Project. It is also available for immediate download and adjustment. So, changes can be made in the color, design, graphics or any other component to create a unique layout.
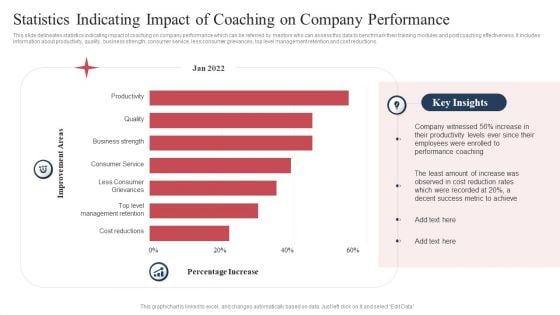
Statistics Indicating Impact Of Coaching On Company Performance Formats PDF
This slide delineates statistics indicating impact of coaching on company performance which can be referred by mentors who can assess this data to benchmark their training modules and post coaching effectiveness. It includes information about productivity, quality, business strength, consumer service, less consumer grievances, top level management retention and cost reductions. Pitch your topic with ease and precision using this Statistics Indicating Impact Of Coaching On Company Performance Formats PDF. This layout presents information on Productivity, Quality, Business Strength. It is also available for immediate download and adjustment. So, changes can be made in the color, design, graphics or any other component to create a unique layout.
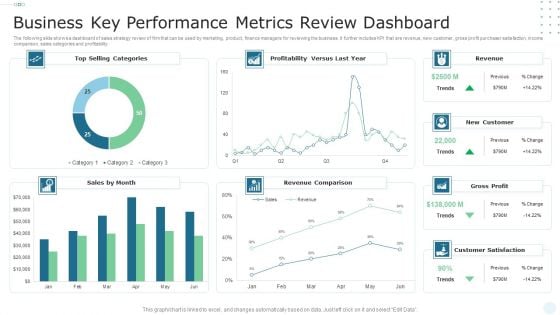
Business Key Performance Metrics Review Dashboard Portrait PDF
The following slide shows a dashboard of sales strategy review of firm that can be used by marketing, product, finance managers for reviewing the business. It further includes KPI that are revenue, new customer, gross profit purchaser satisfaction, income comparison, sales categories and profitability. Showcasing this set of slides titled Business Key Performance Metrics Review Dashboard Portrait PDF. The topics addressed in these templates are Sales, Revenue Comparison, Profitability. All the content presented in this PPT design is completely editable. Download it and make adjustments in color, background, font etc. as per your unique business setting.
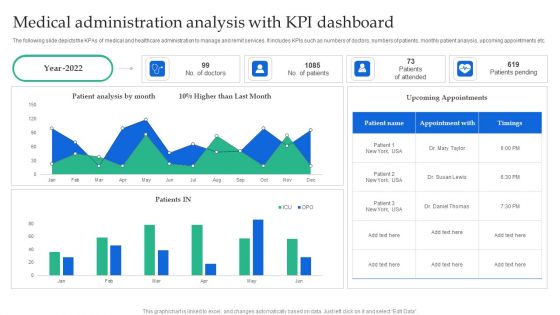
Medical Administration Analysis With KPI Dashboard Clipart PDF
The following slide depicts the KPAs of medical and healthcare administration to manage and remit services. It includes KPIs such as numbers of doctors, numbers of patients, monthly patient analysis, upcoming appointments etc. Showcasing this set of slides titled Medical Administration Analysis With KPI Dashboard Clipart PDF. The topics addressed in these templates are Patient Analysis, Higher Than, Upcoming Appointments. All the content presented in this PPT design is completely editable. Download it and make adjustments in color, background, font etc. as per your unique business setting.
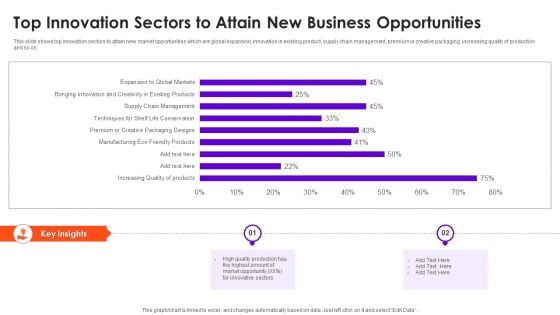
Top Innovation Sectors To Attain New Business Opportunities Information PDF
This slide shows top innovation sectors to attain new market opportunities which are global expansion, innovation in existing product, supply chain management, premium or creative packaging, increasing quality of production and so on. Showcasing this set of slides titled Top Innovation Sectors To Attain New Business Opportunities Information PDF. The topics addressed in these templates are Market Opportunity, Quality Production, Innovative Sectors. All the content presented in this PPT design is completely editable. Download it and make adjustments in color, background, font etc. as per your unique business setting.
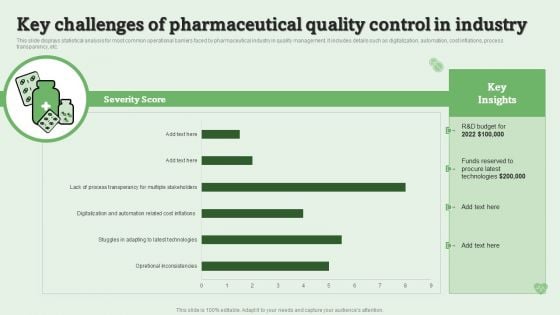
Key Challenges Of Pharmaceutical Quality Control In Industry Ppt PowerPoint Presentation Slides Examples PDF
This slide displays statistical analysis for most common operational barriers faced by pharmaceutical industry in quality management. It includes details such as digitalization, automation, cost inflations, process transparency, etc. Pitch your topic with ease and precision using this Key Challenges Of Pharmaceutical Quality Control In Industry Ppt PowerPoint Presentation Slides Examples PDF. This layout presents information on Opretional Inconsistencies, Latest Technologies, Automation Related. It is also available for immediate download and adjustment. So, changes can be made in the color, design, graphics or any other component to create a unique layout.
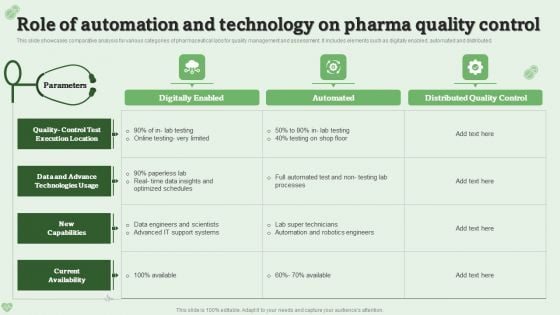
Role Of Automation And Technology On Pharma Quality Control Ppt PowerPoint Presentation Gallery Backgrounds PDF
This slide showcases comparative analysis for various categories of pharmaceutical labs for quality management and assessment. It includes elements such as digitally enabled, automated and distributed. Showcasing this set of slides titled Role Of Automation And Technology On Pharma Quality Control Ppt PowerPoint Presentation Gallery Backgrounds PDF. The topics addressed in these templates are Data Engineers, Current Availability, Quality Control. All the content presented in this PPT design is completely editable. Download it and make adjustments in color, background, font etc. as per your unique business setting.
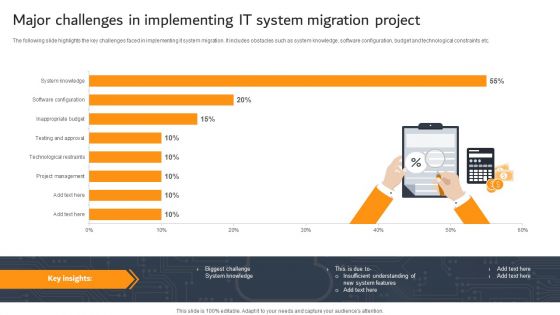
Major Challenges In Implementing IT System Migration Project Ppt PowerPoint Presentation Outline Graphics PDF
The following slide highlights the key challenges faced in implementing it system migration. It includes obstacles such as system knowledge, software configuration, budget and technological constraints etc.Pitch your topic with ease and precision using this Major Challenges In Implementing IT System Migration Project Ppt PowerPoint Presentation Outline Graphics PDF. This layout presents information on Insufficient Understanding, System Features, Project Management. It is also available for immediate download and adjustment. So, changes can be made in the color, design, graphics or any other component to create a unique layout.
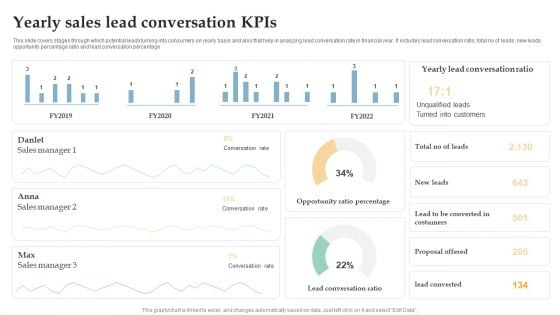
Yearly Sales Lead Conversation Kpis Ppt Inspiration Brochure PDF
This slide covers stages through which potential leads turning into consumers on yearly basis and also that help in analyzing lead conversation rate in financial year. It includes lead conversation ratio, total no of leads, new leads opportunity percentage ratio and lead conversation percentage. Pitch your topic with ease and precision using this Yearly Sales Lead Conversation Kpis Ppt Inspiration Brochure PDF. This layout presents information on Sales Manager, Conversation Rate, Opportunity Ratio Percentage. It is also available for immediate download and adjustment. So, changes can be made in the color, design, graphics or any other component to create a unique layout.
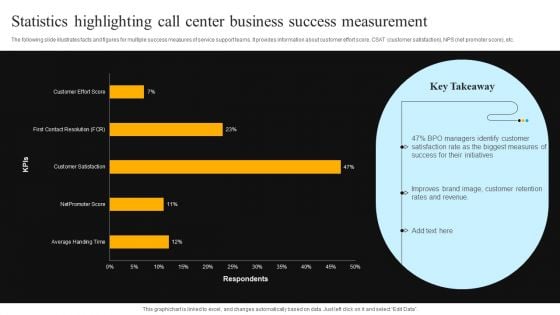
Statistics Highlighting Call Center Business Success Measurement Introduction PDF
The following slide illustrates facts and figures for multiple success measures of service support teams. It provides information about customer effort score, CSAT customer satisfaction, NPS net promoter score, etc. Showcasing this set of slides titled Statistics Highlighting Call Center Business Success Measurement Introduction PDF. The topics addressed in these templates are BPO Managers, Customer Satisfaction Rate, Biggest Measure. All the content presented in this PPT design is completely editable. Download it and make adjustments in color, background, font etc. as per your unique business setting.
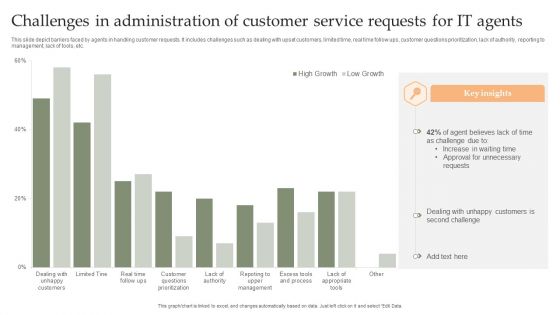
Challenges In Administration Of Customer Service Requests For IT Agents Mockup PDF
This slide depict barriers faced by agents in handling customer requests. It includes challenges such as dealing with upset customers, limited time, real time follow ups, customer questions prioritization, lack of authority, reporting to management, lack of tools, etc. Pitch your topic with ease and precision using this Challenges In Administration Of Customer Service Requests For IT Agents Mockup PDF. This layout presents information on Increase Waiting Time, Approval For Unnecessary, Dealing Unhappy Customers. It is also available for immediate download and adjustment. So, changes can be made in the color, design, graphics or any other component to create a unique layout.
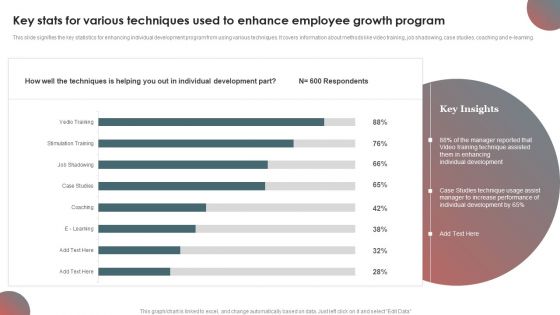
Key Stats For Various Techniques Used To Enhance Employee Growth Program Information PDF
This slide signifies the key statistics for enhancing individual development program from using various techniques. It covers information about methods like video training, job shadowing, case studies, coaching and e-learning.Pitch your topic with ease and precision using this Key Stats For Various Techniques Used To Enhance Employee Growth Program Information PDF. This layout presents information on Manager Reported, Technique Assisted, Them Enhancing. It is also available for immediate download and adjustment. So, changes can be made in the color, design, graphics or any other component to create a unique layout.
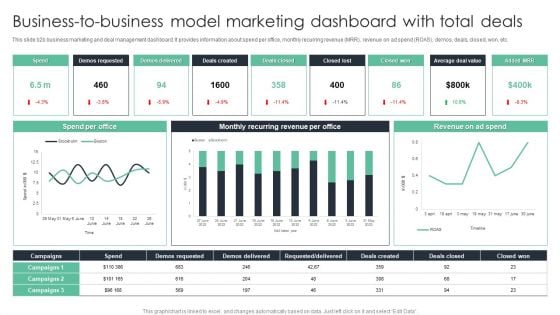
Business To Business Model Marketing Dashboard With Total Deals Ppt Professional Inspiration PDF
This slide b2b business marketing and deal management dashboard. It provides information about spend per office, monthly recurring revenue MRR, revenue on ad spend ROAS, demos, deals, closed, won, etc. Showcasing this set of slides titled Business To Business Model Marketing Dashboard With Total Deals Ppt Professional Inspiration PDF. The topics addressed in these templates are Demos Requested, Demos Delivered, Deals Created. All the content presented in this PPT design is completely editable. Download it and make adjustments in color, background, font etc. as per your unique business setting.
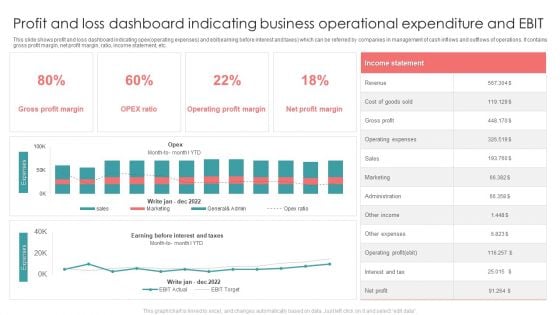
Profit And Loss Dashboard Indicating Business Operational Expenditure And EBIT Formats PDF
This slide shows profit and loss dashboard indicating opex operating expenses and ebit earning before interest and taxes which can be referred by companies in management of cash inflows and outflows of operations. It contains gross profit margin, net profit margin, ratio, income statement, etc. Showcasing this set of slides titled Profit And Loss Dashboard Indicating Business Operational Expenditure And EBIT Formats PDF. The topics addressed in these templates are Revenue, Gross Profit, Sales. All the content presented in this PPT design is completely editable. Download it and make adjustments in color, background, font etc. as per your unique business setting.
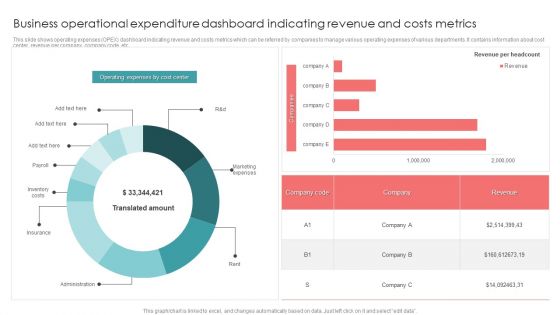
Business Operational Expenditure Dashboard Indicating Revenue And Costs Metrics Pictures PDF
This slide shows operating expenses OPEX dashboard indicating revenue and costs metrics which can be referred by companies to manage various operating expenses of various departments. It contains information about cost center, revenue per company, company code, etc. Pitch your topic with ease and precision using this Business Operational Expenditure Dashboard Indicating Revenue And Costs Metrics Pictures PDF. This layout presents information on Business Operational, Costs Metrics, Revenue. It is also available for immediate download and adjustment. So, changes can be made in the color, design, graphics or any other component to create a unique layout.
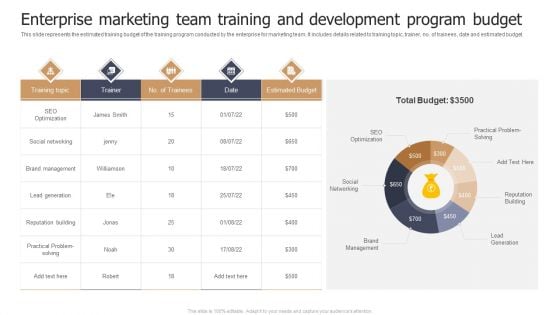
Enterprise Marketing Team Training And Development Program Budget Infographics PDF
This slide represents the estimated training budget of the training program conducted by the enterprise for marketing team. It includes details related to training topic, trainer, no. of trainees, date and estimated budget. Pitch your topic with ease and precision using this Enterprise Marketing Team Training And Development Program Budget Infographics PDF. This layout presents information on SEO Optimization, Social Networking, Brand Management. It is also available for immediate download and adjustment. So, changes can be made in the color, design, graphics or any other component to create a unique layout.
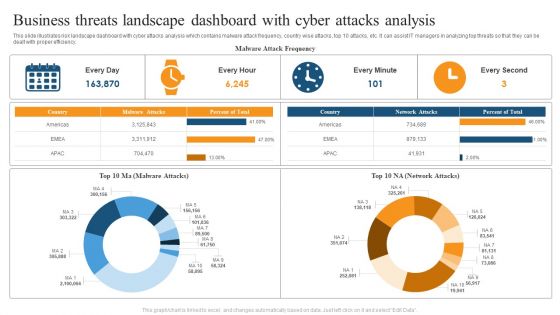
Business Threats Landscape Dashboard With Cyber Attacks Analysis Ppt Summary Brochure PDF
This slide illustrates risk landscape dashboard with cyber attacks analysis which contains malware attack frequency, country wise attacks, top 10 attacks, etc. It can assist IT managers in analyzing top threats so that they can be dealt with proper efficiency. Pitch your topic with ease and precision using this Business Threats Landscape Dashboard With Cyber Attacks Analysis Ppt Summary Brochure PDF. This layout presents information on Malware Attack Frequency, Every Minute, Every Second. It is also available for immediate download and adjustment. So, changes can be made in the color, design, graphics or any other component to create a unique layout.
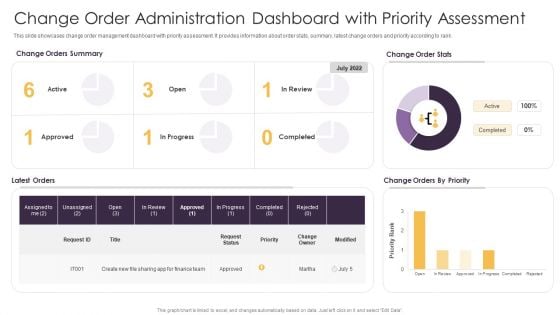
Change Order Administration Dashboard With Priority Assessment Ppt Portfolio Inspiration PDF
This slide showcases change order management dashboard with priority assessment. It provides information about order stats, summary, latest change orders and priority according to rank. Pitch your topic with ease and precision using this Change Order Administration Dashboard With Priority Assessment Ppt Portfolio Inspiration PDF. This layout presents information on Change Orders Priority, Change Order Stats, Change Orders Summary. It is also available for immediate download and adjustment. So, changes can be made in the color, design, graphics or any other component to create a unique layout.
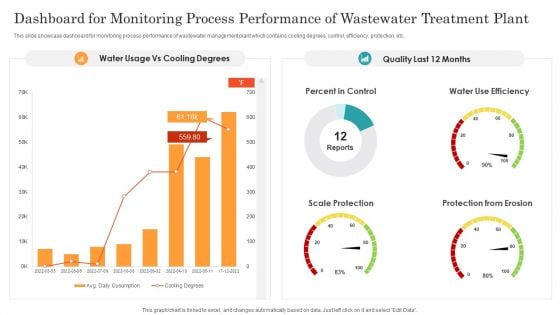
Dashboard For Monitoring Process Performance Of Wastewater Treatment Plant Ppt Infographic Template Demonstration PDF
This slide showcase dashboard for monitoring process performance of wastewater management plant which contains cooling degrees, control, efficiency, protection, etc. Showcasing this set of slides titled Dashboard For Monitoring Process Performance Of Wastewater Treatment Plant Ppt Infographic Template Demonstration PDF. The topics addressed in these templates are Percent Control, Water Use Efficiency, Scale Protection, Protection From Erosion. All the content presented in this PPT design is completely editable. Download it and make adjustments in color, background, font etc. as per your unique business setting.
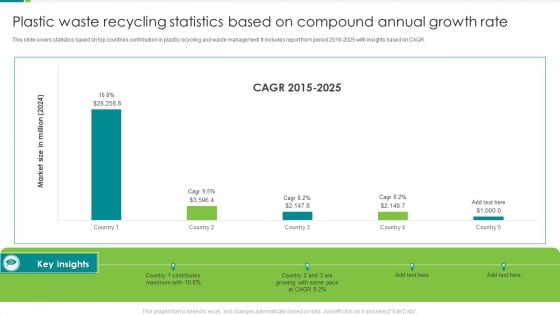
Plastic Waste Recycling Statistics Based On Compound Annual Growth Rate Inspiration PDF
This slide covers statistics based on top countries contribution in plastic recycling and waste management. It includes report from period 2019-2025 with insights based on CAGR. Pitch your topic with ease and precision using this Plastic Waste Recycling Statistics Based On Compound Annual Growth Rate Inspiration PDF. This layout presents information on Contributes Maximum, 2015 To 2025. It is also available for immediate download and adjustment. So, changes can be made in the color, design, graphics or any other component to create a unique layout.
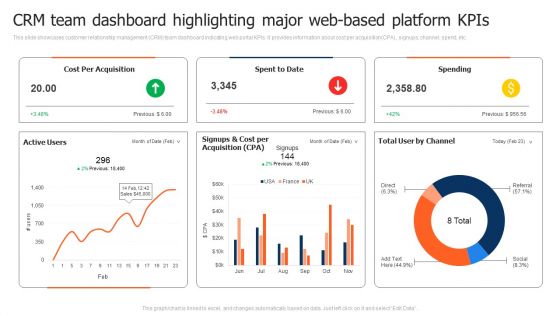
CRM Team Dashboard Highlighting Major Web Based Platform Kpis Template PDF
This slide showcases customer relationship management CRM team dashboard indicating web portal KPIs. It provides information about cost per acquisition CPA, signups, channel, spend, etc. Pitch your topic with ease and precision using this CRM Team Dashboard Highlighting Major Web Based Platform Kpis Template PDF. This layout presents information on CRM Team Dashboard Highlighting, Web Based Platform Kpis. It is also available for immediate download and adjustment. So, changes can be made in the color, design, graphics or any other component to create a unique layout.
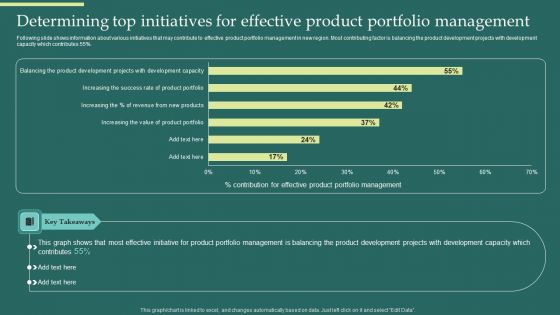
Product Portfolios And Strategic Determining Top Initiatives For Effective Product Formats PDF
Following slide shows information about various initiatives that may contribute to effective product portfolio management in new region. Most contributing factor is balancing the product development projects with development capacity which contributes 55 percent. If your project calls for a presentation, then Slidegeeks is your go-to partner because we have professionally designed, easy-to-edit templates that are perfect for any presentation. After downloading, you can easily edit Product Portfolios And Strategic Determining Top Initiatives For Effective Product Formats PDF and make the changes accordingly. You can rearrange slides or fill them with different images. Check out all the handy templates.
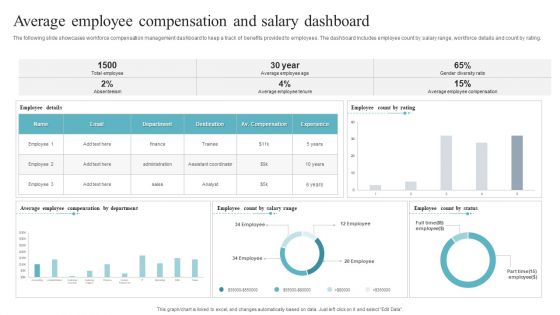
Average Employee Compensation And Salary Dashboard Download PDF
The following slide showcases workforce compensation management dashboard to keep a track of benefits provided to employees. The dashboard includes employee count by salary range, workforce details and count by rating. Showcasing this set of slides titled Average Employee Compensation And Salary Dashboard Download PDF. The topics addressed in these templates are Average Employee Compensation, Salary Dashboard. All the content presented in this PPT design is completely editable. Download it and make adjustments in color, background, font etc. as per your unique business setting.
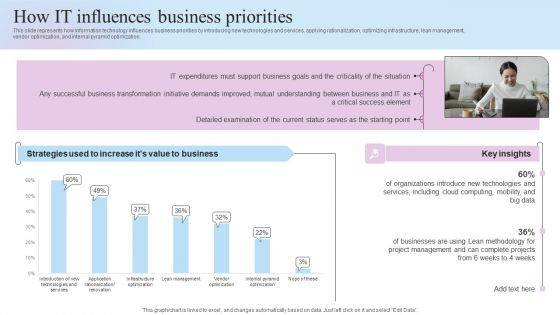
IT Business Alignment Framework How IT Influences Business Priorities Information PDF
This slide represents how information technology influences business priorities by introducing new technologies and services, applying rationalization, optimizing infrastructure, lean management, vendor optimization, and internal pyramid optimization.Find a pre-designed and impeccable IT Business Alignment Framework How IT Influences Business Priorities Information PDF. The templates can ace your presentation without additional effort. You can download these easy-to-edit presentation templates to make your presentation stand out from others. So, what are you waiting for Download the template from Slidegeeks today and give a unique touch to your presentation.
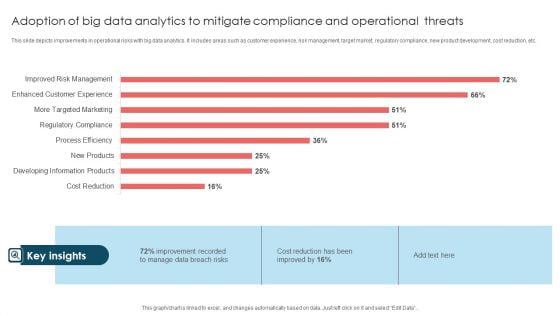
Adoption Of Big Data Analytics To Mitigate Compliance And Operational Threats Formats PDF
This slide depicts improvements in operational risks with big data analytics. It includes areas such as customer experience, risk management, target market, regulatory compliance, new product development, cost reduction, etc. Showcasing this set of slides titled Adoption Of Big Data Analytics To Mitigate Compliance And Operational Threats Formats PDF. The topics addressed in these templates are Improvement Recorded, Data Breach Risks, Cost Reduction. All the content presented in this PPT design is completely editable. Download it and make adjustments in color, background, font etc. as per your unique business setting.
Sales L2RM System Tracking Key Metrics Dashboard Ppt Professional Format Ideas PDF
This slide represents the dashboard for tracking the key performance indicators of sales lead to revenue management. It includes key metrics such as leads by campaign, ratings, lead generation rate, top accounts by revenue and top owners by number of accounts. Showcasing this set of slides titled Sales L2RM System Tracking Key Metrics Dashboard Ppt Professional Format Ideas PDF. The topics addressed in these templates are Leads By Campaign, Leads By Rating, Leads Generation Rate. All the content presented in this PPT design is completely editable. Download it and make adjustments in color, background, font etc. as per your unique business setting.
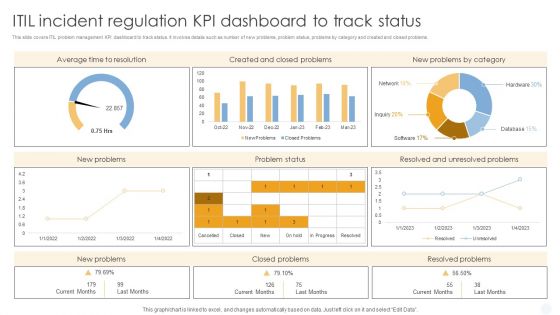
ITIL Incident Regulation Kpi Dashboard To Track Status Mockup PDF
This slide covers ITIL problem management KPI dashboard to track status. It involves details such as number of new problems, problem status, problems by category and created and closed problems.Showcasing this set of slides titled ITIL Incident Regulation Kpi Dashboard To Track Status Mockup PDF. The topics addressed in these templates are Average Time Resolution, Created Problems, Problems Category. All the content presented in this PPT design is completely editable. Download it and make adjustments in color, background, font etc. as per your unique business setting.
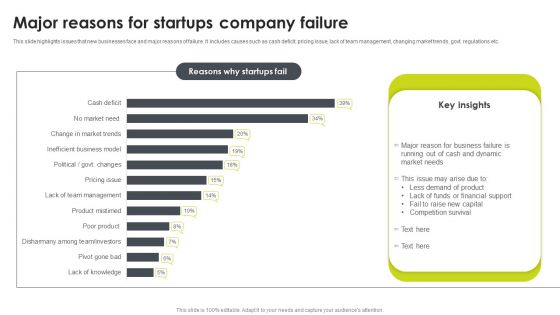
Major Reasons For Startups Company Failure Portrait PDF
This slide highlights issues that new businesses face and major reasons of failure. It includes causes such as cash deficit, pricing issue, lack of team management, changing market trends, govt. regulations etc. Showcasing this set of slides titled Major Reasons For Startups Company Failure Portrait PDF. The topics addressed in these templates are Market, Dynamic, Business Failure. All the content presented in this PPT design is completely editable. Download it and make adjustments in color, background, font etc. as per your unique business setting.
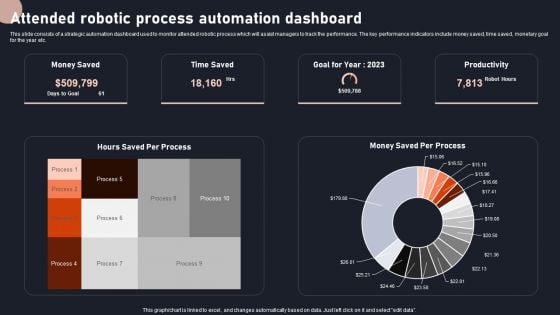
Robotic Process Automation Metrics Dashboard For Tracking Business Return On Investment Information PDF
This slide illustrates KPI Dashboard for measuring time and money saved after RPA deployment. It also include metrics for analysis such as productivity in robot hours, hours saved per process, money saved per process, etc. Pitch your topic with ease and precision using this Robotic Process Automation Metrics Dashboard For Tracking Business Return On Investment Information PDF. This layout presents information on Management, Goal, Productivity. It is also available for immediate download and adjustment. So, changes can be made in the color, design, graphics or any other component to create a unique layout.
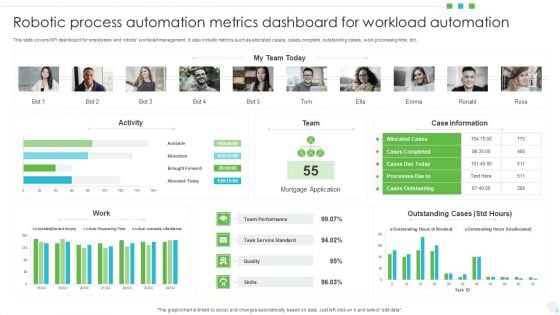
Robotic Process Automation Metrics Dashboard For Workload Automation Mockup PDF
This slide covers KPI dashboard for employees and robots workload management. It also include metrics such as allocated cases, cases complete, outstanding cases, work processing time, etc. Pitch your topic with ease and precision using this Robotic Process Automation Metrics Dashboard For Workload Automation Mockup PDF. This layout presents information on Mortgage Application, Team Performance, Case Information. It is also available for immediate download and adjustment. So, changes can be made in the color, design, graphics or any other component to create a unique layout.
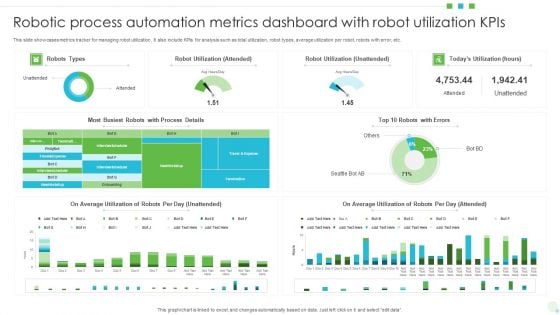
Robotic Process Automation Metrics Dashboard With Robot Utilization Kpis Background PDF
This slide showcases metrics tracker for managing robot utilization. It also include KPIs for analysis such as total utilization, robot types, average utilization per robot, robots with error, etc. Pitch your topic with ease and precision using this Robotic Process Automation Metrics Dashboard With Robot Utilization Kpis Background PDF. This layout presents information on Average Utilization, Robot Utilization, Automation Metrics Dashboard. It is also available for immediate download and adjustment. So, changes can be made in the color, design, graphics or any other component to create a unique layout.
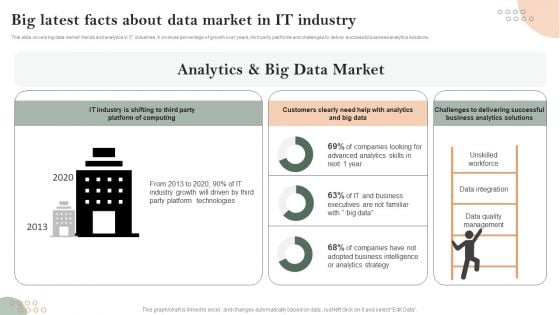
Big Latest Facts About Data Market In IT Industry Pictures PDF
This slide covers big data market trends and analytics in IT industries. It involves percentage of growth over years, third party platforms and challenges to deliver successful business analytics solutions. Showcasing this set of slides titled Big Latest Facts About Data Market In IT Industry Pictures PDF. The topics addressed in these templates are Unskilled Workforce, Data Integration, Data Quality Management. All the content presented in this PPT design is completely editable. Download it and make adjustments in color, background, font etc. as per your unique business setting.
Employee Performance Analysis Tracking Scorecard Ppt Summary Influencers PDF
This slide covers overall performance score of employee appraised by reporting manager. It includes scores based on metrics such as departmental performance, downtime, efficiency, setup, utilization, quality failures as per goals, actual output etc. Showcasing this set of slides titled Employee Performance Analysis Tracking Scorecard Ppt Summary Influencers PDF. The topics addressed in these templates are Employee Performance Card, Actual Performance, Goal. All the content presented in this PPT design is completely editable. Download it and make adjustments in color, background, font etc. as per your unique business setting.
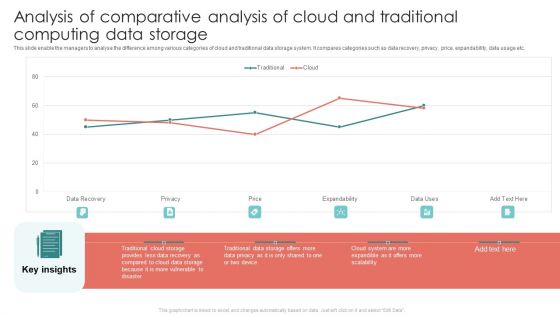
Analysis Of Comparative Analysis Of Cloud And Traditional Computing Data Storage Guidelines PDF
This slide enable the managers to analyse the difference among various categories of cloud and traditional data storage system. It compares categories such as data recovery, privacy, price, expandability, data usage etc. Showcasing this set of slides titled Analysis Of Comparative Analysis Of Cloud And Traditional Computing Data Storage Guidelines PDF. The topics addressed in these templates are Provides Less, Because Vulnerable, Expandability. All the content presented in this PPT design is completely editable. Download it and make adjustments in color, background, font etc. as per your unique business setting.
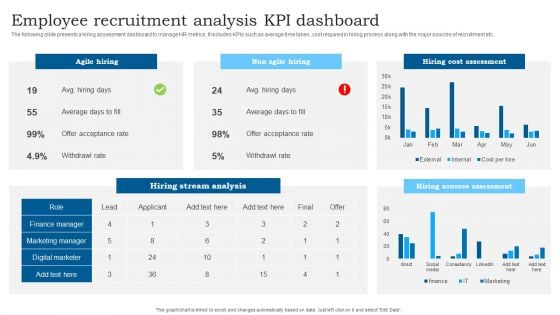
Employee Recruitment Analysis KPI Dashboard Slides PDF
The following slide presents a hiring assessment dashboard to manage HR metrics. It includes KPIs such as average time taken, cost required in hiring process along with the major sources of recruitment etc. Pitch your topic with ease and precision using this Employee Recruitment Analysis KPI Dashboard Slides PDF. This layout presents information on Agile Hiring, Non Agile Hiring, Hiring Cost Assessment. It is also available for immediate download and adjustment. So, changes can be made in the color, design, graphics or any other component to create a unique layout.

KPI Dashboard To Track Performance Of Sales To Cash Process Download PDF
This slide depicts a dashboard for business managers to keep the track of performance order to cash process for effective decision making. The key elements are orders received, cash receivables, order to cash key performance indicators, days of inventory outstanding etc. Showcasing this set of slides titled KPI Dashboard To Track Performance Of Sales To Cash Process Download PDF. The topics addressed in these templates are Orders Received, Cash Receivables, Days Inventory Outstanding. All the content presented in this PPT design is completely editable. Download it and make adjustments in color, background, font etc. as per your unique business setting.
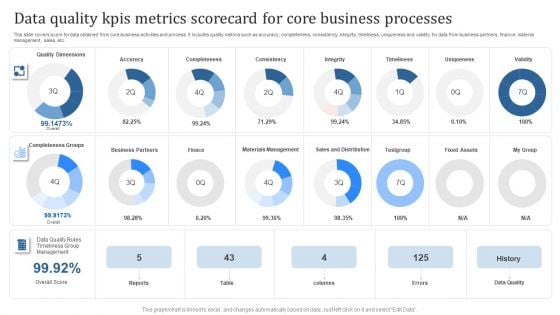
Data Quality Kpis Metrics Scorecard For Core Business Processes Topics PDF
This slide covers score for data obtained from core business activities and process. It includes quality metrics such as accuracy, completeness, consistency, integrity, timeliness, uniqueness and validity for data from business partners, finance, material management, sales, etc. Showcasing this set of slides titled Data Quality Kpis Metrics Scorecard For Core Business Processes Topics PDF. The topics addressed in these templates are Data Quality, Errors, Reports. All the content presented in this PPT design is completely editable. Download it and make adjustments in color, background, font etc. as per your unique business setting.
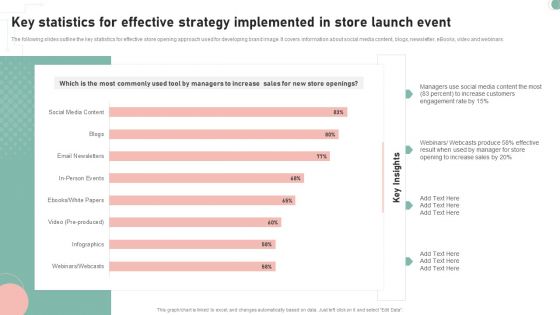
Key Statistics For Effective Strategy Implemented In Store Launch Event Background PDF
The following slides outline the key statistics for effective store opening approach used for developing brand image. It covers information about social media content, blogs, newsletter, eBooks, video and webinars. Showcasing this set of slides titled Key Statistics For Effective Strategy Implemented In Store Launch Event Background PDF. The topics addressed in these templates are Most Commonly Used Tool, Managers To Increase Sales. All the content presented in this PPT design is completely editable. Download it and make adjustments in color, background, font etc. as per your unique business setting.
Attended Robotic Process Automation Dashboard Rules PDF
This slide consists of a strategic automation dashboard used to monitor attended robotic process which will assist managers to track the performance. The key performance indicators include money saved, time saved, monetary goal for the year etc. Showcasing this set of slides titled Attended Robotic Process Automation Dashboard Rules PDF. The topics addressed in these templates are Productivity, Goal, Process Automation Dashboard. All the content presented in this PPT design is completely editable. Download it and make adjustments in color, background, font etc. as per your unique business setting.
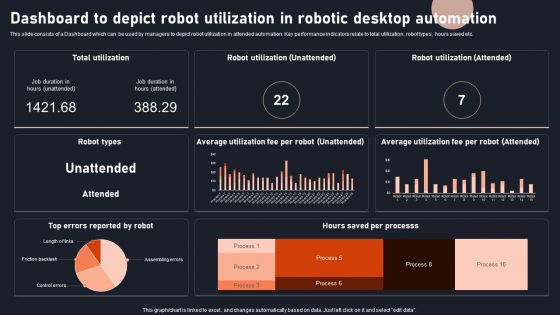
Dashboard To Depict Robot Utilization In Robotic Desktop Automation Download PDF
This slide consists of a Dashboard which can be used by managers to depict robot utilization in attended automation. Key performance indicators relate to total utilization, robot types, hours saved etc. Pitch your topic with ease and precision using this Dashboard To Depict Robot Utilization In Robotic Desktop Automation Download PDF. This layout presents information on Dashboard, Depict Robot Utilization, Robotic Desktop Automation. It is also available for immediate download and adjustment. So, changes can be made in the color, design, graphics or any other component to create a unique layout.
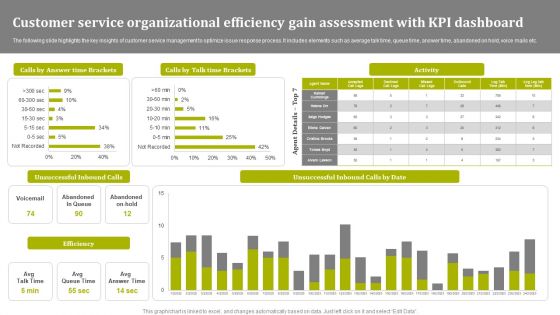
Customer Service Organizational Efficiency Gain Assessment With KPI Dashboard Slides PDF
The following slide highlights the key insights of customer service management to optimize issue response process. It includes elements such as average talk time, queue time, answer time, abandoned on hold, voice mails etc. Showcasing this set of slides titled Customer Service Organizational Efficiency Gain Assessment With KPI Dashboard Slides PDF. The topics addressed in these templates are Activity, Unsuccessful Inbound Calls, Efficiency. All the content presented in this PPT design is completely editable. Download it and make adjustments in color, background, font etc. as per your unique business setting.
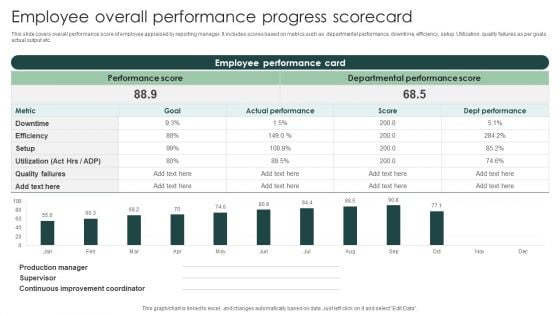
Employee Overall Performance Progress Scorecard Sample PDF
This slide covers overall performance score of employee appraised by reporting manager. It includes scores based on metrics such as departmental performance, downtime, efficiency, setup. Utilization, quality failures as per goals, actual output etc. Pitch your topic with ease and precision using this Employee Overall Performance Progress Scorecard Sample PDF. This layout presents information on Employee Performance, Progress Scorecard. It is also available for immediate download and adjustment. So, changes can be made in the color, design, graphics or any other component to create a unique layout.
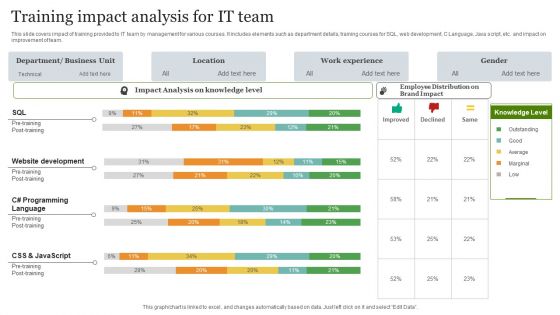
Training Impact Analysis For It Team Inspiration PDF
This slide covers impact of training provided to IT team by management for various courses. It includes elements such as department details, training courses for SQL, web development, C Language, Java script, etc. and impact on improvement of team. Showcasing this set of slides titled Training Impact Analysis For It Team Inspiration PDF. The topics addressed in these templates are Website Development, Analysis, Location. All the content presented in this PPT design is completely editable. Download it and make adjustments in color, background, font etc. as per your unique business setting.

Call Center Process Key Performance Indicator Dashboard Mockup PDF
This slide showcases call center process measurements and key performance indicators so managers and teams can keep track of and improve performance . It includes received calls, calculating speed of answering calls , ended calls before starting conversations , average calls per minute etc. Showcasing this set of slides titled Call Center Process Key Performance Indicator Dashboard Mockup PDF. The topics addressed in these templates are Received Calls, Conversation, Abandon Rate. All the content presented in this PPT design is completely editable. Download it and make adjustments in color, background, font etc. as per your unique business setting.
Storage Facility Productivity Tracking KPI Dashboard Graphics PDF
This slide showcases a dashboard for tracking and managing warehouse productivity to optimize logistics operations. It includes key components such as warehouse operating costs, perfect order rate, total shipments by country and on time shipments. Showcasing this set of slides titled Storage Facility Productivity Tracking KPI Dashboard Graphics PDF. The topics addressed in these templates are Warehouse Operating Costs, Perfect Order Rate, Total Shipment Country. All the content presented in this PPT design is completely editable. Download it and make adjustments in color, background, font etc. as per your unique business setting.
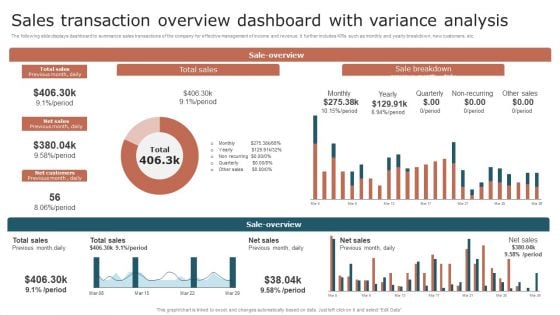
Sales Transaction Overview Dashboard With Variance Analysis Summary PDF
The following slide displays dashboard to summarize sales transactions of the company for effective management of income and revenue. It further includes KPIs such as monthly and yearly breakdown, new customers, etc. Showcasing this set of slides titled Sales Transaction Overview Dashboard With Variance Analysis Summary PDF. The topics addressed in these templates are Sales, Customers, Variance Analysis. All the content presented in this PPT design is completely editable. Download it and make adjustments in color, background, font etc. as per your unique business setting.
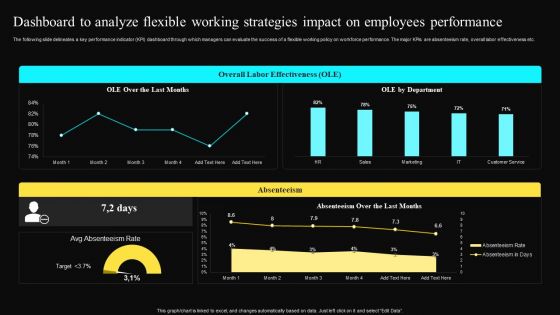
Dashboard To Analyze Flexible Working Strategies Impact On Employees Performance Rules PDF
The following slide delineates a key performance indicator KPI dashboard through which managers can evaluate the success of a flexible working policy on workforce performance. The major KPIs are absenteeism rate, overall labor effectiveness etc.If your project calls for a presentation, then Slidegeeks is your go-to partner because we have professionally designed, easy to edit templates that are perfect for any presentation. After downloading, you can easily edit Dashboard To Analyze Flexible Working Strategies Impact On Employees Performance Rules PDF and make the changes accordingly. You can rearrange slides or fill them with different images. Check out all the handy templates
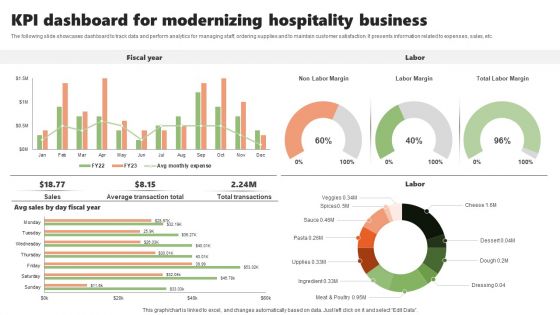
KPI Dashboard For Modernizing Hospitality Business Inspiration PDF
The following slide showcases dashboard to track data and perform analytics for managing staff, ordering supplies and to maintain customer satisfaction. It presents information related to expenses, sales, etc. Pitch your topic with ease and precision using this KPI Dashboard For Modernizing Hospitality Business Inspiration PDF. This layout presents information on Fiscal Year, Labor, Modernizing Hospitality. It is also available for immediate download and adjustment. So, changes can be made in the color, design, graphics or any other component to create a unique layout.
Critical Measures For Ensuring Threats Handling Activities Tracking Dashboard Summary PDF
This slide provides details regarding various threats management activities tracking dashboard in terms of breach risk trends, risk issues by owner, breach likelihood, etc. If your project calls for a presentation, then Slidegeeks is your go-to partner because we have professionally designed, easy-to-edit templates that are perfect for any presentation. After downloading, you can easily edit Critical Measures For Ensuring Threats Handling Activities Tracking Dashboard Summary PDF and make the changes accordingly. You can rearrange slides or fill them with different images. Check out all the handy templates.
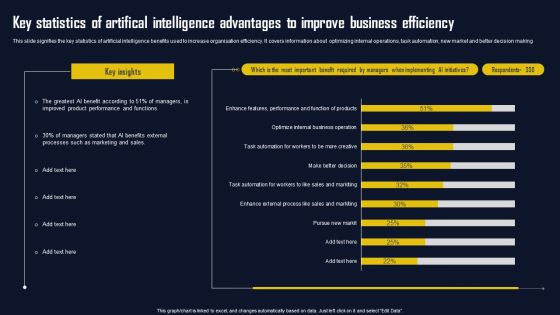
Key Statistics Of Artifical Intelligence Advantages To Improve Business Efficiency Infographics PDF
This slide signifies the key statistics of artificial intelligence benefits used to increase organisation efficiency. It covers information about optimizing internal operations, task automation, new market and better decision making Showcasing this set of slides titled Key Statistics Of Artifical Intelligence Advantages To Improve Business Efficiency Infographics PDF. The topics addressed in these templates are Greatest AI Benefit, Managers Stated, Benefits External Processes. All the content presented in this PPT design is completely editable. Download it and make adjustments in color, background, font etc. as per your unique business setting.
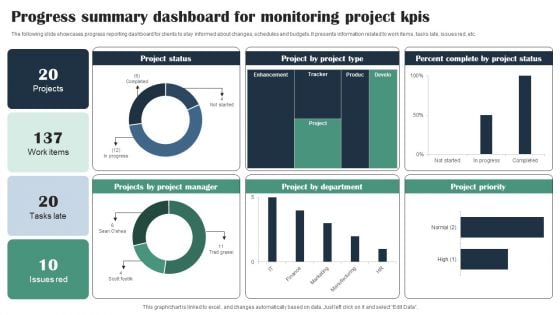
Progress Summary Dashboard For Monitoring Project Kpis Infographics PDF
The following slide showcases progress reporting dashboard for clients to stay informed about changes, schedules and budgets. It presents information related to work items, tasks late, issues red, etc. Pitch your topic with ease and precision using this Progress Summary Dashboard For Monitoring Project Kpis Infographics PDF. This layout presents information on Project Status, Project Manager, Project Type, Percent Complete. It is also available for immediate download and adjustment. So, changes can be made in the color, design, graphics or any other component to create a unique layout.
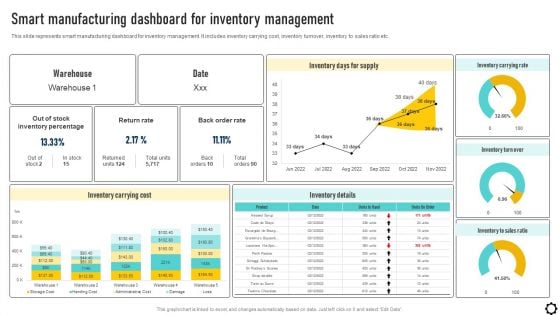
Optimizing Production Process Smart Manufacturing Dashboard For Inventory Template PDF
This slide represents smart manufacturing dashboard for inventory management. It includes inventory carrying cost, inventory turnover, inventory to sales ratio etc. Slidegeeks is here to make your presentations a breeze with Optimizing Production Process Smart Manufacturing Dashboard For Inventory Template PDF With our easy-to-use and customizable templates, you can focus on delivering your ideas rather than worrying about formatting. With a variety of designs to choose from, youre sure to find one that suits your needs. And with animations and unique photos, illustrations, and fonts, you can make your presentation pop. So whether youre giving a sales pitch or presenting to the board, make sure to check out Slidegeeks first.
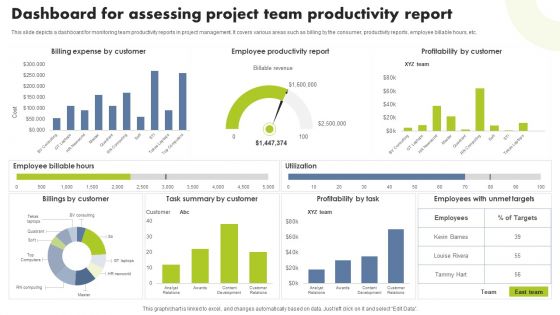
Dashboard For Assessing Project Team Productivity Report Mockup PDF
This slide depicts a dashboard for monitoring team productivity reports in project management. It covers various areas such as billing by the consumer, productivity reports, employee billable hours, etc. Pitch your topic with ease and precision using this Dashboard For Assessing Project Team Productivity Report Mockup PDF. This layout presents information on Billing Expense Customer, Employee Productivity Report, Profitability Customer. It is also available for immediate download and adjustment. So, changes can be made in the color, design, graphics or any other component to create a unique layout.
KPI Dashboard For Tracking Brand Communication Techniques Performance Topics PDF
The following slide illustrates dashboard which helps brand managers to improve their communication campaign performance. It presents information related to campaigns, cost per acquisitions, etc. Pitch your topic with ease and precision using this KPI Dashboard For Tracking Brand Communication Techniques Performance Topics PDF. This layout presents information on KPI Dashboard, Tracking Brand Communication, Techniques Performance. It is also available for immediate download and adjustment. So, changes can be made in the color, design, graphics or any other component to create a unique layout.
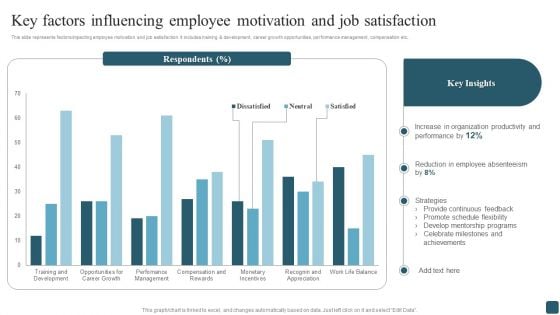
Key Factors Influencing Employee Motivation And Job Satisfaction Template PDF
This slide represents factors impacting employee motivation and job satisfaction. It includes training and development, career growth opportunities, performance management, compensation etc. If your project calls for a presentation, then Slidegeeks is your go-to partner because we have professionally designed, easy-to-edit templates that are perfect for any presentation. After downloading, you can easily edit Key Factors Influencing Employee Motivation And Job Satisfaction Template PDF and make the changes accordingly. You can rearrange slides or fill them with different images. Check out all the handy templates

Tactics To Launch New Product Communication Pictures PDF
Following slide demonstrates communication strategies used by managers to launch new product in different market. It includes strategies such as social media marketing, sales promotion, email marketing, press release, public relations, pay per click, direct mail, digital display, etc. Showcasing this set of slides titled Tactics To Launch New Product Communication Pictures PDF. The topics addressed in these templates are Communication Strategies, Social Media, Market Growth. All the content presented in this PPT design is completely editable. Download it and make adjustments in color, background, font etc. as per your unique business setting.
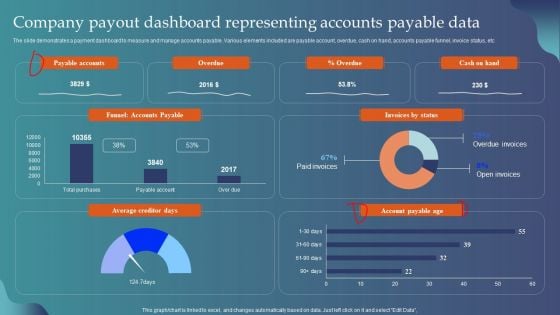
Company Payout Dashboard Representing Accounts Payable Data Introduction PDF
The slide demonstrates a payment dashboard to measure and manage accounts payable. Various elements included are payable account, overdue, cash on hand, accounts payable funnel, invoice status, etc. Pitch your topic with ease and precision using this Company Payout Dashboard Representing Accounts Payable Data Introduction PDF. This layout presents information on Payable Accounts, Overdue, Invoices By Status, Account Payable Age. It is also available for immediate download and adjustment. So, changes can be made in the color, design, graphics or any other component to create a unique layout.
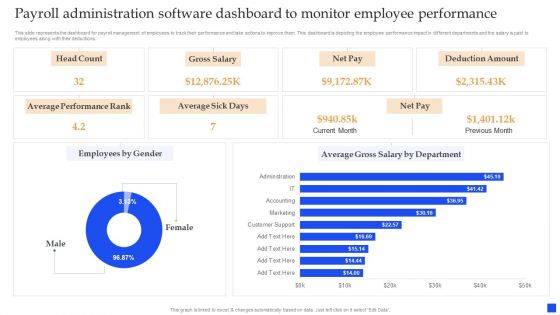
Payroll Administration Software Dashboard To Monitor Employee Performance Summary PDF
This slide represents the dashboard for payroll management of employees to track their performance and take actions to improve them. This dashboard is depicting the employee performance impact in different departments and the salary is paid to employees along with their deductions. Showcasing this set of slides titled Payroll Administration Software Dashboard To Monitor Employee Performance Summary PDF. The topics addressed in these templates are Payroll Administration Software Dashboard, Monitor Employee Performance. All the content presented in this PPT design is completely editable. Download it and make adjustments in color, background, font etc. as per your unique business setting.
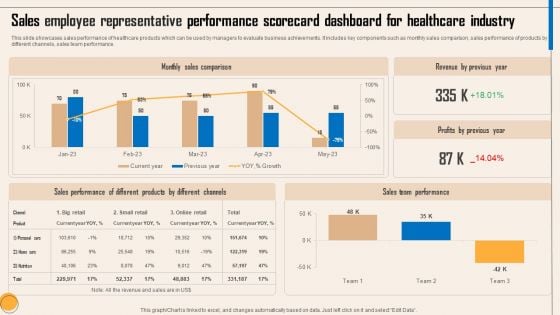
Sales Employee Representative Performance Scorecard Dashboard For Healthcare Industry Clipart PDF
This slide showcases sales performance of healthcare products which can be used by managers to evaluate business achievements. It includes key components such as monthly sales comparison, sales performance of products by different channels, sales team performance. Pitch your topic with ease and precision using this Sales Employee Representative Performance Scorecard Dashboard For Healthcare Industry Clipart PDF. This layout presents information on Monthly Sales Comparison, Revenue By Previous Year, Sales Performance, Different Products, Different Channels, Sales Team Performance . It is also available for immediate download and adjustment. So, changes can be made in the color, design, graphics or any other component to create a unique layout.
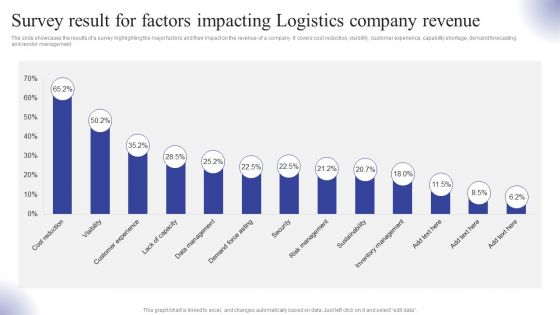
Survey Result For Factors Impacting Logistics Company Revenue Ppt Portfolio Example Topics PDF
The slide showcases the results of a survey highlighting the major factors and their impact on the revenue of a company. It covers cost reduction, visibility, customer experience, capability shortage, demand forecasting and vendor management. If your project calls for a presentation, then Slidegeeks is your go-to partner because we have professionally designed, easy-to-edit templates that are perfect for any presentation. After downloading, you can easily edit Survey Result For Factors Impacting Logistics Company Revenue Ppt Portfolio Example Topics PDF and make the changes accordingly. You can rearrange slides or fill them with different images. Check out all the handy templates
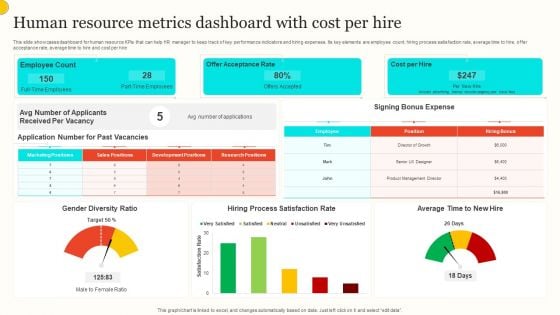
Human Resource Metrics Dashboard With Cost Per Hire Portrait PDF
This slide showcases dashboard for human resource KPIs that can help HR manager to keep track of key performance indicators and hiring expenses. Its key elements are employee count, hiring process satisfaction rate, average time to hire, offer acceptance rate, average time to hire and cost per hire. Showcasing this set of slides titled Human Resource Metrics Dashboard With Cost Per Hire Portrait PDF. The topics addressed in these templates are Employee Count, Offer Acceptance Rate, Cost Per Hire. All the content presented in this PPT design is completely editable. Download it and make adjustments in color, background, font etc. as per your unique business setting.
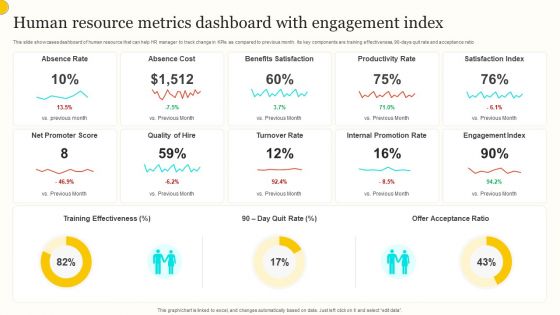
Human Resource Metrics Dashboard With Engagement Index Guidelines PDF
This slide showcases dashboard of human resource that can help HR manager to track change in KPIs as compared to previous month. Its key components are training effectiveness, 90 days quit rate and acceptance ratio. Pitch your topic with ease and precision using this Human Resource Metrics Dashboard With Engagement Index Guidelines PDF. This layout presents information on Absence Rate, Absence Cost, Benefits Satisfaction. It is also available for immediate download and adjustment. So, changes can be made in the color, design, graphics or any other component to create a unique layout.
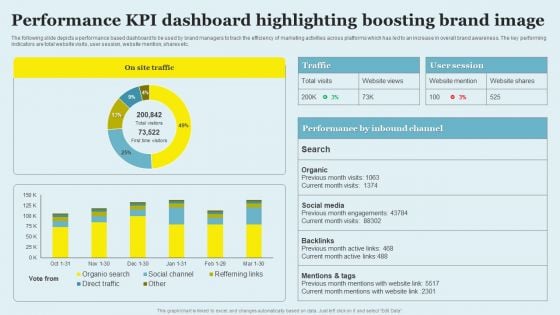
Performance KPI Dashboard Highlighting Boosting Brand Image Sample PDF
The following slide depicts a performance based dashboard to be used by brand managers to track the efficiency of marketing activities across platforms which has led to an increase in overall brand awareness. The key performing indicators are total website visits, user session, website mention, shares etc. Showcasing this set of slides titled Performance KPI Dashboard Highlighting Boosting Brand Image Sample PDF. The topics addressed in these templates are Social Media, Backlinks, Mentions Tags. All the content presented in this PPT design is completely editable. Download it and make adjustments in color, background, font etc. as per your unique business setting.

Summary Report For Post Hospital Visit Patient Experience Assessment Survey Survey SS
Following slides demonstrates summarized report for survey conducted by manager to improve hospital services. It includes key components such as appointment scheduling process, hospital visit frequency, wafting area experience, hospital cleanliness, staff behavior, etc. Pitch your topic with ease and precision using this Summary Report For Post Hospital Visit Patient Experience Assessment Survey Survey SS. This layout presents information on General Services, Appointment, Behavior. It is also available for immediate download and adjustment. So, changes can be made in the color, design, graphics or any other component to create a unique layout.
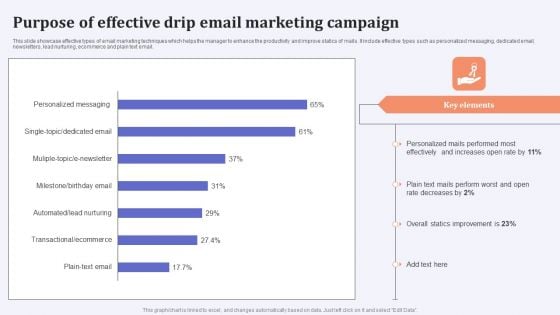
Purpose Of Effective Drip Email Marketing Campaign Brochure PDF
This slide showcase effective types of email marketing techniques which helps the manager to enhance the productivity and improve statics of mails. It include effective types such as personalized messaging, dedicated email, newsletters, lead nurturing, ecommerce and plain text email. Showcasing this set of slides titled Purpose Of Effective Drip Email Marketing Campaign Brochure PDF. The topics addressed in these templates are Personalized Mails, Rate Decreases, Overall Statics Improvement. All the content presented in this PPT design is completely editable. Download it and make adjustments in color, background, font etc. as per your unique business setting.
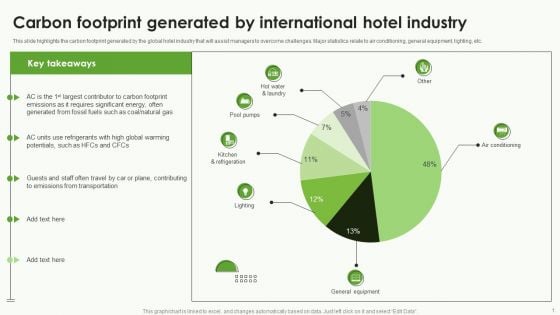
Carbon Footprint Generated By International Hotel Industry Ideas PDF
This slide highlights the carbon footprint generated by the global hotel industry that will assist managers to overcome challenges. Major statistics relate to air conditioning, general equipment, lighting, etc. Showcasing this set of slides titled Carbon Footprint Generated By International Hotel Industry Ideas PDF. The topics addressed in these templates are Hot Water Laundry, Pool Pumps, Kitchen Refrigeration. All the content presented in this PPT design is completely editable. Download it and make adjustments in color, background, font etc. as per your unique business setting.
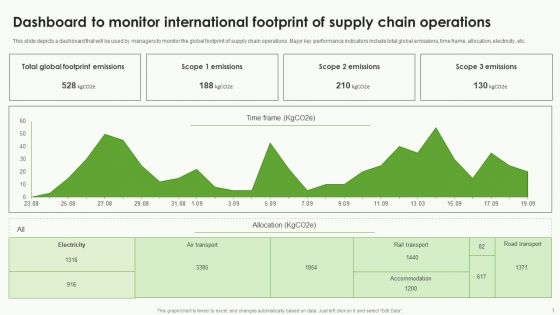
Dashboard To Monitor International Footprint Of Supply Chain Operations Brochure PDF
This slide depicts a dashboard that will be used by managers to monitor the global footprint of supply chain operations. Major key performance indicators include total global emissions, time frame, allocation, electricity, etc. Showcasing this set of slides titled Dashboard To Monitor International Footprint Of Supply Chain Operations Brochure PDF. The topics addressed in these templates are Electricity, Footprint Emissions, Allocation. All the content presented in this PPT design is completely editable. Download it and make adjustments in color, background, font etc. as per your unique business setting.
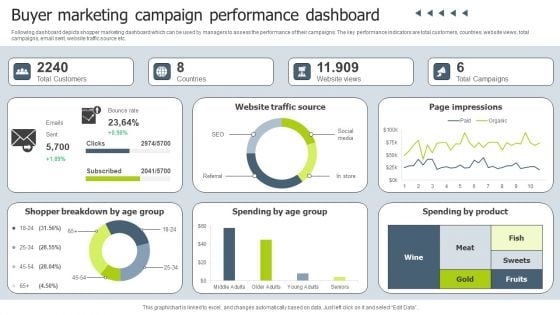
Buyer Marketing Campaign Performance Dashboard Download PDF
Following dashboard depicts shopper marketing dashboard which can be used by managers to assess the performance of their campaigns. The key performance indicators are total customers, countries, website views, total campaigns, email sent, website traffic source etc. Pitch your topic with ease and precision using this Buyer Marketing Campaign Performance Dashboard Download PDF. This layout presents information on Total Customers, Countries, Website Views. It is also available for immediate download and adjustment. So, changes can be made in the color, design, graphics or any other component to create a unique layout.
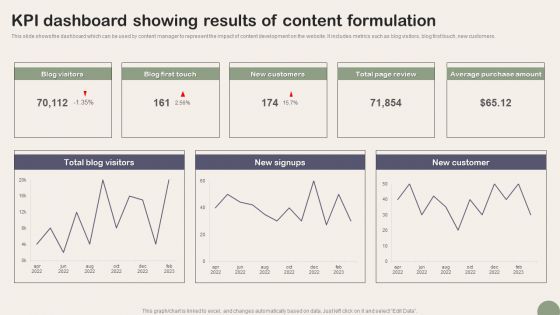
KPI Dashboard Showing Results Of Content Formulation Clipart PDF
This slide shows the dashboard which can be used by content manager to represent the impact of content development on the website. It includes metrics such as blog visitors, blog first touch, new customers. Showcasing this set of slides titled KPI Dashboard Showing Results Of Content Formulation Clipart PDF. The topics addressed in these templates are Blog Visitors, Blog First Touch, New Customers. All the content presented in this PPT design is completely editable. Download it and make adjustments in color, background, font etc. as per your unique business setting.
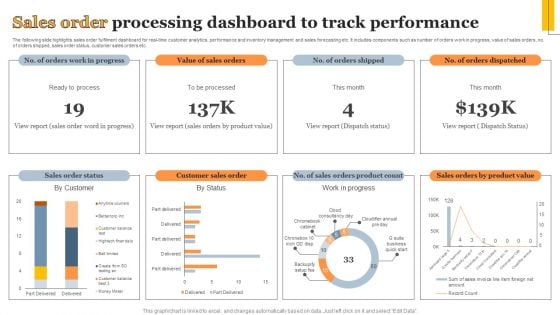
Sales Order Processing Dashboard To Track Performance Information PDF
The following slide highlights sales order fulfilment dashboard for real-time customer analytics, performance and inventory management and sales forecasting etc. It includes components such as number of orders work in progress, value of sales orders, no. of orders shipped, sales order status, customer sales orders etc. Showcasing this set of slides titled Sales Order Processing Dashboard To Track Performance Information PDF. The topics addressed in these templates are Sales Order Status, Customer Sales Order, Work Progress. All the content presented in this PPT design is completely editable. Download it and make adjustments in color, background, font etc. as per your unique business setting.
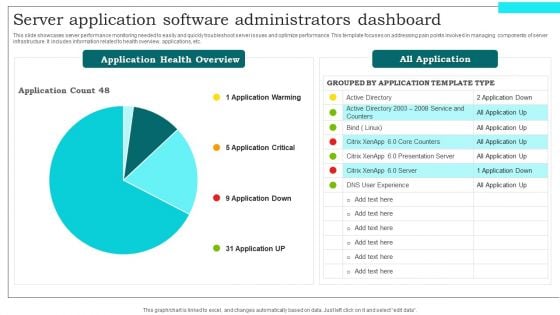
Server Application Software Administrators Dashboard Slides PDF
This slide showcases server performance monitoring needed to easily and quickly troubleshoot server issues and optimize performance. This template focuses on addressing pain points involved in managing components of server infrastructure. It includes information related to health overview, applications, etc. Showcasing this set of slides titled Server Application Software Administrators Dashboard Slides PDF. The topics addressed in these templates are Application Warming, Application Critical, Application Down. All the content presented in this PPT design is completely editable. Download it and make adjustments in color, background, font etc. as per your unique business setting.
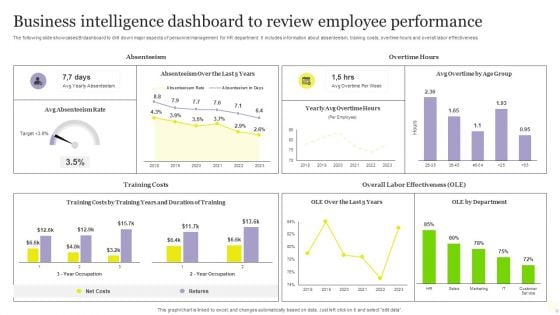
Business Intelligence Dashboard To Review Employee Performance Pictures PDF
The following slide showcases BI dashboard to drill down major aspects of personnel management for HR department. It includes information about absenteeism, training costs, overtime hours and overall labor effectiveness. Showcasing this set of slides titled Business Intelligence Dashboard To Review Employee Performance Pictures PDF. The topics addressed in these templates are Business Intelligence Dashboard, Review Employee Performance. All the content presented in this PPT design is completely editable. Download it and make adjustments in color, background, font etc. as per your unique business setting.
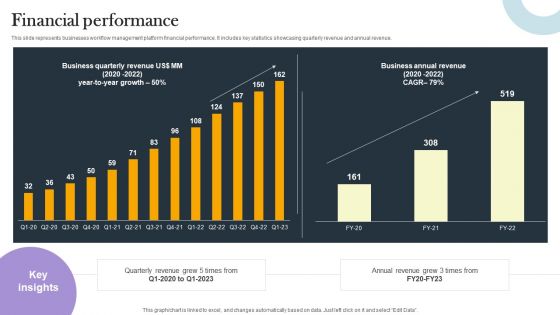
Business Process Optimization Platform Investors Funding Presentation Financial Performance Formats PDF
This slide represents businesses workflow management platform financial performance. It includes key statistics showcasing quarterly revenue and annual revenue. Explore a selection of the finest Business Process Optimization Platform Investors Funding Presentation Financial Performance Formats PDF here. With a plethora of professionally designed and pre made slide templates, you can quickly and easily find the right one for your upcoming presentation. You can use our Business Process Optimization Platform Investors Funding Presentation Financial Performance Formats PDF to effectively convey your message to a wider audience. Slidegeeks has done a lot of research before preparing these presentation templates. The content can be personalized and the slides are highly editable. Grab templates today from Slidegeeks.
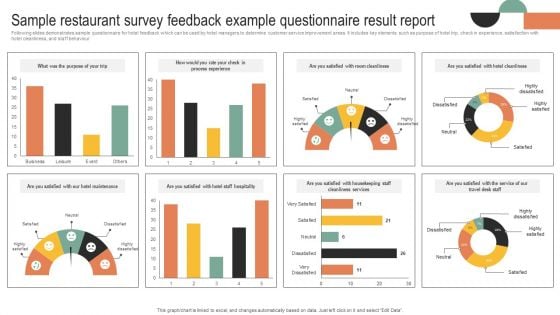
Sample Restaurant Survey Feedback Example Questionnaire Result Report Survey SS
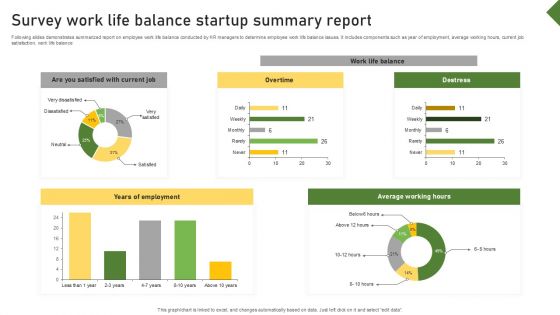
Survey Work Life Balance Startup Summary Report Survey SS
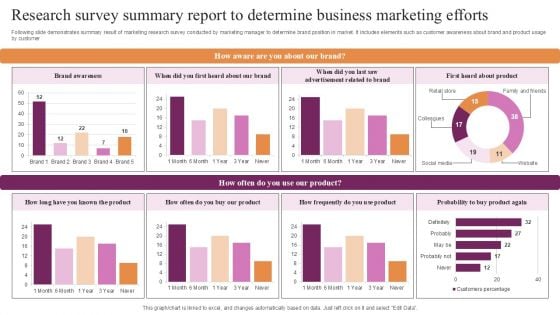
Research Survey Summary Report To Determine Business Marketing Efforts Survey SS
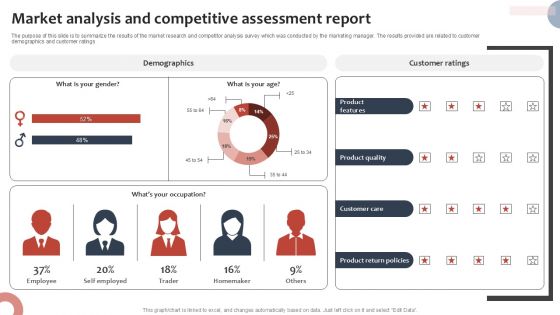
Market Analysis And Competitive Assessment Report Survey SS
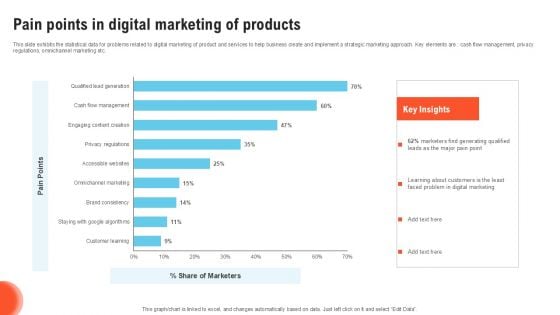
Pain Points In Digital Marketing Of Products Graphics PDF
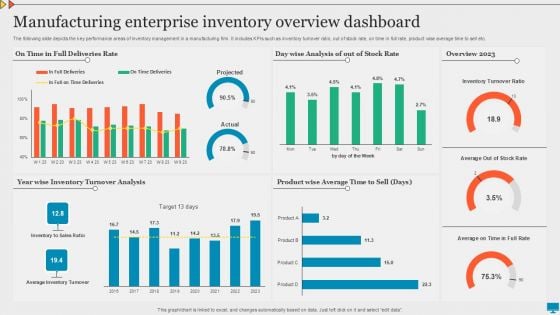
Manufacturing Enterprise Inventory Overview Dashboard Graphics PDF
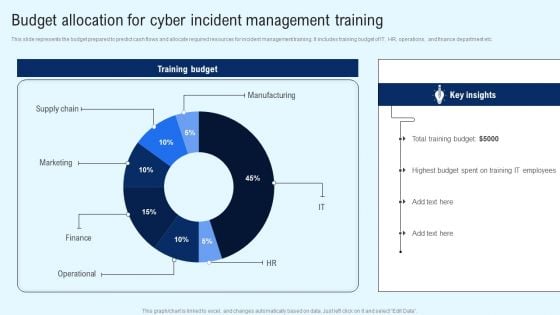
Implementing Cyber Security Incident Budget Allocation For Cyber Incident Portrait PDF
This slide represents the budget prepared to predict cash flows and allocate required resources for incident management training. It includes training budget of IT, HR, operations, and finance department etc. Find a pre designed and impeccable Implementing Cyber Security Incident Budget Allocation For Cyber Incident Portrait PDF. The templates can ace your presentation without additional effort. You can download these easy to edit presentation templates to make your presentation stand out from others. So, what are you waiting for Download the template from Slidegeeks today and give a unique touch to your presentation.
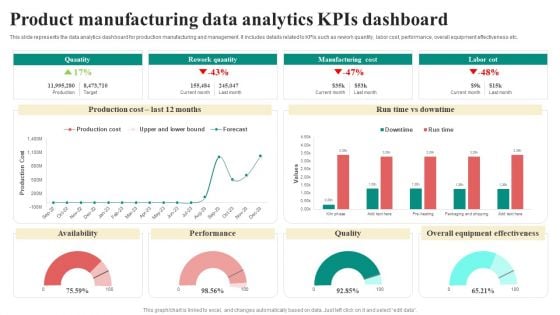
Product Manufacturing Data Analytics Kpis Dashboard Guidelines PDF
This slide represents the data analytics dashboard for production manufacturing and management. It includes details related to KPIs such as rework quantity, labor cost, performance, overall equipment effectiveness etc. Showcasing this set of slides titled Product Manufacturing Data Analytics Kpis Dashboard Guidelines PDF. The topics addressed in these templates are Quantity, Rework Quantity, Manufacturing Cost, Labor Cot. All the content presented in this PPT design is completely editable. Download it and make adjustments in color, background, font etc. as per your unique business setting.
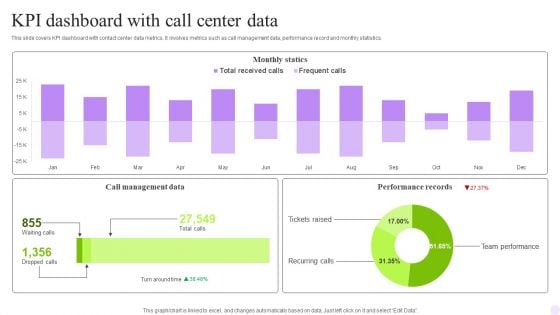
KPI Dashboard With Call Center Data Rules PDF
This slide covers contact center performance metrics KPI dashboard. It involves details such as number of total calls, average answer speed, abandon rate, data of agents performance and call abandon rate by departments. Pitch your topic with ease and precision using this KPI Dashboard With Call Center Data Rules PDF. This layout presents information on Monthly Statics, Management Data, Performance Records. It is also available for immediate download and adjustment. So, changes can be made in the color, design, graphics or any other component to create a unique layout.
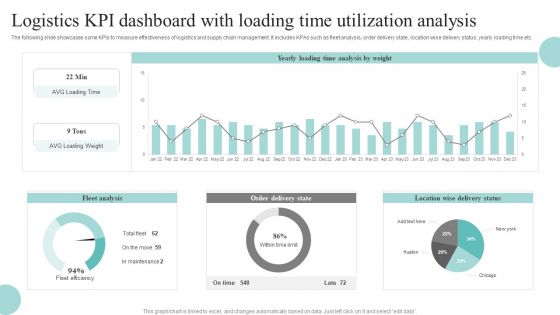
Logistics KPI Dashboard With Loading Time Utilization Analysis Download PDF
The following slide showcases some KPIs to measure effectiveness of logistics and supply chain management. It includes KPAs such as fleet analysis, order delivery state, location wise delivery status, yearly loading time etc. Pitch your topic with ease and precision using this Logistics KPI Dashboard With Loading Time Utilization Analysis Download PDF. This layout presents information on Fleet Analysis, Order Delivery State, Location Wise Delivery Status. It is also available for immediate download and adjustment. So, changes can be made in the color, design, graphics or any other component to create a unique layout.
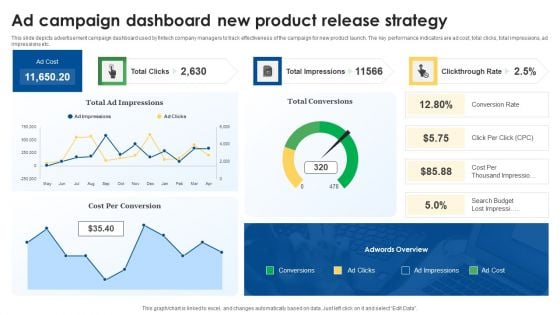
Ad Campaign Dashboard New Product Release Strategy Guidelines PDF
This slide depicts advertisement campaign dashboard used by fintech company managers to track effectiveness of the campaign for new product launch. The key performance indicators are ad cost, total clicks, total impressions, ad impressions etc. Pitch your topic with ease and precision using this Ad Campaign Dashboard New Product Release Strategy Guidelines PDF. This layout presents information on Impressions, Conversion, Strategy. It is also available for immediate download and adjustment. So, changes can be made in the color, design, graphics or any other component to create a unique layout.
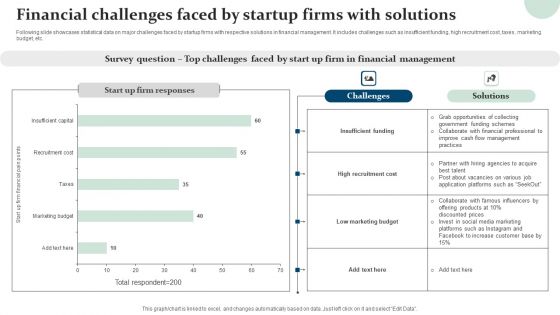
Financial Challenges Faced By Startup Firms With Solutions Slides PDF
Following slide showcases statistical data on major challenges faced by startup firms with respective solutions in financial management. It includes challenges such as insufficient funding, high recruitment cost, taxes, marketing budget, etc. Pitch your topic with ease and precision using this Financial Challenges Faced By Startup Firms With Solutions Slides PDF. This layout presents information on Insufficient Funding, High Recruitment Cost, Low Marketing Budget. It is also available for immediate download and adjustment. So, changes can be made in the color, design, graphics or any other component to create a unique layout.
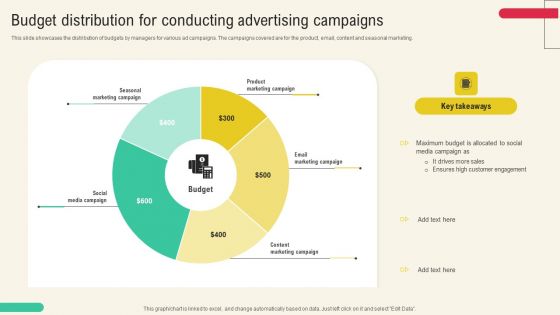
Client Acquisition Through Marketing Campaign Budget Distribution For Conducting Advertising Campaigns Download PDF
This slide showcases the distribution of budgets by managers for various ad campaigns. The campaigns covered are for the product, email, content and seasonal marketing. Find a pre designed and impeccable Client Acquisition Through Marketing Campaign Budget Distribution For Conducting Advertising Campaigns Download PDF. The templates can ace your presentation without additional effort. You can download these easy to edit presentation templates to make your presentation stand out from others. So, what are you waiting for Download the template from Slidegeeks today and give a unique touch to your presentation.
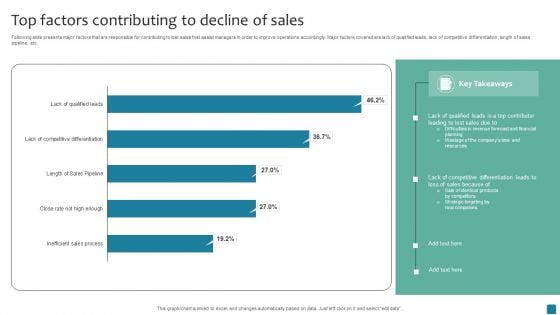
Top Factors Contributing To Decline Of Sales Demonstration PDF
Following slide presents major factors that are responsible for contributing to lost sales that assist managers in order to improve operations accordingly. Major factors covered are lack of qualified leads, lack of competitive differentiation, length of sales pipeline, etc. Showcasing this set of slides titled Top Factors Contributing To Decline Of Sales Demonstration PDF. The topics addressed in these templates are Top Factors Contributing, Decline Of Sales. All the content presented in this PPT design is completely editable. Download it and make adjustments in color, background, font etc. as per your unique business setting.
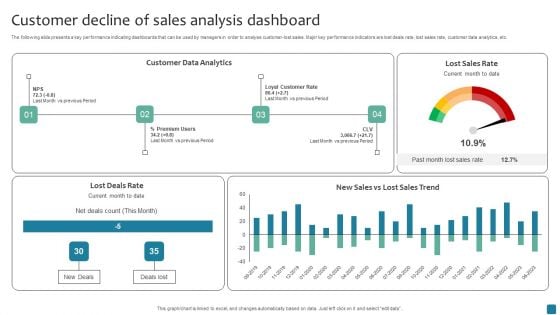
Customer Decline Of Sales Analysis Dashboard Rules PDF
The following slide presents a key performance indicating dashboards that can be used by managers in order to analyse customer-lost sales. Major key performance indicators are lost deals rate, lost sales rate, customer data analytics, etc. Pitch your topic with ease and precision using this Customer Decline Of Sales Analysis Dashboard Rules PDF. This layout presents information on Customer Data Analytics. It is also available for immediate download and adjustment. So, changes can be made in the color, design, graphics or any other component to create a unique layout.
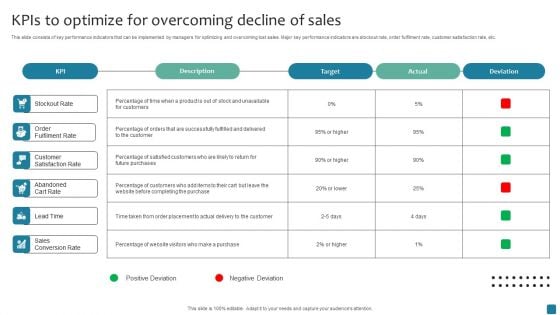
Kpis To Optimize For Overcoming Decline Of Sales Mockup PDF
This slide consists of key performance indicators that can be implemented by managers for optimizing and overcoming lost sales. Major key performance indicators are stockout rate, order fulfilment rate, customer satisfaction rate, etc. Showcasing this set of slides titled Kpis To Optimize For Overcoming Decline Of Sales Mockup PDF. The topics addressed in these templates are Target, Actual, Deviation. All the content presented in this PPT design is completely editable. Download it and make adjustments in color, background, font etc. as per your unique business setting.
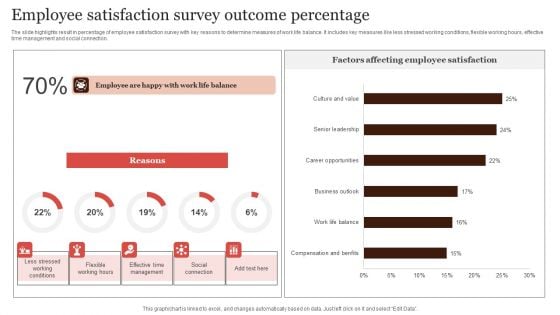
Employee Satisfaction Survey Outcome Percentage Graphics PDF
The slide highlights result in percentage of employee satisfaction survey with key reasons to determine measures of work life balance. It includes key measures like less stressed working conditions, flexible working hours, effective time management and social connection. Showcasing this set of slides titled Employee Satisfaction Survey Outcome Percentage Graphics PDF. The topics addressed in these templates are Factors Affecting, Employee Satisfaction, Survey Outcome Percentage. All the content presented in this PPT design is completely editable. Download it and make adjustments in color, background, font etc. as per your unique business setting.
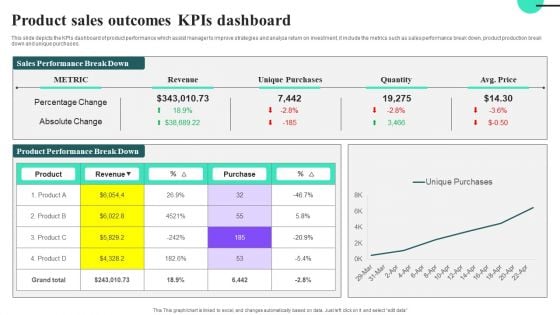
Product Sales Outcomes Kpis Dashboard Ideas PDF
This slide depicts the KPIs dashboard of product performance which assist manager to improve strategies and analyze return on investment, it include the metrics such as sales performance break down, product production break down and unique purchases.Showcasing this set of slides titled Product Sales Outcomes Kpis Dashboard Ideas PDF. The topics addressed in these templates are Percentage Change, Absolute Change. All the content presented in this PPT design is completely editable. Download it and make adjustments in color, background, font etc. as per your unique business setting.
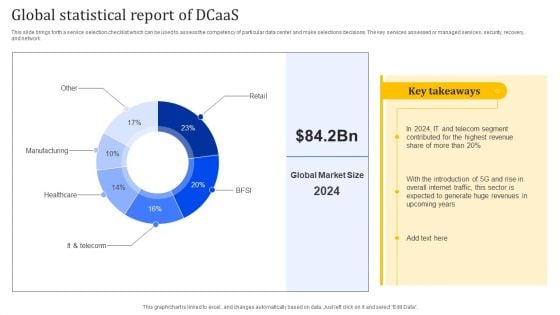
Global Statistical Report Of Dcaas Portrait PDF
This slide brings forth a service selection checklist which can be used to assess the competency of particular data center and make selections decisions. The key services assessed or managed services, security, recovery, and network. Showcasing this set of slides titled Global Statistical Report Of Dcaas Portrait PDF. The topics addressed in these templates are Manufacturing, Healthcare, Global Statistical. All the content presented in this PPT design is completely editable. Download it and make adjustments in color, background, font etc. as per your unique business setting.
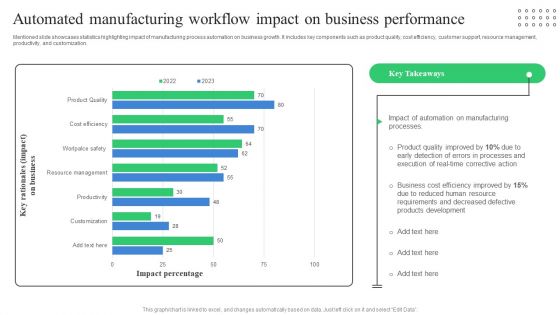
Automated Manufacturing Workflow Impact On Business Performance Sample PDF
Mentioned slide showcases statistics highlighting impact of manufacturing process automation on business growth. It includes key components such as product quality, cost efficiency, customer support, resource management, productivity, and customization. Showcasing this set of slides titled Automated Manufacturing Workflow Impact On Business Performance Sample PDF. The topics addressed in these templates are Product Quality Improved, Business Cost Efficiency, Defective Products Development. All the content presented in this PPT design is completely editable. Download it and make adjustments in color, background, font etc. as per your unique business setting.
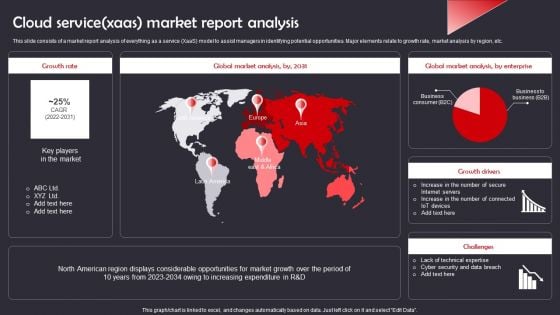
Cloud Service Xaas Market Report Analysis Ideas PDF
This slide consists of a market report analysis of everything as a service XaaS model to assist managers in identifying potential opportunities. Major elements relate to growth rate, market analysis by region, etc. Showcasing this set of slides titled Cloud Service Xaas Market Report Analysis Ideas PDF. The topics addressed in these templates are Growth Rate, Global Market Analysis, Global Market Analysis. All the content presented in this PPT design is completely editable. Download it and make adjustments in color, background, font etc. as per your unique business setting.
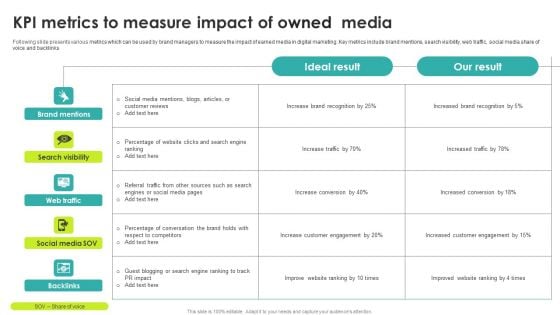
Kpi Metrics To Measure Impact Of Owned Media Brochure PDF
Following slide presents various metrics which can be used by brand managers to measure the impact of earned media in digital marketing. Key metrics include brand mentions, search visibility, web traffic, social media share of voice and backlinks Showcasing this set of slides titled Kpi Metrics To Measure Impact Of Owned Media Brochure PDF. The topics addressed in these templates are Web Traffic, Search Visibility, Ideal Result. All the content presented in this PPT design is completely editable. Download it and make adjustments in color, background, font etc. as per your unique business setting.
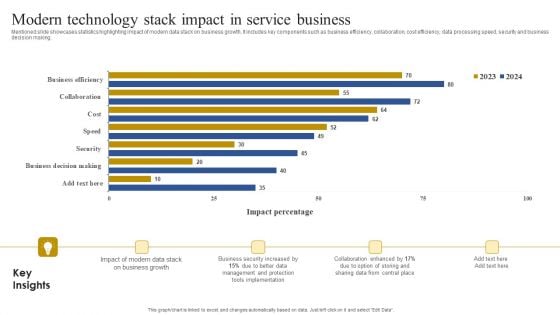
Modern Technology Stack Impact In Service Business Clipart PDF
Mentioned slide showcases statistics highlighting impact of modern data stack on business growth. It includes key components such as business efficiency, collaboration, cost efficiency, data processing speed, security and business decision making. Pitch your topic with ease and precision using this Modern Technology Stack Impact In Service Business Clipart PDF. This layout presents information on Business Security, Implementation, Management And Protection. It is also available for immediate download and adjustment. So, changes can be made in the color, design, graphics or any other component to create a unique layout.
Promotional Campaign Performance Tracking Dashboard For Business Growth Information PDF
This slide represents dashboard showcasing advertising campaign performance progress which helps to manage marketing activities effectively. It provides information regarding total marketing cost, website impressions, content clicks, customer acquisition, cost per campaign etc. Showcasing this set of slides titled Promotional Campaign Performance Tracking Dashboard For Business Growth Information PDF. The topics addressed in these templates are Website Impression, Content Clicks, Customer Acquisition . All the content presented in this PPT design is completely editable. Download it and make adjustments in color, background, font etc. as per your unique business setting.
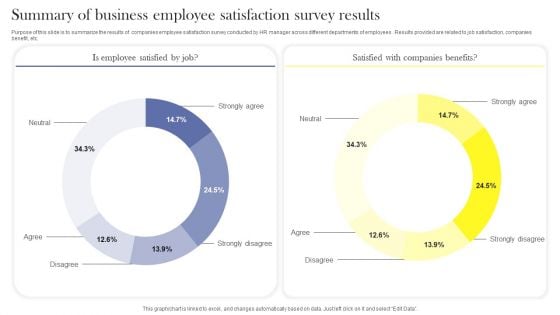
Summary Of Business Employee Satisfaction Survey Results Survey SS
Purpose of this slide is to summarize the results of companies employee satisfaction survey conducted by HR manager across different departments of employees . Results provided are related to job satisfaction, companies benefit, etc. Pitch your topic with ease and precision using this Summary Of Business Employee Satisfaction Survey Results Survey SS. This layout presents information on Neutral, Strongly Agree, Strongly Disagree, Disagree, Agree. It is also available for immediate download and adjustment. So, changes can be made in the color, design, graphics or any other component to create a unique layout.
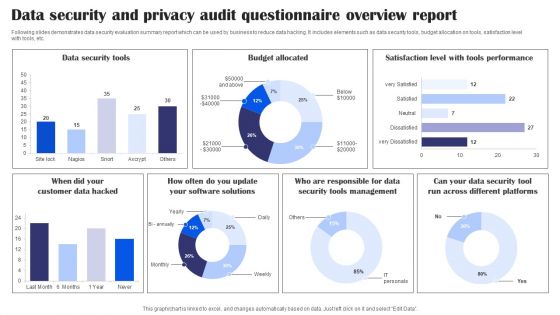
Data Security And Privacy Audit Questionnaire Overview Report Survey SS
Following slides demonstrates data security evaluation summary report which can be used by business to reduce data hacking. It includes elements such as data security tools, budget allocation on tools, satisfaction level with tools, etc. Pitch your topic with ease and precision using this Data Security And Privacy Audit Questionnaire Overview Report Survey SS. This layout presents information on Data Security Tools, Budget Allocated, Tools Performance, Data Security Tools Management. It is also available for immediate download and adjustment. So, changes can be made in the color, design, graphics or any other component to create a unique layout.
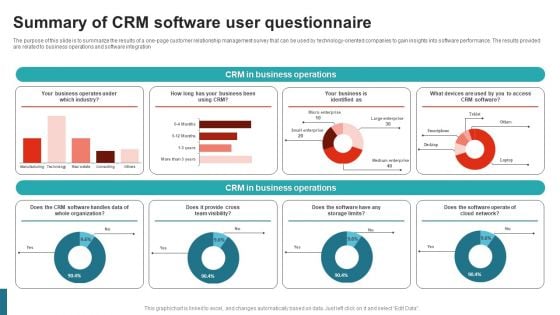
Summary Of CRM Software User Questionnaire Survey SS
The purpose of this slide is to summarize the results of a one-page customer relationship management survey that can be used by technology-oriented companies to gain insights into software performance. The results provided are related to business operations and software integration. Pitch your topic with ease and precision using this Summary Of CRM Software User Questionnaire Survey SS. This layout presents information on CRM In Business Operations, Industry, Cloud Network, Team Visibility. It is also available for immediate download and adjustment. So, changes can be made in the color, design, graphics or any other component to create a unique layout.
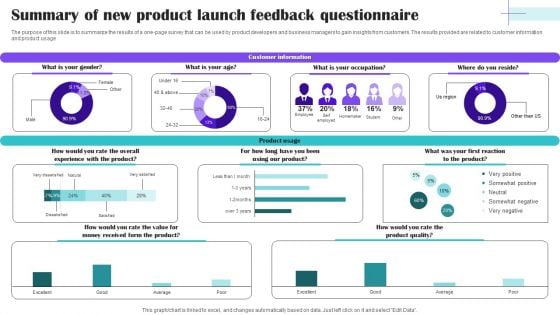
Summary Of New Product Launch Feedback Questionnaire Survey SS
The purpose of this slide is to summarize the results of a one-page survey that can be used by product developers and business managers to gain insights from customers. The results provided are related to customer information and product usage. Pitch your topic with ease and precision using this Summary Of New Product Launch Feedback Questionnaire Survey SS. This layout presents information on Customer Information, Product Usage, Occupation, Value For Money, Product Quality. It is also available for immediate download and adjustment. So, changes can be made in the color, design, graphics or any other component to create a unique layout.
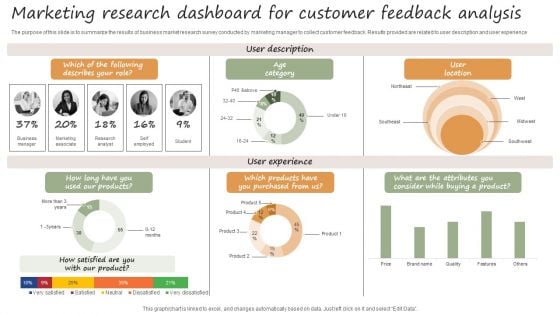
Marketing Research Dashboard For Customer Feedback Analysis Introduction PDF
The purpose of this slide is to summarize the results of business market research survey conducted by marketing manager to collect customer feedback. Results provided are related to user description and user experience. Showcasing this set of slides titled Marketing Research Dashboard For Customer Feedback Analysis Introduction PDF. The topics addressed in these templates are Age Category, User Location, User Experience . All the content presented in this PPT design is completely editable. Download it and make adjustments in color, background, font etc. as per your unique business setting.

 Home
Home