Executive Kpi
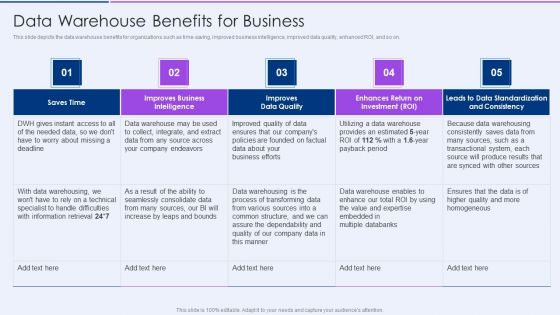
Executive Information Database System Data Warehouse Benefits For Business Introduction PDF
This slide depicts the data warehouse benefits for organizations such as time saving, improved business intelligence, improved data quality, enhanced ROI, and so on.Deliver and pitch your topic in the best possible manner with this Executive Information Database System Data Warehouse Benefits For Business Introduction PDF. Use them to share invaluable insights on Improves Business, Intelligence Standardization, Consistency and impress your audience. This template can be altered and modified as per your expectations. So, grab it now.
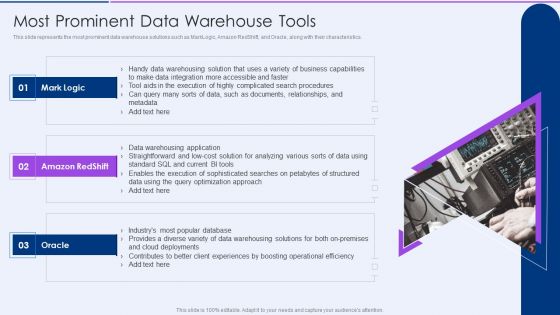
Executive Information Database System Most Prominent Data Warehouse Tools Download PDF
This slide represents the most prominent data warehouse solutions such as MarkLogic, Amazon RedShift, and Oracle, along with their characteristics.Deliver an awe inspiring pitch with this creative Executive Information Database System Most Prominent Data Warehouse Tools Download PDF bundle. Topics like Amazon Redshift, Data Warehousing, Sophisticated Searches can be discussed with this completely editable template. It is available for immediate download depending on the needs and requirements of the user.
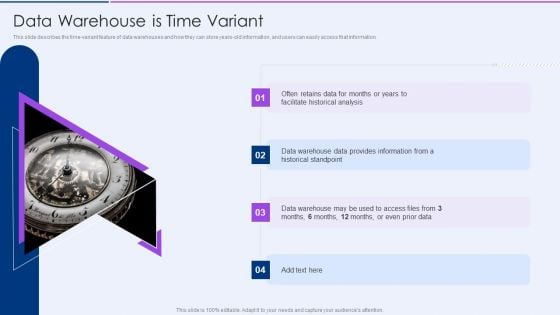
Executive Information Database System Data Warehouse Is Time Variant Portrait PDF
This slide describes the time variant feature of data warehouses and how they can store years old information, and users can easily access that information. Deliver and pitch your topic in the best possible manner with this Executive Information Database System Data Warehouse Is Time Variant Portrait PDF. Use them to share invaluable insights on Facilitate Historical, Historical Standpoint, Provides Information and impress your audience. This template can be altered and modified as per your expectations. So, grab it now.

Executive Information Database System Mpp Massively Parallel Processing Analytical Databases Formats PDF
This slide represents the massively parallel processing analytical database and how parallel processing is done across multiple servers.Deliver and pitch your topic in the best possible manner with this Executive Information Database System Mpp Massively Parallel Processing Analytical Databases Formats PDF. Use them to share invaluable insights on Massively Parallel, Processing Illustrated, Data Warehousing and impress your audience. This template can be altered and modified as per your expectations. So, grab it now.
Instructions Playbook For B2B Sales Executive Sales Management Activities Tracking Dashboard Pictures PDF
This slide provides information regarding sales management activities tracking dashboard to measure closed business, sales pipeline, sales activity by sales rep, month over month growth, forecast by month, etc. Deliver and pitch your topic in the best possible manner with this Instructions Playbook For B2B Sales Executive Sales Management Activities Tracking Dashboard Pictures PDF. Use them to share invaluable insights on Closed Business, Sales Pipeline, Sales Activity and impress your audience. This template can be altered and modified as per your expectations. So, grab it now.
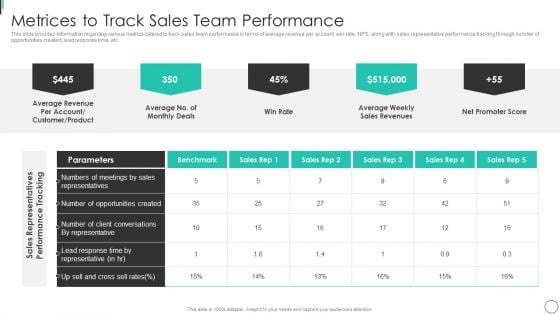
Instructions Playbook For B2B Sales Executive Metrices To Track Sales Team Performance Information PDF
This slide provides information regarding various metrics catered to track sales team performance in terms of average revenue per account, win rate, NPS, along with sales representative performance tracking through number of opportunities created, lead response time, etc. Deliver an awe inspiring pitch with this creative Instructions Playbook For B2B Sales Executive Metrices To Track Sales Team Performance Information PDF bundle. Topics like Sales Representatives, Opportunities Created, Lead Response can be discussed with this completely editable template. It is available for immediate download depending on the needs and requirements of the user.
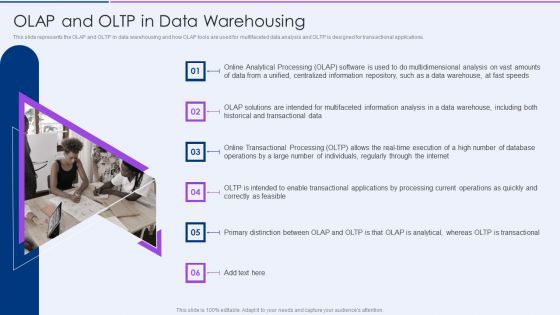
Executive Information Database System Olap And Oltp In Data Warehousing Sample PDF
This slide represents the OLAP and OLTP in data warehousing and how OLAP tools are used for multifaceted data analysis and OLTP is designed for transactional applications.This is a Executive Information Database System Olap And Oltp In Data Warehousing Sample PDF template with various stages. Focus and dispense information on six stages using this creative set, that comes with editable features. It contains large content boxes to add your information on topics like Historical Transactional, Transactional Processing, Through Internet. You can also showcase facts, figures, and other relevant content using this PPT layout. Grab it now.
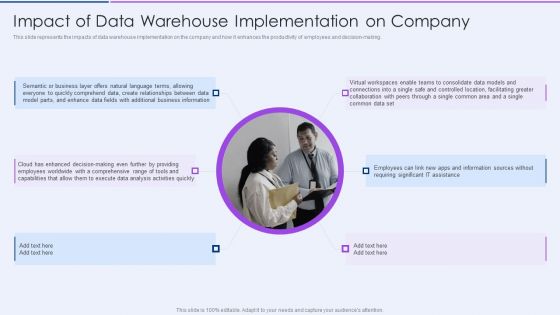
Executive Information Database System Impact Of Data Warehouse Implementation On Company Brochure PDF
This slide represents the impacts of data warehouse implementation on the company and how it enhances the productivity of employees and decision making.This is a Executive Information Database System Impact Of Data Warehouse Implementation On Company Brochure PDF template with various stages. Focus and dispense information on one stage using this creative set, that comes with editable features. It contains large content boxes to add your information on topics like Relationships Between, Business Information, Analysis Activities. You can also showcase facts, figures, and other relevant content using this PPT layout. Grab it now.
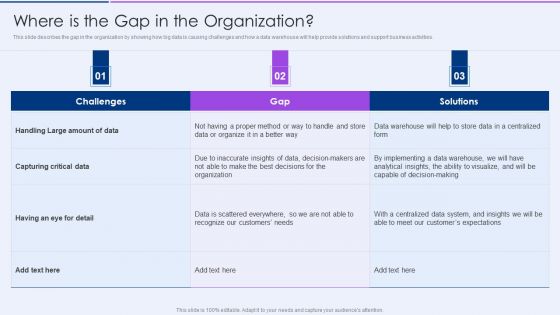
Executive Information Database System Where Is The Gap In The Organization Background PDF
This slide describes the gap in the organization by showing how big data is causing challenges and how a data warehouse will help provide solutions and support business activities.Deliver and pitch your topic in the best possible manner with this Executive Information Database System Where Is The Gap In The Organization Background PDF. Use them to share invaluable insights on Capturing Critical, Amount Of Data, Data Is Scattered and impress your audience. This template can be altered and modified as per your expectations. So, grab it now.
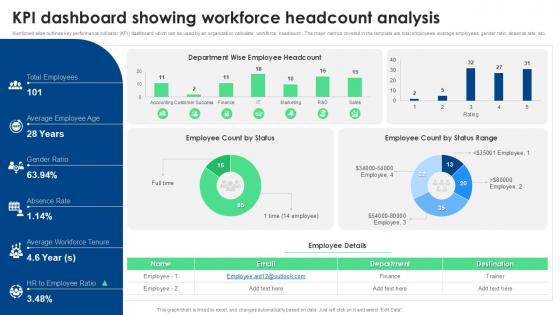
KPI Dashboard Snapshot Showing Workforce Headcount Analysis
From laying roadmaps to briefing everything in detail, our templates are perfect for you. You can set the stage with your presentation slides. All you have to do is download these easy-to-edit and customizable templates. KPI Dashboard Snapshot Showing Workforce Headcount Analysis will help you deliver an outstanding performance that everyone would remember and praise you for. Do download this presentation today. The KPI Dashboard Snapshot Showing Workforce Headcount Analysis is a visually compelling PowerPoint template designed to present key metrics related to workforce composition. It includes dynamic charts and graphs showcasing headcount trends, department breakdowns, gender ratios, and more. This template is perfect for HR teams and executives who need a concise overview of workforce analytics for strategic decision-making and operational efficiency.
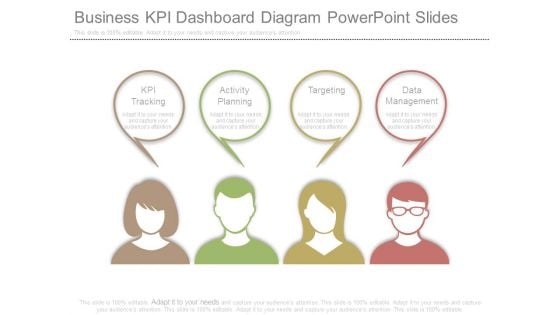
Business Kpi Dashboard Diagram Powerpoint Slides
This is a business kpi dashboard diagram powerpoint slides. This is a four stage process. The stages in this process are kpi tracking, activity planning, targeting, data management.
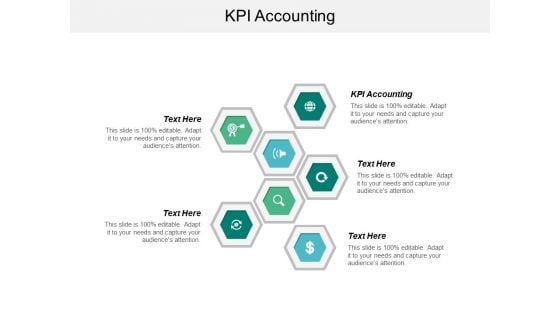
Kpi Accounting Ppt Powerpoint Presentation Show Cpb
This is a kpi accounting ppt powerpoint presentation show cpb. This is a five stage process. The stages in this process are kpi accounting.
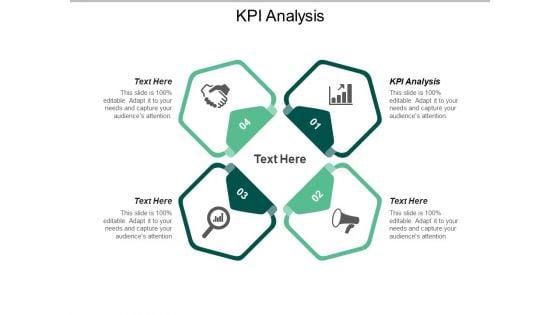
Kpi Analysis Ppt PowerPoint Presentation Show Cpb
This is a kpi analysis ppt powerpoint presentation show cpb. This is a four stage process. The stages in this process are kpi analysis.
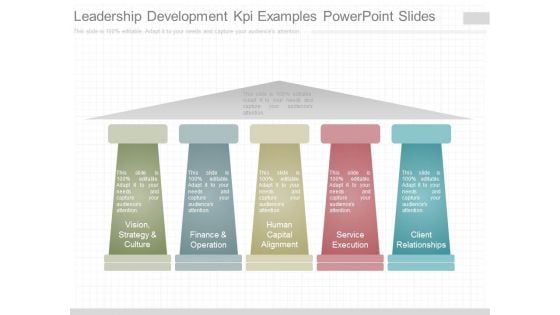
Leadership Development Kpi Examples Powerpoint Slides
This is a leadership development kpi examples powerpoint slides. This is a five stage process. The stages in this process are vision, strategy and culture, finance and operation, human capital alignment, service execution, client relationships.

Inventory KPI Powerpoint Ppt Template Bundles
This Inventory Key Performance Indicators, Stock KPIs, Stock Metrics, Supply Chain KPIs, Metrics-slide Inventory KPI Powerpoint Ppt Template Bundles is your content ready tool to impress the stakeholders with your business planning and its manner of execution. Showcase your ideas and how you plan to make them real in detail with this PPT Template Bundle. The slides have the conceptual bandwidth to present the crucial aspects of your plan, such as funding, marketing, resource allocation, timeline, roadmap, and more. When you present your plans with this PPT Layout, the stakeholders are sure to come on board because you will be able to present a succinct, thought-out, winning project. Download this Complete Deck now to take control into your hands. The 100 percent customizable offer is just too good to be resisted. Key performance indicators KPIs in inventory management are measures that assists to monitor and make choices about your stock. Our Inventory KPI Powerpoint PPT Template Bundles are topically designed to provide an attractive backdrop to any subject.
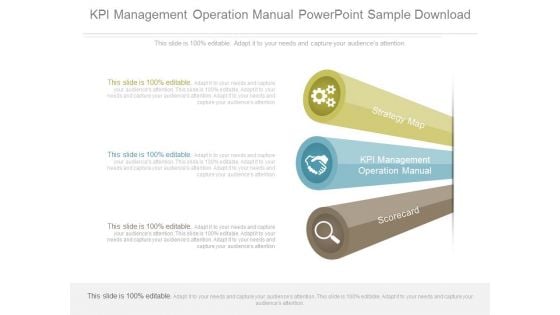
Kpi Management Operation Manual Powerpoint Sample Download
This is a kpi management operation manual powerpoint sample download. This is a three stage process. The stages in this process are strategy map, kpi management operation manual, scorecard.
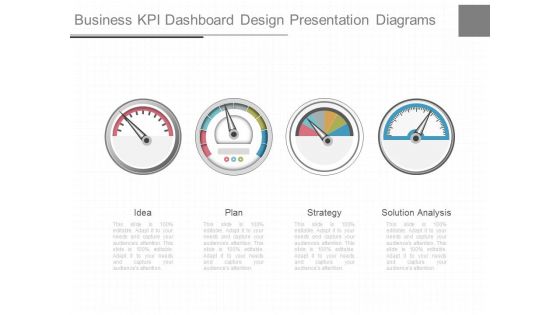
Business Kpi Dashboard Design Presentation Diagrams
This is a business kpi dashboard design presentation diagrams. This is a four stage process. The stages in this process are idea, plan, strategy, solution analysis.
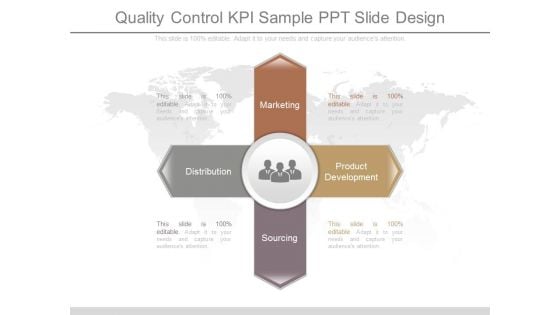
Quality Control Kpi Sample Ppt Slide Design
This is a quality control kpi sample ppt slide design. This is a four stage process. The stages in this process are marketing, distribution, product development, sourcing.
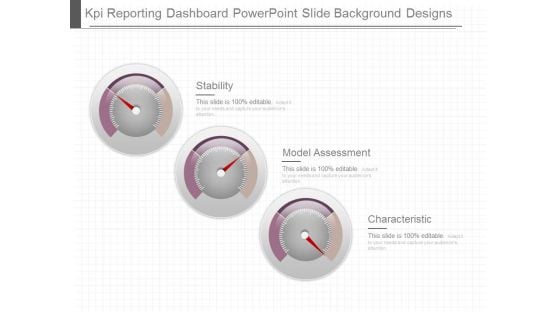
Kpi Reporting Dashboard Powerpoint Slide Background Designs
This is a kpi reporting dashboard powerpoint slide background designs. This is a three stage process. The stages in this process are stability, model assessment, characteristic.
Kpi With Business Planning Presentation Pictures
This is a kpi with business planning presentation pictures. This is a eight stage process. The stages in this process are marketing, business, management.
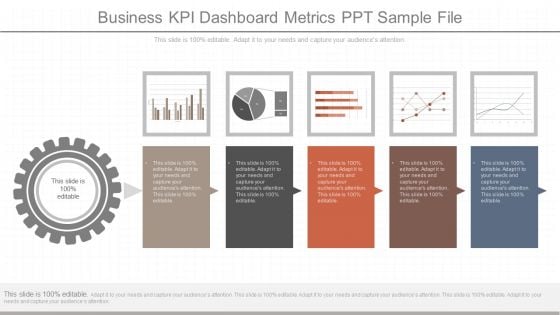
Business Kpi Dashboard Metrics Ppt Sample File
This is a business kpi dashboard metrics ppt sample file. This is a five stage process. The stages in this process are business, finance, management, success, marketing, presentation.

ITIL Incident Regulation Kpi Dashboard Background PDF
This slide covers ITIL problem management KPI dashboard to track status of problems. It involves KPI such as total number of incidents, problems, requests, average time to solve incidents.Pitch your topic with ease and precision using this ITIL Incident Regulation Kpi Dashboard Background PDF. This layout presents information on Active Problems, Average Incidents, Opened Problems. It is also available for immediate download and adjustment. So, changes can be made in the color, design, graphics or any other component to create a unique layout.
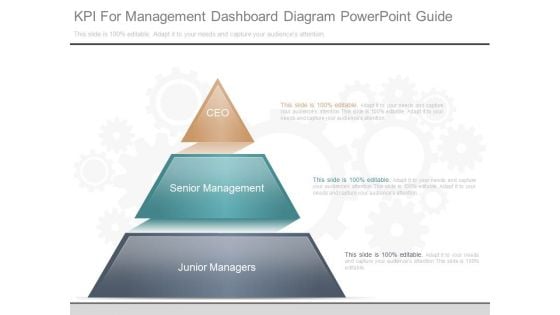
Kpi For Management Dashboard Diagram Powerpoint Guide
This is a kpi for management dashboard diagram powerpoint guide. This is a three stage process. The stages in this process are ceo, senior management, junior managers.
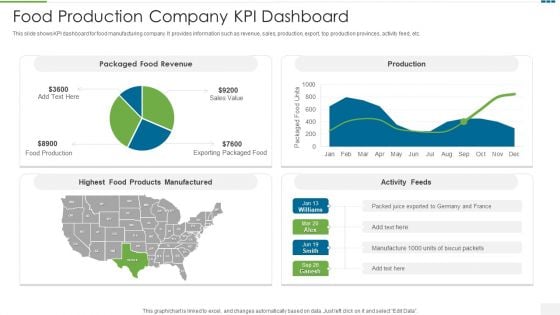
Food Production Company KPI Dashboard Formats PDF
This slide shows KPI dashboard for food manufacturing company. It provides information such as revenue, sales, production, export, top production provinces, activity feed, etc.Showcasing this set of slides titled food production company kpi dashboard formats pdf The topics addressed in these templates are food production company kpi dashboard All the content presented in this PPT design is completely editable. Download it and make adjustments in color, background, font etc. as per your unique business setting.
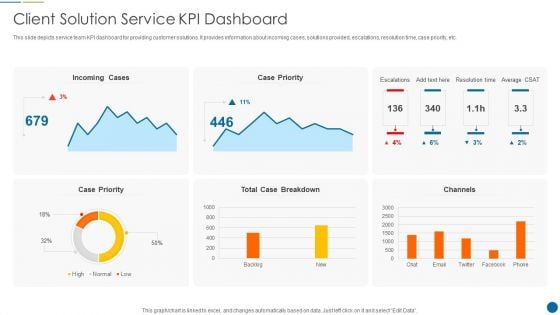
Client Solution Service Kpi Dashboard Sample PDF
This slide depicts service team KPI dashboard for providing customer solutions. It provides information about incoming cases, solutions provided, escalations, resolution time, case priority, etc. Showcasing this set of slides titled Client Solution Service Kpi Dashboard Sample PDF. The topics addressed in these templates are Client Solution Service KPI Dashboard. All the content presented in this PPT design is completely editable. Download it and make adjustments in color, background, font etc. as per your unique business setting
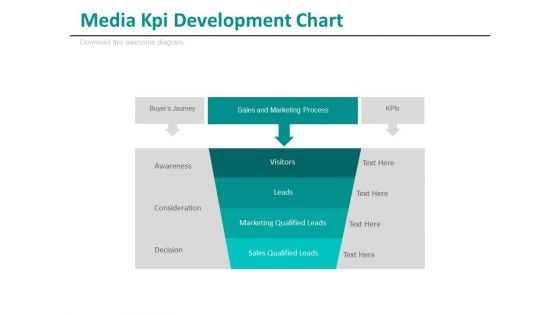
Media Kpi Development Chart Ppt Slides
This is a media KPI development chart ppt slides. This is a one stage process. The stages in this process are business, media, success.
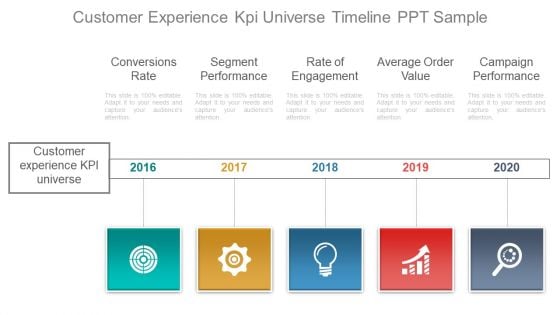
Customer Experience Kpi Universe Timeline Ppt Sample
This is a customer experience kpi universe timeline ppt sample. This is a five stage process. The stages in this process are time planning, business, marketing.
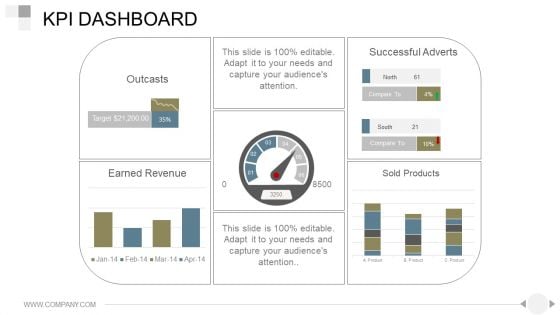
Kpi Dashboard Ppt PowerPoint Presentation Good
This is a kpi dashboard ppt powerpoint presentation good. This is a one stage process. The stages in this process are outcasts, earned revenue, successful adverts, sold products.
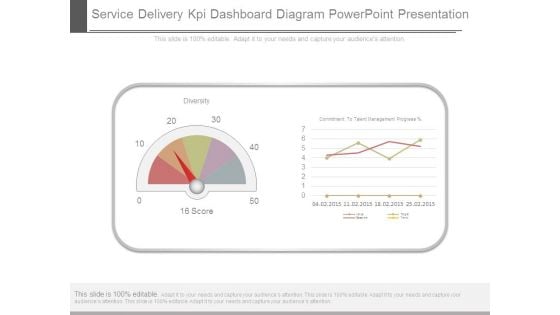
Service Delivery Kpi Dashboard Diagram Powerpoint Presentation
This is a service delivery kpi dashboard diagram powerpoint presentation. This is a two stage process. The stages in this process are diversity, commitment to talent management progress.
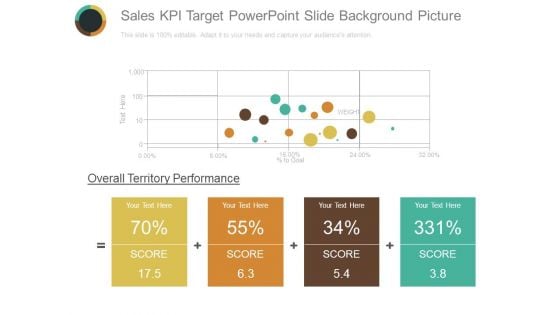
Sales Kpi Target Powerpoint Slide Background Picture
This is a sales kpi target powerpoint slide background picture. This is a four stage process. The stages in this process are business, management, marketing, finance, strategy.
Manager Checking PMO KPI Dashboard Mockup PDF
Persuade your audience using this Manager Checking PMO KPI Dashboard Mockup PDF This PPT design covers three stages, thus making it a great tool to use. It also caters to a variety of topics including Manager Checking, Pmo Kpi Dashboard Download this PPT design now to present a convincing pitch that not only emphasizes the topic but also showcases your presentation skills.
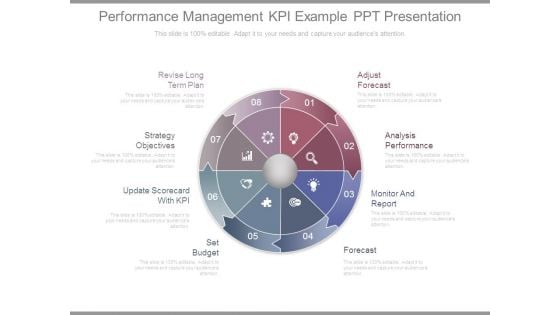
Performance Management Kpi Example Ppt Presentation
This is a performance management kpi example ppt presentation. This is a eight stage process. The stages in this process are revise long term plan, strategy objectives, update scorecard with kpi, set budget, forecast, monitor and report, analysis performance, adjust forecast.
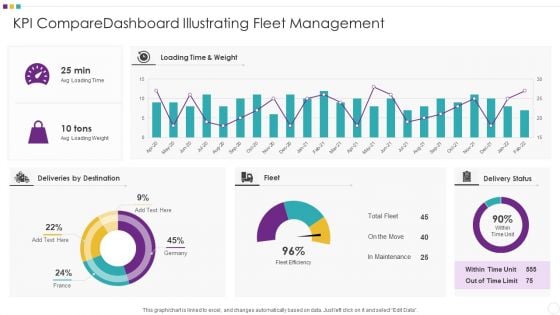
KPI Comparedashboard Illustrating Fleet Management Clipart PDF
Pitch your topic with ease and precision using this KPI Comparedashboard Illustrating Fleet Management Clipart PDF This layout presents information on KPI Comparedashboard Illustrating Fleet Management It is also available for immediate download and adjustment. So, changes can be made in the color, design, graphics or any other component to create a unique layout.
KPI Dashboard Metrics Security Icon Download PDF
Persuade your audience using this KPI Dashboard Metrics Security Icon Download PDF. This PPT design covers two stages, thus making it a great tool to use. It also caters to a variety of topics including Kpi Dashboard, Metrics Security Icon. Download this PPT design now to present a convincing pitch that not only emphasizes the topic but also showcases your presentation skills.
Consumer Demand Kpi Measurement Icon Clipart PDF
Showcasing this set of slides titled Consumer Demand Kpi Measurement Icon Clipart PDF. The topics addressed in these templates are Consumer Demand KPI Measurement Icon. All the content presented in this PPT design is completely editable. Download it and make adjustments in color, background, font etc. as per your unique business setting.

Sales Employee Kpi Progress Evaluation Ideas Pdf
This slide showcase performance indicators for progress review which helps in improving employee engagement and achieving results faster. It include indicators such as number of sales, conversion rate, lead generation and client acquisition rate. Pitch your topic with ease and precision using this Sales Employee Kpi Progress Evaluation Ideas Pdf This layout presents information on Meeting Conversion Rate, Conversion Rate, Lead Generation It is also available for immediate download and adjustment. So, changes can be made in the color, design, graphics or any other component to create a unique layout. This slide showcase performance indicators for progress review which helps in improving employee engagement and achieving results faster. It include indicators such as number of sales, conversion rate, lead generation and client acquisition rate.
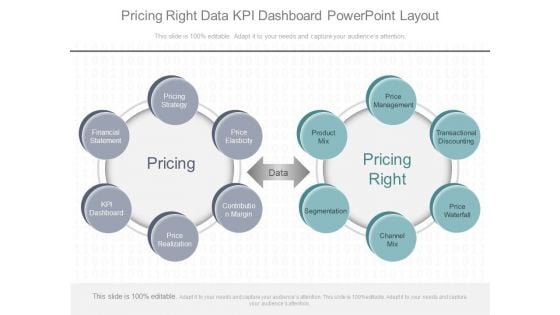
Pricing Right Data Kpi Dashboard Powerpoint Layout
This is a pricing right data kpi dashboard powerpoint layout. This is a two stage process. The stages in this process are price management, transactional discounting, price waterfall, channel mix, segmentation, product mix, price elasticity, contribution margin, price realization, kpi dashboard, financial statement, pricing, data, pricing right.
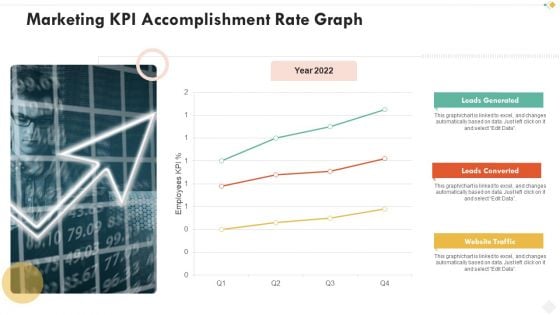
Marketing Kpi Accomplishment Rate Graph Mockup PDF
Showcasing this set of slides titled marketing kpi accomplishment rate graph mockup pdf. The topics addressed in these templates are marketing kpi accomplishment rate graph. All the content presented in this PPT design is completely editable. Download it and make adjustments in color, background, font etc. as per your unique business setting.
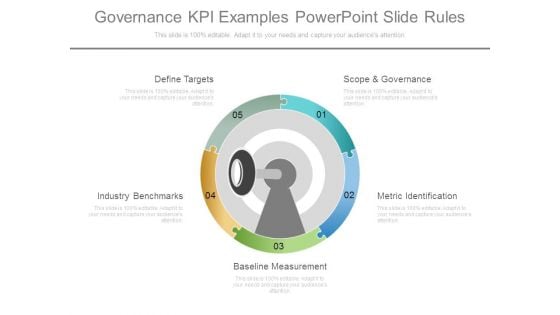
Governance Kpi Examples Powerpoint Slide Rules
This is a governance kpi examples powerpoint slide rules. This is a five stage process. The stages in this process are define targets, scope and governance, industry benchmarks, metric identification, baseline measurement.
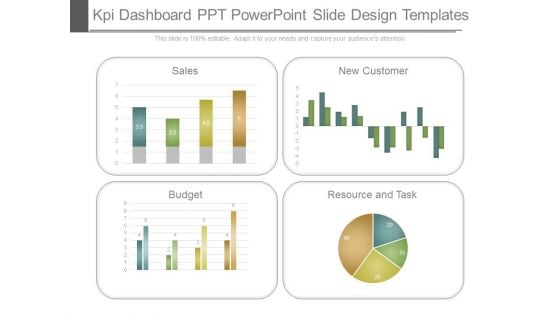
Kpi Dashboard Ppt Powerpoint Slide Design Templates
This is a kpi dashboard ppt powerpoint slide design templates. This is a four stage process. The stages in this process are sales, new customer, budget, resource and task.
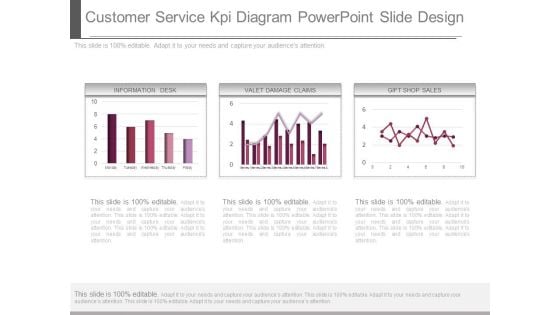
Customer Service Kpi Diagram Powerpoint Slide Design
This is a customer service kpi diagram powerpoint slide design. This is a three stage process. The stages in this process are information desk, valet damage claims, gift shop sales.
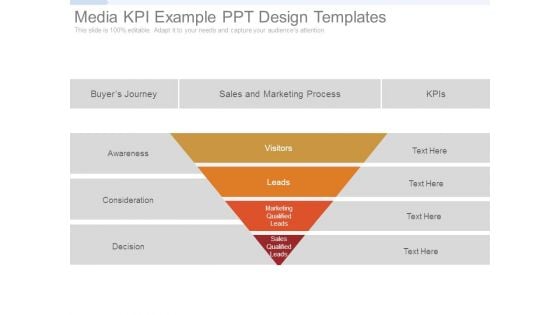
Media Kpi Example Ppt Design Templates
This is a media kpi example ppt design templates. This is a four stage process. The stages in this process are awareness, consideration, decision, visitors, leads, buyer journey, sales and marketing process, kpis, marketing qualified leads, sales qualified leads.

Kpi Engineering Process Cycle Diagram Ppt Sample
This is a kpi engineering process cycle diagram ppt sample. This is a six stage process. The stages in this process are program discovery, database optimization, program implementation, program delivery, program maintenance, analysis and reporting.
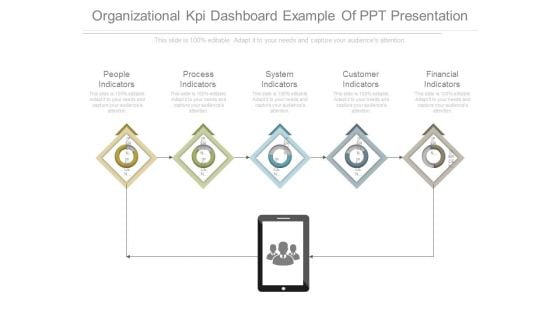
Organizational Kpi Dashboard Example Of Ppt Presentation
This is a organizational kpi dashboard example of ppt presentation. This is a five stage process. The stages in this process are people indicators, process indicators, system indicators, customer indicators, financial indicators.
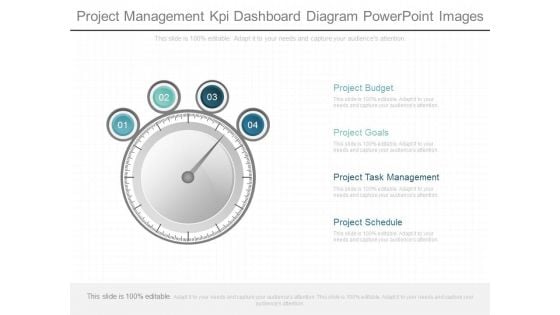
Project Management Kpi Dashboard Diagram Powerpoint Images
This is a project management kpi dashboard diagram powerpoint images. This is a four stage process. The stages in this process are project budget, project goals, project task management, project schedule.
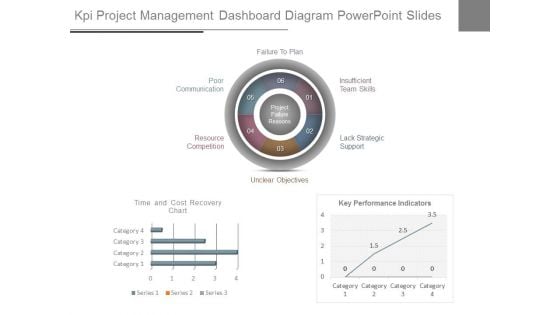
Kpi Project Management Dashboard Diagram Powerpoint Slides
This is a kpi project management dashboard diagram powerpoint slides. This is a three stage process. The stages in this process are unclear objectives, resource competition, poor communication, failure to plan, insufficient team skills, lack strategic support.
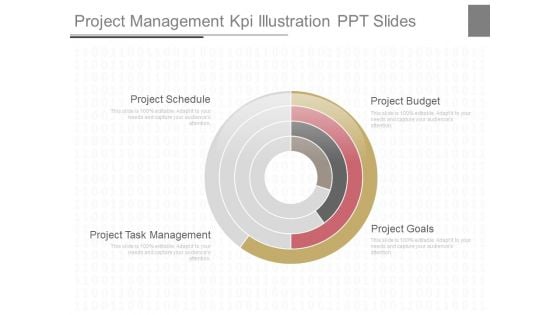
Project Management Kpi Illustration Ppt Slides
This is a project management kpi illustration ppt slides. This is a four stage process. The stages in this process are project schedule, project task management, project budget, project goals.
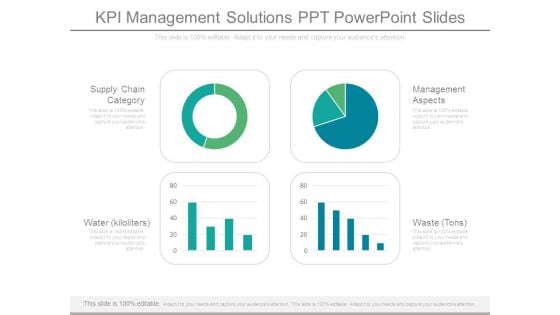
Kpi Management Solutions Ppt Powerpoint Slides
This is a kpi management solutions ppt powerpoint slides. This is a four stage process. The stages in this process are supply chain category, water kiloliters, waste tons, management aspects.
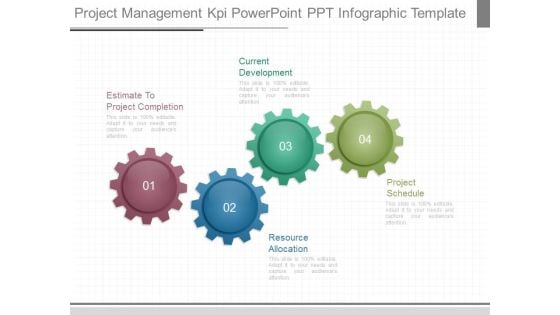
Project Management Kpi Powerpoint Ppt Infographic Template
This is a project management kpi powerpoint ppt infographic template. This is a four stage process. The stages in this process are estimate to project completion, resource allocation, current development, project schedule.
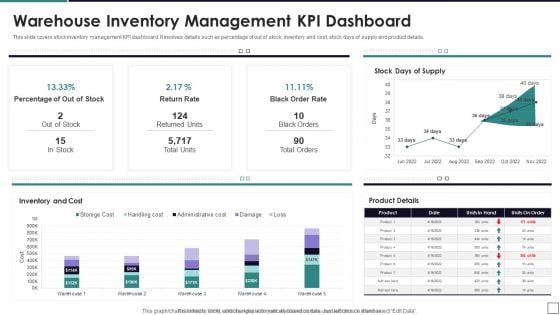
Warehouse Inventory Management KPI Dashboard Information PDF
This slide covers stock inventory management KPI dashboard. It involves details such as percentage of out of stock, inventory and cost, stock days of supply and product details. Showcasing this set of slides titled Warehouse Inventory Management KPI Dashboard Information PDF. The topics addressed in these templates are Inventory And Cost, Return Rate, Out Of Stock. All the content presented in this PPT design is completely editable. Download it and make adjustments in color, background, font etc. as per your unique business setting.

Scorecard Table With Kpi PowerPoint Presentation Template
Brace Yourself, Arm Your Thoughts. Prepare For The Hustle With Our Scorecard Table With KPI PowerPoint Presentation Template Powerpoint Templates. Generate Ecstasy With Our Marketing Plan Powerpoint Templates. Your Thoughts Will Delight Your Audience.
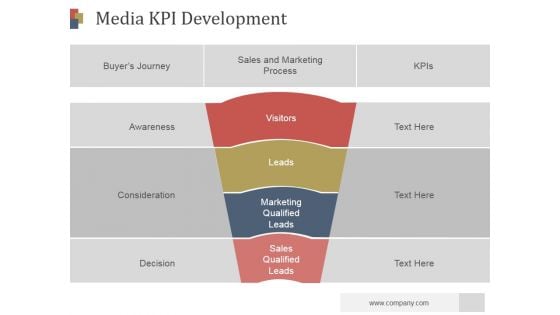
Media Kpi Development Ppt PowerPoint Presentation Themes
This is a media kpi development ppt powerpoint presentation themes. This is a four stage process. The stages in this process are buyers journey, visitors, leads, marketing qualified leads, sales qualified leads.
Team Kpi Tracker Ppt PowerPoint Presentation Templates
This is a team kpi tracker ppt powerpoint presentation templates. This is a eight stage process. The stages in this process are no answer, successful, call busy, disconnected, wrong number, demo booked.
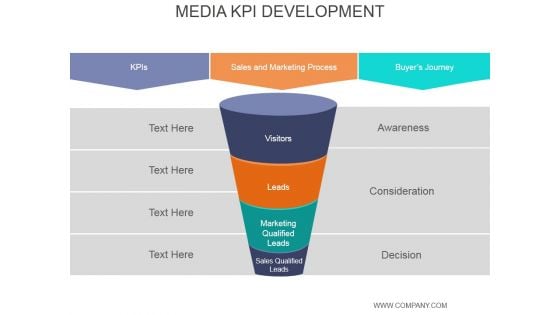
Media Kpi Development Ppt PowerPoint Presentation Portfolio
This is a media kpi development ppt powerpoint presentation portfolio. This is a five stage process. The stages in this process are awareness, consideration, decision, sales qualified leads, marketing qualified, leads, visitors.
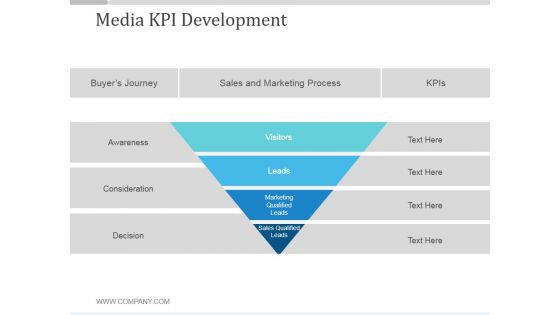
Media Kpi Development Ppt PowerPoint Presentation Gallery
This is a media kpi development ppt powerpoint presentation gallery. This is a four stage process. The stages in this process are visitors, leads, marketing qualified leads, sales qualified leads, buyers journey, sales and marketing process.
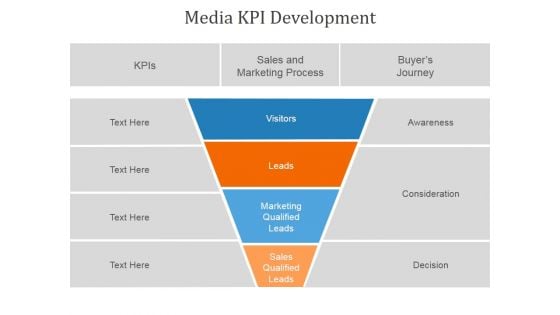
Media Kpi Development Ppt PowerPoint Presentation Slides
This is a media kpi development ppt powerpoint presentation slides. This is a four stage process. The stages in this process are sales and marketing process, visitors, leads, marketing qualified leads, sales qualified leads.
KPI Dashboard Of Client Support Icons PDF
This slide shows customer service delivery key performance indicators dashboard. It includes KPIs such as issues received, average time to close issues, first call resolution, top performers, etc. Pitch your topic with ease and precision using this KPI Dashboard Of Client Support Icons PDF. This layout presents information on KPI Dashboard, Client Support. It is also available for immediate download and adjustment. So, changes can be made in the color, design, graphics or any other component to create a unique layout.
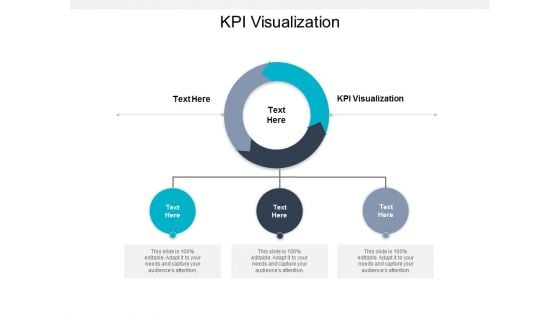
KPI Visualization Ppt PowerPoint Presentation Show Cpb
Presenting this set of slides with name kpi visualization ppt powerpoint presentation show cpb. This is an editable Powerpoint three stages graphic that deals with topics like kpi visualization to help convey your message better graphically. This product is a premium product available for immediate download and is 100 percent editable in Powerpoint. Download this now and use it in your presentations to impress your audience.

Customer Need Assessment Kpi Dashboard Infographics PDF
The following slide highlights the spas to assess customers changing needs and make strategies to improve. It consists of NPS, responses, weekly variations in needs, positive and negative feedback etc. Showcasing this set of slides titled customer need assessment kpi dashboard infographics pdf. The topics addressed in these templates are customer need assessment kpi dashboard. All the content presented in this PPT design is completely editable. Download it and make adjustments in color, background, font etc. as per your unique business setting.
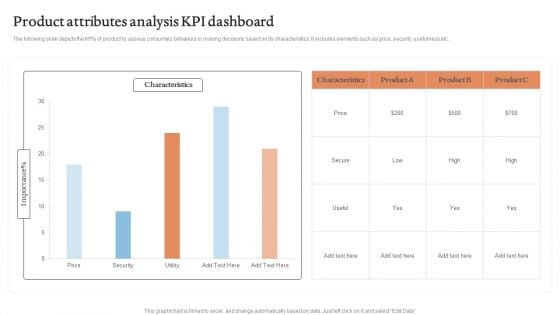
Product Attributes Analysis KPI Dashboard Graphics PDF
The following slide depicts the KPIs of product to assess consumers behaviour in making decisions based on its characteristics. It includes elements such as price, security, usefulness etc.Showcasing this set of slides titled Product Attributes Analysis KPI Dashboard Graphics PDF. The topics addressed in these templates are Characteristics, Product Attributes, Analysis KPI Dashboard. All the content presented in this PPT design is completely editable. Download it and make adjustments in color, background, font etc. as per your unique business setting.


 Continue with Email

 Home
Home


