Executive Kpi
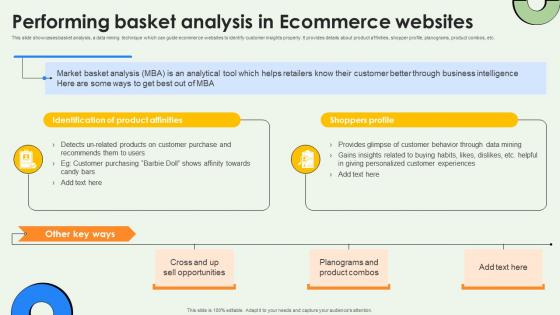
Data Warehousing And Performing Basket Analysis In Ecommerce Websites AI SS V
This slide showcases basket analysis, a data mining technique which can guide ecommerce websites to identify customer insights properly. It provides details about product affinities, shopper profile, planograms, product combos, etc. If you are looking for a format to display your unique thoughts, then the professionally designed Data Warehousing And Performing Basket Analysis In Ecommerce Websites AI SS V is the one for you. You can use it as a Google Slides template or a PowerPoint template. Incorporate impressive visuals, symbols, images, and other charts. Modify or reorganize the text boxes as you desire. Experiment with shade schemes and font pairings. Alter, share or cooperate with other people on your work. Download Data Warehousing And Performing Basket Analysis In Ecommerce Websites AI SS V and find out how to give a successful presentation. Present a perfect display to your team and make your presentation unforgettable. This slide showcases basket analysis, a data mining technique which can guide ecommerce websites to identify customer insights properly. It provides details about product affinities, shopper profile, planograms, product combos, etc.
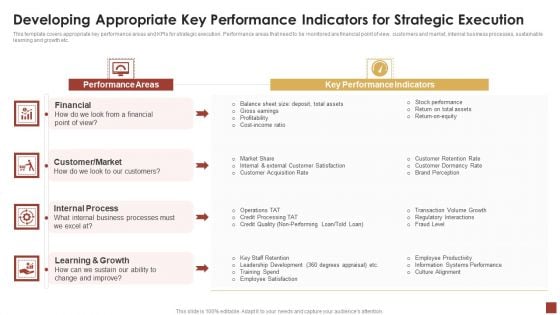
Strategical And Tactical Planning Developing Appropriate Key Performance Indicators Brochure PDF
This template covers appropriate key performance areas and KPIs for strategic execution. Performance areas that need to be monitored are financial point of view, customers and market, internal business processes, sustainable learning and growth etc. Deliver an awe inspiring pitch with this creative Strategical And Tactical Planning Developing Appropriate Key Performance Indicators Brochure PDF bundle. Topics like Performance Areas, Key Performance Indicators, Financial can be discussed with this completely editable template. It is available for immediate download depending on the needs and requirements of the user.
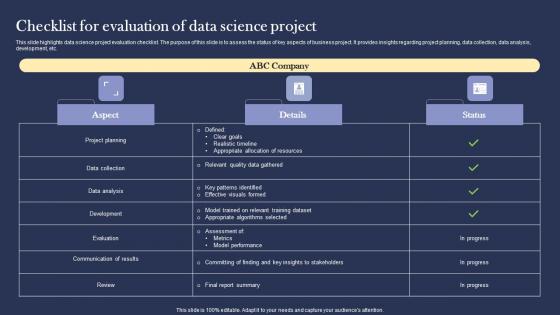
Checklist For Evaluation Of Data Science Project Ideas pdf
This slide highlights data science project evaluation checklist. The purpose of this slide is to assess the status of key aspects of business project. It provides insights regarding project planning, data collection, data analysis, development, etc. Pitch your topic with ease and precision using this Checklist For Evaluation Of Data Science Project Ideas pdf. This layout presents information on Data Collection, Data Analysis, Development. It is also available for immediate download and adjustment. So, changes can be made in the color, design, graphics or any other component to create a unique layout. This slide highlights data science project evaluation checklist. The purpose of this slide is to assess the status of key aspects of business project. It provides insights regarding project planning, data collection, data analysis, development, etc.
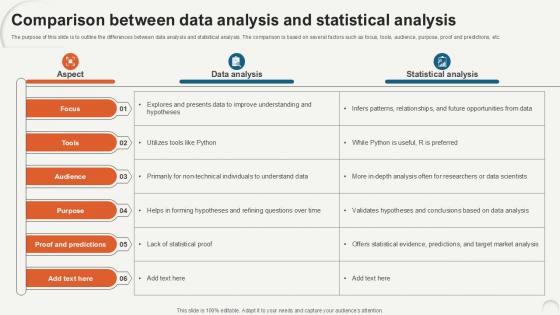
Comparison Between Data Analytics For Informed Decision Ppt Presentation
The purpose of this slide is to outline the differences between data analysis and statistical analysis. The comparison is based on several factors such as focus, tools, audience, purpose, proof and predictions, etc. From laying roadmaps to briefing everything in detail, our templates are perfect for you. You can set the stage with your presentation slides. All you have to do is download these easy-to-edit and customizable templates. Comparison Between Data Analytics For Informed Decision Ppt Presentation will help you deliver an outstanding performance that everyone would remember and praise you for. Do download this presentation today. The purpose of this slide is to outline the differences between data analysis and statistical analysis. The comparison is based on several factors such as focus, tools, audience, purpose, proof and predictions, etc.
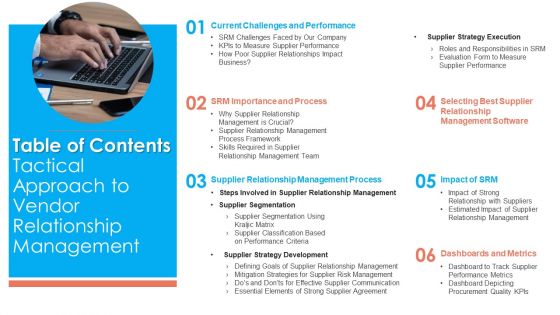
Table Of Contents Tactical Approach To Vendor Relationship Management Topics PDF
This is a Table Of Contents Tactical Approach To Vendor Relationship Management Topics PDF template with various stages. Focus and dispense information on six stages using this creative set, that comes with editable features. It contains large content boxes to add your information on topics like Supplier Strategy Execution, Impact Of SRM, Dashboards And Metrics You can also showcase facts, figures, and other relevant content using this PPT layout. Grab it now.
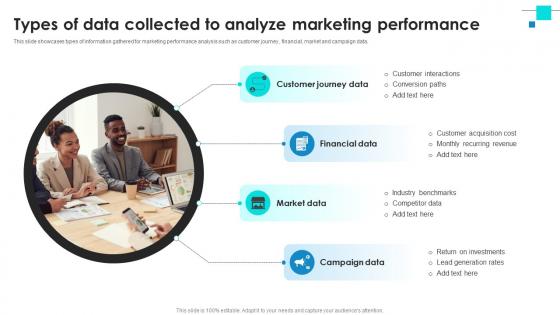
Project Benchmarking Process Types Of Data Collected To Analyze Marketing Performance CRP DK SS V
This slide showcases types of information gathered for marketing performance analysis such as customer journey , financial, market and campaign data. Slidegeeks is here to make your presentations a breeze with Project Benchmarking Process Types Of Data Collected To Analyze Marketing Performance CRP DK SS V With our easy-to-use and customizable templates, you can focus on delivering your ideas rather than worrying about formatting. With a variety of designs to choose from, you are sure to find one that suits your needs. And with animations and unique photos, illustrations, and fonts, you can make your presentation pop. So whether you are giving a sales pitch or presenting to the board, make sure to check out Slidegeeks first This slide showcases types of information gathered for marketing performance analysis such as customer journey , financial, market and campaign data.
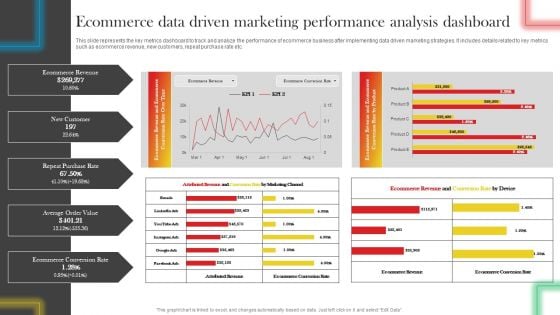
Ecommerce Data Driven Marketing Performance Analysis Dashboard Professional PDF
This slide represents the key metrics dashboard to track and analyze the performance of ecommerce business after implementing data driven marketing strategies. It includes details related to key metrics such as ecommerce revenue, new customers, repeat purchase rate etc. Get a simple yet stunning designed Ecommerce Data Driven Marketing Performance Analysis Dashboard Professional PDF. It is the best one to establish the tone in your meetings. It is an excellent way to make your presentations highly effective. So, download this PPT today from Slidegeeks and see the positive impacts. Our easy-to-edit Ecommerce Data Driven Marketing Performance Analysis Dashboard Professional PDF can be your go-to option for all upcoming conferences and meetings. So, what are you waiting for Grab this template today.
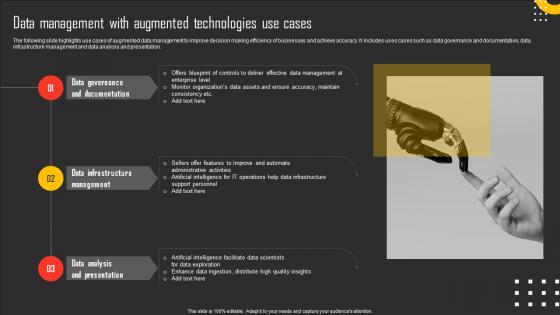
Data Management With Augmented Technologies Use Cases Brochure Pdf
The following slide highlights use cases of augmented data management to improve decision making efficiency of businesses and achieve accuracy. It includes uses cases such as data governance and documentation, data infrastructure management and data analysis and presentation. Pitch your topic with ease and precision using this Data Management With Augmented Technologies Use Cases Brochure Pdf. This layout presents information on Data Governance Documentation, Data Infrastructure Management, Data Analysis Presentation. It is also available for immediate download and adjustment. So, changes can be made in the color, design, graphics or any other component to create a unique layout. The following slide highlights use cases of augmented data management to improve decision making efficiency of businesses and achieve accuracy. It includes uses cases such as data governance and documentation, data infrastructure management and data analysis and presentation.

Business Diagram Business Bar Graph For Data Analysis Presentation Template
This business slide displays pie charts with percentage ratios. This diagram is a data visualization tool that gives you a simple way to present statistical information. This slide helps your audience examines and interprets the data you present.
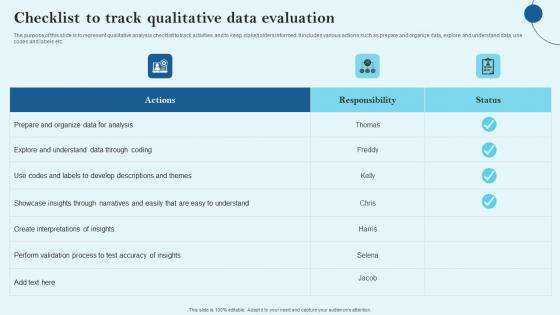
Checklist To Track Qualitative Data Evaluation Microsoft Pdf
The purpose of this slide is to represent qualitative analysis checklist to track activities and to keep stakeholders informed. It includes various actions such as prepare and organize data, explore and understand data, use codes and labels etc. Pitch your topic with ease and precision using this Checklist To Track Qualitative Data Evaluation Microsoft Pdf This layout presents information on Prepare And Organize, Data For Analysis, Responsibility It is also available for immediate download and adjustment. So, changes can be made in the color, design, graphics or any other component to create a unique layout. The purpose of this slide is to represent qualitative analysis checklist to track activities and to keep stakeholders informed. It includes various actions such as prepare and organize data, explore and understand data, use codes and labels etc.
Finance Management Metrics Ppt Slide Templates
This is a finance management metrics ppt slide templates. This is a nine stage process. The stages in this process are business, marketing, management, table.
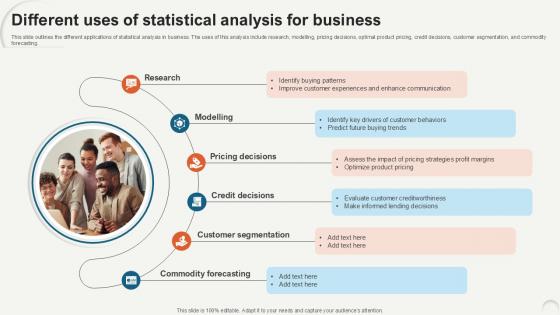
Different Uses Of Statistical Data Analytics For Informed Decision Ppt Slide
This slide outlines the different applications of statistical analysis in business. The uses of this analysis include research, modelling, pricing decisions, optimal product pricing, credit decisions, customer segmentation, and commodity forecasting. If your project calls for a presentation, then Slidegeeks is your go-to partner because we have professionally designed, easy-to-edit templates that are perfect for any presentation. After downloading, you can easily edit Different Uses Of Statistical Data Analytics For Informed Decision Ppt Slide and make the changes accordingly. You can rearrange slides or fill them with different images. Check out all the handy templates This slide outlines the different applications of statistical analysis in business. The uses of this analysis include research, modelling, pricing decisions, optimal product pricing, credit decisions, customer segmentation, and commodity forecasting.
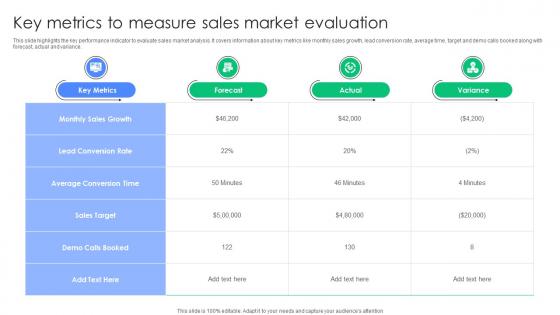
Key Metrics To Measure Sales Market Evaluation Portrait Pdf
This slide highlights the key performance indicator to evaluate sales market analysis. It covers information about key metrics like monthly sales growth, lead conversion rate, average time, target and demo calls booked along with forecast, actual and variance. Showcasing this set of slides titled Key Metrics To Measure Sales Market Evaluation Portrait Pdf. The topics addressed in these templates are Monthly Sales Growth, Lead Conversion Rate, Sales Target. All the content presented in this PPT design is completely editable. Download it and make adjustments in color, background, font etc. as per your unique business setting. This slide highlights the key performance indicator to evaluate sales market analysis. It covers information about key metrics like monthly sales growth, lead conversion rate, average time, target and demo calls booked along with forecast, actual and variance.
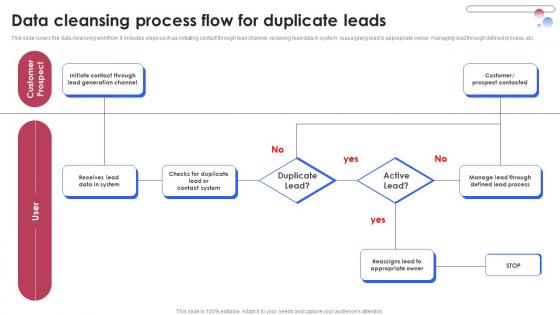
Data Cleansing Process Flow For Duplicate Various Techniques For Managing Professional PDF
This slide covers a comparative analysis of top lead management software. It includes comparison basis such as rating, pricing, NPS score, payback period, implementation time, auto profile enrichment, webforms, lead scoring, etc. Whether you have daily or monthly meetings, a brilliant presentation is necessary. Data Cleansing Process Flow For Duplicate Various Techniques For Managing Professional PDF can be your best option for delivering a presentation. Represent everything in detail using Data Cleansing Process Flow For Duplicate Various Techniques For Managing Professional PDF and make yourself stand out in meetings. The template is versatile and follows a structure that will cater to your requirements. All the templates prepared by Slidegeeks are easy to download and edit. Our research experts have taken care of the corporate themes as well. So, give it a try and see the results. This slide covers a comparative analysis of top lead management software. It includes comparison basis such as rating, pricing, NPS score, payback period, implementation time, auto profile enrichment, webforms, lead scoring, etc.
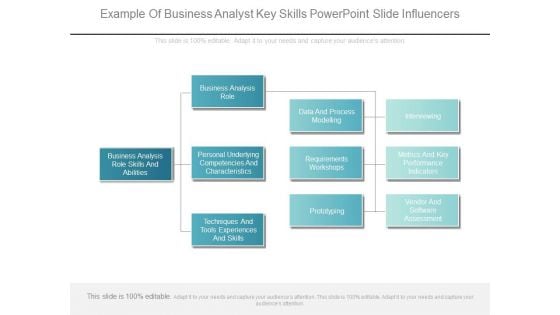
Example Of Business Analyst Key Skills Powerpoint Slide Influencers
This is a example of business analyst key skills powerpoint slide influencers. This is a three stage process. The stages in this process are business analysis role skills and abilities, business analysis role, personal underlying competencies and characteristics, techniques and tools experiences and skills, data and process modelling, requirements workshops, prototyping, interviewing, metrics and key performance indicators, vendor and software assessment.
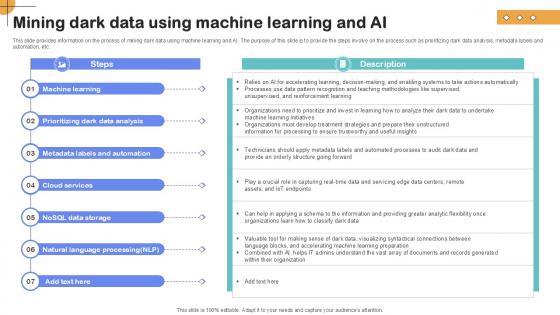
Mining Dark Data Using Machine Importance Of Unstructured Data Ppt PowerPoint
This slide provides information on the process of mining dark data using machine learning and AI. The purpose of this slide is to provide the steps involve on the process such as prioritizing dark data analysis, metadata labels and automation, etc.Retrieve professionally designed Mining Dark Data Using Machine Importance Of Unstructured Data Ppt PowerPoint to effectively convey your message and captivate your listeners. Save time by selecting pre-made slideshows that are appropriate for various topics, from business to educational purposes. These themes come in many different styles, from creative to corporate, and all of them are easily adjustable and can be edited quickly. Access them as PowerPoint templates or as Google Slides themes. You do not have to go on a hunt for the perfect presentation because Slidegeeks got you covered from everywhere. This slide provides information on the process of mining dark data using machine learning and AI. The purpose of this slide is to provide the steps involve on the process such as prioritizing dark data analysis, metadata labels and automation, etc.
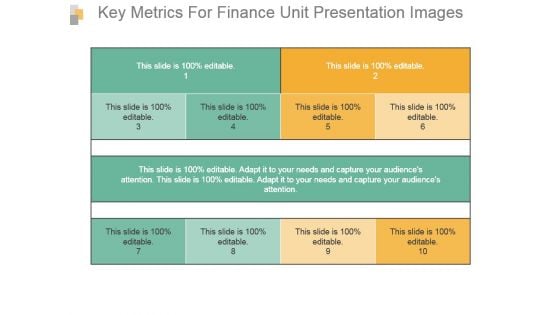
Key Metrics For Finance Unit Presentation Images
This is a key metrics for finance unit presentation images. This is a three stage process. The stages in this process are business, management, strategy, finance unit, marketing.
Email Marketing Software To Enhance Data Collection And Management Ppt Icon Example File Pdf
This slide presents a comparative analysis of email marketing software that enables customer data collection and data management. It includes features such as CRM, email verification, SMS automation, and campaign management. Pitch your topic with ease and precision using this Email Marketing Software To Enhance Data Collection And Management Ppt Icon Example File Pdf. This layout presents information on CRM, Email Verification, SMS Automation, Campaign Management. It is also available for immediate download and adjustment. So, changes can be made in the color, design, graphics or any other component to create a unique layout. This slide presents a comparative analysis of email marketing software that enables customer data collection and data management. It includes features such as CRM, email verification, SMS automation, and campaign management.
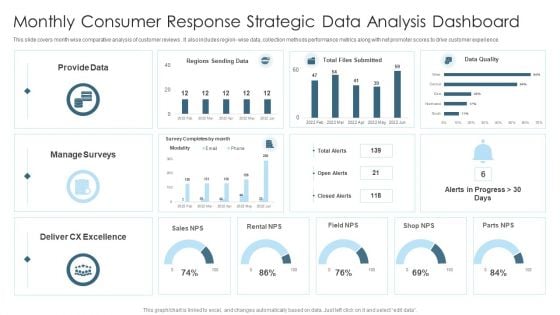
Monthly Consumer Response Strategic Data Analysis Dashboard Graphics PDF
This slide covers month wise comparative analysis of customer reviews . It also includes region wise data, collection methods performance metrics along with net promoter scores to drive customer experience. Showcasing this set of slides titled Monthly Consumer Response Strategic Data Analysis Dashboard Graphics PDF. The topics addressed in these templates are Provide Data, Sales, Manage Surveys. All the content presented in this PPT design is completely editable. Download it and make adjustments in color, background, font etc. as per your unique business setting.

Before Vs After Data Integration Implementation Data Integration Strategies For Business
This slide showcases the comparative analysis of the before versus after data integration implementation. The purpose of this slide is to discuss the different performance aspects and how data management has proved beneficial for these aspects. Get a simple yet stunning designed Before Vs After Data Integration Implementation Data Integration Strategies For Business. It is the best one to establish the tone in your meetings. It is an excellent way to make your presentations highly effective. So, download this PPT today from Slidegeeks and see the positive impacts. Our easy-to-edit Before Vs After Data Integration Implementation Data Integration Strategies For Business can be your go-to option for all upcoming conferences and meetings. So, what are you waiting for Grab this template today. This slide showcases the comparative analysis of the before versus after data integration implementation. The purpose of this slide is to discuss the different performance aspects and how data management has proved beneficial for these aspects.
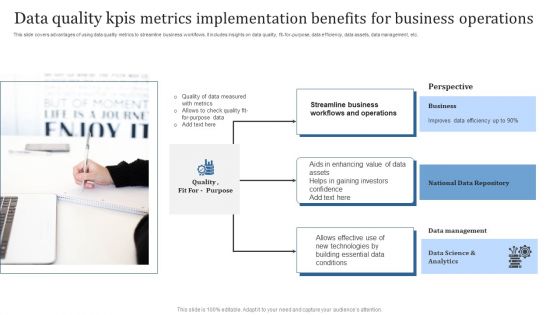
Data Quality Kpis Metrics Implementation Benefits For Business Operations Formats PDF
This slide covers advantages of using data quality metrics to streamline business workflows. It includes insights on data quality, fit-for-purpose, data efficiency, data assets, data management, etc. Presenting Data Quality Kpis Metrics Implementation Benefits For Business Operations Formats PDF to dispense important information. This template comprises Three stages. It also presents valuable insights into the topics including Business, National Data Repository, Data Management. This is a completely customizable PowerPoint theme that can be put to use immediately. So, download it and address the topic impactfully.
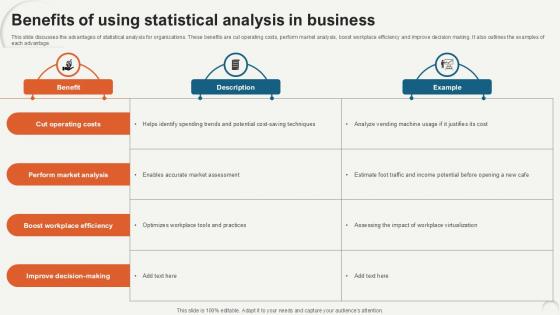
Benefits Of Using Statistical Data Analytics For Informed Decision Ppt PowerPoint
This slide discusses the advantages of statistical analysis for organizations. These benefits are cut operating costs, perform market analysis, boost workplace efficiency and improve decision making. It also outlines the examples of each advantage. Want to ace your presentation in front of a live audience Our Benefits Of Using Statistical Data Analytics For Informed Decision Ppt PowerPoint can help you do that by engaging all the users towards you. Slidegeeks experts have put their efforts and expertise into creating these impeccable powerpoint presentations so that you can communicate your ideas clearly. Moreover, all the templates are customizable, and easy-to-edit and downloadable. Use these for both personal and commercial use. This slide discusses the advantages of statistical analysis for organizations. These benefits are cut operating costs, perform market analysis, boost workplace efficiency and improve decision making. It also outlines the examples of each advantage.

Plan And Frame Problem Collect The Data Ppt Sample
This is a plan and frame problem collect the data ppt sample. This is a four stage process. The stages in this process are business, marketing, success.
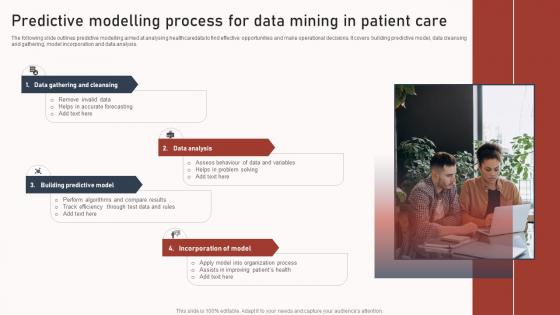
Predictive Modelling Process For Data Mining In Patient Care Slides Pdf
The following slide outlines predictive modelling aimed at analysing healthcaredata to find effective opportunities and make operational decisions. It covers building predictive model, data cleansing and gathering, model incorporation and data analysis. Showcasing this set of slides titled Predictive Modelling Process For Data Mining In Patient Care Slides Pdf. The topics addressed in these templates are Data Gathering Cleansing, Data Analysis, Incorporation Model. All the content presented in this PPT design is completely editable. Download it and make adjustments in color, background, font etc. as per your unique business setting. The following slide outlines predictive modelling aimed at analysing healthcaredata to find effective opportunities and make operational decisions. It covers building predictive model, data cleansing and gathering, model incorporation and data analysis.

Overview Of Different Types Of Data Analytics For Informed Decision Ppt PowerPoint
This slide outlines the various types of statistical analysis. These are mechanistic analysis, descriptive statistical analysis, inferential statistical analysis, predictive statistical analysis, prescriptive statistical analysis, exploratory data analysis, etc. The Overview Of Different Types Of Data Analytics For Informed Decision Ppt PowerPoint is a compilation of the most recent design trends as a series of slides. It is suitable for any subject or industry presentation, containing attractive visuals and photo spots for businesses to clearly express their messages. This template contains a variety of slides for the user to input data, such as structures to contrast two elements, bullet points, and slides for written information. Slidegeeks is prepared to create an impression. This slide outlines the various types of statistical analysis. These are mechanistic analysis, descriptive statistical analysis, inferential statistical analysis, predictive statistical analysis, prescriptive statistical analysis, exploratory data analysis, etc.
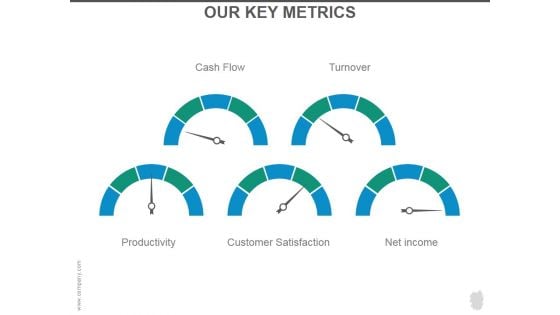
Our Key Metrics Ppt PowerPoint Presentation Portfolio
This is a our key metrics ppt powerpoint presentation portfolio. This is a five stage process. The stages in this process are cash flow, turnover, productivity, customer satisfaction, net income.
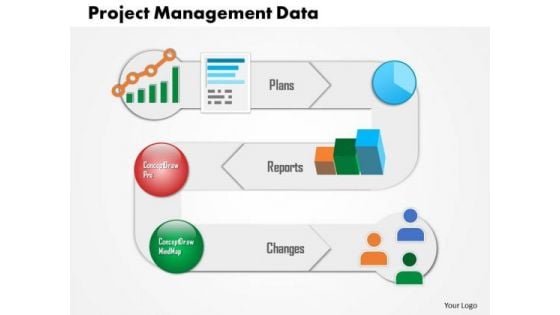
Business Framework Project Management Data PowerPoint Presentation
This diagram displays push pull communication framework. This diagram may used to displays push pull strategy. Use this diagram in business presentations. This diagram will enhance the quality of your presentations.
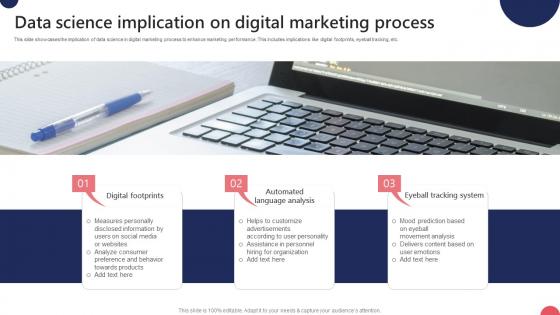
Data Science Implication On Digital Marketing Process Ppt Infographics Smartart Pdf
This slide showcases the implication of data science in digital marketing process to enhance marketing performance. This includes implications like digital footprints, eyeball tracking, etc. Showcasing this set of slides titled Data Science Implication On Digital Marketing Process Ppt Infographics Smartart Pdf. The topics addressed in these templates are Digital Footprints, Eyeball Tracking, Automated Language Analysis. All the content presented in this PPT design is completely editable. Download it and make adjustments in color, background, font etc. as per your unique business setting. This slide showcases the implication of data science in digital marketing process to enhance marketing performance. This includes implications like digital footprints, eyeball tracking, etc.
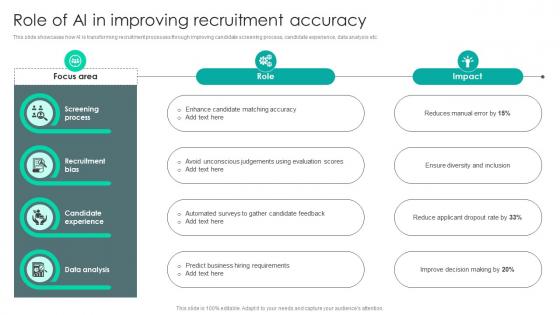
Strategic Staffing Using Data Role Of AI In Improving Recruitment Accuracy CRP DK SS V
This slide showcases how AI is transforming recruitment processes through improving candidate screening process, candidate experience, data analysis etc. Create an editable Strategic Staffing Using Data Role Of AI In Improving Recruitment Accuracy CRP DK SS V that communicates your idea and engages your audience. Whether you are presenting a business or an educational presentation, pre-designed presentation templates help save time. Strategic Staffing Using Data Role Of AI In Improving Recruitment Accuracy CRP DK SS V is highly customizable and very easy to edit, covering many different styles from creative to business presentations. Slidegeeks has creative team members who have crafted amazing templates. So, go and get them without any delay. This slide showcases how AI is transforming recruitment processes through improving candidate screening process, candidate experience, data analysis etc.

Before Vs After Performing Data Analytics For Informed Decision Ppt Template
This slide shows the before vs. after comparison of statistical analysis of business data. The different aspects compared in this slide are decision-making, operational efficiency, customer insights, product quality, revenue generation, supply chain efficiency, etc. Create an editable Before Vs After Performing Data Analytics For Informed Decision Ppt Template that communicates your idea and engages your audience. Whether you are presenting a business or an educational presentation, pre-designed presentation templates help save time. Before Vs After Performing Data Analytics For Informed Decision Ppt Template is highly customizable and very easy to edit, covering many different styles from creative to business presentations. Slidegeeks has creative team members who have crafted amazing templates. So, go and get them without any delay. This slide shows the before vs. after comparison of statistical analysis of business data. The different aspects compared in this slide are decision-making, operational efficiency, customer insights, product quality, revenue generation, supply chain efficiency, etc.

Business Process Data Lineage Use Cases Of Data Lineage Dataops Designs Pdf
This slide talks about how data lineage simplifies the data operations DataOps, including impacting analysis, system upgrades, and data migrations. A better comprehension of data aids in improving the effectiveness of data operations and avoiding mistakes. Formulating a presentation can take up a lot of effort and time, so the content and message should always be the primary focus. The visuals of the PowerPoint can enhance the presenters message, so our Business Process Data Lineage Use Cases Of Data Lineage Dataops Designs Pdf was created to help save time. Instead of worrying about the design, the presenter can concentrate on the message while our designers work on creating the ideal templates for whatever situation is needed. Slidegeeks has experts for everything from amazing designs to valuable content, we have put everything into Business Process Data Lineage Use Cases Of Data Lineage Dataops Designs Pdf. This slide talks about how data lineage simplifies the data operations DataOps, including impacting analysis, system upgrades, and data migrations. A better comprehension of data aids in improving the effectiveness of data operations and avoiding mistakes.
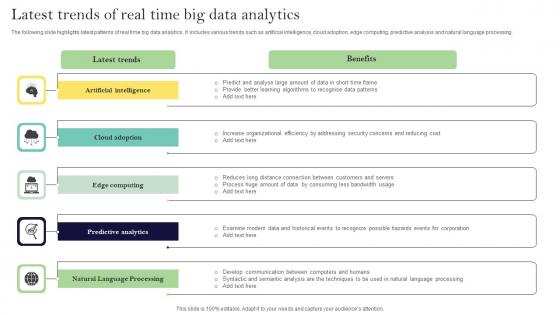
Latest Trends Of Real Time Big Data Analytics Ppt Infographic Template Smartart Pdf
The following slide highlights latest patterns of real time big data analytics. It includes various trends such as artificial intelligence, cloud adoption, edge computing, predictive analysis and natural language processing. Showcasing this set of slides titled Latest Trends Of Real Time Big Data Analytics Ppt Infographic Template Smartart Pdf. The topics addressed in these templates are Edge Computing, Predictive Analysis, Natural Language Processing. All the content presented in this PPT design is completely editable. Download it and make adjustments in color, background, font etc. as per your unique business setting. The following slide highlights latest patterns of real time big data analytics. It includes various trends such as artificial intelligence, cloud adoption, edge computing, predictive analysis and natural language processing.
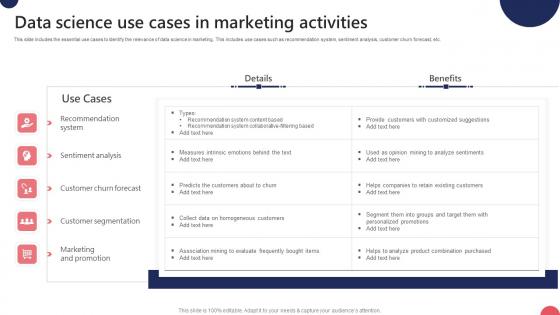
Data Science Use Cases In Marketing Activities Ppt Portfolio Graphics Tutorials Pdf
This slide includes the essential use cases to identify the relevance of data science in marketing. This includes use cases such as recommendation system, sentiment analysis, customer churn forecast, etc. Showcasing this set of slides titled Data Science Use Cases In Marketing Activities Ppt Portfolio Graphics Tutorials Pdf. The topics addressed in these templates are Recommendation System, Sentiment Analysis, Customer Churn Forecast. All the content presented in this PPT design is completely editable. Download it and make adjustments in color, background, font etc. as per your unique business setting. This slide includes the essential use cases to identify the relevance of data science in marketing. This includes use cases such as recommendation system, sentiment analysis, customer churn forecast, etc.
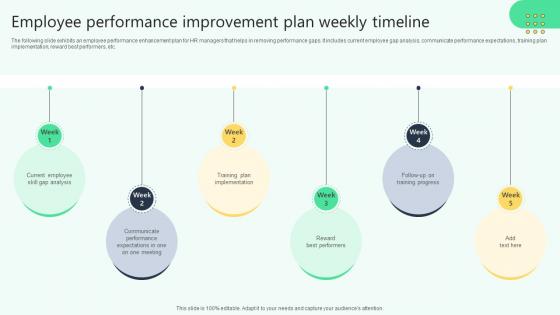
Employee Performance Improvement Plan Weekly Analysing Hr Data For Effective Decision Making
The following slide exhibits an employee performance enhancement plan for HR managers that helps in removing performance gaps. It includes current employee gap analysis, communicate performance expectations, training plan implementation, reward best performers, etc. Coming up with a presentation necessitates that the majority of the effort goes into the content and the message you intend to convey. The visuals of a PowerPoint presentation can only be effective if it supplements and supports the story that is being told. Keeping this in mind our experts created Employee Performance Improvement Plan Weekly Analysing Hr Data For Effective Decision Making to reduce the time that goes into designing the presentation. This way, you can concentrate on the message while our designers take care of providing you with the right template for the situation. The following slide exhibits an employee performance enhancement plan for HR managers that helps in removing performance gaps. It includes current employee gap analysis, communicate performance expectations, training plan implementation, reward best performers, etc.
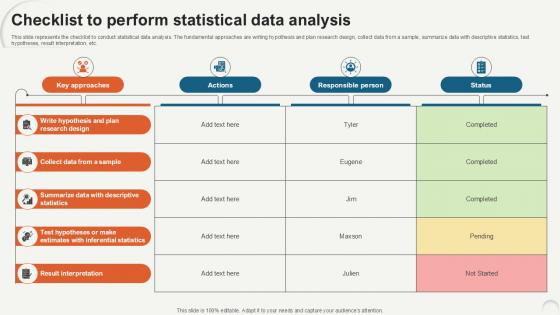
Checklist To Perform Statistical Data Analytics For Informed Decision Ppt Slide
This slide represents the checklist to conduct statistical data analysis. The fundamental approaches are writing hypothesis and plan research design, collect data from a sample, summarize data with descriptive statistics, test hypotheses, result interpretation, etc. Get a simple yet stunning designed Checklist To Perform Statistical Data Analytics For Informed Decision Ppt Slide. It is the best one to establish the tone in your meetings. It is an excellent way to make your presentations highly effective. So, download this PPT today from Slidegeeks and see the positive impacts. Our easy-to-edit Checklist To Perform Statistical Data Analytics For Informed Decision Ppt Slide can be your go-to option for all upcoming conferences and meetings. So, what are you waiting for Grab this template today. This slide represents the checklist to conduct statistical data analysis. The fundamental approaches are writing hypothesis and plan research design, collect data from a sample, summarize data with descriptive statistics, test hypotheses, result interpretation, etc.
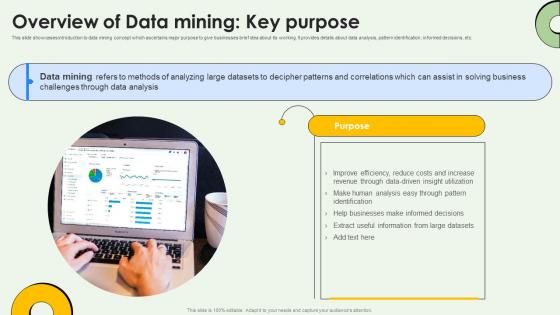
Data Warehousing And Overview Of Data Mining Key Purpose AI SS V
This slide showcases introduction to data mining concept which ascertains major purpose to give businesses brief idea about its working. It provides details about data analysis, pattern identification, informed decisions, etc. If your project calls for a presentation, then Slidegeeks is your go-to partner because we have professionally designed, easy-to-edit templates that are perfect for any presentation. After downloading, you can easily edit Data Warehousing And Overview Of Data Mining Key Purpose AI SS V and make the changes accordingly. You can rearrange slides or fill them with different images. Check out all the handy templates This slide showcases introduction to data mining concept which ascertains major purpose to give businesses brief idea about its working. It provides details about data analysis, pattern identification, informed decisions, etc.
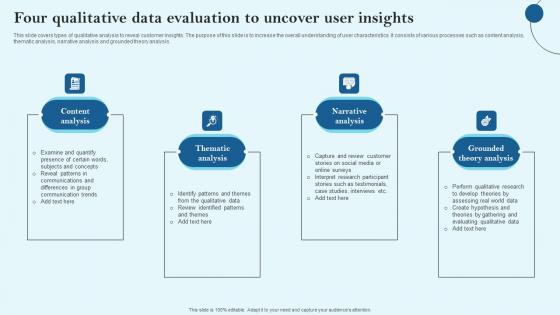
Four Qualitative Data Evaluation To Uncover User Insights Infographics Pdf
This slide covers types of qualitative analysis to reveal customer insights. The purpose of this slide is to increase the overall understanding of user characteristics. It consists of various processes such as content analysis, thematic analysis, narrative analysis and grounded theory analysis. Pitch your topic with ease and precision using this Four Qualitative Data Evaluation To Uncover User Insights Infographics Pdf This layout presents information on Content Analysis, Thematic Analysis, Narrative Analysis It is also available for immediate download and adjustment. So, changes can be made in the color, design, graphics or any other component to create a unique layout. This slide covers types of qualitative analysis to reveal customer insights. The purpose of this slide is to increase the overall understanding of user characteristics. It consists of various processes such as content analysis, thematic analysis, narrative analysis and grounded theory analysis.

External And Api Data Collection In Aspect Based Emotionally Intelligent Insights Leveraging AI SS V
This slide provides information regarding external and API data collection in aspect-based sentiment analysis in terms of web scrapping tools, visual web scrapping tools, web scrapping frameworks, and APIs.Formulating a presentation can take up a lot of effort and time, so the content and message should always be the primary focus. The visuals of the PowerPoint can enhance the presenters message, so our External And Api Data Collection In Aspect Based Emotionally Intelligent Insights Leveraging AI SS V was created to help save time. Instead of worrying about the design, the presenter can concentrate on the message while our designers work on creating the ideal templates for whatever situation is needed. Slidegeeks has experts for everything from amazing designs to valuable content, we have put everything into External And Api Data Collection In Aspect Based Emotionally Intelligent Insights Leveraging AI SS V. This slide provides information regarding external and API data collection in aspect-based sentiment analysis in terms of web scrapping tools, visual web scrapping tools, web scrapping frameworks, and APIs.

Timeline To Conduct Statistical Data Analytics For Informed Decision Ppt Presentation
This slide shows the timeline for performing statistical data analysis. The key steps include writing hypothesis and plan research design, collect data from a sample, summarize data with descriptive statistics, test hypotheses, result interpretation, etc. Slidegeeks is here to make your presentations a breeze with Timeline To Conduct Statistical Data Analytics For Informed Decision Ppt Presentation With our easy-to-use and customizable templates, you can focus on delivering your ideas rather than worrying about formatting. With a variety of designs to choose from, you are sure to find one that suits your needs. And with animations and unique photos, illustrations, and fonts, you can make your presentation pop. So whether you are giving a sales pitch or presenting to the board, make sure to check out Slidegeeks first This slide shows the timeline for performing statistical data analysis. The key steps include writing hypothesis and plan research design, collect data from a sample, summarize data with descriptive statistics, test hypotheses, result interpretation, etc.
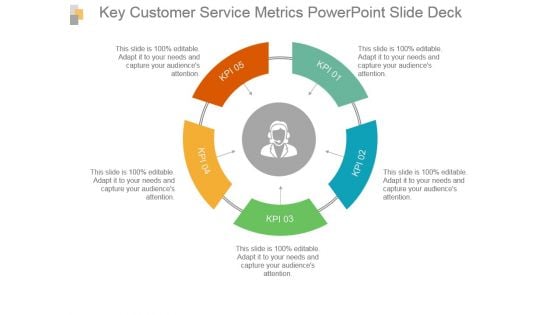
Key Customer Service Metrics Powerpoint Slide Deck
This is a key customer service metrics powerpoint slide deck. This is a five stage process. The stages in this process are process, management, arrow, marketing, strategy.
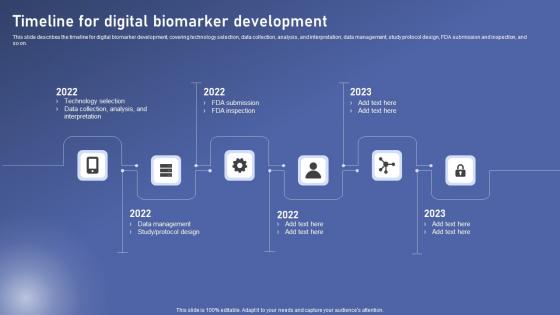
Timeline For Digital Biomarker Biomedical Data Science And Health Informatics Sample Pdf
This slide describes the timeline for digital biomarker development, covering technology selection, data collection, analysis, and interpretation, data management, study protocol design, FDA submission and inspection, and so on. Do you have an important presentation coming up Are you looking for something that will make your presentation stand out from the rest Look no further than Timeline For Digital Biomarker Biomedical Data Science And Health Informatics Sample Pdf. With our professional designs, you can trust that your presentation will pop and make delivering it a smooth process. And with Slidegeeks, you can trust that your presentation will be unique and memorable. So why wait Grab Timeline For Digital Biomarker Biomedical Data Science And Health Informatics Sample Pdf today and make your presentation stand out from the rest This slide describes the timeline for digital biomarker development, covering technology selection, data collection, analysis, and interpretation, data management, study protocol design, FDA submission and inspection, and so on.
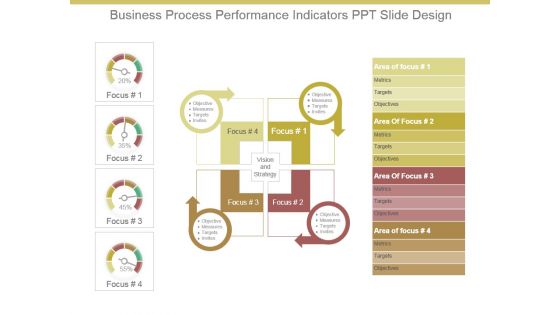
Business Process Performance Indicators Ppt Slide Design
This is a business process performance indicators ppt slide design. This is a four stage process. The stages in this process are focus, objective, measures, targets, invites, vision and strategy, area of focus, metrics, targets, objectives.

Data Management Alternative In Powerpoint And Google Slides Cpb
Presenting our innovatively-designed set of slides titled Data Management Alternative In Powerpoint And Google Slides Cpb. This completely editable PowerPoint graphic exhibits Data Management Alternative that will help you convey the message impactfully. It can be accessed with Google Slides and is available in both standard screen and widescreen aspect ratios. Apart from this, you can download this well-structured PowerPoint template design in different formats like PDF, JPG, and PNG. So, click the download button now to gain full access to this PPT design. Our Data Management Alternative In Powerpoint And Google Slides Cpb are topically designed to provide an attractive backdrop to any subject. Use them to look like a presentation pro.
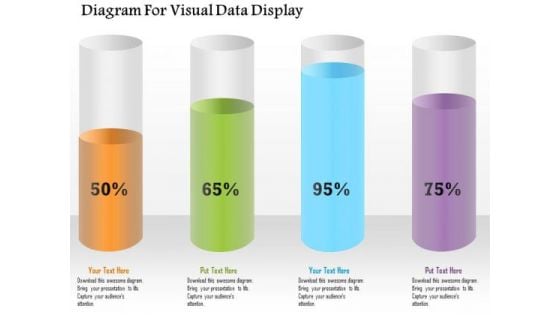
Business Diagram Diagram For Visual Data Display Presentation Template
Four colored cylindrical bars with percentage values are used to design this power point template. This diagram slide helps to display financial data analysis. Use this diagram for your business and finance related presentations.
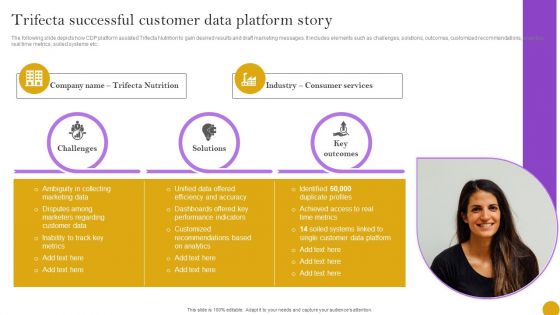
Comprehensive Customer Data Platform Guide Optimizing Promotional Initiatives Trifecta Successful Customer Data Platform Story Designs PDF
The following slide depicts how CDP platform assisted Trifecta Nutrition to gain desired results and draft marketing messages. It includes elements such as challenges, solutions, outcomes, customized recommendations, analytics, real time metrics, soiled systems etc. Whether you have daily or monthly meetings, a brilliant presentation is necessary. Comprehensive Customer Data Platform Guide Optimizing Promotional Initiatives Trifecta Successful Customer Data Platform Story Designs PDF can be your best option for delivering a presentation. Represent everything in detail using Comprehensive Customer Data Platform Guide Optimizing Promotional Initiatives Trifecta Successful Customer Data Platform Story Designs PDF and make yourself stand out in meetings. The template is versatile and follows a structure that will cater to your requirements. All the templates prepared by Slidegeeks are easy to download and edit. Our research experts have taken care of the corporate themes as well. So, give it a try and see the results.
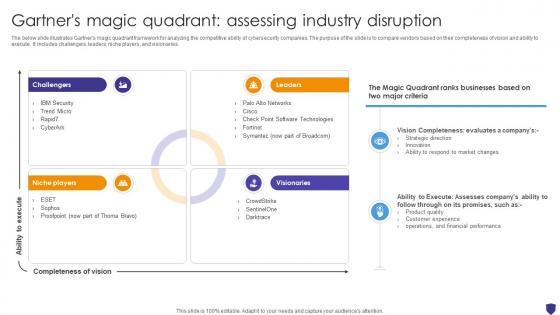
Global Data Security Industry Report Gartners Magic Quadrant Assessing Industry Disruption IR SS V
The below slide illustrates Gartners magic quadrant framework for analyzing the competitive ability of cybersecurity companies. The purpose of the slide is to compare vendors based on their completeness of vision and ability to execute. It includes challengers, leaders, niche players, and visionaries. Find highly impressive Global Data Security Industry Report Gartners Magic Quadrant Assessing Industry Disruption IR SS V on Slidegeeks to deliver a meaningful presentation. You can save an ample amount of time using these presentation templates. No need to worry to prepare everything from scratch because Slidegeeks experts have already done a huge research and work for you. You need to download Global Data Security Industry Report Gartners Magic Quadrant Assessing Industry Disruption IR SS V for your upcoming presentation. All the presentation templates are 100 percent editable and you can change the color and personalize the content accordingly. Download now The below slide illustrates Gartners magic quadrant framework for analyzing the competitive ability of cybersecurity companies. The purpose of the slide is to compare vendors based on their completeness of vision and ability to execute. It includes challengers, leaders, niche players, and visionaries.
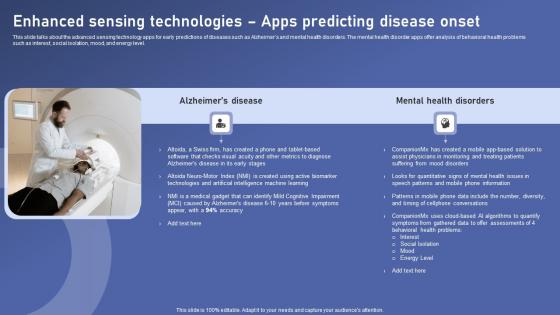
Enhanced Sensing Technologies Biomedical Data Science And Health Informatics Introduction Pdf
This slide talks about the advanced sensing technology apps for early predictions of diseases such as Alzheimers and mental health disorders. The mental health disorder apps offer analysis of behavioral health problems such as interest, social isolation, mood, and energy level. This Enhanced Sensing Technologies Biomedical Data Science And Health Informatics Introduction Pdf is perfect for any presentation, be it in front of clients or colleagues. It is a versatile and stylish solution for organizing your meetings. The Enhanced Sensing Technologies Biomedical Data Science And Health Informatics Introduction Pdf features a modern design for your presentation meetings. The adjustable and customizable slides provide unlimited possibilities for acing up your presentation. Slidegeeks has done all the homework before launching the product for you. So, do not wait, grab the presentation templates today This slide talks about the advanced sensing technology apps for early predictions of diseases such as Alzheimers and mental health disorders. The mental health disorder apps offer analysis of behavioral health problems such as interest, social isolation, mood, and energy level.
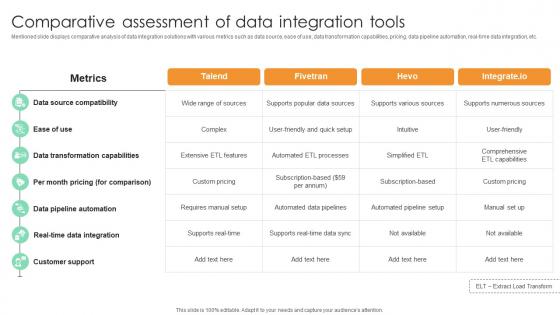
Comparative Assessment Of Data Integration Tools Comprehensive Guide For Marketing Technology
Mentioned slide displays comparative analysis of data integration solutions with various metrics such as data source, ease of use, data transformation capabilities, pricing, data pipeline automation, real-time data integration, etc.If your project calls for a presentation, then Slidegeeks is your go-to partner because we have professionally designed, easy-to-edit templates that are perfect for any presentation. After downloading, you can easily edit Comparative Assessment Of Data Integration Tools Comprehensive Guide For Marketing Technology and make the changes accordingly. You can rearrange slides or fill them with different images. Check out all the handy templates Mentioned slide displays comparative analysis of data integration solutions with various metrics such as data source, ease of use, data transformation capabilities, pricing, data pipeline automation, real-time data integration, etc.
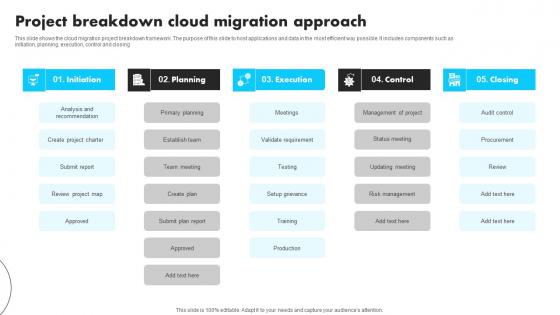
Project Breakdown Cloud Migration Approach Infographics Pdf
This slide shows the cloud migration project breakdown framework. The purpose of this slide to host applications and data in the most efficient way possible. It includes components such as initiation, planning, execution, control and closing Pitch your topic with ease and precision using this Project Breakdown Cloud Migration Approach Infographics Pdf This layout presents information on Initiation, Planning, Execution, Review Project It is also available for immediate download and adjustment. So, changes can be made in the color, design, graphics or any other component to create a unique layout. This slide shows the cloud migration project breakdown framework. The purpose of this slide to host applications and data in the most efficient way possible. It includes components such as initiation, planning, execution, control and closing
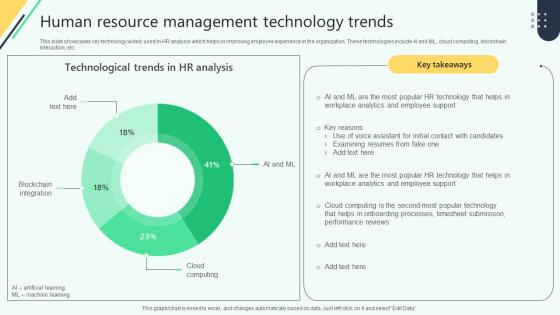
Human Resource Management Technology Trends Analysing Hr Data For Effective Decision Making
This slide showcases key technology widely used in HR analysis which helps in improving employee experience in the organization. These technologies include AI and ML, cloud computing, blockchain interaction, etc. Are you searching for a Human Resource Management Technology Trends Analysing Hr Data For Effective Decision Making that is uncluttered, straightforward, and original Its easy to edit, and you can change the colors to suit your personal or business branding. For a presentation that expresses how much effort you have put in, this template is ideal With all of its features, including tables, diagrams, statistics, and lists, its perfect for a business plan presentation. Make your ideas more appealing with these professional slides. Download Human Resource Management Technology Trends Analysing Hr Data For Effective Decision Making from Slidegeeks today. This slide showcases key technology widely used in HR analysis which helps in improving employee experience in the organization. These technologies include AI and ML, cloud computing, blockchain interaction, etc.
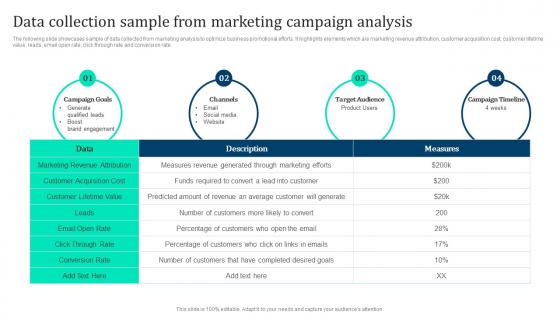
Data Collection Sample From Marketing Intelligence Guide Data Gathering Guidelines Pdf
The following slide showcases sample of data collected from marketing analysis to optimize business promotional efforts. It highlights elements which are marketing revenue attribution, customer acquisition cost, customer lifetime value, leads, email open rate, click through rate and conversion rate. From laying roadmaps to briefing everything in detail, our templates are perfect for you. You can set the stage with your presentation slides. All you have to do is download these easy to edit and customizable templates. Data Collection Sample From Marketing Intelligence Guide Data Gathering Guidelines Pdf will help you deliver an outstanding performance that everyone would remember and praise you for. Do download this presentation today. The following slide showcases sample of data collected from marketing analysis to optimize business promotional efforts. It highlights elements which are marketing revenue attribution, customer acquisition cost, customer lifetime value, leads, email open rate, click through rate and conversion rate.
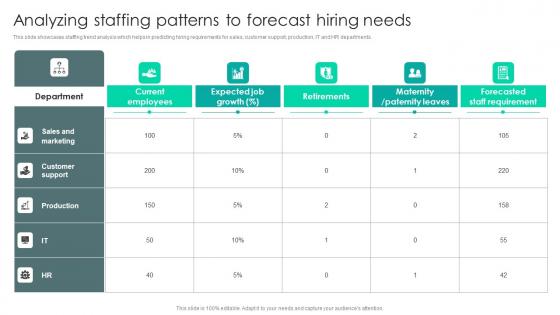
Strategic Staffing Using Data Analyzing Staffing Patterns To Forecast Hiring Needs CRP DK SS V
This slide showcases staffing trend analysis which helps in predicting hiring requirements for sales, customer support, production, IT and HR departments. From laying roadmaps to briefing everything in detail, our templates are perfect for you. You can set the stage with your presentation slides. All you have to do is download these easy-to-edit and customizable templates. Strategic Staffing Using Data Analyzing Staffing Patterns To Forecast Hiring Needs CRP DK SS V will help you deliver an outstanding performance that everyone would remember and praise you for. Do download this presentation today. This slide showcases staffing trend analysis which helps in predicting hiring requirements for sales, customer support, production, IT and HR departments.
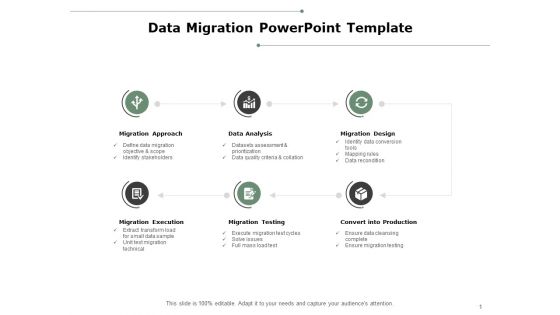
Data Migration PowerPoint Template Ppt PowerPoint Presentation Infographic Template Layouts
Presenting this set of slides with name data migration powerpoint template ppt powerpoint presentation infographic template layouts. This is a six stage process. The stages in this process are approach, data analysis, execution, design, management. This is a completely editable PowerPoint presentation and is available for immediate download. Download now and impress your audience.

Data Migration PowerPoint Template Ppt PowerPoint Presentation Inspiration Topics
Presenting this set of slides with name data migration powerpoint template ppt powerpoint presentation inspiration topics. This is a six stage process. The stages in this process are migration approach, data analysis, migration design, migration execution, migration testing, convert into production. This is a completely editable PowerPoint presentation and is available for immediate download. Download now and impress your audience.
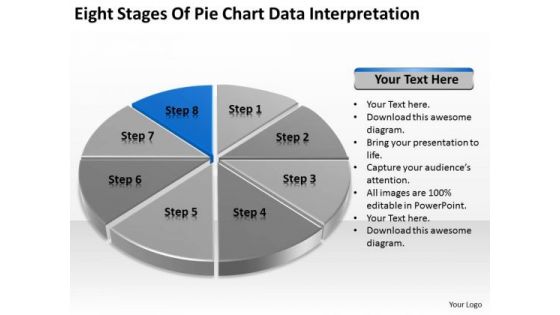
Eight Stages Of Pie Chart Data Interpretation Detailed Business Plan PowerPoint Templates
We present our eight stages of pie chart data interpretation detailed business plan PowerPoint templates.Download and present our Competition PowerPoint Templates because You can Stir your ideas in the cauldron of our PowerPoint Templates and Slides. Cast a magic spell on your audience. Download and present our Marketing PowerPoint Templates because You should Kick up a storm with our PowerPoint Templates and Slides. The heads of your listeners will swirl with your ideas. Download and present our Arrows PowerPoint Templates because Your ideas provide food for thought. Our PowerPoint Templates and Slides will help you create a dish to tickle the most discerning palate. Present our Circle Charts PowerPoint Templates because You can Stir your ideas in the cauldron of our PowerPoint Templates and Slides. Cast a magic spell on your audience. Download our Business PowerPoint Templates because You can Score a slam dunk with our PowerPoint Templates and Slides. Watch your audience hang onto your every word.Use these PowerPoint slides for presentations relating to chart, graph, pie, 3d, diagram, graphic, icon, control, business, data, profit, market, sales, display, corporate, concept, render, success, presentation, finance, report, marketing, accounting, management, piece, strategy, money, growth, company, competition, progress, account, sheet, part, information, investment, improvement, banking, index, financial, reflect, results, performance, exchange. The prominent colors used in the PowerPoint template are Blue, Black, Gray. Exult in the comfort of our Eight Stages Of Pie Chart Data Interpretation Detailed Business Plan PowerPoint Templates. Experience the convenience they deliver.
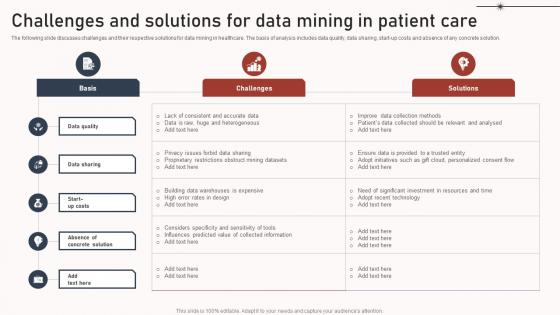
Challenges And Solutions For Data Mining In Patient Care Microsoft Pdf
The following slide discusses challenges and their respective solutions for data mining in healthcare. The basis of analysis includes data quality, data sharing, start up costs and absence of any concrete solution. Pitch your topic with ease and precision using this Challenges And Solutions For Data Mining In Patient Care Microsoft Pdf. This layout presents information on Data Quality, Data Sharing, Start Up Costs. It is also available for immediate download and adjustment. So, changes can be made in the color, design, graphics or any other component to create a unique layout. The following slide discusses challenges and their respective solutions for data mining in healthcare. The basis of analysis includes data quality, data sharing, start up costs and absence of any concrete solution.
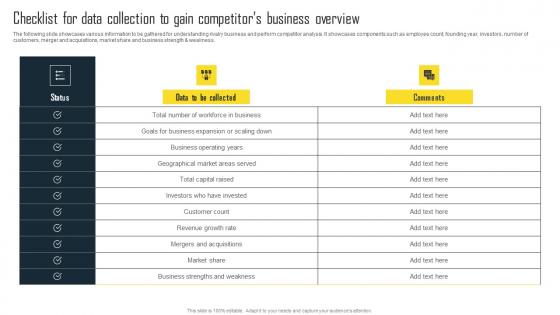
Checklist For Data Collection To Gain Competitors Efficient Plan For Conducting Competitor Elements Pdf
The following slide showcases various information to be gathered for understanding rivalry business and perform competitor analysis. It showcases components such as employee count, founding year, investors, number of customers, merger and acquisitions, market share and business strength and weakness. Do you have to make sure that everyone on your team knows about any specific topic I yes, then you should give PRODUCT NAME a try. Our experts have put a lot of knowledge and effort into creating this impeccable Checklist For Data Collection To Gain Competitors Efficient Plan For Conducting Competitor Elements Pdf. You can use this template for your upcoming presentations, as the slides are perfect to represent even the tiniest detail. You can download these templates from the Slidegeeks website and these are easy to edit. So grab these today. The following slide showcases various information to be gathered for understanding rivalry business and perform competitor analysis. It showcases components such as employee count, founding year, investors, number of customers, merger and acquisitions, market share and business strength and weakness.
Data Validation Risk Management In Powerpoint And Google Slides Cpb
Presenting our innovatively-designed set of slides titled Data Validation Risk Management In Powerpoint And Google Slides Cpb. This completely editable PowerPoint graphic exhibits Data Validation Risk Management that will help you convey the message impactfully. It can be accessed with Google Slides and is available in both standard screen and widescreen aspect ratios. Apart from this, you can download this well-structured PowerPoint template design in different formats like PDF, JPG, and PNG. So, click the download button now to gain full access to this PPT design. Our Data Validation Risk Management In Powerpoint And Google Slides Cpb are topically designed to provide an attractive backdrop to any subject. Use them to look like a presentation pro.

Business Intelligence And Data Visualization Tools DT SS V
This slide presents various business intelligence and data visualization tools that help SMEs make better business decisions. It also mentions applications such as data analysis, exploration, visualization, reporting and dashboard creations.Present like a pro with Business Intelligence And Data Visualization Tools DT SS V. Create beautiful presentations together with your team, using our easy-to-use presentation slides. Share your ideas in real-time and make changes on the fly by downloading our templates. So whether you are in the office, on the go, or in a remote location, you can stay in sync with your team and present your ideas with confidence. With Slidegeeks presentation got a whole lot easier. Grab these presentations today. This slide presents various business intelligence and data visualization tools that help SMEs make better business decisions. It also mentions applications such as data analysis, exploration, visualization, reporting and dashboard creations.
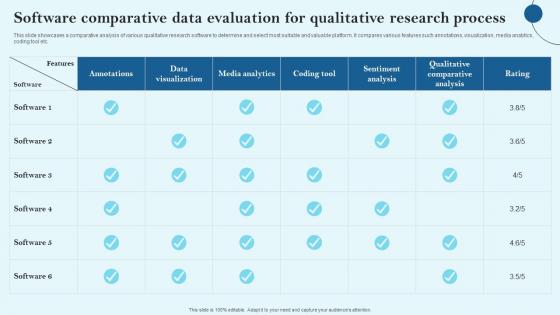
Software Comparative Data Evaluation For Qualitative Research Process Sample Pdf
This slide showcases a comparative analysis of various qualitative research software to determine and select most suitable and valuable platform. It compares various features such annotations, visualization, media analytics, coding tool etc. Pitch your topic with ease and precision using this Software Comparative Data Evaluation For Qualitative Research Process Sample Pdf This layout presents information on Annotations, Data Visualization, Media Analytics It is also available for immediate download and adjustment. So, changes can be made in the color, design, graphics or any other component to create a unique layout. This slide showcases a comparative analysis of various qualitative research software to determine and select most suitable and valuable platform. It compares various features such annotations, visualization, media analytics, coding tool etc.


 Continue with Email

 Home
Home


