Executive Kpi
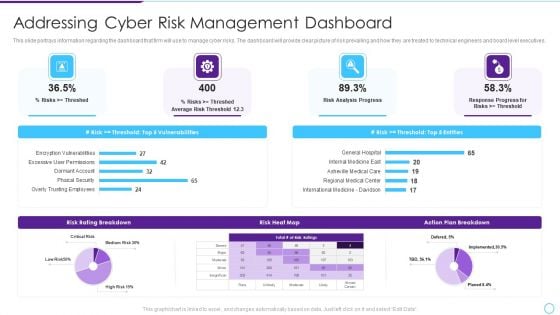
Intelligent Infrastructure Addressing Cyber Risk Management Dashboard Formats PDF
This slide portrays information regarding the dashboard that firm will use to manage cyber risks. The dashboard will provide clear picture of risk prevailing and how they are treated to technical engineers and board level executives. Deliver and pitch your topic in the best possible manner with this Intelligent Infrastructure Addressing Cyber Risk Management Dashboard Formats PDF. Use them to share invaluable insights on Risk Analysis Progress, Risk Rating Breakdown, Risk Heat Map, Action Plan Breakdown and impress your audience. This template can be altered and modified as per your expectations. So, grab it now.
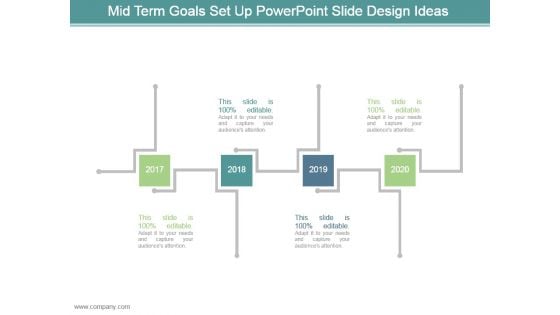
Mid Term Goals Set Up Powerpoint Slide Design Ideas
This is a mid term goals set up powerpoint slide design ideas. This is a four stage process. The stages in this process are arrows, business, marketing, planning, years.

Quantitative Data Analysis Methods Diagram Powerpoint Slide
This is a quantitative data analysis methods diagram powerpoint slide. This is a three stage process. The stages in this process are organizing data, presenting data, data analysis.
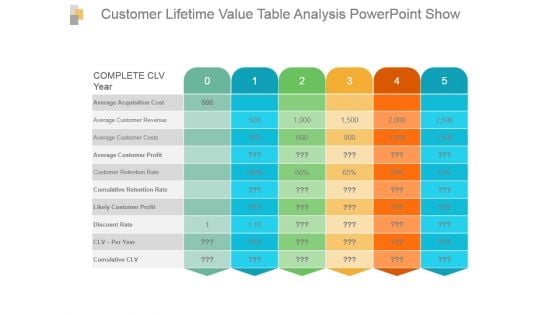
Customer Lifetime Value Table Analysis Powerpoint Show
This is a customer lifetime value table analysis powerpoint show. This is a five stage process. The stages in this process are complete clv year, average acquisition cost, average customer revenue, average customer costs, average customer profit, customer retention rate, cumulative retention rate, likely customer profit, discount rate.
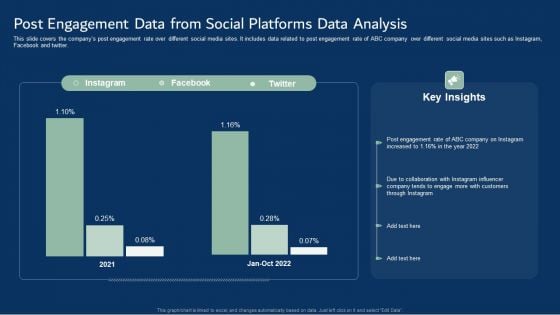
Post Engagement Data From Social Platforms Data Analysis Template PDF
This slide covers the companys post engagement rate over different social media sites. It includes data related to post engagement rate of ABC company over different social media sites such as Instagram, Facebook and twitter. Pitch your topic with ease and precision using this Post Engagement Data From Social Platforms Data Analysis Template PDF. This layout presents information on Post Engagement Data, Social Platforms Data Analysis. It is also available for immediate download and adjustment. So, changes can be made in the color, design, graphics or any other component to create a unique layout.
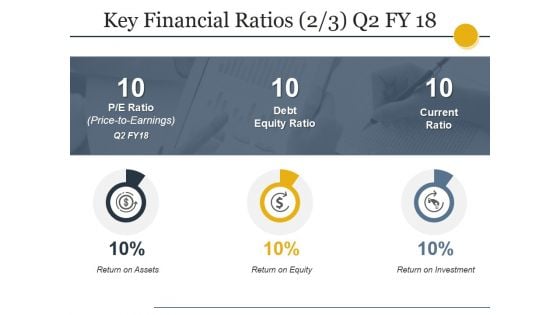
Key Financial Ratios Template Ppt PowerPoint Presentation Show Graphics Design
This is a key financial ratios template ppt powerpoint presentation show graphics design. This is a four stage process. The stages in this process are liquidity, profitability, activity, solvency.
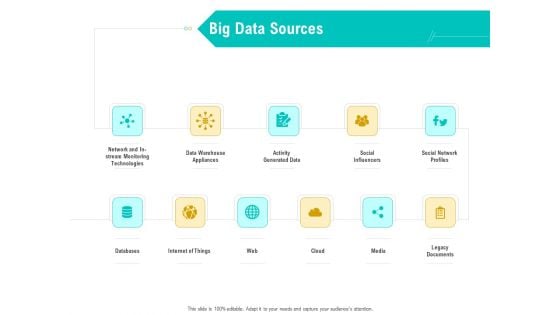
Business Data Analysis Big Data Sources Microsoft PDF
Presenting business data analysis big data sources microsoft pdf to provide visual cues and insights. Share and navigate important information on eleven stages that need your due attention. This template can be used to pitch topics like Data Warehouse Appliances, Activity Generated Data, Social Influencers, Social Network Profiles, Network And In Stream Monitoring Technologies. In addition, this PPT design contains high-resolution images, graphics, etc, that are easily editable and available for immediate download.
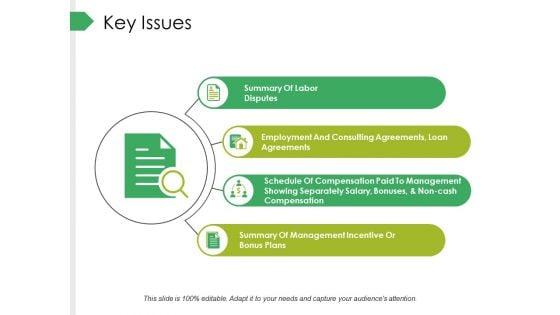
Key Issues Ppt PowerPoint Presentation Professional Design Inspiration
This is a key issues ppt powerpoint presentation professional design inspiration. This is a four stage process. The stages in this process are business, summary of labor disputes, summary of management incentive or bonus plans, employment and consulting agreements, loan agreements, marketing.
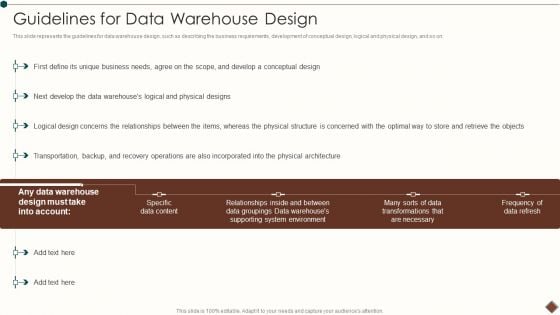
Data Warehouse Implementation Guidelines For Data Warehouse Design Rules PDF
This slide represents the guidelines for data warehouse design, such as describing the business requirements, development of conceptual design, logical and physical design, and so on.Deliver and pitch your topic in the best possible manner with this Data Warehouse Implementation Guidelines For Data Warehouse Design Rules PDF. Use them to share invaluable insights on Relationships Inside, Data Groupings, Supporting System and impress your audience. This template can be altered and modified as per your expectations. So, grab it now.
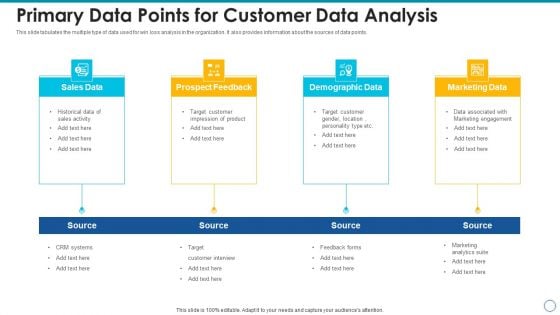
Primary Data Points For Customer Data Analysis Ideas PDF
This slide tabulates the multiple type of data used for win loss analysis in the organization. It also provides information about the sources of data points. Presenting primary data points for customer data analysis ideas pdf to dispense important information. This template comprises four stages. It also presents valuable insights into the topics including sales data, prospect feedback, demographic data, marketing data. This is a completely customizable PowerPoint theme that can be put to use immediately. So, download it and address the topic impactfully.
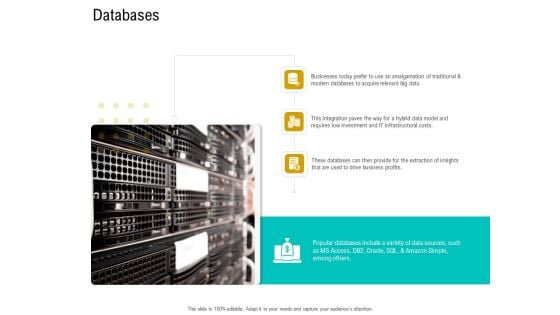
Business Data Analysis Databases Download PDF
Deliver an awe inspiring pitch with this creative business data analysis databases download pdf bundle. Topics like amalgamation of traditional, this integration paves the way for a hybrid data model and requires low investment and it infrastructural costs, these databases can then provide for the extraction of insights that are used to drive business profits. can be discussed with this completely editable template. It is available for immediate download depending on the needs and requirements of the user.
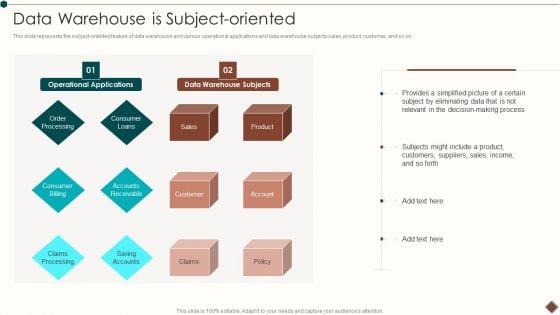
Data Warehouse Implementation Data Warehouse Is Subject Oriented Designs PDF
This slide represents the subject oriented feature of data warehouse and various operational applications and data warehouse subjects sales, product, customer, and so on.Deliver an awe inspiring pitch with this creative Data Warehouse Implementation Data Warehouse Is Subject Oriented Designs PDF bundle. Topics like Order Processing, Consumer Loans, Accounts Receivable can be discussed with this completely editable template. It is available for immediate download depending on the needs and requirements of the user.
Data Collection And Analysis Flow Chart Template 2 Ppt PowerPoint Presentation Inspiration Layout Ideas
This is a data collection and analysis flow chart template 2 ppt powerpoint presentation inspiration layout ideas. This is a four stage process. The stages in this process are business, chart, organization, process, structure.
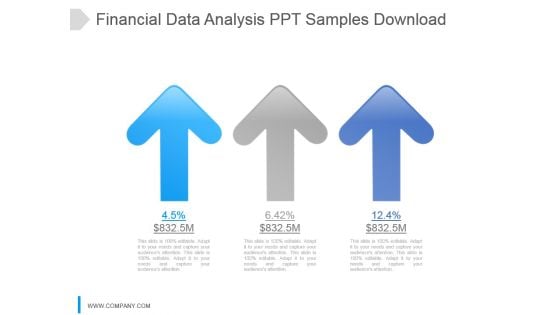
Financial Data Analysis Ppt Samples Download
This is a financial data analysis ppt samples download. This is a three stage process. The stages in this process are arrow, growth, percentage, finance, success.
Consumer Risk Assessment Reporting Icon Ppt Outline Graphics Design PDF
Presenting Consumer Risk Assessment Reporting Icon Ppt Outline Graphics Design PDF to dispense important information. This template comprises three stages. It also presents valuable insights into the topics including Consumer, Risk Assessment Reporting, Icon. This is a completely customizable PowerPoint theme that can be put to use immediately. So, download it and address the topic impactfully.

Data Analysis In Excel 3d Column Chart To Represent Information PowerPoint Templates
Rake In The Dough With
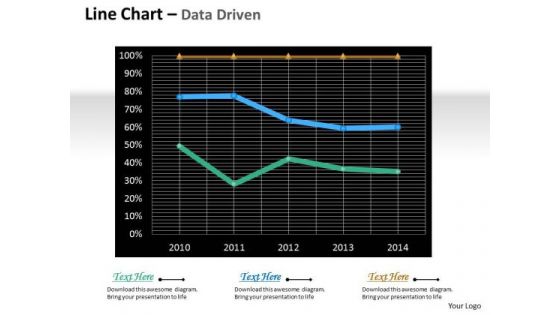
Multivariate Data Analysis Driven Line Chart For Market Survey PowerPoint Slides Templates
Rake In The Dough With
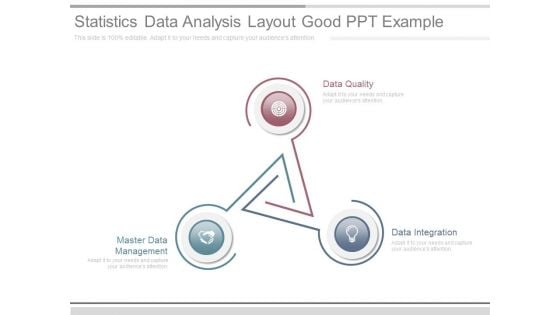
Statistics Data Analysis Layout Good Ppt Example
This is a statistics data analysis layout good ppt example. This is a three stage process. The stages in this process are data quality, data integration, master data management.
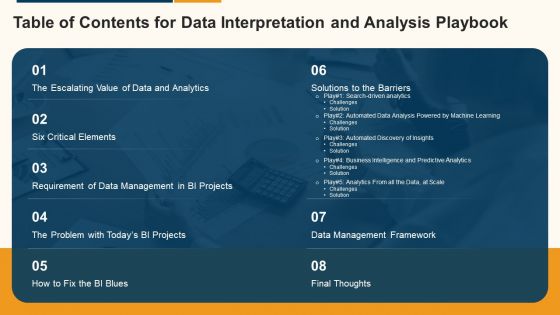
Data Interpretation And Analysis Playbook Table Of Contents For Data Interpretation And Analysis Playbook Rules PDF
Deliver an awe inspiring pitch with this creative data interpretation and analysis playbook table of contents for data interpretation and analysis playbook rules pdf bundle. Topics like six critical elements, data management framework, solutions to the barriers, data management in bi projects, final thoughts can be discussed with this completely editable template. It is available for immediate download depending on the needs and requirements of the user.
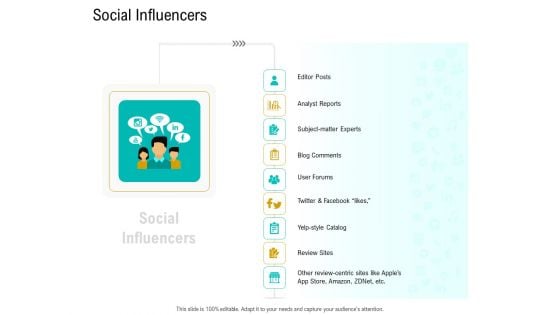
Business Data Analysis Social Influencers Diagrams PDF
Deliver an awe inspiring pitch with this creative business data analysis social influencers diagrams pdf bundle. Topics like analyst reports, subject matter experts, blog comments review sites, user forums can be discussed with this completely editable template. It is available for immediate download depending on the needs and requirements of the user.
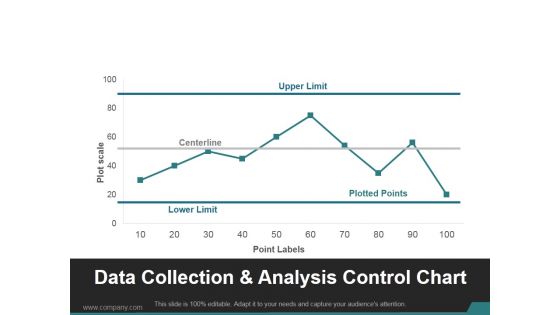
Data Collection And Analysis Control Chart Ppt PowerPoint Presentation Visuals
This is a data collection and analysis control chart ppt powerpoint presentation visuals. This is a ten stage process. The stages in this process are upper limit, centerline, lower limit, plotted points.
Horizontal Scaling Technique For Information Team Structure For Data Management System Expansion Icons PDF
This slide represents the team structure for the data repository expansion project. It provides details regarding core and support team members in terms of job role and employee name.Deliver and pitch your topic in the best possible manner with this Horizontal Scaling Technique For Information Team Structure For Data Management System Expansion Icons PDF Use them to share invaluable insights on Documentation Information, Security Engineer, Information Security Engineer and impress your audience. This template can be altered and modified as per your expectations. So, grab it now.
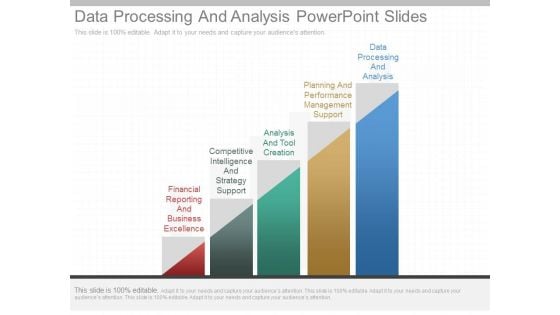
Data Processing And Analysis Powerpoint Slides
This is a data processing and analysis powerpoint slides. This is a five stage process. The stages in this process are financial reporting and business excellence, competitive intelligence and strategy support, analysis and tool creation, planning and performance management support, data processing and analysis.
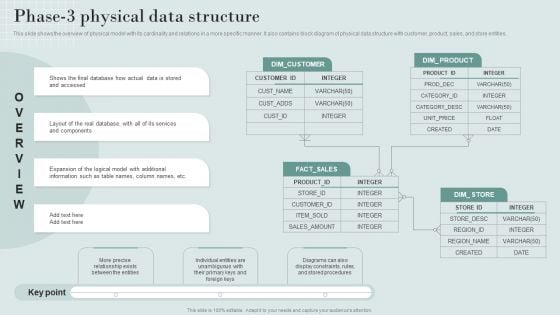
Data Structure IT Phase 3 Physical Data Structure Designs PDF
The Data Structure IT Phase 3 Physical Data Structure Designs PDF is a compilation of the most recent design trends as a series of slides. It is suitable for any subject or industry presentation, containing attractive visuals and photo spots for businesses to clearly express their messages. This template contains a variety of slides for the user to input data, such as structures to contrast two elements, bullet points, and slides for written information. Slidegeeks is prepared to create an impression.
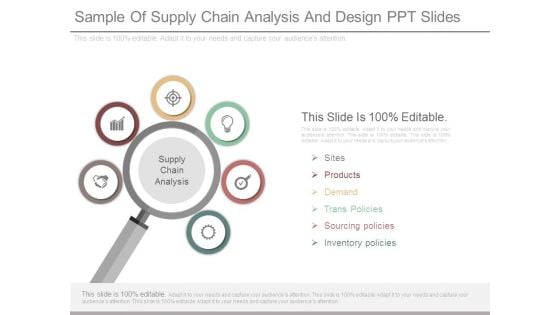
Sample Of Supply Chain Analysis And Design Ppt Slides
This is a sample of supply chain analysis and design ppt slides. This is a six stage process. The stages in this process are supply chain analysis, sites, products, demand, trans policies, sourcing policies, inventory policies.

Big Data Cycle For Analysis Diagram Slides
This is a big data cycle for analysis diagram slides. This is a five stage process. The stages in this process are massive data, new management needs, new final result, new hard and software, new analysis possibilities.
Data Interpretation And Analysis Playbook Icons Slide For Data Interpretation And Analysis Playbook Designs PDF
Presenting our innovatively structured data interpretation and analysis playbook icons slide for data interpretation and analysis playbook designs pdf set of slides. The slides contain a hundred percent editable icons. You can replace these icons without any inconvenience. Therefore, pick this set of slides and create a striking presentation.
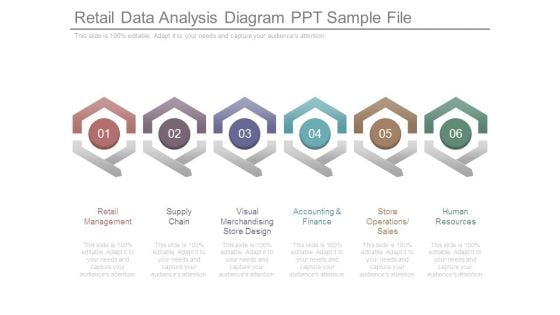
Retail Data Analysis Diagram Ppt Sample File
This is a retail data analysis diagram ppt sample file. This is a six stage process. The stages in this process are retail management, supply chain, visual merchandising store design, accounting and finance, store operations sales, human resources.
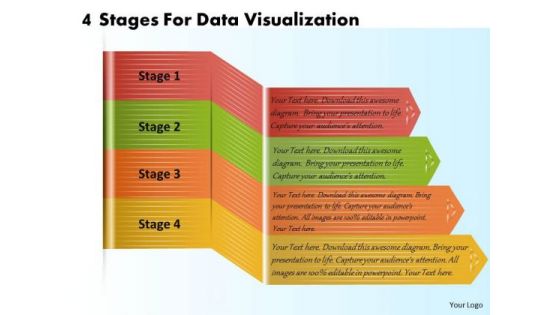
Business Plan And Strategy 4 Stages For Data Visualization Strategic Planning Template Ppt Slide
Your Listeners Will Never Doodle. Our business plan and strategy 4 stages for data visualization strategic planning template ppt slide Powerpoint Templates Will Hold Their Concentration. Do The One Thing With Your Thoughts. Uphold Custom With Our Process and Flows Powerpoint Templates.
Business Data Analysis Target Icons PDF
Presenting business data analysis target icons pdf to provide visual cues and insights. Share and navigate important information on four stages that need your due attention. This template can be used to pitch topics like target. In addtion, this PPT design contains high resolution images, graphics, etc, that are easily editable and available for immediate download.
Bar Graph Icon For Research Analysis Ppt PowerPoint Presentation Summary Portfolio
Presenting this set of slides with name bar graph icon for research analysis ppt powerpoint presentation summary portfolio. This is a three stage process. The stages in this process are data visualization icon, research analysis, business focus. This is a completely editable PowerPoint presentation and is available for immediate download. Download now and impress your audience.
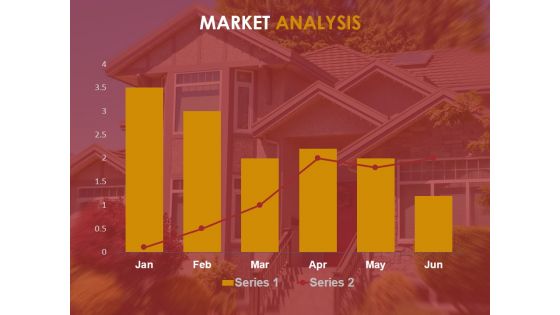
Market Analysis Ppt PowerPoint Presentation Introduction
This is a market analysis ppt powerpoint presentation introduction. This is a six stage process. The stages in this process are business, marketing, analysis, strategy, chart and graph, growth.
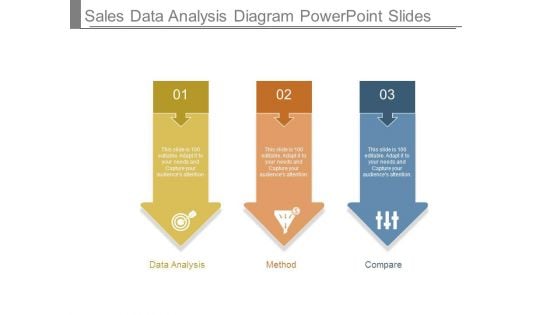
Sales Data Analysis Diagram Powerpoint Slides
This is a sales data analysis diagram powerpoint slides. This is a three stage process. The stages in this process are data analysis, method, compare.
Website Content Performance Analysis Review Icon Designs PDF
Persuade your audience using this Website Content Performance Analysis Review Icon Designs PDF. This PPT design covers four stages, thus making it a great tool to use. It also caters to a variety of topics including Website Content Performance, Analysis Review Icon. Download this PPT design now to present a convincing pitch that not only emphasizes the topic but also showcases your presentation skills.
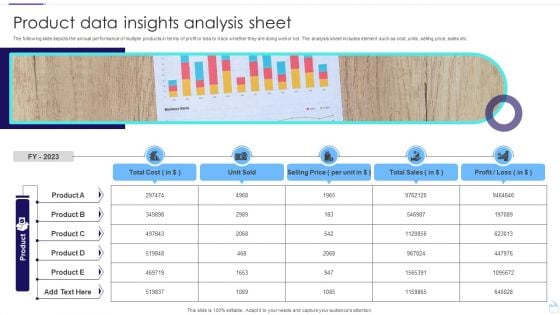
Product Data Insights Analysis Sheet Infographics PDF
The following slide depicts the annual performance of multiple products in terms of profit or loss to track whether they are doing well or not. The analysis sheet includes element such as cost, units, selling price, sales etc. Pitch your topic with ease and precision using this Product Data Insights Analysis Sheet Infographics PDF. This layout presents information on Unit Sold, Selling Price, Total Sales. It is also available for immediate download and adjustment. So, changes can be made in the color, design, graphics or any other component to create a unique layout.
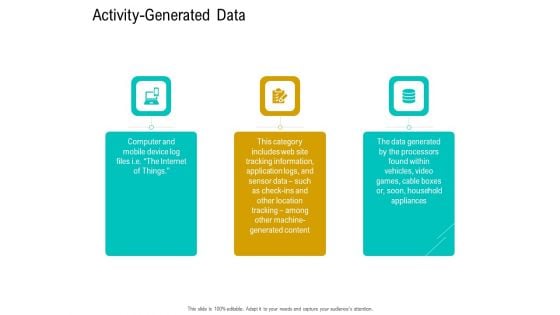
Business Data Analysis Activity Generated Data Guidelines PDF
This is a business data analysis activity generated data guidelines pdf template with various stages. Focus and dispense information on three stages using this creative set, that comes with editable features. It contains large content boxes to add your information on topics like the data generated by the processors found within vehicles, video games, cable boxes or, soon, household appliances, the data generated by the processors found within vehicles, video games, cable boxes or, soon, household appliances. You can also showcase facts, figures, and other relevant content using this PPT layout. Grab it now.
Business Research And Analysis Ppt PowerPoint Presentation Ideas Graphics Design
This is a business research and analysis ppt powerpoint presentation ideas graphics design. This is a three stage process. The stages in this process are support, assistance, hand holding.
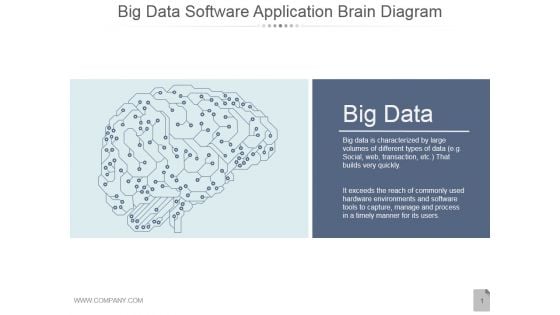
Big Data Software Application Brain Diagram Ppt PowerPoint Presentation Slides
This is a big data software application brain diagram ppt powerpoint presentation slides. This is a one stage process. The stages in this process are big data, communication, business, marketing, idea.
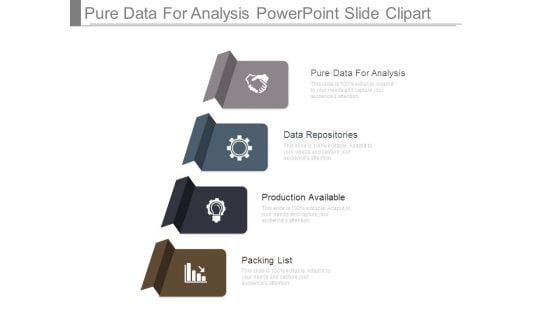
Pure Data For Analysis Powerpoint Slide Clipart
This is a pure data for analysis powerpoint slide clipart. This is a four stage process. The stages in this process are pure data for analysis, data repositories, production available, packing list.
Sales Gap Data Analysis Icon Microsoft PDF
Persuade your audience using this Sales Gap Data Analysis Icon Microsoft PDF. This PPT design covers four stages, thus making it a great tool to use. It also caters to a variety of topics including Sales Gap Data, Analysis Icon. Download this PPT design now to present a convincing pitch that not only emphasizes the topic but also showcases your presentation skills.
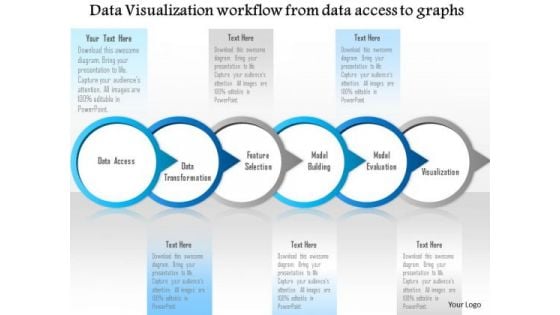
Business Diagram Data Visualization Workflow From Data Access To Graphs Ppt Slide
Graphic of workflow has been used to design this diagram. This diagram slide depicts the concept of data visualization from data access. This diagrams suitable for technology and internet related presentations.
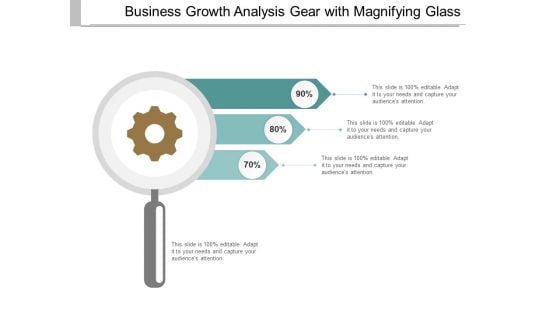
Business Growth Analysis Gear With Magnifying Glass Ppt PowerPoint Presentation Portfolio Graphics
This is a business growth analysis gear with magnifying glass ppt powerpoint presentation portfolio graphics. This is a three stage process. The stages in this process are progress report, growth report, improvement report.
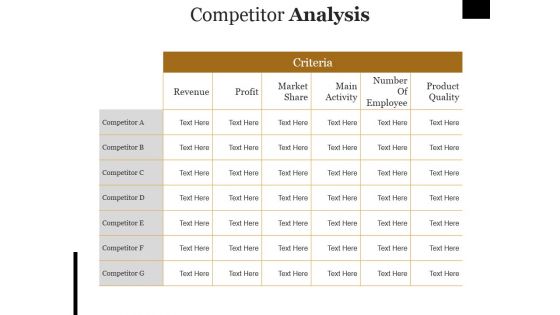
Competitor Analysis Ppt PowerPoint Presentation Outline Rules
This is a competitor analysis ppt powerpoint presentation outline rules. This is a seven stage process. The stages in this process are revenue, profit, market share, main activity, number of employee.
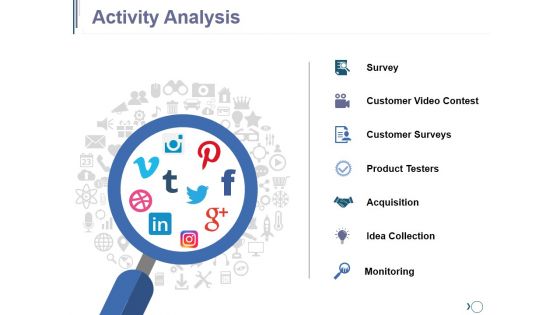
Activity Analysis Ppt PowerPoint Presentation Diagram Images
This is a activity analysis ppt powerpoint presentation diagram images. This is a one stage process. The stages in this process are survey, customer video contest, customer surveys, product testers, acquisition, idea collection.
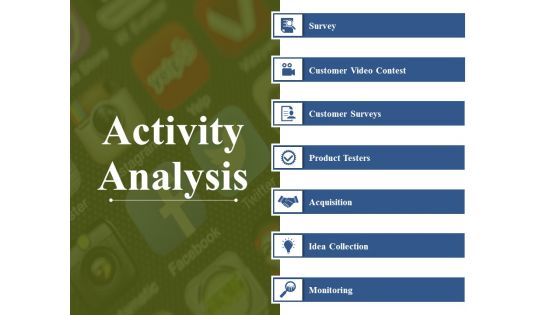
Activity Analysis Ppt PowerPoint Presentation Styles Elements
This is a activity analysis ppt powerpoint presentation styles elements. This is a seven stage process. The stages in this process are survey, customer video contest, customer surveys, product testers, acquisition.
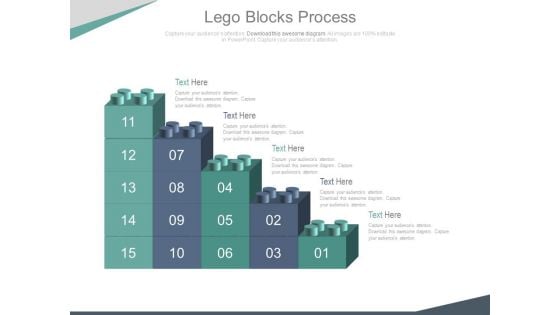
Bar Graph Of Lego Blocks For Data Analysis Powerpoint Slides
This PowerPoint template contains bar graph made of Lego blocks. You may use this slide to display growth process. This diagram provides an effective way of displaying information you can edit text, color, shade and style as per you need.

Data Analysis Business PowerPoint Template 0910
binary data under a magnifying lens. digital illustration. Spread it out in equal doses. Get the portions right with our Data Analysis Business PowerPoint Template 0910.
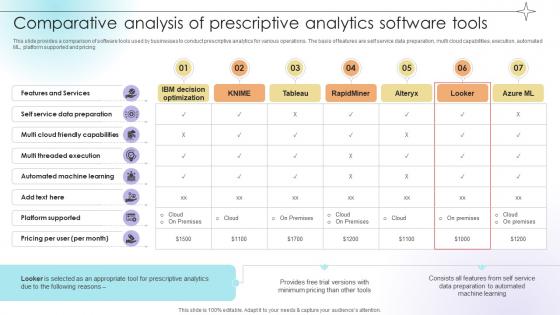
Comparative Analysis Of Prescriptive Analytics Software Tools Data Analytics SS V
This slide provides a comparison of software tools used by businesses to conduct prescriptive analytics for various operations. The basis of features are self service data preparation, multi cloud capabilities, execution, automated ML, platform supported and pricing.Are you searching for a Comparative Analysis Of Prescriptive Analytics Software Tools Data Analytics SS V that is uncluttered, straightforward, and original Its easy to edit, and you can change the colors to suit your personal or business branding. For a presentation that expresses how much effort you have put in, this template is ideal With all of its features, including tables, diagrams, statistics, and lists, its perfect for a business plan presentation. Make your ideas more appealing with these professional slides. Download Comparative Analysis Of Prescriptive Analytics Software Tools Data Analytics SS V from Slidegeeks today. This slide provides a comparison of software tools used by businesses to conduct prescriptive analytics for various operations. The basis of features are self service data preparation, multi cloud capabilities, execution, automated ML, platform supported and pricing.
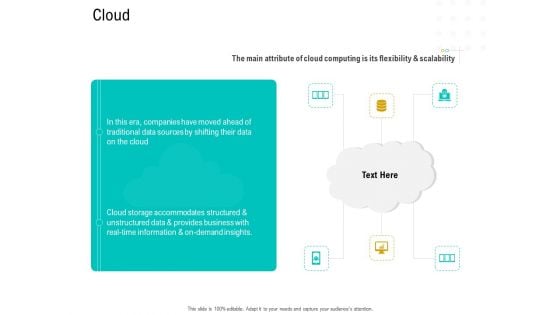
Business Data Analysis Cloud Topics PDF
This is a business data analysis cloud topics pdf template with various stages. Focus and dispense information on six stages using this creative set, that comes with editable features. It contains large content boxes to add your information on topics like Technology. You can also showcase facts, figures, and other relevant content using this PPT layout. Grab it now.

Comprehensive Analysis Of Different Data Lineage Classification Data Lineage And Data Provenance Ideas PDF
This slide represents the data lineage and data provenance that represents data flow at summary and detail levels. The components of both concepts include a file transfer protocol server, data staging area, data warehouse, master data, data marts, and so on. Do you have an important presentation coming up Are you looking for something that will make your presentation stand out from the rest Look no further than Comprehensive Analysis Of Different Data Lineage Classification Data Lineage And Data Provenance Ideas PDF. With our professional designs, you can trust that your presentation will pop and make delivering it a smooth process. And with Slidegeeks, you can trust that your presentation will be unique and memorable. So why wait Grab Comprehensive Analysis Of Different Data Lineage Classification Data Lineage And Data Provenance Ideas PDF today and make your presentation stand out from the rest
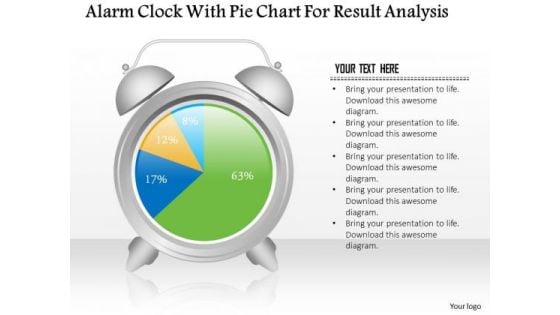
Business Diagram Alarm Clock With Pie Chart For Result Analysis PowerPoint Slide
This business slide displays alarm clock with pie chart. This diagram is a data visualization tool that gives you a simple way to present statistical information. This slide helps your audience examine and interpret the data you present.
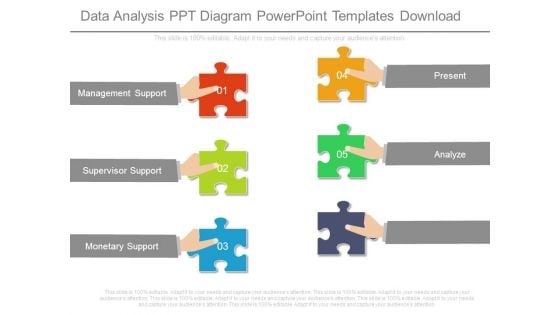
Data Analysis Ppt Diagram Powerpoint Templates Download
This is a data analysis ppt diagram powerpoint templates download. This is a five stage process. The stages in this process are management support, supervisor support, monetary support, present, analyze.
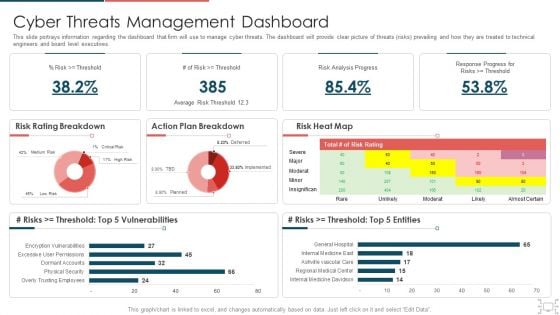
Cyber Security Administration In Organization Cyber Threats Management Dashboard Formats PDF
This slide portrays information regarding the dashboard that firm will use to manage cyber threats. The dashboard will provide clear picture of threats risks prevailing and how they are treated to technical engineers and board level executives. Deliver an awe inspiring pitch with this creative cyber security administration in organization cyber threats management dashboard formats pdf bundle. Topics like cyber threats management dashboard can be discussed with this completely editable template. It is available for immediate download depending on the needs and requirements of the user.
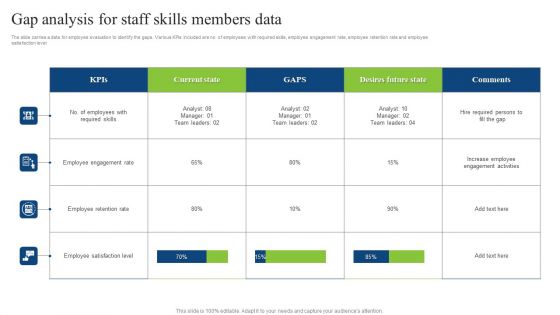
Gap Analysis For Staff Skills Members Data Guidelines PDF
The slide carries a data for employee evaluation to identify the gaps. Various KPIs included are no. of employees with required skills, employee engagement rate, employee retention rate and employee satisfaction level. Showcasing this set of slides titled Gap Analysis For Staff Skills Members Data Guidelines PDF. The topics addressed in these templates are Employee Engagement Rate, Employee Retention Rate. All the content presented in this PPT design is completely editable. Download it and make adjustments in color, background, font etc. as per your unique business setting.
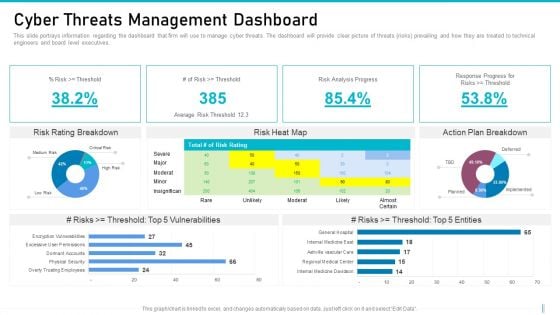
Risk Management For Organization Essential Assets Cyber Threats Management Dashboard Graphics PDF
This slide portrays information regarding the dashboard that firm will use to manage cyber threats. The dashboard will provide clear picture of threats risks prevailing and how they are treated to technical engineers and board level executives. Deliver and pitch your topic in the best possible manner with this risk management for organization essential assets cyber threats management dashboard graphics pdf. Use them to share invaluable insights on risk analysis, vulnerabilities, entities and impress your audience. This template can be altered and modified as per your expectations. So, grab it now.
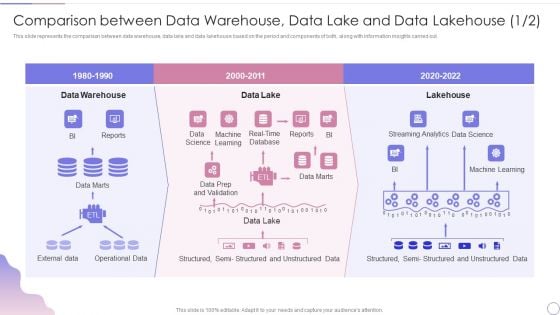
Data Lake Architecture Future Of Data Analysis Comparison Between Data Warehouse Diagrams PDF
This slide represents the comparison between data warehouse, data lake and data lakehouse based on the period and components of both, along with information insights carried out.Deliver and pitch your topic in the best possible manner with this Data Lake Architecture Future Of Data Analysis Comparison Between Data Warehouse Diagrams PDF. Use them to share invaluable insights on Data Warehouse, Unstructured Data, Streaming Analytics and impress your audience. This template can be altered and modified as per your expectations. So, grab it now.
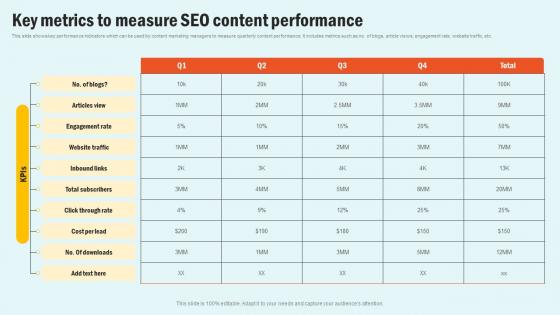
Key Metrics To Measure SEO Enhancing Website Performance With Search Engine Content Background Pdf
This slide shows key performance indicators which can be used by content marketing managers to measure quarterly content performance. It includes metrics such as no. of blogs, article views, engagement rate, website traffic, etc. Formulating a presentation can take up a lot of effort and time, so the content and message should always be the primary focus. The visuals of the PowerPoint can enhance the presenters message, so our Key Metrics To Measure SEO Enhancing Website Performance With Search Engine Content Background Pdf was created to help save time. Instead of worrying about the design, the presenter can concentrate on the message while our designers work on creating the ideal templates for whatever situation is needed. Slidegeeks has experts for everything from amazing designs to valuable content, we have put everything into Key Metrics To Measure SEO Enhancing Website Performance With Search Engine Content Background Pdf This slide shows key performance indicators which can be used by content marketing managers to measure quarterly content performance. It includes metrics such as no. of blogs, article views, engagement rate, website traffic, etc.
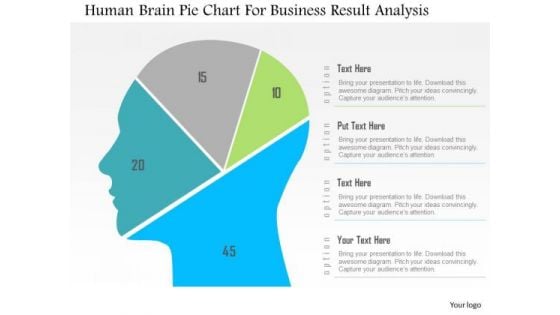
Business Diagram Human Brain Pie Chart For Business Result Analysis PowerPoint Slide
This diagram displays human face graphic divided into sections. This section can be used for data display. Use this diagram to build professional presentations for your viewers.


 Continue with Email

 Home
Home


