Executive Project Dashboard
Marketing Anthropometric Data In Powerpoint And Google Slides Cpb
Presenting our innovatively designed set of slides titled Marketing Anthropometric Data In Powerpoint And Google Slides Cpb. This completely editable PowerPoint graphic exhibits Marketing Anthropometric Data that will help you convey the message impactfully. It can be accessed with Google Slides and is available in both standard screen and widescreen aspect ratios. Apart from this, you can download this well structured PowerPoint template design in different formats like PDF, JPG, and PNG. So, click the download button now to gain full access to this PPT design. Our Marketing Anthropometric Data In Powerpoint And Google Slides Cpb are topically designed to provide an attractive backdrop to any subject. Use them to look like a presentation pro.
Power Point Arrows Stepwise Process 6 Stages PowerPoint Templates Backgrounds For Slide
We present our power point arrows stepwise process 6 stages PowerPoint templates backgrounds for slide.Use our Process and Flows PowerPoint Templates because It will mark the footprints of your journey. Illustrate how they will lead you to your desired destination. Use our Arrows PowerPoint Templates because It will mark the footprints of your journey. Illustrate how they will lead you to your desired destination. Download our Success PowerPoint Templates because Timeline crunches are a fact of life. Meet all deadlines using our PowerPoint Templates and Slides. Download our Marketing PowerPoint Templates because Our PowerPoint Templates and Slides offer you the needful to organise your thoughts. Use them to list out your views in a logical sequence. Present our Business PowerPoint Templates because You should Ascend the ladder of success with ease. Our PowerPoint Templates and Slides will provide strong and sturdy steps.Use these PowerPoint slides for presentations relating to Arrow, art, background,blank, business, chart, concept,connection, cycle, development,diagram, direction, element,environment, exchange, finance,financial, flow, graph, graphic, graphic,presentation, group, icon, illustration,investment, isolated, isometric, market,motion, movement, organization, passive,income, perspective, process, process chart, recycle, report, sign, step. The prominent colors used in the PowerPoint template are Brown, White, Gray. PowerPoint presentation experts tell us our power point arrows stepwise process 6 stages PowerPoint templates backgrounds for slide provide great value for your money. Be assured of finding the best projection to highlight your words. Presenters tell us our chart PowerPoint templates and PPT Slides will make you look like a winner. Use our power point arrows stepwise process 6 stages PowerPoint templates backgrounds for slide help you meet deadlines which are an element of today's workplace. Just browse and pick the slides that appeal to your intuitive senses. People tell us our connection PowerPoint templates and PPT Slides are readymade to fit into any presentation structure. Presenters tell us our power point arrows stepwise process 6 stages PowerPoint templates backgrounds for slide will make you look like a winner. Presenters tell us our chart PowerPoint templates and PPT Slides are designed by a team of presentation professionals. Whatever the facet you have in mind? You will find it covered by our Power Point Arrows Stepwise Process 6 Stages PowerPoint Templates Backgrounds For Slide.
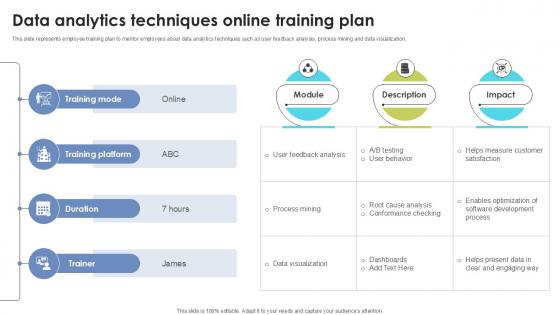
Data Analytics Techniques Online Skill Building Plan For Application PPT Example DTE SS V
This slide represents employee training plan to mentor employees about data analytics techniques such as user feedback analysis, process mining and data visualization. Do you have to make sure that everyone on your team knows about any specific topic I yes, then you should give Data Analytics Techniques Online Skill Building Plan For Application PPT Example DTE SS V a try. Our experts have put a lot of knowledge and effort into creating this impeccable Data Analytics Techniques Online Skill Building Plan For Application PPT Example DTE SS V. You can use this template for your upcoming presentations, as the slides are perfect to represent even the tiniest detail. You can download these templates from the Slidegeeks website and these are easy to edit. So grab these today This slide represents employee training plan to mentor employees about data analytics techniques such as user feedback analysis, process mining and data visualization.

Prescriptive Analytics Software Tool Tableau Data Analytics SS V
This slide provides overview of Tableau as a data analytics tools providing data visualization features. It covers details of Tableau regarding description, features and pricing plans.Retrieve professionally designed Prescriptive Analytics Software Tool Tableau Data Analytics SS V to effectively convey your message and captivate your listeners. Save time by selecting pre-made slideshows that are appropriate for various topics, from business to educational purposes. These themes come in many different styles, from creative to corporate, and all of them are easily adjustable and can be edited quickly. Access them as PowerPoint templates or as Google Slides themes. You do not have to go on a hunt for the perfect presentation because Slidegeeks got you covered from everywhere. This slide provides overview of Tableau as a data analytics tools providing data visualization features. It covers details of Tableau regarding description, features and pricing plans.
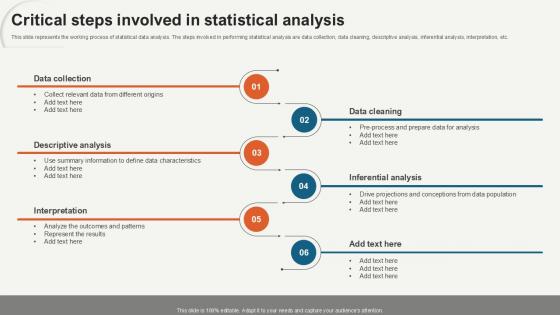
Critical Steps Involved In Statistical Data Analytics For Informed Decision Ppt Presentation
This slide represents the working process of statistical data analysis. The steps involved in performing statistical analysis are data collection, data cleaning, descriptive analysis, inferential analysis, interpretation, etc. Slidegeeks is here to make your presentations a breeze with Critical Steps Involved In Statistical Data Analytics For Informed Decision Ppt Presentation With our easy-to-use and customizable templates, you can focus on delivering your ideas rather than worrying about formatting. With a variety of designs to choose from, you are sure to find one that suits your needs. And with animations and unique photos, illustrations, and fonts, you can make your presentation pop. So whether you are giving a sales pitch or presenting to the board, make sure to check out Slidegeeks first This slide represents the working process of statistical data analysis. The steps involved in performing statistical analysis are data collection, data cleaning, descriptive analysis, inferential analysis, interpretation, etc.
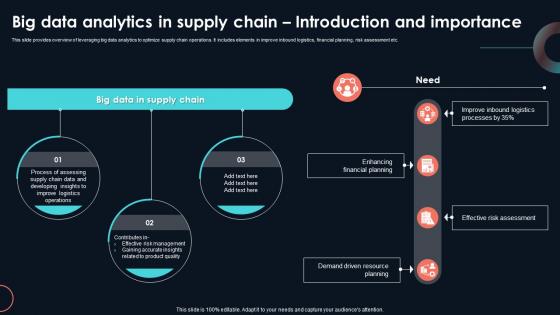
Big Data Analytics In Supply Chain Developing Strategic Insights Using Big Data Analytics SS V
This slide provides overview of leveraging big data analytics to optimize supply chain operations. It includes elements in improve inbound logistics, financial planning, risk assessment etc. Crafting an eye-catching presentation has never been more straightforward. Let your presentation shine with this tasteful yet straightforward Big Data Analytics In Supply Chain Developing Strategic Insights Using Big Data Analytics SS V template. It offers a minimalistic and classy look that is great for making a statement. The colors have been employed intelligently to add a bit of playfulness while still remaining professional. Construct the ideal Big Data Analytics In Supply Chain Developing Strategic Insights Using Big Data Analytics SS V that effortlessly grabs the attention of your audience Begin now and be certain to wow your customers This slide provides overview of leveraging big data analytics to optimize supply chain operations. It includes elements in improve inbound logistics, financial planning, risk assessment etc.
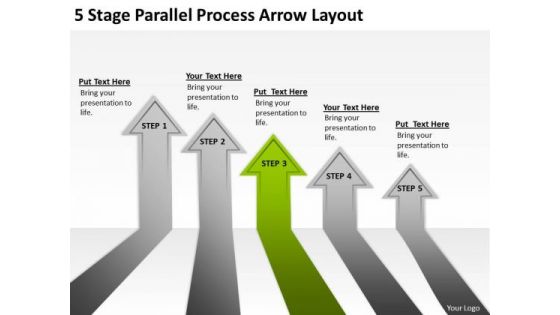
5 Stage Parallel Process Arrow Layout Writing Business Plan Examples PowerPoint Slides
We present our 5 stage parallel process arrow layout writing business plan examples PowerPoint Slides.Use our Arrows PowerPoint Templates because Our PowerPoint Templates and Slides will definately Enhance the stature of your presentation. Adorn the beauty of your thoughts with their colourful backgrounds. Download and present our Symbol PowerPoint Templates because Your audience will believe you are the cats whiskers. Download our Business PowerPoint Templates because Our PowerPoint Templates and Slides are the chords of your song. String them along and provide the lilt to your views. Present our Process and Flows PowerPoint Templates because You can Inspire your team with our PowerPoint Templates and Slides. Let the force of your ideas flow into their minds. Present our Shapes PowerPoint Templates because Our PowerPoint Templates and Slides are designed to help you succeed. They have all the ingredients you need.Use these PowerPoint slides for presentations relating to Abstract, Arrow, Arrows, Business, Chart, Design, Development, Diagram, Direction, Element, Flow, Flowchart, Graph, Linear, Management, Model, Motion, Organization, Plan, Process, Program, Section, Segment, Set, Sign, Solution, Strategy, Symbol, Technology. The prominent colors used in the PowerPoint template are Green, Gray, Black. People tell us our 5 stage parallel process arrow layout writing business plan examples PowerPoint Slides will help them to explain complicated concepts. Customers tell us our Arrows PowerPoint templates and PPT Slides are the best it can get when it comes to presenting. You can be sure our 5 stage parallel process arrow layout writing business plan examples PowerPoint Slides are incredible easy to use. You can be sure our Development PowerPoint templates and PPT Slides are designed by professionals Presenters tell us our 5 stage parallel process arrow layout writing business plan examples PowerPoint Slides are readymade to fit into any presentation structure. People tell us our Business PowerPoint templates and PPT Slides provide great value for your money. Be assured of finding the best projection to highlight your words. Examine data with our 5 Stage Parallel Process Arrow Layout Writing Business Plan Examples PowerPoint Slides. You will come out on top.

Prescriptive Analytics Software Tool Google Looker Data Analytics SS V
This slide provides overview of Google Looker as a data analytics tool. It covers details of Google Looker regarding description, unique selling propositions, features and pricing plans.Explore a selection of the finest Prescriptive Analytics Software Tool Google Looker Data Analytics SS V here. With a plethora of professionally designed and pre-made slide templates, you can quickly and easily find the right one for your upcoming presentation. You can use our Prescriptive Analytics Software Tool Google Looker Data Analytics SS V to effectively convey your message to a wider audience. Slidegeeks has done a lot of research before preparing these presentation templates. The content can be personalized and the slides are highly editable. Grab templates today from Slidegeeks. This slide provides overview of Google Looker as a data analytics tool. It covers details of Google Looker regarding description, unique selling propositions, features and pricing plans.
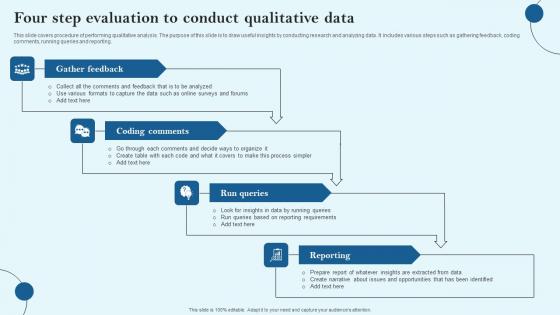
Four Step Evaluation To Conduct Qualitative Data Graphics Pdf
This slide covers procedure of performing qualitative analysis. The purpose of this slide is to draw useful insights by conducting research and analyzing data. It includes various steps such as gathering feedback, coding comments, running queries and reporting. Showcasing this set of slides titled Four Step Evaluation To Conduct Qualitative Data Graphics Pdf The topics addressed in these templates are Gather Feedback, Coding Comments, Run Queries All the content presented in this PPT design is completely editable. Download it and make adjustments in color, background, font etc. as per your unique business setting. This slide covers procedure of performing qualitative analysis. The purpose of this slide is to draw useful insights by conducting research and analyzing data. It includes various steps such as gathering feedback, coding comments, running queries and reporting.

Benefits Of Using Big Data Analytics In Developing Strategic Insights Using Big Data Analytics SS V
This slide showcases impact of using big data analytics software for enhancing logistics operations and improving overall business performance. It provides information regarding key focus areas such as sales, operations planning, sourcing, production, warehousing, transportation etc. Get a simple yet stunning designed Benefits Of Using Big Data Analytics In Developing Strategic Insights Using Big Data Analytics SS V. It is the best one to establish the tone in your meetings. It is an excellent way to make your presentations highly effective. So, download this PPT today from Slidegeeks and see the positive impacts. Our easy-to-edit Benefits Of Using Big Data Analytics In Developing Strategic Insights Using Big Data Analytics SS V can be your go-to option for all upcoming conferences and meetings. So, what are you waiting for Grab this template today. This slide showcases impact of using big data analytics software for enhancing logistics operations and improving overall business performance. It provides information regarding key focus areas such as sales, operations planning, sourcing, production, warehousing, transportation etc.
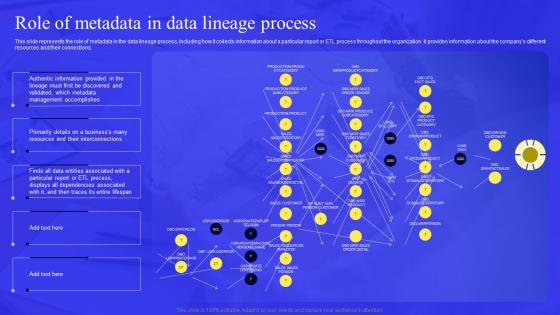
Business Process Data Lineage Role Of Metadata In Data Lineage Process Portrait Pdf
This slide represents the role of metadata in the data lineage process, including how it collects information about a particular report or ETL process throughout the organization. It provides information about the companys different resources and their connections. Do you have an important presentation coming up Are you looking for something that will make your presentation stand out from the rest Look no further than Business Process Data Lineage Role Of Metadata In Data Lineage Process Portrait Pdf. With our professional designs, you can trust that your presentation will pop and make delivering it a smooth process. And with Slidegeeks, you can trust that your presentation will be unique and memorable. So why wait Grab Business Process Data Lineage Role Of Metadata In Data Lineage Process Portrait Pdf today and make your presentation stand out from the rest This slide represents the role of metadata in the data lineage process, including how it collects information about a particular report or ETL process throughout the organization. It provides information about the companys different resources and their connections.
Magnifying Ppt PowerPoint Presentation Background Designs
This is a magnifying ppt powerpoint presentation background designs. This is a four stage process. The stages in this process are business, marketing, success, management, icons.
Big Data Analytics Implementation In Developing Strategic Insights Using Big Data Analytics SS V
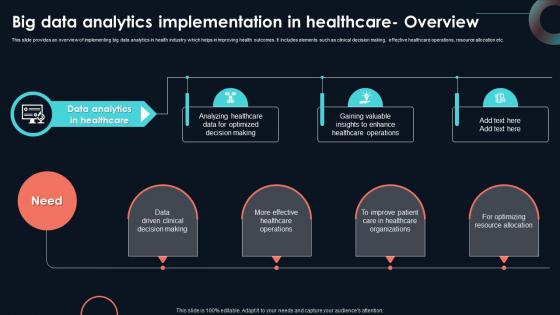
This slide provides an overview of implementing big data analytics in health industry which helps in improving health outcomes. It includes elements such as clinical decision making, effective healthcare operations, resource allocation etc. If you are looking for a format to display your unique thoughts, then the professionally designed Big Data Analytics Implementation In Developing Strategic Insights Using Big Data Analytics SS V is the one for you. You can use it as a Google Slides template or a PowerPoint template. Incorporate impressive visuals, symbols, images, and other charts. Modify or reorganize the text boxes as you desire. Experiment with shade schemes and font pairings. Alter, share or cooperate with other people on your work. Download Big Data Analytics Implementation In Developing Strategic Insights Using Big Data Analytics SS V and find out how to give a successful presentation. Present a perfect display to your team and make your presentation unforgettable. This slide provides an overview of implementing big data analytics in health industry which helps in improving health outcomes. It includes elements such as clinical decision making, effective healthcare operations, resource allocation etc.

SIEM Services Security Information And Event Management Services Ppt Ideas Design Ideas PDF
This slide covers the SIEM services offered by our company such as data aggregation, correlation, security alerts, dashboards, retention, forensic analysis, IT compliance, threat detection, etc. This is a siem services security information and event management services ppt ideas design ideas pdf template with various stages. Focus and dispense information on eight stages using this creative set, that comes with editable features. It contains large content boxes to add your information on topics like data correlation, data aggregation, security alert, dashboards. You can also showcase facts, figures, and other relevant content using this PPT layout. Grab it now.
Icon Showing Data Insights At Edge Analytics Demonstration Pdf
Pitch your topic with ease and precision using this Icon Showing Data Insights At Edge Analytics Demonstration Pdf This layout presents information on Icon Showing, Data Insights, Edge Analytics It is also available for immediate download and adjustment. So, changes can be made in the color, design, graphics or any other component to create a unique layout. Our Icon Showing Data Insights At Edge Analytics Demonstration Pdf are topically designed to provide an attractive backdrop to any subject. Use them to look like a presentation pro.
Big Data Use Cases In Financial Services Ppt Layouts Infographic Template pdf
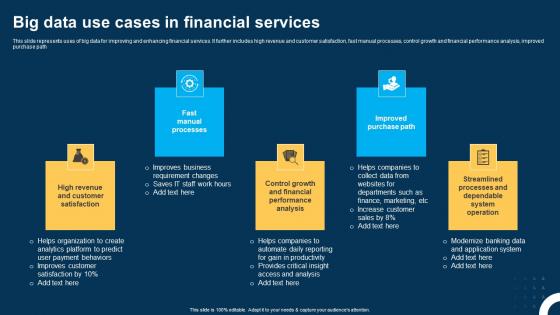
This slide represents uses of big data for improving and enhancing financial services. It further includes high revenue and customer satisfaction, fast manual processes, control growth and financial performance analysis, improved purchase path. Showcasing this set of slides titled Big Data Use Cases In Financial Services Ppt Layouts Infographic Template pdf. The topics addressed in these templates are Fast Manual Processes, Improved Purchase Path, High Revenue. All the content presented in this PPT design is completely editable. Download it and make adjustments in color, background, font etc. as per your unique business setting. This slide represents uses of big data for improving and enhancing financial services. It further includes high revenue and customer satisfaction, fast manual processes, control growth and financial performance analysis, improved purchase path.
Technology Analytics Using Splunk Big Data Microsoft Pdf
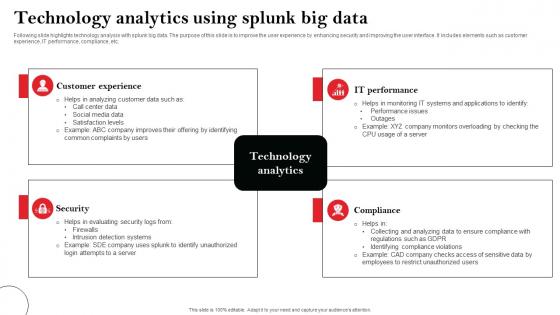
Following slide highlights technology analysis with splunk big data. The purpose of this slide is to improve the user experience by enhancing security and improving the user interface. It includes elements such as customer experience, IT performance, compliance, etc. Pitch your topic with ease and precision using this Technology Analytics Using Splunk Big Data Microsoft Pdf This layout presents information on Customer Experience, Security, Compliance It is also available for immediate download and adjustment. So, changes can be made in the color, design, graphics or any other component to create a unique layout. Following slide highlights technology analysis with splunk big data. The purpose of this slide is to improve the user experience by enhancing security and improving the user interface. It includes elements such as customer experience, IT performance, compliance, etc.
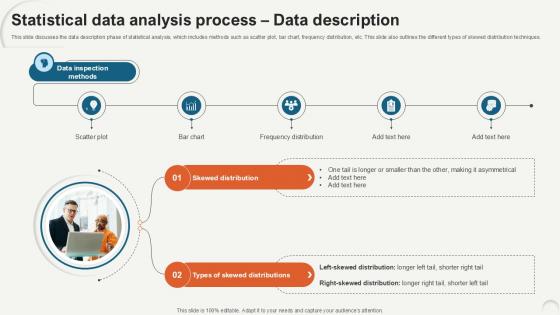
Statistical Data Analysis Process Data Description Ppt Example
This slide discusses the data description phase of statistical analysis, which includes methods such as scatter plot, bar chart, frequency distribution, etc. This slide also outlines the different types of skewed distribution techniques. Create an editable Statistical Data Analysis Process Data Description Ppt Example that communicates your idea and engages your audience. Whether you are presenting a business or an educational presentation, pre-designed presentation templates help save time. Statistical Data Analysis Process Data Description Ppt Example is highly customizable and very easy to edit, covering many different styles from creative to business presentations. Slidegeeks has creative team members who have crafted amazing templates. So, go and get them without any delay. This slide discusses the data description phase of statistical analysis, which includes methods such as scatter plot, bar chart, frequency distribution, etc. This slide also outlines the different types of skewed distribution techniques.
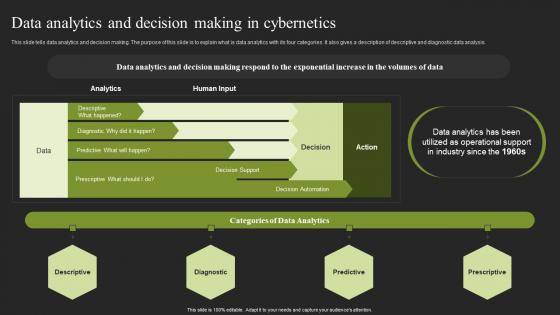
Data Analytics And Decision Making In Cybernetics Cybernetic Systems Inspiration Pdf
This slide tells data analytics and decision making. The purpose of this slide is to explain what is data analytics with its four categories. It also gives a description of descriptive and diagnostic data analysis. Welcome to our selection of the Data Analytics And Decision Making In Cybernetics Cybernetic Systems Inspiration Pdf. These are designed to help you showcase your creativity and bring your sphere to life. Planning and Innovation are essential for any business that is just starting out. This collection contains the designs that you need for your everyday presentations. All of our PowerPoints are 100 percent editable, so you can customize them to suit your needs. This multi purpose template can be used in various situations. Grab these presentation templates today This slide tells data analytics and decision making. The purpose of this slide is to explain what is data analytics with its four categories. It also gives a description of descriptive and diagnostic data analysis.

Prescriptive Analytics Software Tool Alteryx Data Analytics SS V
This slide provides an overview of advanced analytic tool Alteryx. It covers details regarding unique selling propositions, customer reviews and pricing plans of Alteryx.This Prescriptive Analytics Software Tool Alteryx Data Analytics SS V is perfect for any presentation, be it in front of clients or colleagues. It is a versatile and stylish solution for organizing your meetings. The Prescriptive Analytics Software Tool Alteryx Data Analytics SS V features a modern design for your presentation meetings. The adjustable and customizable slides provide unlimited possibilities for acing up your presentation. Slidegeeks has done all the homework before launching the product for you. So, do not wait, grab the presentation templates today This slide provides an overview of advanced analytic tool Alteryx. It covers details regarding unique selling propositions, customer reviews and pricing plans of Alteryx.
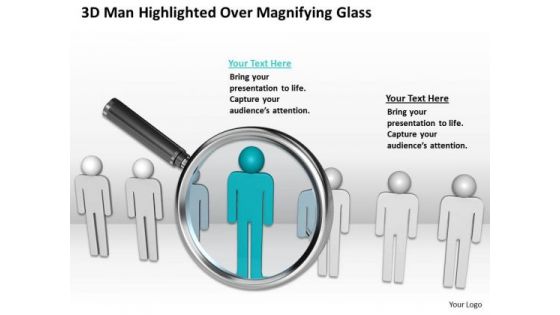
Business Development Process Flowchart Man Highlighted Over Magnifying Glass PowerPoint Templates
We present our business development process flowchart man highlighted over magnifying glass PowerPoint templates.Download and present our Symbol PowerPoint Templates because Our PowerPoint Templates and Slides will let you Clearly mark the path for others to follow. Download and present our People PowerPoint Templates because You can Score a slam dunk with our PowerPoint Templates and Slides. Watch your audience hang onto your every word. Download and present our Business PowerPoint Templates because Our PowerPoint Templates and Slides will give good value for money. They also have respect for the value of your time. Use our Magnifier Glasses PowerPoint Templates because Our PowerPoint Templates and Slides will steer your racing mind. Hit the right buttons and spur on your audience. Download and present our Shapes PowerPoint Templates because It will let you Set new benchmarks with our PowerPoint Templates and Slides. They will keep your prospects well above par.Use these PowerPoint slides for presentations relating to 3d, Abstract, Analyzing, Background, Blue, Boss, Business, Concept, Discovery, Employment, Enlarge, Examine, Find, Focus, Glass, Human, Illustration, Individuality, Inspect, Inspection, Investigation, Isolated, Job, Leader, Leadership, Lens, Look, Magnifier, Magnify, Magnifying, Men, People, Person, Quest, Red, Research, Resources, Row, Search, Selection, Series, Solution, Symbol, Team, Teamwork. The prominent colors used in the PowerPoint template are Blue, Gray, Black. PowerPoint presentation experts tell us our business development process flowchart man highlighted over magnifying glass PowerPoint templates help you meet deadlines which are an element of today's workplace. Just browse and pick the slides that appeal to your intuitive senses. Use our Concept PowerPoint templates and PPT Slides are second to none. You can be sure our business development process flowchart man highlighted over magnifying glass PowerPoint templates provide great value for your money. Be assured of finding the best projection to highlight your words. Presenters tell us our Concept PowerPoint templates and PPT Slides are effectively colour coded to prioritise your plans They automatically highlight the sequence of events you desire. You can be sure our business development process flowchart man highlighted over magnifying glass PowerPoint templates will get their audience's attention. Professionals tell us our Concept PowerPoint templates and PPT Slides are readymade to fit into any presentation structure. Earn the esteem of your colleagues with our Business Development Process Flowchart Man Highlighted Over Magnifying Glass PowerPoint Templates. Give your thoughts that something special.
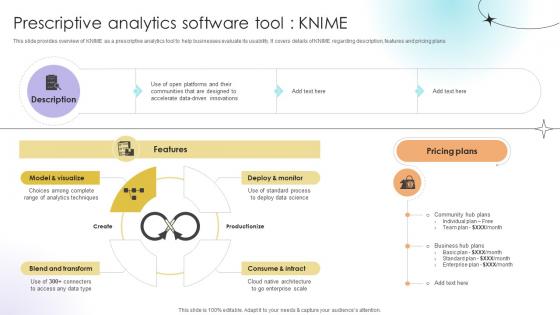
Prescriptive Analytics Software Tool Knime Data Analytics SS V
This slide provides overview of KNIME as a prescriptive analytics tool to help businesses evaluate its usability. It covers details of KNIME regarding description, features and pricing plans.The Prescriptive Analytics Software Tool Knime Data Analytics SS V is a compilation of the most recent design trends as a series of slides. It is suitable for any subject or industry presentation, containing attractive visuals and photo spots for businesses to clearly express their messages. This template contains a variety of slides for the user to input data, such as structures to contrast two elements, bullet points, and slides for written information. Slidegeeks is prepared to create an impression. This slide provides overview of KNIME as a prescriptive analytics tool to help businesses evaluate its usability. It covers details of KNIME regarding description, features and pricing plans.
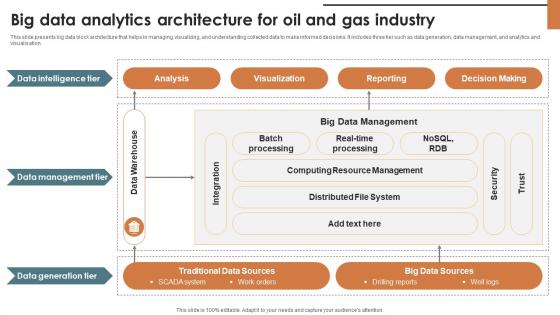
IoT Solutions For Oil Big Data Analytics Architecture For Oil And Gas Industry IoT SS V
This slide presents big data block architecture that helps in managing, visualizing, and understanding collected data to make informed decisions. It includes three tier such as data generation, data management, and analytics and visualisation. From laying roadmaps to briefing everything in detail, our templates are perfect for you. You can set the stage with your presentation slides. All you have to do is download these easy-to-edit and customizable templates. IoT Solutions For Oil Big Data Analytics Architecture For Oil And Gas Industry IoT SS V will help you deliver an outstanding performance that everyone would remember and praise you for. Do download this presentation today. This slide presents big data block architecture that helps in managing, visualizing, and understanding collected data to make informed decisions. It includes three tier such as data generation, data management, and analytics and visualisation.
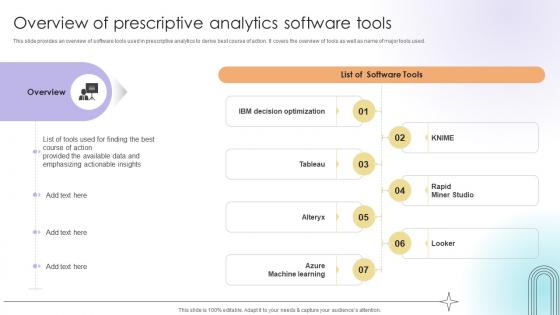
Overview Of Prescriptive Analytics Software Tools Data Analytics SS V
This slide provides an overview of software tools used in prescriptive analytics to derive best course of action. It covers the overview of tools as well as name of major tools used.Formulating a presentation can take up a lot of effort and time, so the content and message should always be the primary focus. The visuals of the PowerPoint can enhance the presenters message, so our Overview Of Prescriptive Analytics Software Tools Data Analytics SS V was created to help save time. Instead of worrying about the design, the presenter can concentrate on the message while our designers work on creating the ideal templates for whatever situation is needed. Slidegeeks has experts for everything from amazing designs to valuable content, we have put everything into Overview Of Prescriptive Analytics Software Tools Data Analytics SS V. This slide provides an overview of software tools used in prescriptive analytics to derive best course of action. It covers the overview of tools as well as name of major tools used.
Power Point Arrows Stepwise Process 6 Stages Ppt PowerPoint Templates Backgrounds For Slides
We present our power point arrows stepwise process 6 stages ppt PowerPoint templates backgrounds for slides.Download our Process and Flows PowerPoint Templates because Our PowerPoint Templates and Slides will let your ideas bloom. Create a bed of roses for your audience. Present our Flow Charts PowerPoint Templates because Your audience will believe you are the cats whiskers. Download and present our Arrows PowerPoint Templates because You have gained great respect for your brilliant ideas. Use our PowerPoint Templates and Slides to strengthen and enhance your reputation. Use our Marketing PowerPoint Templates because Our PowerPoint Templates and Slides will let your team Walk through your plans. See their energy levels rise as you show them the way. Present our Future PowerPoint Templates because Our PowerPoint Templates and Slides will provide weight to your words. They will bring out the depth of your thought process.Use these PowerPoint slides for presentations relating to Arrow, art, business, chart, concept,connection, cycle, development,diagram, direction, element,environment, exchange, finance,financial, flow, graph, graphic, graphic,presentation, group, icon, illustration,investment, isolated, isometric, market,motion, movement, organization, passive,income, perspective, process, process chart, recycle, report, sign, step. The prominent colors used in the PowerPoint template are Brown, White, Gray. PowerPoint presentation experts tell us our power point arrows stepwise process 6 stages ppt PowerPoint templates backgrounds for slides are visually appealing. Presenters tell us our business PowerPoint templates and PPT Slides help you meet deadlines which are an element of today's workplace. Just browse and pick the slides that appeal to your intuitive senses. Use our power point arrows stepwise process 6 stages ppt PowerPoint templates backgrounds for slides are incredible easy to use. People tell us our development PowerPoint templates and PPT Slides will impress their bosses and teams. Presenters tell us our power point arrows stepwise process 6 stages ppt PowerPoint templates backgrounds for slides are designed to make your presentations professional. Presenters tell us our cycle PowerPoint templates and PPT Slides provide great value for your money. Be assured of finding the best projection to highlight your words. Fade away doubts with our Power Point Arrows Stepwise Process 6 Stages Ppt PowerPoint Templates Backgrounds For Slides. You will come out on top.
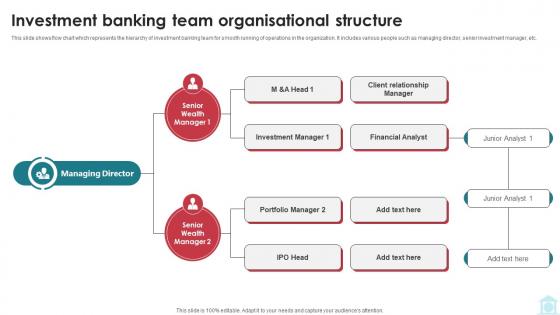
Investment Banking Team Organisational Structure Mastering Investment Banking Fin SS V
This slide shows flow chart which represents the hierarchy of investment banking team for smooth running of operations in the organization. It includes various people such as managing director, senior investment manager, etc. The Investment Banking Team Organisational Structure Mastering Investment Banking Fin SS V is a compilation of the most recent design trends as a series of slides. It is suitable for any subject or industry presentation, containing attractive visuals and photo spots for businesses to clearly express their messages. This template contains a variety of slides for the user to input data, such as structures to contrast two elements, bullet points, and slides for written information. Slidegeeks is prepared to create an impression. This slide shows flow chart which represents the hierarchy of investment banking team for smooth running of operations in the organization. It includes various people such as managing director, senior investment manager, etc.
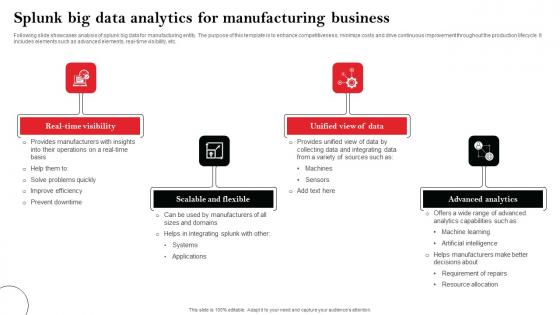
Splunk Big Data Analytics For Manufacturing Business Ideas Pdf
Following slide showcases analysis of splunk big data for manufacturing entity. The purpose of this template is to enhance competitiveness, minimize costs and drive continuous improvement throughout the production lifecycle. It includes elements such as advanced elements, real-time visibility, etc. Pitch your topic with ease and precision using this Splunk Big Data Analytics For Manufacturing Business Ideas Pdf This layout presents information on Real-Time Visibility, Scalable And Flexible, Advanced Analytics It is also available for immediate download and adjustment. So, changes can be made in the color, design, graphics or any other component to create a unique layout. Following slide showcases analysis of splunk big data for manufacturing entity. The purpose of this template is to enhance competitiveness, minimize costs and drive continuous improvement throughout the production lifecycle. It includes elements such as advanced elements, real-time visibility, etc.
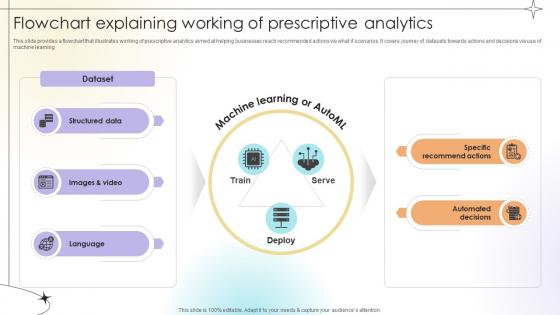
Flowchart Explaining Working Of Prescriptive Analytics Data Analytics SS V
This slide provides a flowchart that illustrates working of prescriptive analytics aimed at helping businesses reach recommended actions via what if scenarios. It covers journey of datasets towards actions and decisions via use of machine learning.This Flowchart Explaining Working Of Prescriptive Analytics Data Analytics SS V from Slidegeeks makes it easy to present information on your topic with precision. It provides customization options, so you can make changes to the colors, design, graphics, or any other component to create a unique layout. It is also available for immediate download, so you can begin using it right away. Slidegeeks has done good research to ensure that you have everything you need to make your presentation stand out. Make a name out there for a brilliant performance. This slide provides a flowchart that illustrates working of prescriptive analytics aimed at helping businesses reach recommended actions via what if scenarios. It covers journey of datasets towards actions and decisions via use of machine learning.

Prescriptive Analytics Software Tool Rapidminer Data Analytics SS V
This slide provides overview of RapidMiner as a prescriptive analytics tool to help businesses evaluate its usability. It covers details of RapidMiner regarding description, features and pricing plans.Are you searching for a Prescriptive Analytics Software Tool Rapidminer Data Analytics SS V that is uncluttered, straightforward, and original Its easy to edit, and you can change the colors to suit your personal or business branding. For a presentation that expresses how much effort you have put in, this template is ideal With all of its features, including tables, diagrams, statistics, and lists, its perfect for a business plan presentation. Make your ideas more appealing with these professional slides. Download Prescriptive Analytics Software Tool Rapidminer Data Analytics SS V from Slidegeeks today. This slide provides overview of RapidMiner as a prescriptive analytics tool to help businesses evaluate its usability. It covers details of RapidMiner regarding description, features and pricing plans.
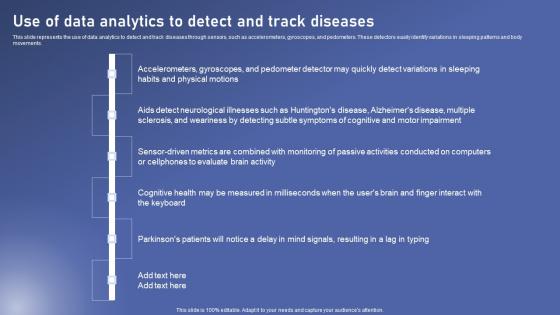
Use Of Data Analytics Detect Biomedical Data Science And Health Informatics Clipart Pdf
This slide represents the use of data analytics to detect and track diseases through sensors, such as accelerometers, gyroscopes, and pedometers. These detectors easily identify variations in sleeping patterns and body movements. Whether you have daily or monthly meetings, a brilliant presentation is necessary. Use Of Data Analytics Detect Biomedical Data Science And Health Informatics Clipart Pdf can be your best option for delivering a presentation. Represent everything in detail using Use Of Data Analytics Detect Biomedical Data Science And Health Informatics Clipart Pdf and make yourself stand out in meetings. The template is versatile and follows a structure that will cater to your requirements. All the templates prepared by Slidegeeks are easy to download and edit. Our research experts have taken care of the corporate themes as well. So, give it a try and see the results. This slide represents the use of data analytics to detect and track diseases through sensors, such as accelerometers, gyroscopes, and pedometers. These detectors easily identify variations in sleeping patterns and body movements.
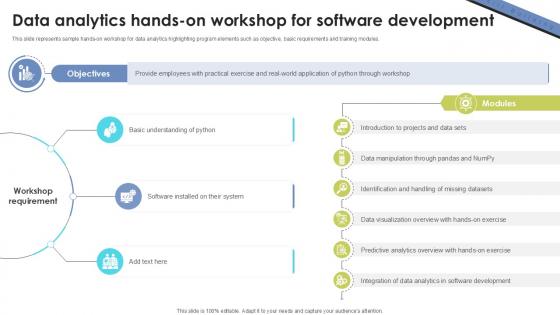
Data Analytics Hands On Workshop Skill Building Plan For Application PPT Slide DTE SS V
This slide represents sample hands-on workshop for data analytics highlighting program elements such as objective, basic requirements and training modules. There are so many reasons you need a Data Analytics Hands On Workshop Skill Building Plan For Application PPT Slide DTE SS V. The first reason is you can not spend time making everything from scratch, Thus, Slidegeeks has made presentation templates for you too. You can easily download these templates from our website easily. This slide represents sample hands-on workshop for data analytics highlighting program elements such as objective, basic requirements and training modules.
Best Practices For Efficient Power Consumption Management Sample PDF
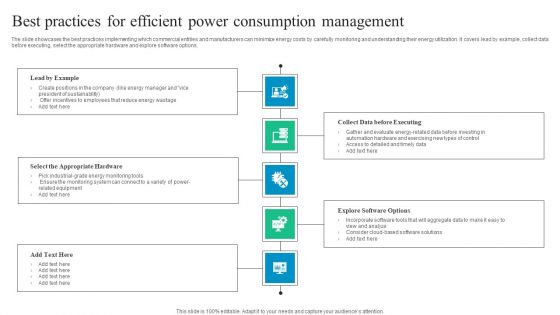
The slide showcases the best practices implementing which commercial entities and manufacturers can minimize energy costs by carefully monitoring and understanding their energy utilization. It covers lead by example, collect data before executing, select the appropriate hardware and explore software options. Persuade your audience using this Best Practices For Efficient Power Consumption Management Sample PDF. This PPT design covers five stages, thus making it a great tool to use. It also caters to a variety of topics including Appropriate Hardware, Collect Data Before Executing, Explore Software Options. Download this PPT design now to present a convincing pitch that not only emphasizes the topic but also showcases your presentation skills.
Use Case Of Splunk Big Data For Security Intelligence Elements Pdf
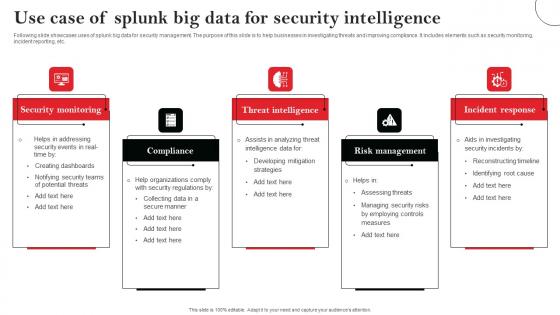
Following slide showcases uses of splunk big data for security management. The purpose of this slide is to help businesses in investigating threats and improving compliance. It includes elements such as security monitoring, incident reporting, etc. Showcasing this set of slides titled Use Case Of Splunk Big Data For Security Intelligence Elements Pdf The topics addressed in these templates are Security Monitoring, Compliance, Threat Intelligence All the content presented in this PPT design is completely editable. Download it and make adjustments in color, background, font etc. as per your unique business setting. Following slide showcases uses of splunk big data for security management. The purpose of this slide is to help businesses in investigating threats and improving compliance. It includes elements such as security monitoring, incident reporting, etc.
Iteration Planning Agile Ppt PowerPoint Presentation Slides Microsoft Cpb
This is a iteration planning agile ppt powerpoint presentation slides microsoft cpb. This is a five stage process. The stages in this process are iteration planning agile.

Business Action Plans Ppt PowerPoint Presentation Portfolio Layouts Cpb
This is a business action plans ppt powerpoint presentation portfolio layouts cpb. This is a three stage process. The stages in this process are business action plans.
Supply Chain Optimization With Splunk Big Data Graphics Pdf
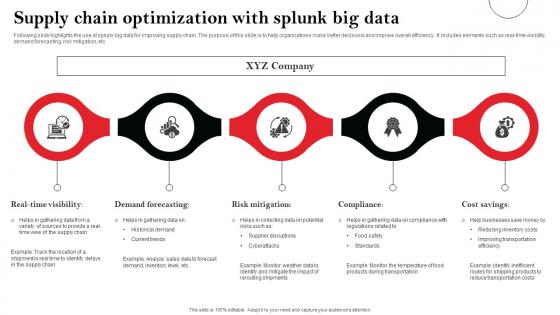
Following slide highlights the use of splunk big data for improving supply chain. The purpose of this slide is to help organizations make better decisions and improve overall efficiency. It includes elements such as real-time visibility, demand forecasting, risk mitigation, etc. Showcasing this set of slides titled Supply Chain Optimization With Splunk Big Data Graphics Pdf The topics addressed in these templates are Real-Time Visibility, Demand Forecasting, Risk Mitigation All the content presented in this PPT design is completely editable. Download it and make adjustments in color, background, font etc. as per your unique business setting. Following slide highlights the use of splunk big data for improving supply chain. The purpose of this slide is to help organizations make better decisions and improve overall efficiency. It includes elements such as real-time visibility, demand forecasting, risk mitigation, etc.
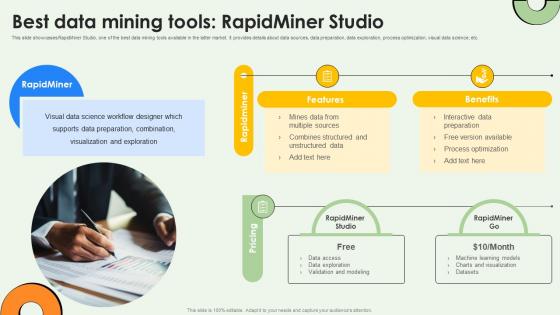
Best Data Mining Tools Rapidminer Studio Data Warehousing And Data Mining Guide AI SS V
This slide showcases RapidMiner Studio, one of the best data mining tools available in the latter market. It provides details about data sources, data preparation, data exploration, process optimization, visual data science, etc. Boost your pitch with our creative Best Data Mining Tools Rapidminer Studio Data Warehousing And Data Mining Guide AI SS V. Deliver an awe-inspiring pitch that will mesmerize everyone. Using these presentation templates you will surely catch everyones attention. You can browse the ppts collection on our website. We have researchers who are experts at creating the right content for the templates. So you do not have to invest time in any additional work. Just grab the template now and use them. This slide showcases RapidMiner Studio, one of the best data mining tools available in the latter market. It provides details about data sources, data preparation, data exploration, process optimization, visual data science, etc.
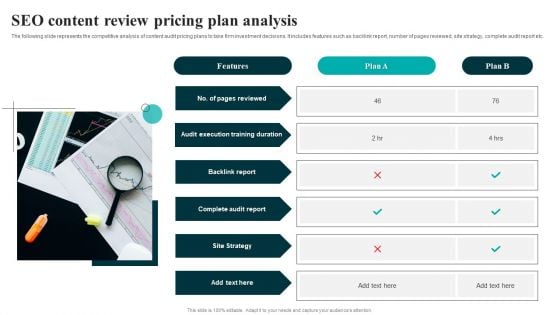
SEO Content Review Pricing Plan Analysis Slides PDF
The following slide represents the competitive analysis of content audit pricing plans to take firm investment decisions. It includes features such as backlink report, number of pages reviewed, site strategy, complete audit report etc. Presenting SEO Content Review Pricing Plan Analysis Slides PDF to dispense important information. This template comprises One stage. It also presents valuable insights into the topics including Backlink Report, Complete Audit Report, Site Strategy. This is a completely customizable PowerPoint theme that can be put to use immediately. So, download it and address the topic impactfully.
Email Management Ppt PowerPoint Presentation Pictures Elements Cpb
This is a email management ppt powerpoint presentation pictures elements cpb. This is a three stage process. The stages in this process are email management.
Consumer Risk Management Ppt PowerPoint Presentation File Graphic Tips Cpb
This is a consumer risk management ppt powerpoint presentation file graphic tips cpb. This is a three stage process. The stages in this process are consumer risk management.

Industry Pain Points Powerpoint Ppt Template Bundles
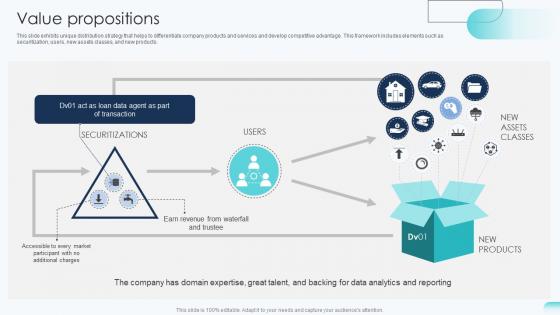
Value Propositions Big Data Analytics Investor Funding Elevator Pitch Deck
This slide exhibits unique distribution strategy that helps to differentiate company products and services and develop competitive advantage. This framework includes elements such as securitization, users, new assets classes, and new products. Explore a selection of the finest Value Propositions Big Data Analytics Investor Funding Elevator Pitch Deck here. With a plethora of professionally designed and pre-made slide templates, you can quickly and easily find the right one for your upcoming presentation. You can use our Value Propositions Big Data Analytics Investor Funding Elevator Pitch Deck to effectively convey your message to a wider audience. Slidegeeks has done a lot of research before preparing these presentation templates. The content can be personalized and the slides are highly editable. Grab templates today from Slidegeeks. This slide exhibits unique distribution strategy that helps to differentiate company products and services and develop competitive advantage. This framework includes elements such as securitization, users, new assets classes, and new products.
Business Performance Analysis Report Vector Icon Ppt PowerPoint Presentation File Visuals PDF
Presenting business performance analysis report vector icon ppt powerpoint presentation file visuals pdf to dispense important information. This template comprises three stages. It also presents valuable insights into the topics including business performance analysis report vector icon. This is a completely customizable PowerPoint theme that can be put to use immediately. So, download it and address the topic impactfully.
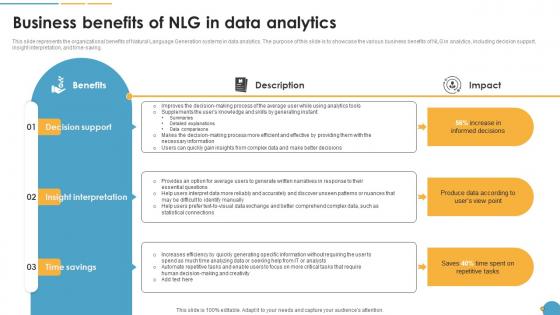
Business Benefits Of NLG In Data Analytics Natural Language Automation
This slide represents the organizational benefits of Natural Language Generation systems in data analytics. The purpose of this slide is to showcase the various business benefits of NLG in analytics, including decision support, insight interpretation, and time-saving. From laying roadmaps to briefing everything in detail, our templates are perfect for you. You can set the stage with your presentation slides. All you have to do is download these easy-to-edit and customizable templates. Business Benefits Of NLG In Data Analytics Natural Language Automation will help you deliver an outstanding performance that everyone would remember and praise you for. Do download this presentation today. This slide represents the organizational benefits of Natural Language Generation systems in data analytics. The purpose of this slide is to showcase the various business benefits of NLG in analytics, including decision support, insight interpretation, and time-saving.
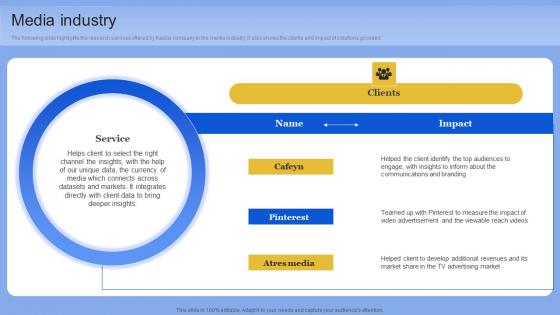
Media Industry Data Analytics Company Outline Structure PDF
The following slide highlights the research services offered by Kantar company to the media industry. It also shows the clients and impact of solutions provided. The Media Industry Data Analytics Company Outline Structure PDF is a compilation of the most recent design trends as a series of slides. It is suitable for any subject or industry presentation, containing attractive visuals and photo spots for businesses to clearly express their messages. This template contains a variety of slides for the user to input data, such as structures to contrast two elements, bullet points, and slides for written information. Slidegeeks is prepared to create an impression. The following slide highlights the research services offered by Kantar company to the media industry. It also shows the clients and impact of solutions provided
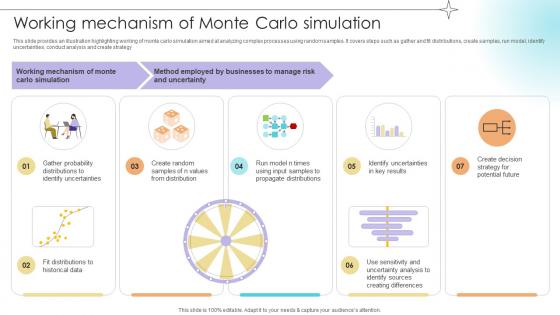
Working Mechanism Of Monte Carlo Simulation Data Analytics SS V
This slide provides an illustration highlighting working of monte carlo simulation aimed at analyzing complex processes using random samples. It covers steps such as gather and fit distributions, create samples, run model, identify uncertainties, conduct analysis and create strategy.Slidegeeks has constructed Working Mechanism Of Monte Carlo Simulation Data Analytics SS V after conducting extensive research and examination. These presentation templates are constantly being generated and modified based on user preferences and critiques from editors. Here, you will find the most attractive templates for a range of purposes while taking into account ratings and remarks from users regarding the content. This is an excellent jumping-off point to explore our content and will give new users an insight into our top-notch PowerPoint Templates. This slide provides an illustration highlighting working of monte carlo simulation aimed at analyzing complex processes using random samples. It covers steps such as gather and fit distributions, create samples, run model, identify uncertainties, conduct analysis and create strategy.
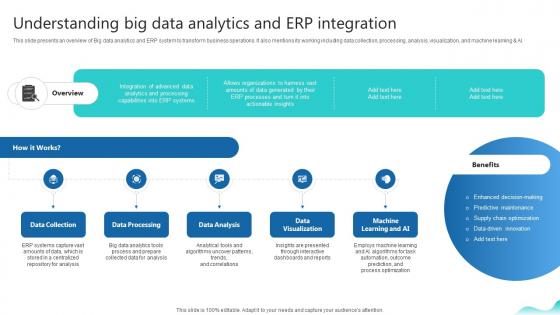
Understanding Big Data Analytics And Erp Integration Erp And Digital Transformation For Maximizing DT SS V
This slide presents an overview of Big data analytics and ERP system to transform business operations. It also mentions its working including data collection, processing, analysis, visualization, and machine learning and AI.There are so many reasons you need a Understanding Big Data Analytics And Erp Integration Erp And Digital Transformation For Maximizing DT SS V. The first reason is you can not spend time making everything from scratch, Thus, Slidegeeks has made presentation templates for you too. You can easily download these templates from our website easily. This slide presents an overview of Big data analytics and ERP system to transform business operations. It also mentions its working including data collection, processing, analysis, visualization, and machine learning and AI.
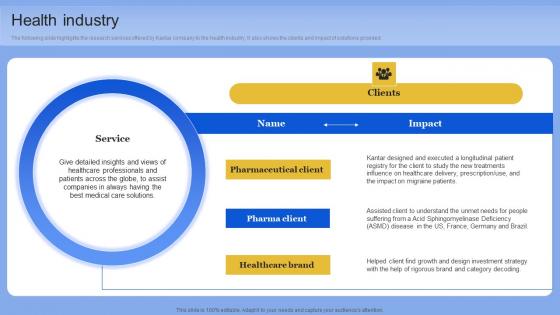
Health Industry Data Analytics Company Outline Professional PDF
The following slide highlights the research services offered by Kantar company to the health industry. It also shows the clients and impact of solutions provided. Coming up with a presentation necessitates that the majority of the effort goes into the content and the message you intend to convey. The visuals of a PowerPoint presentation can only be effective if it supplements and supports the story that is being told. Keeping this in mind our experts created Health Industry Data Analytics Company Outline Professional PDF to reduce the time that goes into designing the presentation. This way, you can concentrate on the message while our designers take care of providing you with the right template for the situation. The following slide highlights the research services offered by Kantar company to the health industry. It also shows the clients and impact of solutions provided
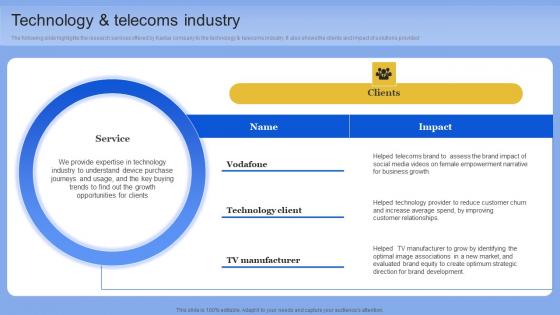
Technology And Telecoms Industry Data Analytics Company Outline Rules PDF
The following slide highlights the research services offered by Kantar company to the technology and telecoms industry. It also shows the clients and impact of solutions provided. Do you know about Slidesgeeks Technology And Telecoms Industry Data Analytics Company Outline Rules PDF These are perfect for delivering any kind od presentation. Using it, create PowerPoint presentations that communicate your ideas and engage audiences. Save time and effort by using our pre-designed presentation templates that are perfect for a wide range of topic. Our vast selection of designs covers a range of styles, from creative to business, and are all highly customizable and easy to edit. Download as a PowerPoint template or use them as Google Slides themes. The following slide highlights the research services offered by Kantar company to the technology and telecoms industry. It also shows the clients and impact of solutions provided
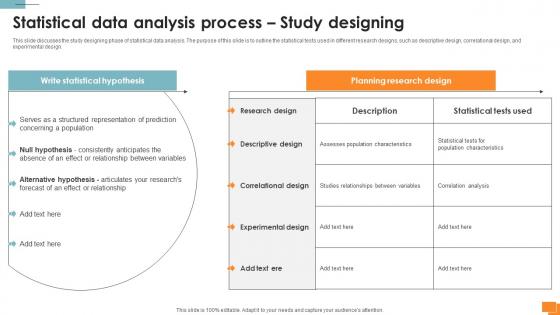
A135 Statistical Tools For Evidence Statistical Data Analysis Process Study Designing
This slide discusses the study designing phase of statistical data analysis. The purpose of this slide is to outline the statistical tests used in different research designs, such as descriptive design, correlational design, and experimental design. Slidegeeks is one of the best resources for PowerPoint templates. You can download easily and regulate A135 Statistical Tools For Evidence Statistical Data Analysis Process Study Designing for your personal presentations from our wonderful collection. A few clicks is all it takes to discover and get the most relevant and appropriate templates. Use our Templates to add a unique zing and appeal to your presentation and meetings. All the slides are easy to edit and you can use them even for advertisement purposes. This slide discusses the study designing phase of statistical data analysis. The purpose of this slide is to outline the statistical tests used in different research designs, such as descriptive design, correlational design, and experimental design.
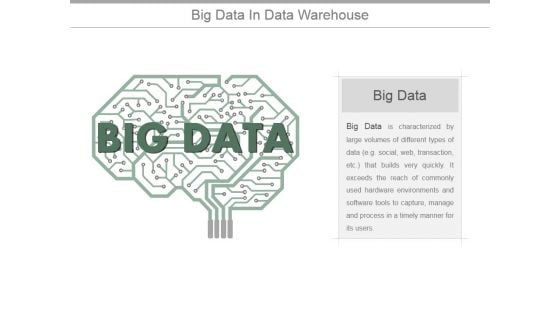
Big Data In Data Warehouse Ppt PowerPoint Presentation Infographic Template
This is a big data in data warehouse ppt powerpoint presentation infographic template. This is a one stage process. The stages in this process are business, data, marketing, analysis, strategy, management.
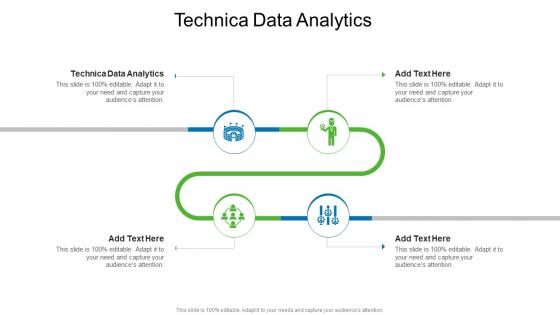
Technica Data Analytics In Powerpoint And Google Slides Cpb
Presenting our innovatively designed set of slides titled Technica Data Analytics In Powerpoint And Google Slides Cpb. This completely editable PowerPoint graphic exhibits Technica Data Analytics that will help you convey the message impactfully. It can be accessed with Google Slides and is available in both standard screen and widescreen aspect ratios. Apart from this, you can download this well structured PowerPoint template design in different formats like PDF, JPG, and PNG. So, click the download button now to gain full access to this PPT design. Our Technica Data Analytics In Powerpoint And Google Slides Cpb are topically designed to provide an attractive backdrop to any subject. Use them to look like a presentation pro.

Product Prioritization And Progress Quarterly Timeline Ppt PowerPoint Presentation Summary Show PDF
The slide shows a product timeline guiding products vision, directions, priorities and quarterly progress for an year. It includes phone application, client dashboard, system automation and invoice system.Showcasing this set of slides titled Product Prioritization And Progress Quarterly Timeline Ppt PowerPoint Presentation Summary Show PDF. The topics addressed in these templates are Client Dashboard, System Automation, Invoice System. All the content presented in this PPT design is completely editable. Download it and make adjustments in color, background, font etc. as per your unique business setting.
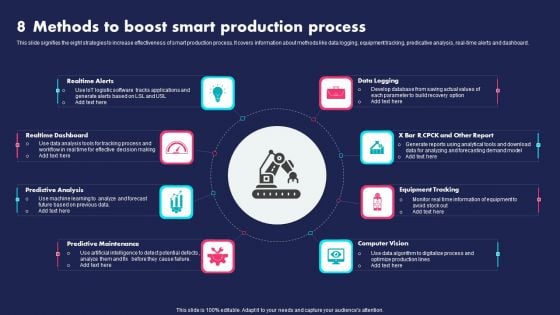
8 Methods To Boost Smart Production Process Ppt PowerPoint Presentation Gallery Gridlines PDF
This slide signifies the eight strategies to increase effectiveness of smart production process. It covers information about methods like data logging, equipment tracking, predicative analysis, real-time alerts and dashboard. Persuade your audience using this 8 Methods To Boost Smart Production Process Ppt PowerPoint Presentation Gallery Gridlines PDF This PPT design covers eight stages, thus making it a great tool to use. It also caters to a variety of topics including Realtime Alerts, Realtime Dashboard, Predictive Analysis. Download this PPT design now to present a convincing pitch that not only emphasizes the topic but also showcases your presentation skills.
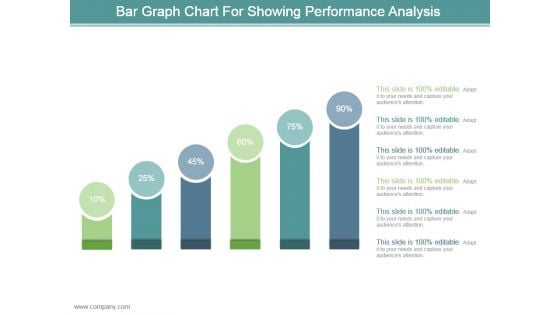
Bar Graph Chart For Showing Performance Analysis Ppt Design
This is a bar graph chart for showing performance analysis ppt design. This is a six stage process. The stages in this process are business, marketing, process, success, presentation.
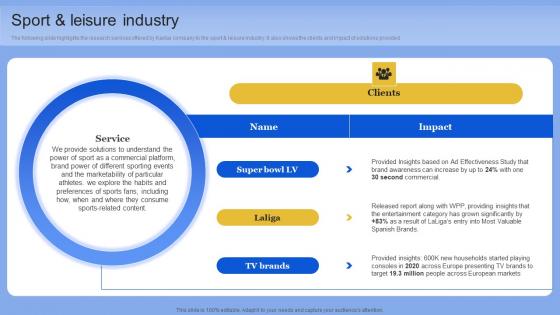
Sport And Leisure Industry Data Analytics Company Outline Pictures PDF
The following slide highlights the research services offered by Kantar company to the sport and leisure industry. It also shows the clients and impact of solutions provided. This Sport And Leisure Industry Data Analytics Company Outline Pictures PDF from Slidegeeks makes it easy to present information on your topic with precision. It provides customization options, so you can make changes to the colors, design, graphics, or any other component to create a unique layout. It is also available for immediate download, so you can begin using it right away. Slidegeeks has done good research to ensure that you have everything you need to make your presentation stand out. Make a name out there for a brilliant performance. The following slide highlights the research services offered by Kantar company to the sport and leisure industry. It also shows the clients and impact of solutions provided
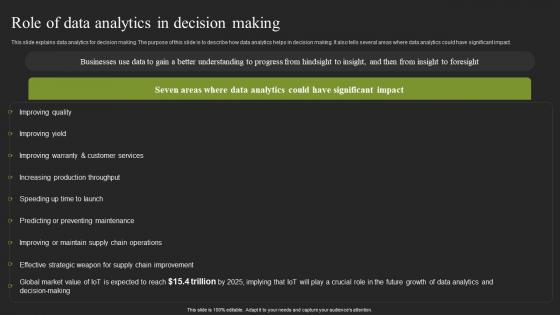
Role Of Data Analytics In Decision Making Cybernetic Systems Slides Pdf
This slide explains data analytics for decision making. The purpose of this slide is to describe how data analytics helps in decision making. It also tells several areas where data analytics could have significant impact. From laying roadmaps to briefing everything in detail, our templates are perfect for you. You can set the stage with your presentation slides. All you have to do is download these easy to edit and customizable templates. Role Of Data Analytics In Decision Making Cybernetic Systems Slides Pdf will help you deliver an outstanding performance that everyone would remember and praise you for. Do download this presentation today. This slide explains data analytics for decision making. The purpose of this slide is to describe how data analytics helps in decision making. It also tells several areas where data analytics could have significant impact.
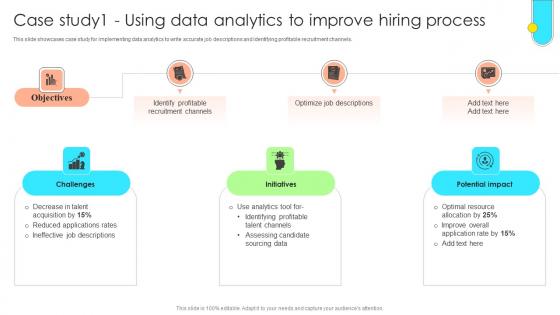
Data Driven Approach To Optimise Case Study1 Using Data Analytics To Improve CRP SS V
This slide showcases case study for implementing data analytics to write accurate job descriptions and identifying profitable recruitment channels. Whether you have daily or monthly meetings, a brilliant presentation is necessary. Data Driven Approach To Optimise Case Study1 Using Data Analytics To Improve CRP SS V can be your best option for delivering a presentation. Represent everything in detail using Data Driven Approach To Optimise Case Study1 Using Data Analytics To Improve CRP SS V and make yourself stand out in meetings. The template is versatile and follows a structure that will cater to your requirements. All the templates prepared by Slidegeeks are easy to download and edit. Our research experts have taken care of the corporate themes as well. So, give it a try and see the results. This slide showcases case study for implementing data analytics to write accurate job descriptions and identifying profitable recruitment channels.
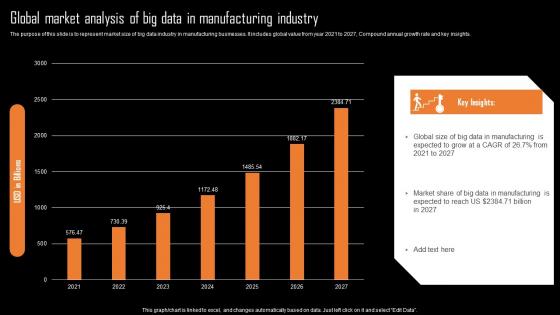
Global Market Analysis Of Big Data In Manufacturing Industry Information Pdf
The purpose of this slide is to represent market size of big data industry in manufacturing businesses. It includes global value from year 2021 to 2027, Compound annual growth rate and key insights.Showcasing this set of slides titled Global Market Analysis Of Big Data In Manufacturing Industry Information Pdf The topics addressed in these templates are Data Manufacturing, Expected Grow, Data Manufacturing All the content presented in this PPT design is completely editable. Download it and make adjustments in color, background, font etc. as per your unique business setting. The purpose of this slide is to represent market size of big data industry in manufacturing businesses. It includes global value from year 2021 to 2027, Compound annual growth rate and key insights.
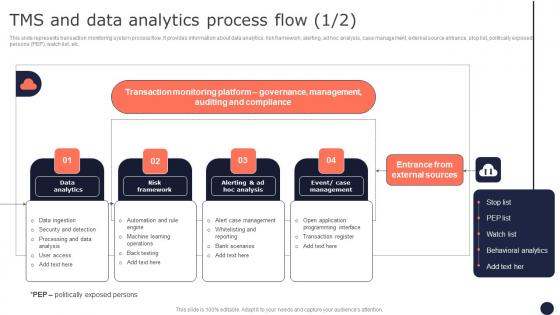
TMS And Data Analytics Process Flow Mitigating Corporate Scams And Robberies Topics Pdf Inspiration Pdf
This slide represents transaction monitoring system process flow. It provides information about data analytics, risk framework, alerting, ad hoc analysis, case management, external source entrance, stop list, politically exposed persons PEP, watch list, etc. Want to ace your presentation in front of a live audience Our TMS And Data Analytics Process Flow Mitigating Corporate Scams And Robberies Topics Pdf Inspiration Pdf can help you do that by engaging all the users towards you. Slidegeeks experts have put their efforts and expertise into creating these impeccable powerpoint presentations so that you can communicate your ideas clearly. Moreover, all the templates are customizable, and easy-to-edit and downloadable. Use these for both personal and commercial use. This slide represents transaction monitoring system process flow. It provides information about data analytics, risk framework, alerting, ad hoc analysis, case management, external source entrance, stop list, politically exposed persons PEP, watch list, etc.


 Continue with Email

 Home
Home


