Executive Summary Dashboard
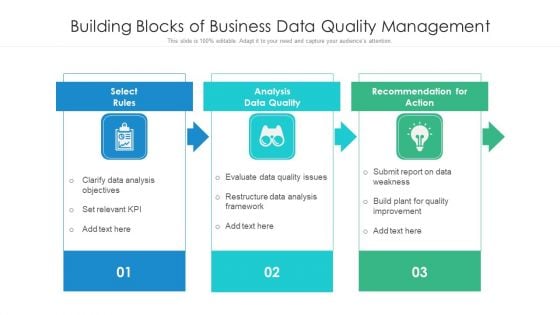
Building Blocks Of Business Data Quality Management Ppt PowerPoint Presentation Outline Samples PDF
Presenting building blocks of business data quality management ppt powerpoint presentation outline samples pdf to dispense important information. This template comprises three stages. It also presents valuable insights into the topics including data analysis objectives, analysis data quality, build plant for quality improvement. This is a completely customizable PowerPoint theme that can be put to use immediately. So, download it and address the topic impactfully.

Semantic Data Searching Technique Introduction To Semantic Web Technology Introduction PDF
This slide represents the introduction to semantic web technology that makes internet data machine readable. It is the concept of the World Wide Web Consortium W3c, and it can be used to develop web based data stores, define vocabulary, and design data handling rules. This Semantic Data Searching Technique Introduction To Semantic Web Technology Introduction PDF is perfect for any presentation, be it in front of clients or colleagues. It is a versatile and stylish solution for organizing your meetings. The product features a modern design for your presentation meetings. The adjustable and customizable slides provide unlimited possibilities for acing up your presentation. Slidegeeks has done all the homework before launching the product for you. So, do not wait, grab the presentation templates today
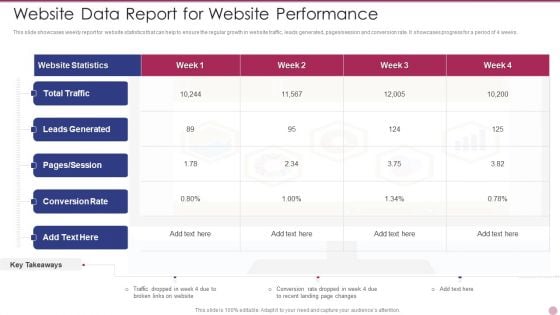
Website Data Report For Website Performance Background PDF
This slide showcases weekly report for website statistics that can help to ensure the regular growth in website traffic, leads generated, pages or session and conversion rate. It showcases progress for a period of 4 weeks. Pitch your topic with ease and precision using this Website Data Report For Website Performance Background PDF. This layout presents information on Website Data Report For Website Performance. It is also available for immediate download and adjustment. So, changes can be made in the color, design, graphics or any other component to create a unique layout.
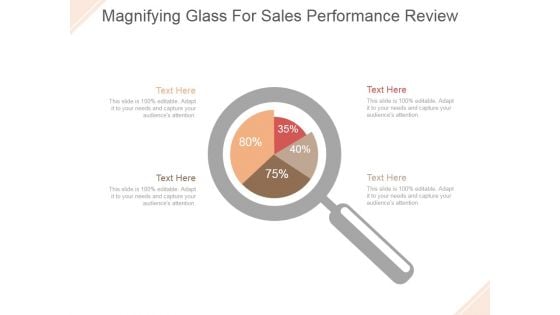
Magnifying Glass For Sales Performance Review Ppt PowerPoint Presentation Model
This is a magnifying glass for sales performance review ppt powerpoint presentation model. This is a four stage process. The stage in this process are magnifier glass, pie, finance, percentage, research.
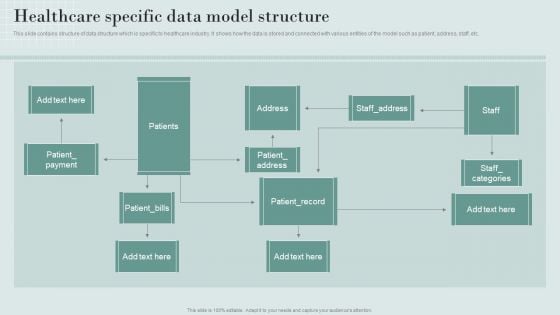
Data Structure IT Healthcare Specific Data Model Structure Brochure PDF
If you are looking for a format to display your unique thoughts, then the professionally designed Data Structure IT Healthcare Specific Data Model Structure Brochure PDF is the one for you. You can use it as a Google Slides template or a PowerPoint template. Incorporate impressive visuals, symbols, images, and other charts. Modify or reorganize the text boxes as you desire. Experiment with shade schemes and font pairings. Alter, share or cooperate with other people on your work. Download Data Structure IT Healthcare Specific Data Model Structure Brochure PDF and find out how to give a successful presentation. Present a perfect display to your team and make your presentation unforgettable.
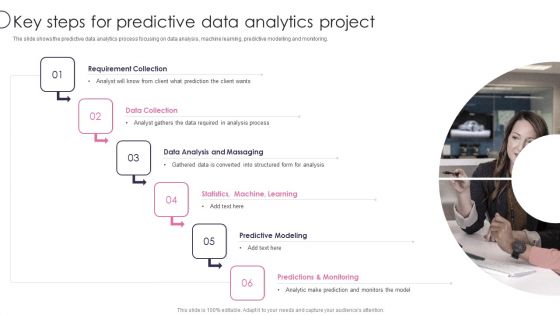
Information Transformation Process Toolkit Key Steps For Predictive Data Analytics Project Introduction PDF
The slide shows the predictive data analytics process focusing on data analysis, machine learning, predictive modelling and monitoring. Presenting Information Transformation Process Toolkit Key Steps For Predictive Data Analytics Project Introduction PDF to provide visual cues and insights. Share and navigate important information on six stages that need your due attention. This template can be used to pitch topics like Data Analysis And Massaging, Data Collection, Requirement Collection. In addtion, this PPT design contains high resolution images, graphics, etc, that are easily editable and available for immediate download.
Business Analytics Report Vector Icon Ppt PowerPoint Presentation Layouts Introduction
Presenting this set of slides with name business analytics report vector icon ppt powerpoint presentation layouts introduction. This is a one stage process. The stages in this process are audit observation, business analytics, business performance. This is a completely editable PowerPoint presentation and is available for immediate download. Download now and impress your audience.
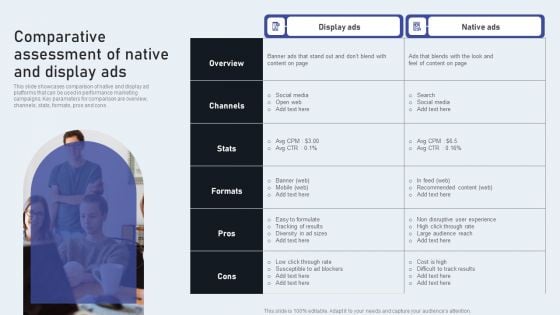
Comparative Assessment Of Native And Display Ads Introduction PDF
This slide showcases comparison of native and display ad platforms that can be used in performance marketing campaigns. Key parameters for comparison are overview, channels, stats, formats, pros and cons. The Comparative Assessment Of Native And Display Ads Introduction PDF is a compilation of the most recent design trends as a series of slides. It is suitable for any subject or industry presentation, containing attractive visuals and photo spots for businesses to clearly express their messages. This template contains a variety of slides for the user to input data, such as structures to contrast two elements, bullet points, and slides for written information. Slidegeeks is prepared to create an impression.

Key Statistical Terms For Conducting Data Analytics For Informed Decision Ppt Template
The purpose of this slide is to outline the statistical measures involved in sampling data for analytical processes. These terms are population standard deviation, statistical power, expected effect size, significance level, etc. Welcome to our selection of the Key Statistical Terms For Conducting Data Analytics For Informed Decision Ppt Template. These are designed to help you showcase your creativity and bring your sphere to life. Planning and Innovation are essential for any business that is just starting out. This collection contains the designs that you need for your everyday presentations. All of our PowerPoints are 100Percent editable, so you can customize them to suit your needs. This multi-purpose template can be used in various situations. Grab these presentation templates today. The purpose of this slide is to outline the statistical measures involved in sampling data for analytical processes. These terms are population standard deviation, statistical power, expected effect size, significance level, etc.
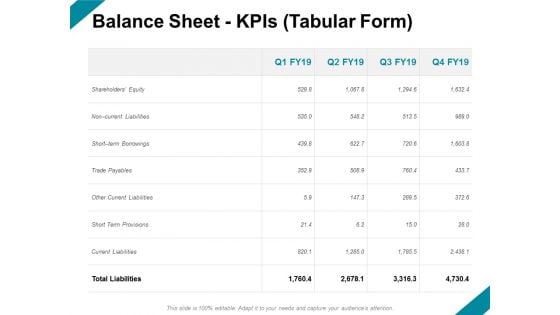
Balance Sheet Kpis Tabular Form Ppt PowerPoint Presentation Outline Graphics Design
Presenting this set of slides with name balance sheet kpis tabular form ppt powerpoint presentation outline graphics design. The topics discussed in these slides are business, management, planning, strategy, marketing. This is a completely editable PowerPoint presentation and is available for immediate download. Download now and impress your audience.
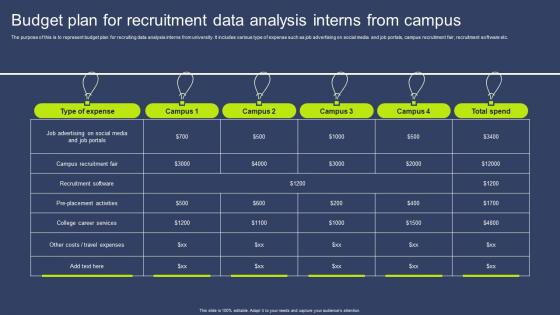
Budget Plan For Recruitment Data Analysis Interns From Campus Mockup Pdf
The purpose of this is to represent budget plan for recruiting data analysis interns from university. It includes various type of expense such as job advertising on social media and job portals, campus recruitment fair, recruitment software etc. Pitch your topic with ease and precision using this Budget Plan For Recruitment Data Analysis Interns From Campus Mockup Pdf. This layout presents information on Type Expense, Campus Recruitment Fair, Recruitment Software. It is also available for immediate download and adjustment. So, changes can be made in the color, design, graphics or any other component to create a unique layout. The purpose of this is to represent budget plan for recruiting data analysis interns from university. It includes various type of expense such as job advertising on social media and job portals, campus recruitment fair, recruitment software etc.

Magnifying Glass Ppt PowerPoint Presentation Background Designs
This is a magnifying glass ppt powerpoint presentation background designs. This is a five stage process. The stages in this process are years, magnify, search, success, time line.
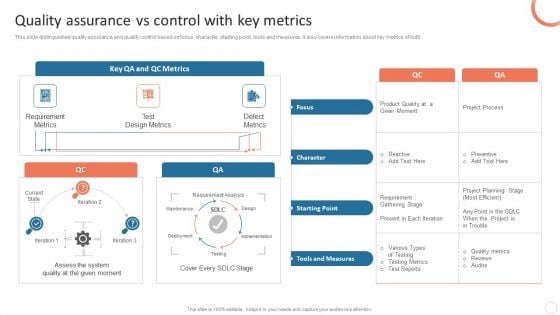
Quality Control Plan Quality Assurance Vs Control With Key Metrics Slides PDF
This slide distinguished quality assurance and quality control based on focus, character, starting point, tools and measures. It also covers information about key metrics of both. If you are looking for a format to display your unique thoughts, then the professionally designed Quality Control Plan Quality Assurance Vs Control With Key Metrics Slides PDF is the one for you. You can use it as a Google Slides template or a PowerPoint template. Incorporate impressive visuals, symbols, images, and other charts. Modify or reorganize the text boxes as you desire. Experiment with shade schemes and font pairings. Alter, share or cooperate with other people on your work. Download Quality Control Plan Quality Assurance Vs Control With Key Metrics Slides PDF and find out how to give a successful presentation. Present a perfect display to your team and make your presentation unforgettable.
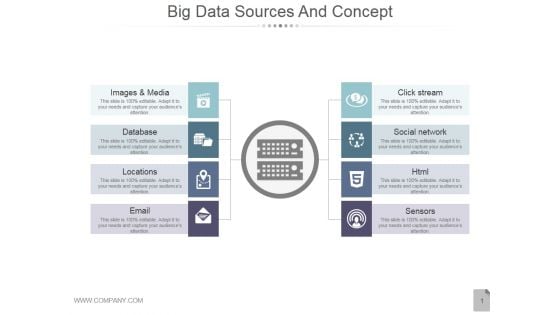
Big Data Sources And Concept Ppt PowerPoint Presentation Ideas
This is a big data sources and concept ppt powerpoint presentation ideas. This is a eight stage process. The stages in this process are images and media, database, locations, email, sensors.
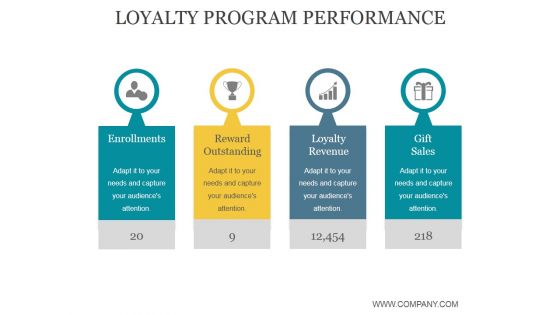
Loyalty Program Performance Ppt PowerPoint Presentation Portfolio
This is a loyalty program performance ppt powerpoint presentation portfolio. This is a four stage process. The stages in this process are enrollments, reward outstanding, loyalty revenue, gift sales.
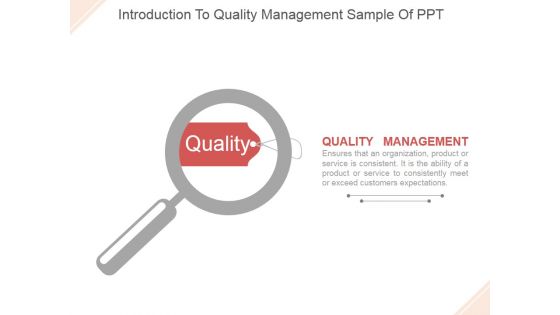
Introduction To Quality Management Ppt PowerPoint Presentation Infographic Template
This is a introduction to quality management ppt powerpoint presentation infographic template. This is a one stage process. The stage in this process are quality, quality management.
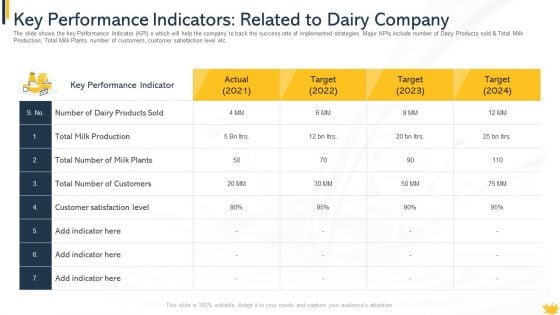
Key Performance Indicators Related To Dairy Company Introduction PDF
The slide shows the key Performance Indicator KPI s which will help the company to track the success rate of implemented strategies. Major KPIs include number of Dairy Products sold and Total Milk Production, Total Milk Plants, number of customers, customer satisfaction level etc.Deliver an awe inspiring pitch with this creative key performance indicators related to dairy company introduction pdf bundle. Topics like total milk production, customer satisfaction level, dairy products sold can be discussed with this completely editable template. It is available for immediate download depending on the needs and requirements of the user.
Agile Group For Product Development Key Points Related To Successful Product Leadership Icons PDF
This slide shows key points related to successful product leadership that involves cross departmental collaboration, latest tools and trends, metrics to measure performance, recruiting diverse talent. Presenting agile group for product development key points related to successful product leadership icons pdf to provide visual cues and insights. Share and navigate important information on six stages that need your due attention. This template can be used to pitch topics like cross departmental collaboration, metrics to measure performance, recruiting diverse talent. In addtion, this PPT design contains high resolution images, graphics, etc, that are easily editable and available for immediate download.

Key Management Ppt PowerPoint Presentation Pictures Visual Aids
This is a key management ppt powerpoint presentation pictures visual aids. This is a three stage process. The stages in this process are jack albert, mack disouza, anny parker.
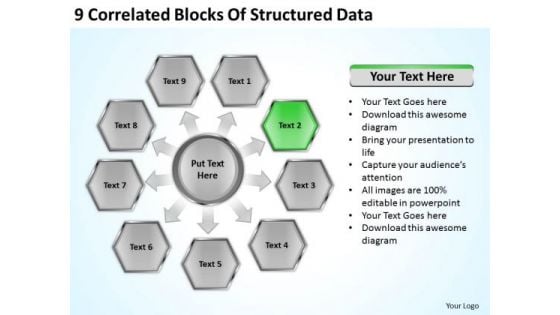
9 Correlated Blocks Of Structured Data Business Plans That Work PowerPoint Templates
We present our 9 correlated blocks of structured data business plans that work PowerPoint templates.Download and present our Marketing PowerPoint Templates because Our PowerPoint Templates and Slides will let you meet your Deadlines. Use our Business PowerPoint Templates because You can Hit the nail on the head with our PowerPoint Templates and Slides. Embed your ideas in the minds of your audience. Present our Finance PowerPoint Templates because Our PowerPoint Templates and Slides are aesthetically designed to attract attention. We gaurantee that they will grab all the eyeballs you need. Use our Process and Flows PowerPoint Templates because You can Be the puppeteer with our PowerPoint Templates and Slides as your strings. Lead your team through the steps of your script. Download and present our Arrows PowerPoint Templates because You canTake a leap off the starting blocks with our PowerPoint Templates and Slides. They will put you ahead of the competition in quick time.Use these PowerPoint slides for presentations relating to Diagram, Chart, Business, Background, Vector, Pie, Brown, Abstract, Wheel, Options, Board, Website, Cross, Statistics, Model, Item, Document, Media, Beehives, Red, Hive, Concept, Presentation, Template, Matt, Brochure, Orange, Guide, Description, Multicolor, Marketing, Gray, Development, Title, Management, Honeycomb, Illustration, Six, Catalog, Direction, Plans, Blue, Text, Reports, Financial, Workplace, Navigation, Parts. The prominent colors used in the PowerPoint template are Green, Gray, Black. Our 9 Correlated Blocks Of Structured Data Business Plans That Work PowerPoint Templates have a feel for it. They automatically create an ambience.
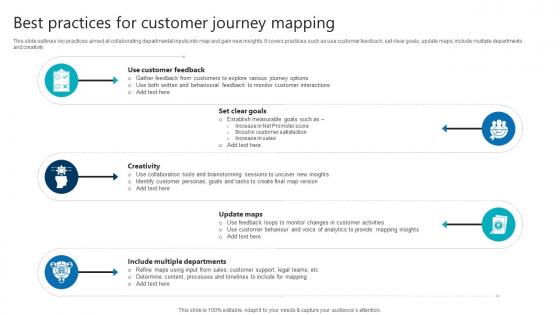
Best Practices For Customer Journey Mapping Product Analytics Implementation Data Analytics V
This slide outlines key practices aimed at collaborating departmental inputs into map and gain new insights. It covers practices such as use customer feedback, set clear goals, update maps, include multiple departments and creativity.Want to ace your presentation in front of a live audience Our Best Practices For Customer Journey Mapping Product Analytics Implementation Data Analytics V can help you do that by engaging all the users towards you. Slidegeeks experts have put their efforts and expertise into creating these impeccable powerpoint presentations so that you can communicate your ideas clearly. Moreover, all the templates are customizable, and easy-to-edit and downloadable. Use these for both personal and commercial use. This slide outlines key practices aimed at collaborating departmental inputs into map and gain new insights. It covers practices such as use customer feedback, set clear goals, update maps, include multiple departments and creativity.
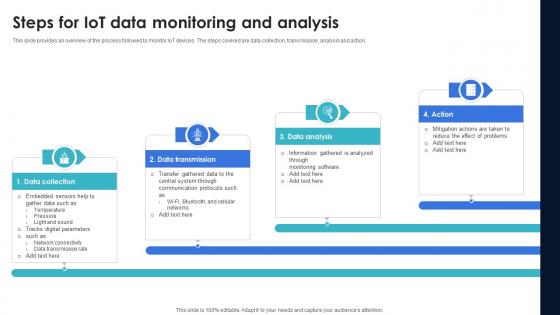
Optimization Of IoT Remote Monitoring Steps For IoT Data Monitoring And Analysis IoT SS V
This slide provides an overview of the process followed to monitor IoT devices. The steps covered are data collection, transmission, analysis and action. Want to ace your presentation in front of a live audience Our Optimization Of IoT Remote Monitoring Steps For IoT Data Monitoring And Analysis IoT SS V can help you do that by engaging all the users towards you. Slidegeeks experts have put their efforts and expertise into creating these impeccable powerpoint presentations so that you can communicate your ideas clearly. Moreover, all the templates are customizable, and easy-to-edit and downloadable. Use these for both personal and commercial use. This slide provides an overview of the process followed to monitor IoT devices. The steps covered are data collection, transmission, analysis and action.
Charts Representing Business Data Analysis Icon Introduction PDF
Presenting charts representing business data analysis icon introduction pdf. to dispense important information. This template comprises three stages. It also presents valuable insights into the topics including charts representing business data analysis icon. This is a completely customizable PowerPoint theme that can be put to use immediately. So, download it and address the topic impactfully.
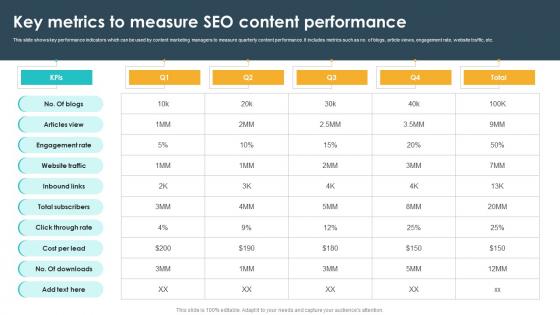
Key Metrics To Measure Seo Content Performance Seo Content Plan To Drive Strategy SS V
This slide shows key performance indicators which can be used by content marketing managers to measure quarterly content performance. It includes metrics such as no. of blogs, article views, engagement rate, website traffic, etc. Formulating a presentation can take up a lot of effort and time, so the content and message should always be the primary focus. The visuals of the PowerPoint can enhance the presenters message, so our Key Metrics To Measure Seo Content Performance Seo Content Plan To Drive Strategy SS V was created to help save time. Instead of worrying about the design, the presenter can concentrate on the message while our designers work on creating the ideal templates for whatever situation is needed. Slidegeeks has experts for everything from amazing designs to valuable content, we have put everything into Key Metrics To Measure Seo Content Performance Seo Content Plan To Drive Strategy SS V This slide shows key performance indicators which can be used by content marketing managers to measure quarterly content performance. It includes metrics such as no. of blogs, article views, engagement rate, website traffic, etc.
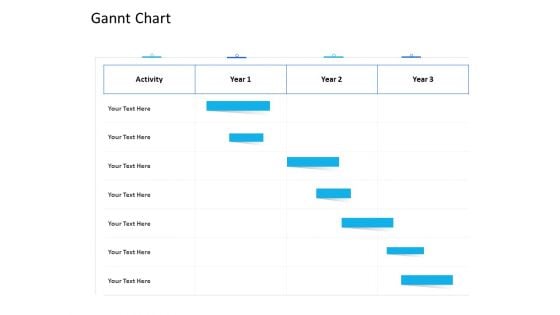
Organization Manpower Management Technology Gannt Chart Infographics PDF
Your complex projects can be managed and organized simultaneously using this detailed organization manpower management technology gannt chart infographics pdf template. Track the milestones, tasks, phases, activities, and subtasks to get an updated visual of your project. Share your planning horizon and release plan with this well crafted presentation template. This exemplary template can be used to plot various dependencies to distinguish the tasks in the pipeline and their impact on the schedules and deadlines of the project. Apart from this, you can also share this visual presentation with your team members and stakeholders. It a resourceful tool that can be incorporated into your business structure. Therefore, download and edit it conveniently to add the data and statistics as per your requirement.
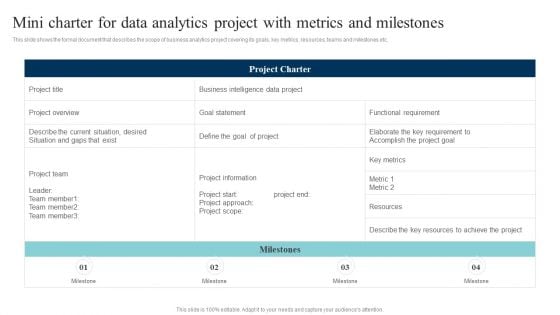
Data Evaluation And Processing Toolkit Mini Charter For Data Analytics Project With Metrics Brochure PDF
This slide shows the formal document that describes the scope of business analytics project covering its goals, key metrics, resources, teams and milestones etc. Get a simple yet stunning designed Data Evaluation And Processing Toolkit Mini Charter For Data Analytics Project With Metrics Brochure PDF. It is the best one to establish the tone in your meetings. It is an excellent way to make your presentations highly effective. So, download this PPT today from Slidegeeks and see the positive impacts. Our easy-to-edit Data Evaluation And Processing Toolkit Mini Charter For Data Analytics Project With Metrics Brochure PDF can be your go-to option for all upcoming conferences and meetings. So, what are you waiting for Grab this template today.
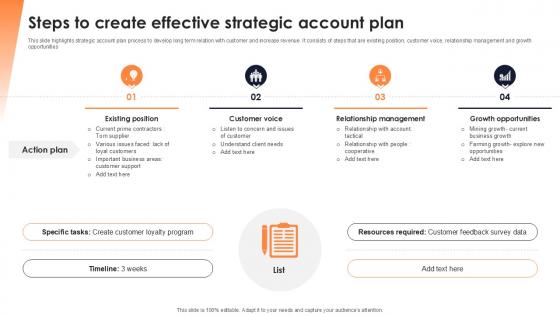
Steps To Create Effective Strategic Account Plan Ppt Template SS
This slide represents the pyramid showing the kpis of digital marketing team. It includes loyalty, sales, online advertising and traffic key performance indicators for the digital marketing team. Do you have to make sure that everyone on your team knows about any specific topic I yes, then you should give Steps To Create Effective Strategic Account Plan Ppt Template SS a try. Our experts have put a lot of knowledge and effort into creating this impeccable Steps To Create Effective Strategic Account Plan Ppt Template SS You can use this template for your upcoming presentations, as the slides are perfect to represent even the tiniest detail. You can download these templates from the Slidegeeks website and these are easy to edit. So grab these today This slide represents the pyramid showing the kpis of digital marketing team. It includes loyalty, sales, online advertising and traffic key performance indicators for the digital marketing team.
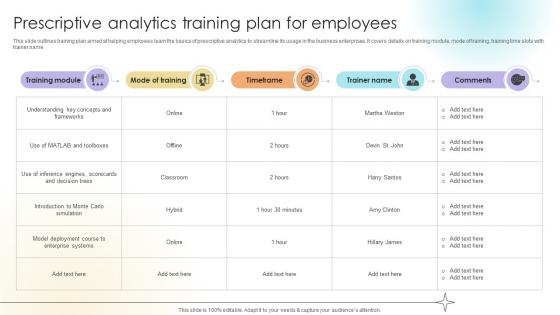
Prescriptive Analytics Training Plan For Employees Data Analytics SS V
This slide outlines training plan aimed at helping employees learn the basics of prescriptive analytics to streamline its usage in the business enterprises. It covers details on training module, mode of training, training time slots with trainer name.Slidegeeks has constructed Prescriptive Analytics Training Plan For Employees Data Analytics SS V after conducting extensive research and examination. These presentation templates are constantly being generated and modified based on user preferences and critiques from editors. Here, you will find the most attractive templates for a range of purposes while taking into account ratings and remarks from users regarding the content. This is an excellent jumping-off point to explore our content and will give new users an insight into our top-notch PowerPoint Templates. This slide outlines training plan aimed at helping employees learn the basics of prescriptive analytics to streamline its usage in the business enterprises. It covers details on training module, mode of training, training time slots with trainer name.

Work Breakdown Structure Ppt PowerPoint Presentation Slides
This is a work breakdown structure ppt powerpoint presentation slides. This is a five stage process. The stages in this process are project management, scope narrative, deliverable structure, flow diagram, schedule, budget.
Employee Selection Process Vector Icon Ppt PowerPoint Presentation File Slideshow PDF
Persuade your audience using this employee selection process vector icon ppt powerpoint presentation file slideshow pdf. This PPT design covers three stages, thus making it a great tool to use. It also caters to a variety of topics including employee selection process vector icon. Download this PPT design now to present a convincing pitch that not only emphasizes the topic but also showcases your presentation skills.
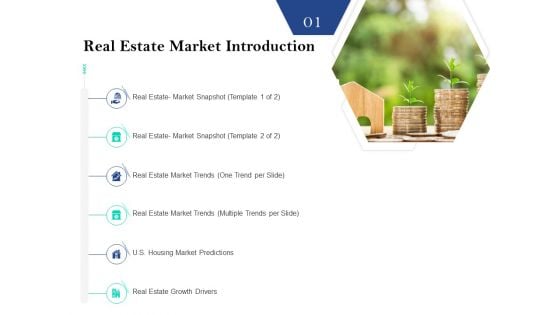
Property Investment Strategies Real Estate Market Introduction Ppt PowerPoint Presentation Pictures Layout PDF
Presenting property investment strategies real estate market introduction ppt powerpoint presentation pictures layout pdf. to provide visual cues and insights. Share and navigate important information on six stages that need your due attention. This template can be used to pitch topics like real estate market snapshot , real estate market trends, real estate market trends multiple trends per slide, u.s. housing market predictions, real estate growth drivers. In addtion, this PPT design contains high resolution images, graphics, etc, that are easily editable and available for immediate download.

Quarterly Sales Performance Report Ppt PowerPoint Presentation Outline Infographics
Presenting this set of slides with name quarterly sales performance report ppt powerpoint presentation outline infographics. The topics discussed in these slides are quarterly sales, performance report. This is a completely editable PowerPoint presentation and is available for immediate download. Download now and impress your audience.
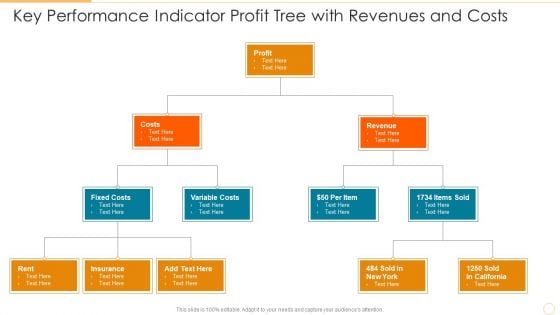
Key Performance Indicator Profit Tree With Revenues And Costs Template PDF
Presenting key performance indicator profit tree with revenues and costs template pdf to dispense important information. This template comprises three stages. It also presents valuable insights into the topics including costs, profit, revenue. This is a completely customizable PowerPoint theme that can be put to use immediately. So, download it and address the topic impactfully.
Employee Search On Computer Vector Icon Ppt PowerPoint Presentation File Outline PDF
Presenting employee search on computer vector icon ppt powerpoint presentation file outline pdf to dispense important information. This template comprises three stages. It also presents valuable insights into the topics including employee search on computer vector icon. This is a completely customizable PowerPoint theme that can be put to use immediately. So, download it and address the topic impactfully.
Business Product Inspection Vector Icon Ppt PowerPoint Presentation Outline Picture PDF
Presenting business product inspection vector icon ppt powerpoint presentation outline picture pdf to dispense important information. This template comprises four stages. It also presents valuable insights into the topics including business product inspection vector icon. This is a completely customizable PowerPoint theme that can be put to use immediately. So, download it and address the topic impactfully.

Working Of AWS IoT Analytics To IoT Fleet Monitoring Ppt Sample IoT SS V
This slide provides an overview of the IoT analytics working to evaluate the amount of data collected. The architecture includes data collection, processing, storage, analysis and building. This Working Of AWS IoT Analytics To IoT Fleet Monitoring Ppt Sample IoT SS V is perfect for any presentation, be it in front of clients or colleagues. It is a versatile and stylish solution for organizing your meetings. The Working Of AWS IoT Analytics To IoT Fleet Monitoring Ppt Sample IoT SS V features a modern design for your presentation meetings. The adjustable and customizable slides provide unlimited possibilities for acing up your presentation. Slidegeeks has done all the homework before launching the product for you. So, do not wait, grab the presentation templates today This slide provides an overview of the IoT analytics working to evaluate the amount of data collected. The architecture includes data collection, processing, storage, analysis and building.
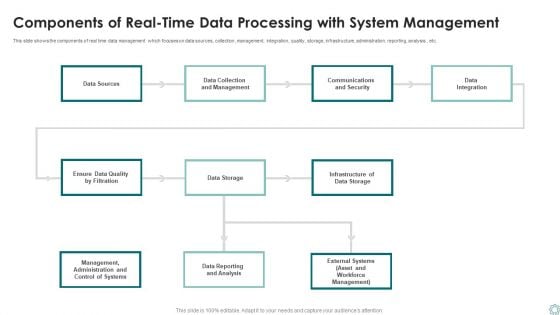
Components Of Real Time Data Processing With System Management Ppt Infographic Template Diagrams PDF
This slide shows the components of real time data management which focuses on data sources, collection, management, integration, quality, storage, infrastructure, administration, reporting, analysis, etc. Presenting Components Of Real Time Data Processing With System Management Ppt Infographic Template Diagrams PDF to dispense important information. This template comprises one stages. It also presents valuable insights into the topics including Data Storage, Data Sources, Data Integration. This is a completely customizable PowerPoint theme that can be put to use immediately. So, download it and address the topic impactfully.
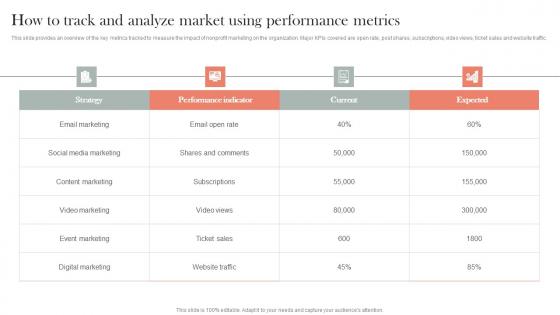
How To Track And Analyze Market Using Metrics Efficient Nonprofit Marketing Ideas Pdf
This slide provides an overview of the key metrics tracked to measure the impact of nonprofit marketing on the organization. Major KPIs covered are open rate, post shares, subscriptions, video views, ticket sales and website traffic.Are you searching for a How To Track And Analyze Market Using Metrics Efficient Nonprofit Marketing Ideas Pdf that is uncluttered, straightforward, and original Its easy to edit, and you can change the colors to suit your personal or business branding. For a presentation that expresses how much effort you have put in, this template is ideal. With all of its features, including tables, diagrams, statistics, and lists, its perfect for a business plan presentation. Make your ideas more appealing with these professional slides. Download How To Track And Analyze Market Using Metrics Efficient Nonprofit Marketing Ideas Pdf from Slidegeeks today. This slide provides an overview of the key metrics tracked to measure the impact of nonprofit marketing on the organization. Major KPIs covered are open rate, post shares, subscriptions, video views, ticket sales and website traffic.
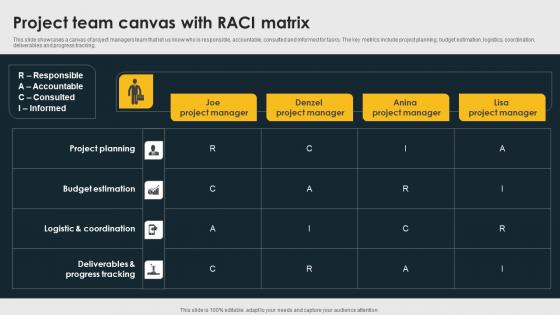
Project Team Canvas With RACI Matrix Demonstration Pdf
This slide showcases a canvas of project managers team that let us know who is responsible, accountable, consulted and informed for tasks. The key metrics include project planning, budget estimation, logistics, coordination, deliverables and progress tracking. Showcasing this set of slides titled Project Team Canvas With RACI Matrix Demonstration Pdf. The topics addressed in these templates are Joe Project Manager, Denzel Project Manager, Lisa Project Manager. All the content presented in this PPT design is completely editable. Download it and make adjustments in color, background, font etc. as per your unique business setting. This slide showcases a canvas of project managers team that let us know who is responsible, accountable, consulted and informed for tasks. The key metrics include project planning, budget estimation, logistics, coordination, deliverables and progress tracking.
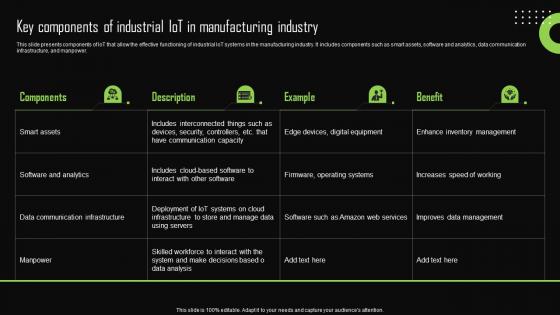
Key Components Of Industrial Iot In Manufacturing Iot Device Management Download Pdf
This slide presents components of IoT that allow the effective functioning of industrial IoT systems in the manufacturing industry. It includes components such as smart assets, software and analytics, data communication infrastructure, and manpower. Slidegeeks is here to make your presentations a breeze with Key Components Of Industrial Iot In Manufacturing Iot Device Management Download Pdf With our easy-to-use and customizable templates, you can focus on delivering your ideas rather than worrying about formatting. With a variety of designs to choose from, you are sure to find one that suits your needs. And with animations and unique photos, illustrations, and fonts, you can make your presentation pop. So whether you are giving a sales pitch or presenting to the board, make sure to check out Slidegeeks first This slide presents components of IoT that allow the effective functioning of industrial IoT systems in the manufacturing industry. It includes components such as smart assets, software and analytics, data communication infrastructure, and manpower.
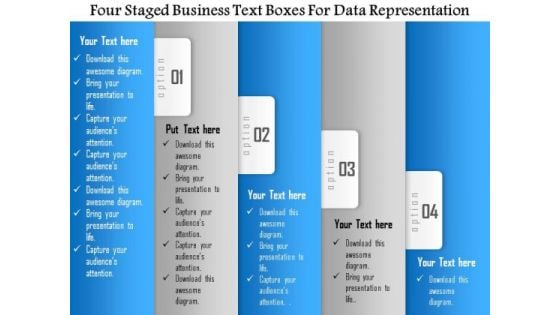
Business Diagram Four Staged Business Text Boxes For Data Representation Presentation Template
Four staged business text boxes are used to design this Power Point template slide. This PPT slide contains the concept of data representation. Use this PPT slide for your business and sales data analysis related topics in any presentation.
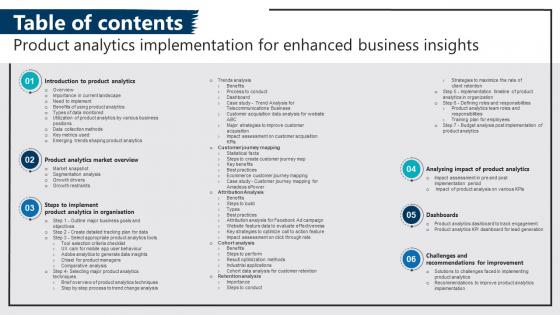
Table Of Contents Product Analytics Implementation For Enhanced Business Insights Data Analytics V
The best PPT templates are a great way to save time, energy, and resources. Slidegeeks have 100 percent editable powerpoint slides making them incredibly versatile. With these quality presentation templates, you can create a captivating and memorable presentation by combining visually appealing slides and effectively communicating your message. Download Table Of Contents Product Analytics Implementation For Enhanced Business Insights Data Analytics V from Slidegeeks and deliver a wonderful presentation. Our Table Of Contents Product Analytics Implementation For Enhanced Business Insights Data Analytics V are topically designed to provide an attractive backdrop to any subject. Use them to look like a presentation pro.
Magnifying Ppt PowerPoint Presentation Design Templates
This is a magnifying ppt powerpoint presentation design templates. This is a six stage process. The stages in this process are magnifying, business, marketing, technology, strategy.
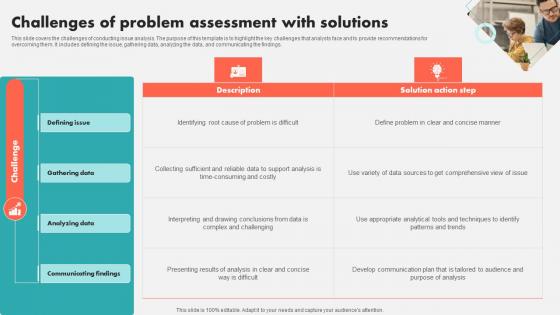
Challenges Of Problem Assessment With Solutions Diagrams Pdf
This slide covers the challenges of conducting issue analysis. The purpose of this template is to highlight the key challenges that analysts face and to provide recommendations for overcoming them. It includes defining the issue, gathering data, analyzing the data, and communicating the findings.Pitch your topic with ease and precision using this Challenges Of Problem Assessment With Solutions Diagrams Pdf This layout presents information on Communicating Findings, Analyzing Data, Gathering Data It is also available for immediate download and adjustment. So, changes can be made in the color, design, graphics or any other component to create a unique layout. This slide covers the challenges of conducting issue analysis. The purpose of this template is to highlight the key challenges that analysts face and to provide recommendations for overcoming them. It includes defining the issue, gathering data, analyzing the data, and communicating the findings.
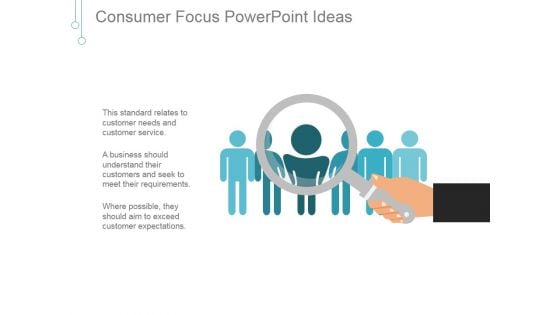
Consumer Focus Ppt PowerPoint Presentation Slides
This is a consumer focus ppt powerpoint presentation slides. This is a one stage process. The stages in this process are search, leadership, business, marketing, magnifying glass.
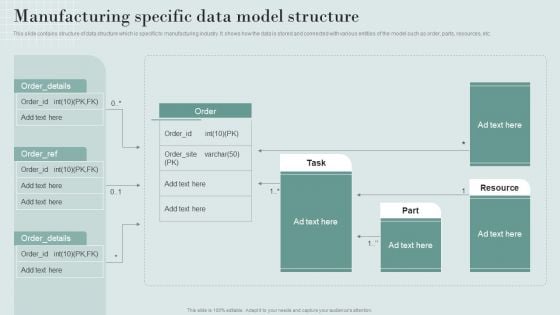
Data Structure IT Manufacturing Specific Data Model Structure Introduction PDF
Coming up with a presentation necessitates that the majority of the effort goes into the content and the message you intend to convey. The visuals of a PowerPoint presentation can only be effective if it supplements and supports the story that is being told. Keeping this in mind our experts created Data Structure IT Manufacturing Specific Data Model Structure Introduction PDF to reduce the time that goes into designing the presentation. This way, you can concentrate on the message while our designers take care of providing you with the right template for the situation.
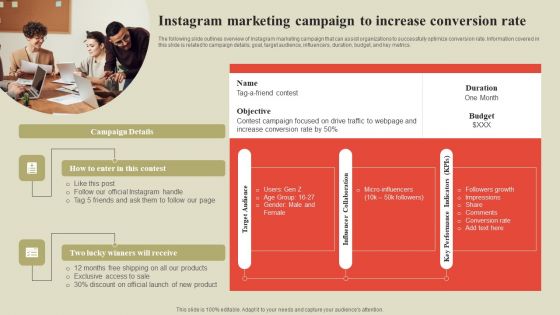
Steps To Effectively Conduct Market Research Instagram Marketing Campaign To Increase Conversion Rate Structure PDF
The following slide outlines overview of Instagram marketing campaign that can assist organizations to successfully optimize conversion rate. Information covered in this slide is related to campaign details, goal, target audience, influencers, duration, budget, and key metrics. The Steps To Effectively Conduct Market Research Instagram Marketing Campaign To Increase Conversion Rate Structure PDF is a compilation of the most recent design trends as a series of slides. It is suitable for any subject or industry presentation, containing attractive visuals and photo spots for businesses to clearly express their messages. This template contains a variety of slides for the user to input data, such as structures to contrast two elements, bullet points, and slides for written information. Slidegeeks is prepared to create an impression.
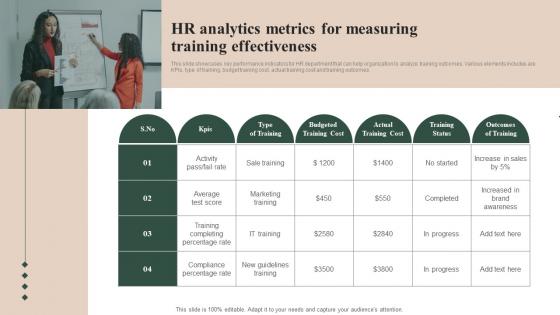
HR Analytics Metrics For Measuring Training Effectiveness Infographics Pdf
This slide showcases key performance indicators for HR department that can help organization to analyze training outcomes. Various elements includes are KPIs, type of training, budget training cost, actual training cost and training outcomes Showcasing this set of slides titled HR Analytics Metrics For Measuring Training Effectiveness Infographics Pdf The topics addressed in these templates are Percentage Rate, Training Completing, Marketing Training All the content presented in this PPT design is completely editable. Download it and make adjustments in color, background, font etc. as per your unique business setting. This slide showcases key performance indicators for HR department that can help organization to analyze training outcomes. Various elements includes are KPIs, type of training, budget training cost, actual training cost and training outcomes.
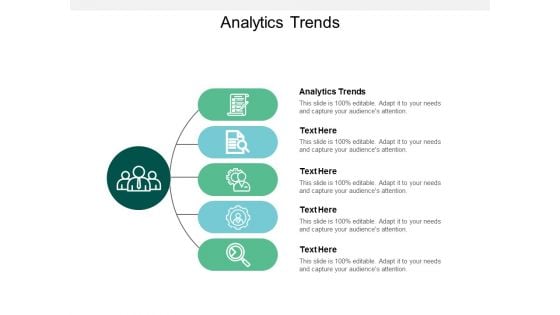
Analytics Trends Ppt PowerPoint Presentation Outline Elements Cpb
Presenting this set of slides with name analytics trends ppt powerpoint presentation outline elements cpb. This is an editable Powerpoint five stages graphic that deals with topics like analytics trends to help convey your message better graphically. This product is a premium product available for immediate download and is 100 percent editable in Powerpoint. Download this now and use it in your presentations to impress your audience.
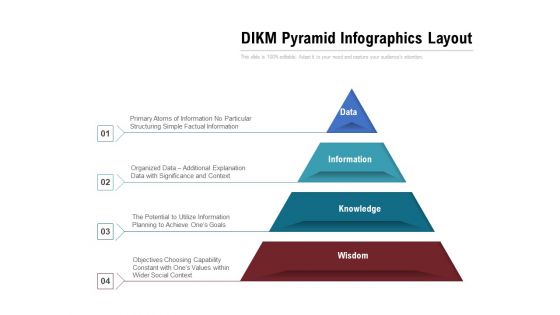
DIKM Pyramid Infographics Layout Ppt PowerPoint Presentation Outline Brochure PDF
Persuade your audience using this dikm pyramid infographics layout ppt powerpoint presentation outline brochure pdf. This PPT design covers four stages, thus making it a great tool to use. It also caters to a variety of topics including wisdom, knowledge, information, data. Download this PPT design now to present a convincing pitch that not only emphasizes the topic but also showcases your presentation skills.

Market Research Demand Deliverables Of Market Research Services Ppt Slides Graphic Tips PDF
Presenting this set of slides with name market research demand deliverables of market research services ppt slides graphic tips pdf. This is a one stage process. The stages in this process are filled questionnaire of the respondents, detailed written project report with analysis and recommendations, powerpoint report on key findings. This is a completely editable PowerPoint presentation and is available for immediate download. Download now and impress your audience.

Optimizing Marketing Analytics To Enhance Organizational Growth Analyzing Organic Click Through Rates Elements PDF
This slide covers an overview of click through rate KPI to identify the percentage of visitors who click on your page after their search triggers an impression. It also includes optimizing strategies, using descriptive URLs, localizing content, and adding structured data. This Optimizing Marketing Analytics To Enhance Organizational Growth Analyzing Organic Click Through Rates Elements PDF from Slidegeeks makes it easy to present information on your topic with precision. It provides customization options, so you can make changes to the colors, design, graphics, or any other component to create a unique layout. It is also available for immediate download, so you can begin using it right away. Slidegeeks has done good research to ensure that you have everything you need to make your presentation stand out. Make a name out there for a brilliant performance.
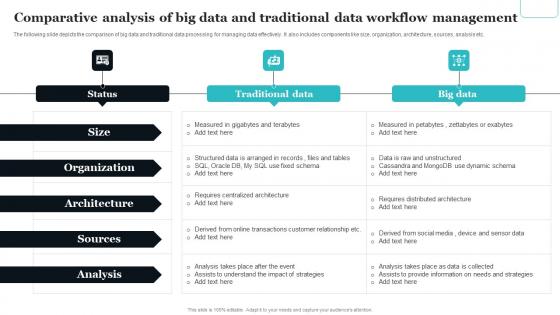
Comparative Analysis Of Big Data And Traditional Data Workflow Management Topics Pdf
The following slide depicts the comparison of big data and traditional data processing for managing data effectively. It also includes components like size, organization, architecture, sources, analysis etc. Showcasing this set of slides titled Comparative Analysis Of Big Data And Traditional Data Workflow Management Topics Pdf The topics addressed in these templates are Organization, Architecture, Sources, Analysis All the content presented in this PPT design is completely editable. Download it and make adjustments in color, background, font etc. as per your unique business setting. The following slide depicts the comparison of big data and traditional data processing for managing data effectively. It also includes components like size, organization, architecture, sources, analysis etc.
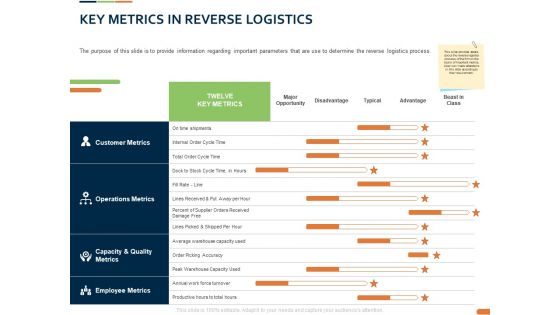
Closed Loop Supply Chain Management Key Metrics In Reverse Logistics Ppt Outline Design Templates PDF
Presenting this set of slides with name closed loop supply chain management key metrics in reverse logistics ppt outline design templates pdf. The topics discussed in these slides are customer metrics, operations metrics, capacity and quality metrics, employee metrics. This is a completely editable PowerPoint presentation and is available for immediate download. Download now and impress your audience.
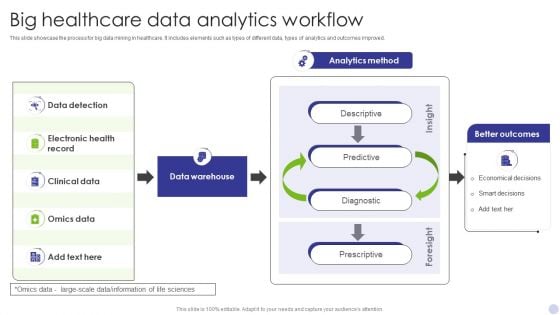
Big Healthcare Data Analytics Workflow Infographics PDF
This slide showcase the process for big data mining in healthcare. It includes elements such as types of different data, types of analytics and outcomes improved. Showcasing this set of slides titled Big Healthcare Data Analytics Workflow Infographics PDF. The topics addressed in these templates are Data Detection, Electronic Health Record, Clinical Data. All the content presented in this PPT design is completely editable. Download it and make adjustments in color, background, font etc. as per your unique business setting.
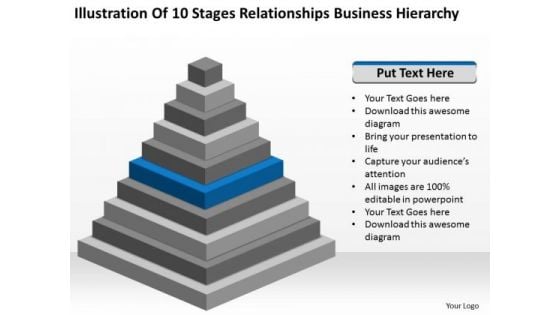
Stages Relationships Business Hierarchy Plan For PowerPoint Templates
We present our stages relationships business hierarchy plan for PowerPoint templates.Use our Leadership PowerPoint Templates because Our PowerPoint Templates and Slides will Activate the energies of your audience. Get their creative juices flowing with your words. Present our Construction PowerPoint Templates because Our PowerPoint Templates and Slides provide you with a vast range of viable options. Select the appropriate ones and just fill in your text. Download our Pyramids PowerPoint Templates because Watching this your Audience will Grab their eyeballs, they wont even blink. Download and present our Ladders PowerPoint Templates because Our PowerPoint Templates and Slides are topically designed to provide an attractive backdrop to any subject. Present our Business PowerPoint Templates because You should Ascend the ladder of success with ease. Our PowerPoint Templates and Slides will provide strong and sturdy steps.Use these PowerPoint slides for presentations relating to Pyramid, chart, diagram, graph, set, population, isolated, statistics, model, triangle, corporate, tool, business, concept, vector, hierarchy, presentation, symbol, layered, data, process, level, layer, top, creating, shape, management, manage, support, illustration, stage, object, system, principal, reflection, design, direction, color, group, growth, organization, progress, information, conceptual, resource, construction, structure, rank, performance. The prominent colors used in the PowerPoint template are Blue, Gray, Black. You've found a valuable resource with our Stages Relationships Business Hierarchy Plan For PowerPoint Templates. You'll always stay ahead of the game.
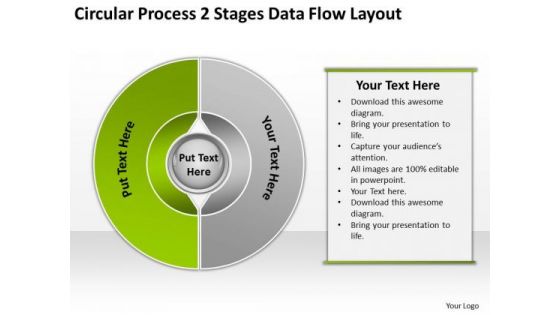
Circular Process 2 Stages Data Flow Layout Market Plan Example PowerPoint Slides
We present our circular process 2 stages data flow layout market plan example PowerPoint Slides.Use our Process and Flows PowerPoint Templates because Our PowerPoint Templates and Slides will let your team Walk through your plans. See their energy levels rise as you show them the way. Download our Circle Charts PowerPoint Templates because Our PowerPoint Templates and Slides will Activate the energies of your audience. Get their creative juices flowing with your words. Download our Business PowerPoint Templates because These PowerPoint Templates and Slides will give the updraft to your ideas. See them soar to great heights with ease. Use our Marketing PowerPoint Templates because You are an avid believer in ethical practices. Highlight the benefits that accrue with our PowerPoint Templates and Slides. Use our Success PowerPoint Templates because Our PowerPoint Templates and Slides will let you meet your Deadlines.Use these PowerPoint slides for presentations relating to Cross, circle,statistics, model, target,two,steps, statement, interface, business, arrow, list, presentation, glossy, internet, diagram, circle,brochure, description, report, marketing, level, abstract, wheel, steps, illustration, pie, chart, sphere, registry, catalog, section, futuristic, colors, web, design,information, space, demonstration, navigation, pattern, webdesign, structure, multiple, button, goals. The prominent colors used in the PowerPoint template are Green lime, White, Gray. Our Circular Process 2 Stages Data Flow Layout Market Plan Example PowerPoint Slides have a everlasting effect. They remain in the memory for ages.
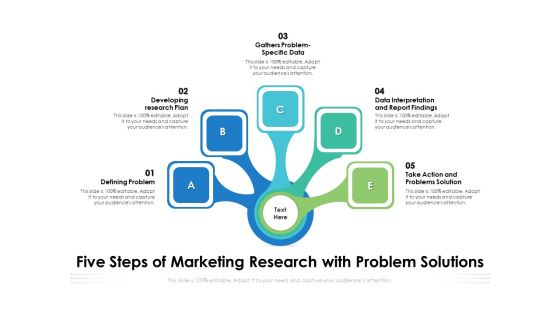
Five Steps Of Marketing Research With Problem Solutions Ppt PowerPoint Presentation Outline Good PDF
Presenting five steps of marketing research with problem solutions ppt powerpoint presentation outline good pdf to dispense important information. This template comprises five stages. It also presents valuable insights into the topics including defining problem, developing research plan, gathers problem-specific data, data interpretation and report findings, take action and problems solution. This is a completely customizable PowerPoint theme that can be put to use immediately. So, download it and address the topic impactfully.
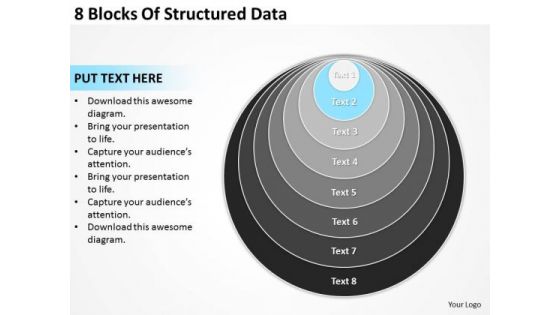
8 Blocks Of Structured Data Business Plan Format Template PowerPoint Templates
We present our 8 blocks of structured data business plan format template PowerPoint templates.Use our Business PowerPoint Templates because It can be used to Set your controls for the heart of the sun. Our PowerPoint Templates and Slides will be the propellant to get you there. Download our Venn Diagrams PowerPoint Templates because You have gained great respect for your brilliant ideas. Use our PowerPoint Templates and Slides to strengthen and enhance your reputation. Download our Layers PowerPoint Templates because You can Zap them with our PowerPoint Templates and Slides. See them reel under the impact. Present our Circle Charts PowerPoint Templates because It can Conjure up grand ideas with our magical PowerPoint Templates and Slides. Leave everyone awestruck by the end of your presentation. Download and present our Shapes PowerPoint Templates because Our PowerPoint Templates and Slides help you meet the demand of the Market. Just browse and pick the slides that appeal to your intuitive senses.Use these PowerPoint slides for presentations relating to diagram, process, business, graphic, design, ideas, model, data, chart, project, schema, corporate, implementation, tag, plan, engineering, concept, vector, success, symbol, stack, circle, guide, work flow, development, shape, team, management, cycle, steps, illustration, system, strategy, objects, phase, professional, organization, implement, background, image, detail, structure, product. The prominent colors used in the PowerPoint template are Blue light, Gray, Black. Our 8 Blocks Of Structured Data Business Plan Format Template PowerPoint Templates afford a distinct approach. Your thoughts will acquire a different character.
Statistical Analysis Procedure To Identify Problem Icon Guidelines PDF
Persuade your audience using this Statistical Analysis Procedure To Identify Problem Icon Guidelines PDF. This PPT design covers three stages, thus making it a great tool to use. It also caters to a variety of topics including Statistical Analysis Procedure, Identify Problem Icon. Download this PPT design now to present a convincing pitch that not only emphasizes the topic but also showcases your presentation skills.


 Continue with Email

 Home
Home


