Executive Summary Metrics
Proposal For B2B Services Key Deliverables For B2B Services One Pager Sample Example Document
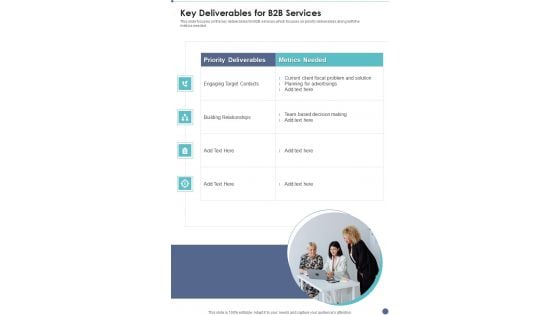
This slide focuses on the key deliverables for B2B services which focuses on priority deliverables along with the metrics needed. Presenting you an exemplary Proposal For B2B Services Key Deliverables For B2B Services One Pager Sample Example Document. Our one-pager comprises all the must-have essentials of an inclusive document. You can edit it with ease, as its layout is completely editable. With such freedom, you can tweak its design and other elements to your requirements. Download this Proposal For B2B Services Key Deliverables For B2B Services One Pager Sample Example Document brilliant piece now.
Online Analysis Dashboard For Email Marketing Campaign Elements PDF
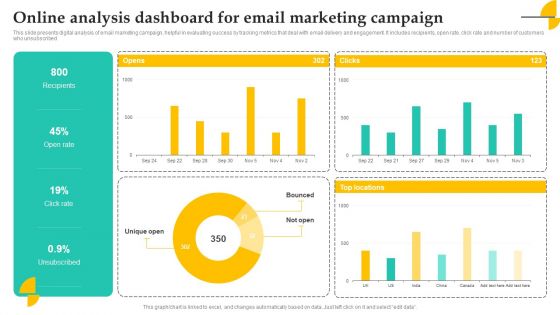
This slide presents digital analysis of email marketing campaign, helpful in evaluating success by tracking metrics that deal with email delivery and engagement. It includes recipients, open rate, click rate and number of customers who unsubscribed Showcasing this set of slides titled Online Analysis Dashboard For Email Marketing Campaign Elements PDF. The topics addressed in these templates are Recipients, Open Rate, Campaign. All the content presented in this PPT design is completely editable. Download it and make adjustments in color, background, font etc. as per your unique business setting.
Development And Operations KPI Dashboard With Central Processing Unit Statistics Icons PDF
This slide covers devops KPI metrics dashboard with central processing unit statistics about input output statistics , network traffic volume under during recorded sessions. Further, this template includes numbers of sessions with waiting time.Showcasing this set of slides titled Development And Operations KPI Dashboard With Central Processing Unit Statistics Icons PDF The topics addressed in these templates are Central Processing, Output Statistics, Resource Limits All the content presented in this PPT design is completely editable. Download it and make adjustments in color, background, font etc. as per your unique business setting.
Strategy To Improve Team Proficiency Challenges Faced By Organization Brochure PDF
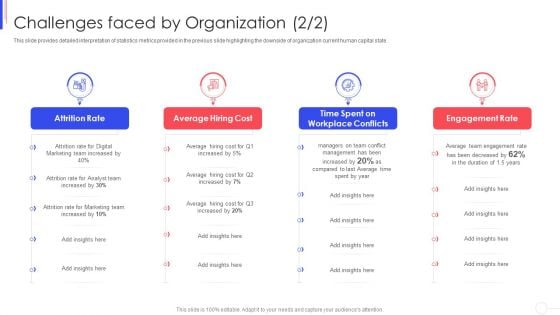
This slide provides detailed interpretation of statistics metrics provided in the previous slide highlighting the downside of organization current human capital state. Presenting strategy to improve team proficiency challenges faced by organization brochure pdf to provide visual cues and insights. Share and navigate important information on four stages that need your due attention. This template can be used to pitch topics like team, marketing, cost, workplace, conflicts, attrition. In addtion, this PPT design contains high resolution images, graphics, etc, that are easily editable and available for immediate download.
Facebook Original Capital Funding Key Statistics Of Facebook Site Usage Topics PDF
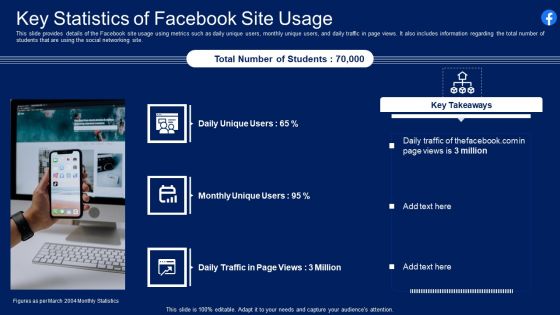
This slide provides details of the Facebook site usage using metrics such as daily unique users, monthly unique users, and daily traffic in page views. It also includes information regarding the total number of students that are using the social networking site. Presenting facebook original capital funding key statistics of facebook site usage topics pdf to provide visual cues and insights. Share and navigate important information on three stages that need your due attention. This template can be used to pitch topics like key statistics of facebook site usage. In addtion, this PPT design contains high resolution images, graphics, etc, that are easily editable and available for immediate download.
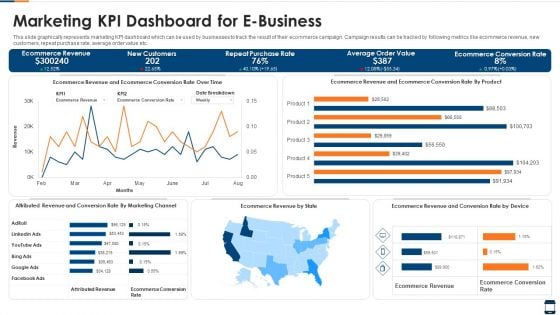
Marketing KPI Dashboard For E Business Brochure PDF
This slide graphically represents marketing KPI dashboard which can be used by businesses to track the result of their ecommerce campaign. Campaign results can be tracked by following metrics like ecommerce revenue, new customers, repeat purchase rate, average order value etc. Showcasing this set of slides titled marketing kpi dashboard for e business brochure pdf. The topics addressed in these templates are marketing kpi dashboard for e business. All the content presented in this PPT design is completely editable. Download it and make adjustments in color, background, font etc. as per your unique business setting.
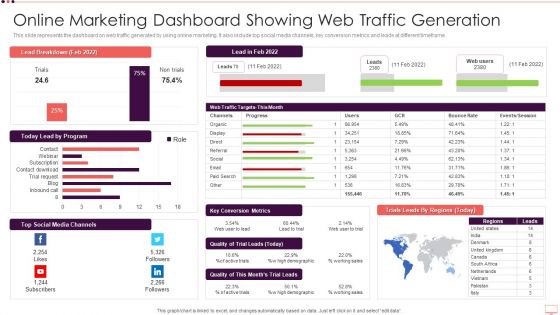
Online Marketing Dashboard Showing Web Traffic Generation Formats PDF
This slide represents the dashboard on web traffic generated by using online marketing. It also include top social media channels, key conversion metrics and leads at different timeframe. Showcasing this set of slides titled Online Marketing Dashboard Showing Web Traffic Generation Formats PDF. The topics addressed in these templates are Online Marketing Dashboard Showing Web Traffic Generation. All the content presented in this PPT design is completely editable. Download it and make adjustments in color, background, font etc. as per your unique business setting.
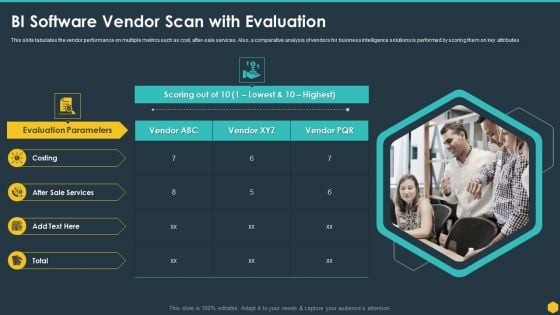
BI Software Vendor Scan With Evaluation BI Transformation Toolset Brochure PDF
This slide tabulates the vendor performance on multiple metrics such as cost, after-sale services. Also, a comparative analysis of vendors for business intelligence solutions is performed by scoring them on key attributes. Presenting BI Software Vendor Scan With Evaluation BI Transformation Toolset Brochure PDF to provide visual cues and insights. Share and navigate important information on one stages that need your due attention. This template can be used to pitch topics like Evaluation Parameters, Costing, After Sale Services. In addtion, this PPT design contains high resolution images, graphics, etc, that are easily editable and available for immediate download.
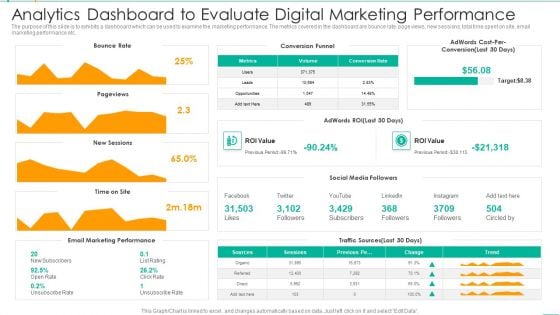
Analytics Dashboard To Evaluate Digital Marketing Performance Mockup PDF
The purpose of this slide is to exhibits a dashboard which can be used to examine the marketing performance. The metrics covered in the dashboard are bounce rate, page views, new sessions, total time spent on site, email marketing performance etc. Showcasing this set of slides titled Analytics Dashboard To Evaluate Digital Marketing Performance Mockup PDF. The topics addressed in these templates are Conversion Funnel, Target, Marketing Performance. All the content presented in this PPT design is completely editable. Download it and make adjustments in color, background, font etc. as per your unique business setting.
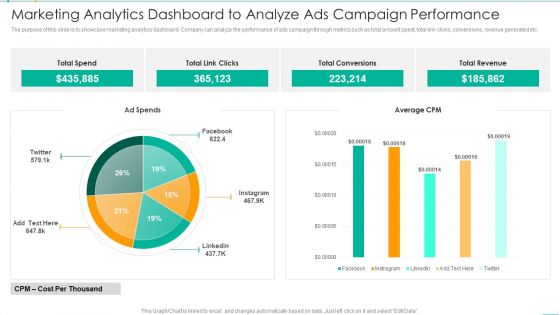
Marketing Analytics Dashboard To Analyze Ads Campaign Performance Microsoft PDF
The purpose of this slide is to showcase marketing analytics dashboard. Company can analyze the performance of ads campaign through metrics such as total amount spent, total link clicks, conversions, revenue generated etc. Showcasing this set of slides titled Marketing Analytics Dashboard To Analyze Ads Campaign Performance Microsoft PDF. The topics addressed in these templates are Marketing Analytics Dashboard To Analyze Ads Campaign Performance. All the content presented in this PPT design is completely editable. Download it and make adjustments in color, background, font etc. as per your unique business setting.
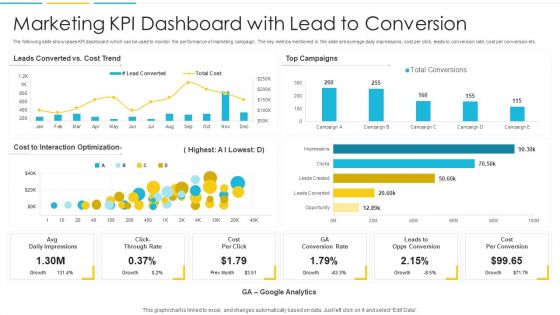
Marketing KPI Dashboard With Lead To Conversion Structure PDF
The following slide showcases KPI dashboard which can be used to monitor the performance of marketing campaign. The key metrics mentioned in the slide are average daily impressions, cost per click, leads to conversion rate, cost per conversion etc. Showcasing this set of slides titled Marketing KPI Dashboard With Lead To Conversion Structure PDF. The topics addressed in these templates are Impressions, Optimization, Cost. All the content presented in this PPT design is completely editable. Download it and make adjustments in color, background, font etc. as per your unique business setting.
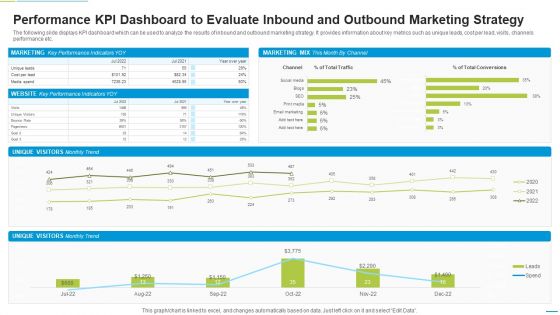
Performance KPI Dashboard To Evaluate Inbound And Outbound Marketing Strategy Mockup PDF
The following slide displays KPI dashboard which can be used to analyze the results of inbound and outbound marketing strategy. It provides information about key metrics such as unique leads, cost per lead, visits, channels performance etc. Showcasing this set of slides titled Performance KPI Dashboard To Evaluate Inbound And Outbound Marketing Strategy Mockup PDF. The topics addressed in these templates are Marketing, Unique Visitors, Cost Per Lead. All the content presented in this PPT design is completely editable. Download it and make adjustments in color, background, font etc. as per your unique business setting.
Performance Evaluation KPI Dashboard For 360 Degree Review Icons PDF
This slide covers 360 degree employee feedback dashboard. It includes metrics such as highest rated area, lowest rated area, potential blind spots, peer ratings, self rating, gap analysis, etc. Showcasing this set of slides titled Performance Evaluation KPI Dashboard For 360 Degree Review Icons PDF. The topics addressed in these templates are Highest Rated, Lowest Areas, Potential Spots. All the content presented in this PPT design is completely editable. Download it and make adjustments in color, background, font etc. as per your unique business setting.
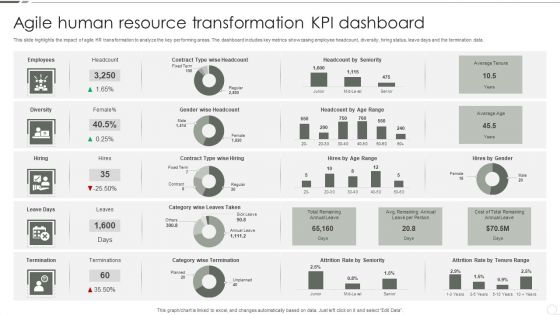
Agile Human Resource Transformation KPI Dashboard Microsoft PDF
This slide highlights the impact of agile HR transformation to analyze the key performing areas. The dashboard includes key metrics showcasing employee headcount, diversity, hiring status, leave days and the termination data. Showcasing this set of slides titled Agile Human Resource Transformation KPI Dashboard Microsoft PDF. The topics addressed in these templates are Employees, Diversity, Hiring, Leave Days, Termination. All the content presented in this PPT design is completely editable. Download it and make adjustments in color, background, font etc. as per your unique business setting.
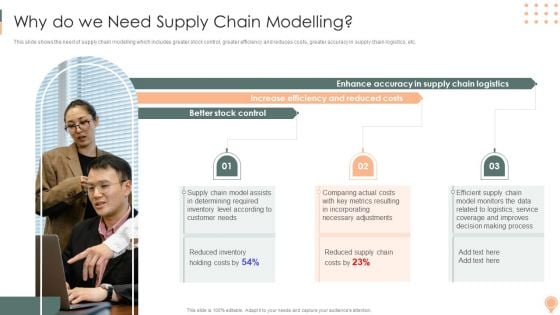
Supply Chain Approaches Why Do We Needsupply Chain Modelling Diagrams PDF
This slide shows the need of supply chain modelling which includes greater stock control, greater efficiency and reduces costs, greater accuracy in supply chain logistics, etc.Presenting Supply Chain Approaches Why Do We Needsupply Chain Modelling Diagrams PDF to provide visual cues and insights. Share and navigate important information on three stages that need your due attention. This template can be used to pitch topics like Determining Require, Inventory Level According, Metrics Resulting. In addtion, this PPT design contains high resolution images, graphics, etc, that are easily editable and available for immediate download.
Consumer Journey Mapping Techniques Dashboard For Tracking Digital Content Performance Clipart PDF
This slide covers the KPI dashboard for analyzing online content. It includes metrics such as blog visitors, pageviews, newsletter conversion rate, new signups, new customers, etc. Showcasing this set of slides titled Consumer Journey Mapping Techniques Dashboard For Tracking Digital Content Performance Clipart PDF. The topics addressed in these templates are Purchase Amount, Customers, Tracking Digital Content Performance. All the content presented in this PPT design is completely editable. Download it and make adjustments in color, background, font etc. as per your unique business setting.
Consumer Journey Mapping Techniques Referral Program Performance Tracking Dashboard Formats PDF
This slide covers the KPI dashboard for analyzing referral campaign results. It includes metrics such as total revenue generated, monthly recurring revenue, new customers, clicks, cancelled customers, paying customers, etc. Showcasing this set of slides titled Consumer Journey Mapping Techniques Referral Program Performance Tracking Dashboard Formats PDF. The topics addressed in these templates are Revenue, New Customers, Paying Customers. All the content presented in this PPT design is completely editable. Download it and make adjustments in color, background, font etc. as per your unique business setting.
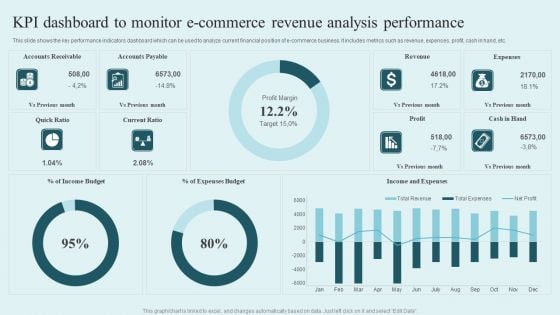
KPI Dashboard To Monitor E Commerce Revenue Analysis Performance Mockup PDF
This slide shows the key performance indicators dashboard which can be used to analyze current financial position of e-commerce business. It includes metrics such as revenue, expenses, profit, cash in hand, etc. Showcasing this set of slides titled KPI Dashboard To Monitor E Commerce Revenue Analysis Performance Mockup PDF. The topics addressed in these templates are Accounts Receivable, Accounts Payable, Revenue, Expenses. All the content presented in this PPT design is completely editable. Download it and make adjustments in color, background, font etc. as per your unique business setting.
Google Adwords Strategic Campaign Performance Tracking Dashboard Icons PDF
This slide showcases KPI dashboard for real time tracking of performance metrics for google adwords campaign. It includes elements such as cost interactions, impressions, device, etc. Showcasing this set of slides titled Google Adwords Strategic Campaign Performance Tracking Dashboard Icons PDF. The topics addressed in these templates are Campaign Performance Device, Interaction Rate Cost Device, Daily Cost Device. All the content presented in this PPT design is completely editable. Download it and make adjustments in color, background, font etc. as per your unique business setting.
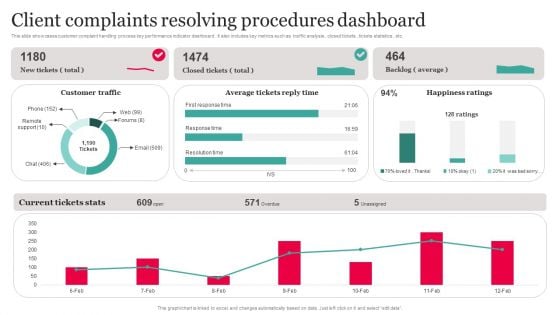
Client Complaints Resolving Procedures Dashboard Download PDF
This slide showcases customer complaint handling process key performance indicator dashboard. It also includes key metrics such as traffic analysis , closed tickets , tickets statistics , etc. Showcasing this set of slides titled Client Complaints Resolving Procedures Dashboard Download PDF The topics addressed in these templates are Customer Traffic, Average Tickets Reply Time, Resolving Procedures Dashboard. All the content presented in this PPT design is completely editable. Download it and make adjustments in color, background, font etc. as per your unique business setting.
Google Keyword Assessment KPI Dashboard For Tracking Improvement In Website Traffic Infographics PDF
Following slide demonstrates keyword analysis dashboard which can be used by business to track website traffic performance. It includes metrics such as average keyword position, keyword ranking distribution, keyword ranking, keyword in top 3, top 10, top 20 and top 100. Showcasing this set of slides titled Google Keyword Assessment KPI Dashboard For Tracking Improvement In Website Traffic Infographics PDF. The topics addressed in these templates are Keyword Ranking, Keyword Ranking Distribution, Average Keyword Position. All the content presented in this PPT design is completely editable. Download it and make adjustments in color, background, font etc. as per your unique business setting.
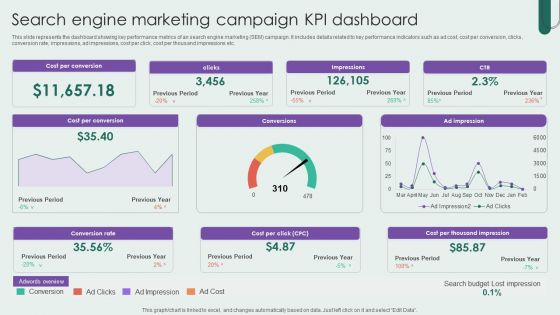
Search Engine Marketing Campaign KPI Dashboard Inspiration PDF
This slide represents the dashboard showing key performance metrics of an search engine marketing SEM campaign. It includes details related to key performance indicators such as ad cost, cost per conversion, clicks, conversion rate, impressions, ad impressions, cost per click, cost per thousand impressions etc. Showcasing this set of slides titled Search Engine Marketing Campaign KPI Dashboard Inspiration PDF. The topics addressed in these templates are Search Engine Marketing, Campaign KPI Dashboard. All the content presented in this PPT design is completely editable. Download it and make adjustments in color, background, font etc. as per your unique business setting.
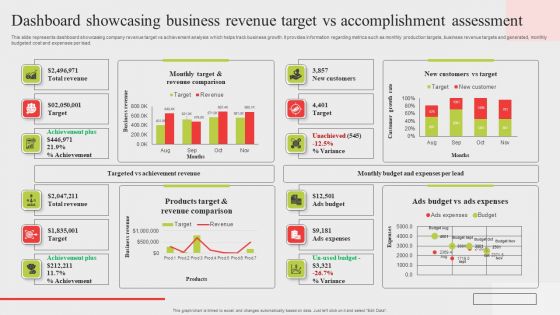
Dashboard Showcasing Business Revenue Target Vs Accomplishment Assessment Information PDF
This slide represents dashboard showcasing company revenue target vs achievement analysis which helps track business growth. It provides information regarding metrics such as monthly production targets, business revenue targets and generated, monthly budgeted cost and expenses per lead. Showcasing this set of slides titled Dashboard Showcasing Business Revenue Target Vs Accomplishment Assessment Information PDF. The topics addressed in these templates are Total Revenue, Target, Achievement. All the content presented in this PPT design is completely editable. Download it and make adjustments in color, background, font etc. as per your unique business setting.
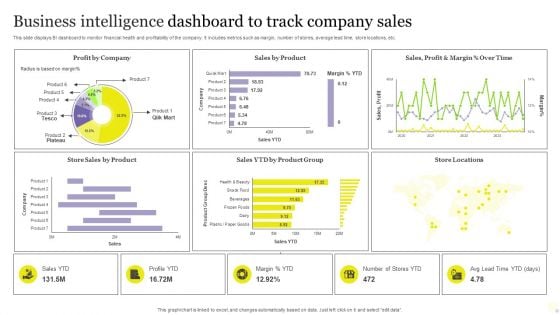
Business Intelligence Dashboard To Track Company Sales Rules PDF
This slide displays BI dashboard to monitor financial health and profitability of the company. It includes metrics such as margin, number of stores, average lead time, store locations, etc. Showcasing this set of slides titled Business Intelligence Dashboard To Track Company Sales Rules PDF. The topics addressed in these templates are Business Intelligence Dashboard, Track Company Sales. All the content presented in this PPT design is completely editable. Download it and make adjustments in color, background, font etc. as per your unique business setting.
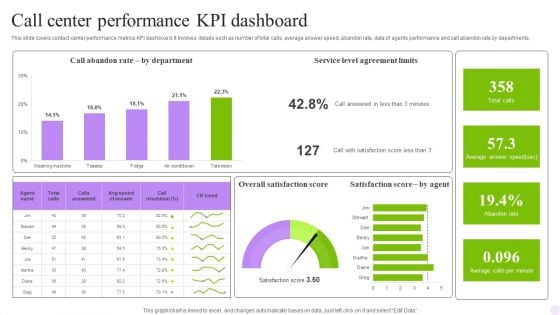
Call Center Performance KPI Dashboard Formats PDF
This slide covers contact center performance metrics KPI dashboard. It involves details such as number of total calls, average answer speed, abandon rate, data of agents performance and call abandon rate by departments. Showcasing this set of slides titled Call Center Performance KPI Dashboard Formats PDF. The topics addressed in these templates are Department, Dashboard, Agreement Limits. All the content presented in this PPT design is completely editable. Download it and make adjustments in color, background, font etc. as per your unique business setting.

KPI Analytics Dashboard With Sourcing Raw Material Cycle Time Inspiration PDF
Following slide shows the key performance indicator KPI dashboard which will assist corporates to effectively monitor procurement process. The metrics are number of suppliers, contract compliance, average procurement cycle time, etc. Showcasing this set of slides titled KPI Analytics Dashboard With Sourcing Raw Material Cycle Time Inspiration PDF. The topics addressed in these templates are Kpi Analytics Dashboard, Sourcing Raw Material, Cycle Time. All the content presented in this PPT design is completely editable. Download it and make adjustments in color, background, font etc. as per your unique business setting.
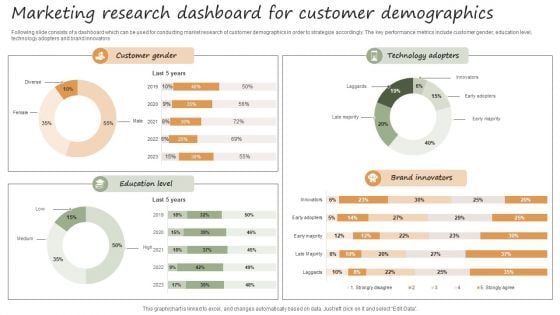
Marketing Research Dashboard For Customer Demographics Guidelines PDF
Following slide consists of a dashboard which can be used for conducting market research of customer demographics in order to strategize accordingly. The key performance metrics include customer gender, education level, technology adopters and brand innovators. Showcasing this set of slides titled Marketing Research Dashboard For Customer Demographics Guidelines PDF. The topics addressed in these templates are Customer Gender, Technology Adopters, Education Level. All the content presented in this PPT design is completely editable. Download it and make adjustments in color, background, font etc. as per your unique business setting.
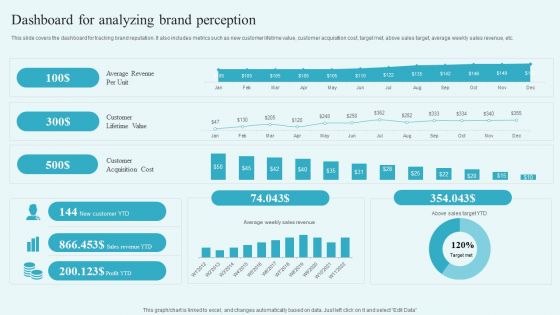
Dashboard For Analyzing Brand Perception Building A Comprehensive Brand Elements PDF
This slide covers the dashboard for tracking brand reputation. It also includes metrics such as new customer lifetime value, customer acquisition cost, target met, above sales target, average weekly sales revenue, etc. Find a pre-designed and impeccable Dashboard For Analyzing Brand Perception Building A Comprehensive Brand Elements PDF. The templates can ace your presentation without additional effort. You can download these easy-to-edit presentation templates to make your presentation stand out from others. So, what are you waiting for Download the template from Slidegeeks today and give a unique touch to your presentation.
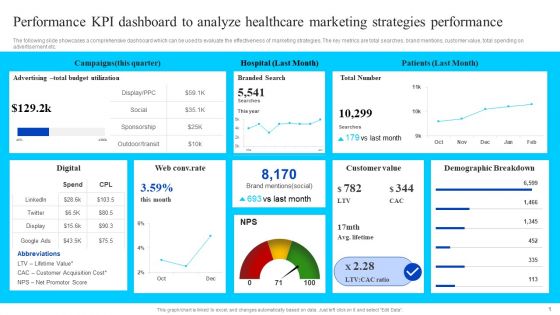
Performance KPI Dashboard To Analyze Healthcare Marketing Strategies Performance Elements PDF
The following slide showcases a comprehensive dashboard which can be used to evaluate the effectiveness of marketing strategies. The key metrics are total searches, brand mentions, customer value, total spending on advertisement etc. If your project calls for a presentation, then Slidegeeks is your go to partner because we have professionally designed, easy to edit templates that are perfect for any presentation. After downloading, you can easily edit Performance KPI Dashboard To Analyze Healthcare Marketing Strategies Performance Elements PDF and make the changes accordingly. You can rearrange slides or fill them with different images. Check out all the handy templates.
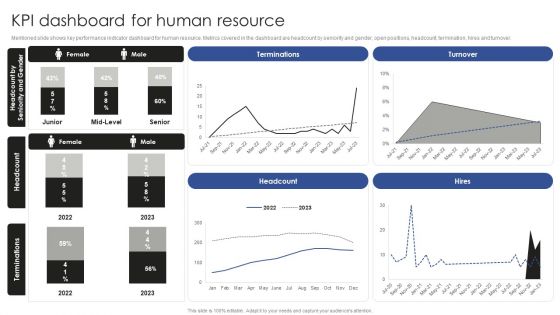
Talent Administration And Succession KPI Dashboard For Human Resource Rules PDF
Mentioned slide shows key performance indicator dashboard for human resource. Metrics covered in the dashboard are headcount by seniority and gender, open positions, headcount, termination, hires and turnover. If your project calls for a presentation, then Slidegeeks is your go-to partner because we have professionally designed, easy-to-edit templates that are perfect for any presentation. After downloading, you can easily edit Talent Administration And Succession KPI Dashboard For Human Resource Rules PDF and make the changes accordingly. You can rearrange slides or fill them with different images. Check out all the handy templates
Ultimate Guide To Improve Customer Support And Services Dashboard For Tracking Aftersales Customer Sample PDF
This slide covers the KPI dashboard for ticket tracking. It includes metrics such as tickets by month, service level, and details of customer service department agents. If your project calls for a presentation, then Slidegeeks is your go to partner because we have professionally designed, easy to edit templates that are perfect for any presentation. After downloading, you can easily edit Ultimate Guide To Improve Customer Support And Services Dashboard For Tracking Aftersales Customer Sample PDF and make the changes accordingly. You can rearrange slides or fill them with different images. Check out all the handy templates

Best Ways To Analyze Effectiveness Of Email Marketing Graphics PDF
This slide showcases best and effective ways to analyse the result of email marketing. It includes metrics such as check CTR, evaluate conversion rates, bounce rate, conduct A B testing and revenue generation. If your project calls for a presentation, then Slidegeeks is your go-to partner because we have professionally designed, easy-to-edit templates that are perfect for any presentation. After downloading, you can easily edit Best Ways To Analyze Effectiveness Of Email Marketing Graphics PDF and make the changes accordingly. You can rearrange slides or fill them with different images. Check out all the handy templates
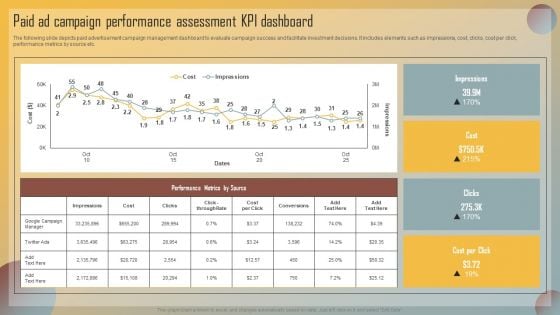
Guide For Marketing Analytics To Improve Decisions Paid Ad Campaign Performance Assessment KPI Dashboard Microsoft PDF
The following slide depicts paid advertisement campaign management dashboard to evaluate campaign success and facilitate investment decisions. It includes elements such as impressions, cost, clicks, cost per click, performance metrics by source etc. There are so many reasons you need a Guide For Marketing Analytics To Improve Decisions Paid Ad Campaign Performance Assessment KPI Dashboard Microsoft PDF. The first reason is you cannot spend time making everything from scratch, Thus, Slidegeeks has made presentation templates for you too. You can easily download these templates from our website easily.
Competitor Business Customer Analysis Matrix Ppt Layouts Example File Pdf
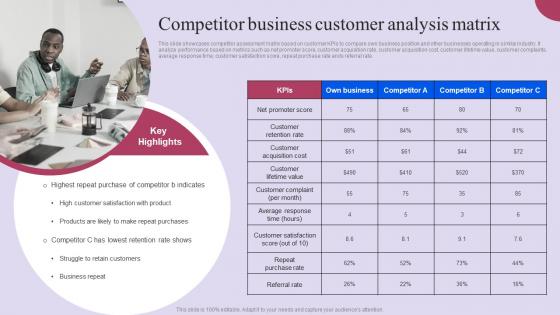
This slide showcases competitor assessment matrix based on customer KPIs to compare own business position and other businesses operating in similar industry. It analyze performance based on metrics such as net promoter score, customer acquisition rate, customer acquisition cost, customer lifetime value, customer complaints, average response time, customer satisfaction score, repeat purchase rate ands referral rate. Slidegeeks is here to make your presentations a breeze with Competitor Business Customer Analysis Matrix Ppt Layouts Example File Pdf With our easy to use and customizable templates, you can focus on delivering your ideas rather than worrying about formatting. With a variety of designs to choose from, you are sure to find one that suits your needs. And with animations and unique photos, illustrations, and fonts, you can make your presentation pop. So whether you are giving a sales pitch or presenting to the board, make sure to check out Slidegeeks first This slide showcases competitor assessment matrix based on customer KPIs to compare own business position and other businesses operating in similar industry. It analyze performance based on metrics such as net promoter score, customer acquisition rate, customer acquisition cost, customer lifetime value, customer complaints, average response time, customer satisfaction score, repeat purchase rate ands referral rate.
Consumer Adoption Challenges Faced By Organization Analyzing Customer Adoption Journey Designs Pdf
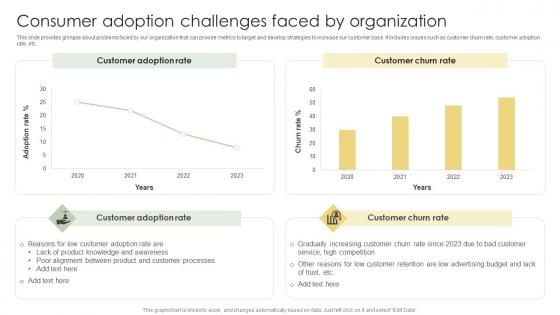
This slide provides glimpse about problems faced by our organization that can provide metrics to target and develop strategies to increase our customer base. It includes issues such as customer churn rate, customer adoption rate, etc.Do you have to make sure that everyone on your team knows about any specific topic I yes, then you should give Consumer Adoption Challenges Faced By Organization Analyzing Customer Adoption Journey Designs Pdf a try. Our experts have put a lot of knowledge and effort into creating this impeccable Consumer Adoption Challenges Faced By Organization Analyzing Customer Adoption Journey Designs Pdf. You can use this template for your upcoming presentations, as the slides are perfect to represent even the tiniest detail. You can download these templates from the Slidegeeks website and these are easy to edit. So grab these today. This slide provides glimpse about problems faced by our organization that can provide metrics to target and develop strategies to increase our customer base. It includes issues such as customer churn rate, customer adoption rate, etc.
Business Sustainability Action Plan With Key Methods Ppt Template SS
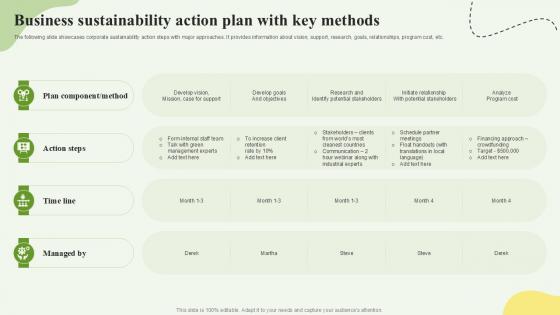
This slide showcases HR analysis using business intelligence tool. The purpose of this slide is to understand the workforce demographics and effective management of employees to achieve business goals. It includes key metrics such as absenteeism rate, overtime hours, overall effectiveness and cost of training along with key takeaways. Do you have to make sure that everyone on your team knows about any specific topic I yes, then you should give Business Sustainability Action Plan With Key Methods Ppt Template SS a try. Our experts have put a lot of knowledge and effort into creating this impeccable Business Sustainability Action Plan With Key Methods Ppt Template SS You can use this template for your upcoming presentations, as the slides are perfect to represent even the tiniest detail. You can download these templates from the Slidegeeks website and these are easy to edit. So grab these today This slide showcases HR analysis using business intelligence tool. The purpose of this slide is to understand the workforce demographics and effective management of employees to achieve business goals. It includes key metrics such as absenteeism rate, overtime hours, overall effectiveness and cost of training along with key takeaways.

Ultimate Guide To Developing Kpis To Measure Effectiveness Of Content On Auto Dealer Strategy SS V
This slide covers metrics to evaluate effectiveness of content posted on dealers website. The purpose of this template is to provide an overview on top key performance indicators determining success of content such as user behavior, engagement, SEO outcomes, company revenue generation, etc. The Ultimate Guide To Developing Kpis To Measure Effectiveness Of Content On Auto Dealer Strategy SS V is a compilation of the most recent design trends as a series of slides. It is suitable for any subject or industry presentation, containing attractive visuals and photo spots for businesses to clearly express their messages. This template contains a variety of slides for the user to input data, such as structures to contrast two elements, bullet points, and slides for written information. Slidegeeks is prepared to create an impression. This slide covers metrics to evaluate effectiveness of content posted on dealers website. The purpose of this template is to provide an overview on top key performance indicators determining success of content such as user behavior, engagement, SEO outcomes, company revenue generation, etc.
Guide To Building A Successful Kpis To Measure Effectiveness Of Content On Auto Dealer Strategy SS V
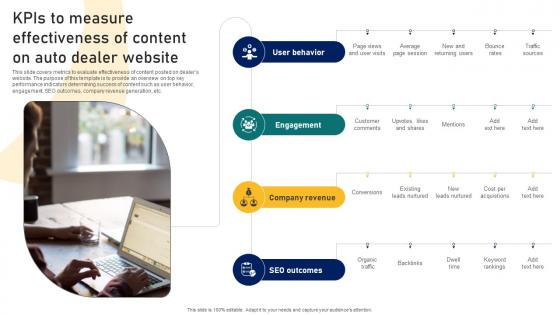
This slide covers metrics to evaluate effectiveness of content posted on dealers website. The purpose of this template is to provide an overview on top key performance indicators determining success of content such as user behavior, engagement, SEO outcomes, company revenue generation, etc. The Guide To Building A Successful Kpis To Measure Effectiveness Of Content On Auto Dealer Strategy SS V is a compilation of the most recent design trends as a series of slides. It is suitable for any subject or industry presentation, containing attractive visuals and photo spots for businesses to clearly express their messages. This template contains a variety of slides for the user to input data, such as structures to contrast two elements, bullet points, and slides for written information. Slidegeeks is prepared to create an impression. This slide covers metrics to evaluate effectiveness of content posted on dealers website. The purpose of this template is to provide an overview on top key performance indicators determining success of content such as user behavior, engagement, SEO outcomes, company revenue generation, etc.
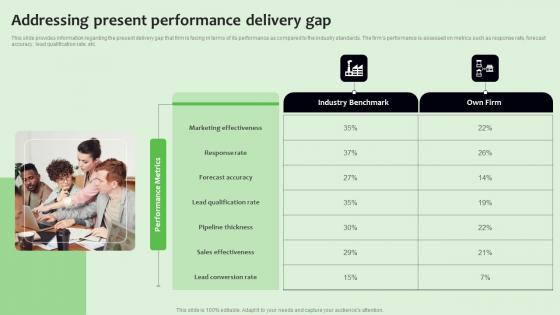
Addressing Present Performance Delivery Gap Strategies To Manage Sales Funnel Background Pdf
This slide provides information regarding the present delivery gap that firm is facing in terms of its performance as compared to the industry standards. The firms performance is assessed on metrics such as response rate, forecast accuracy, lead qualification rate, etc. Do you have to make sure that everyone on your team knows about any specific topic I yes, then you should give Addressing Present Performance Delivery Gap Strategies To Manage Sales Funnel Background Pdf a try. Our experts have put a lot of knowledge and effort into creating this impeccable Addressing Present Performance Delivery Gap Strategies To Manage Sales Funnel Background Pdf. You can use this template for your upcoming presentations, as the slides are perfect to represent even the tiniest detail. You can download these templates from the Slidegeeks website and these are easy to edit. So grab these today. This slide provides information regarding the present delivery gap that firm is facing in terms of its performance as compared to the industry standards. The firms performance is assessed on metrics such as response rate, forecast accuracy, lead qualification rate, etc.
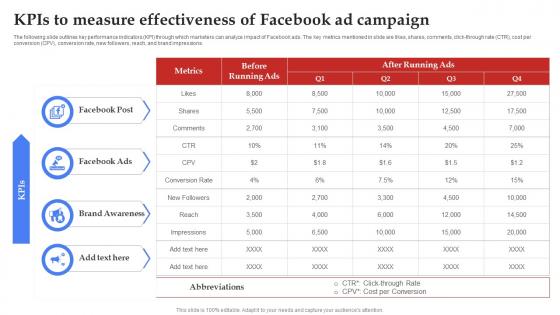
Facebook Marketing Plan Kpis To Measure Effectiveness Of Facebook Ad Strategy SS V
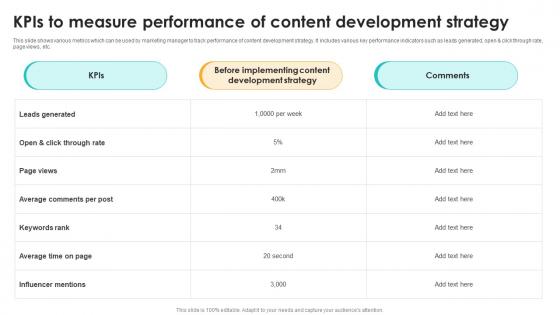
Kpis To Measure Performance Of Content Development Strategy Seo Content Plan To Drive Strategy SS V
This slide shows various metrics which can be used by marketing manager to track performance of content development strategy. It includes various key performance indicators such as leads generated, open and click through rate, page views, etc. Explore a selection of the finest Kpis To Measure Performance Of Content Development Strategy Seo Content Plan To Drive Strategy SS V here. With a plethora of professionally designed and pre-made slide templates, you can quickly and easily find the right one for your upcoming presentation. You can use our Kpis To Measure Performance Of Content Development Strategy Seo Content Plan To Drive Strategy SS V to effectively convey your message to a wider audience. Slidegeeks has done a lot of research before preparing these presentation templates. The content can be personalized and the slides are highly editable. Grab templates today from Slidegeeks. This slide shows various metrics which can be used by marketing manager to track performance of content development strategy. It includes various key performance indicators such as leads generated, open and click through rate, page views, etc.
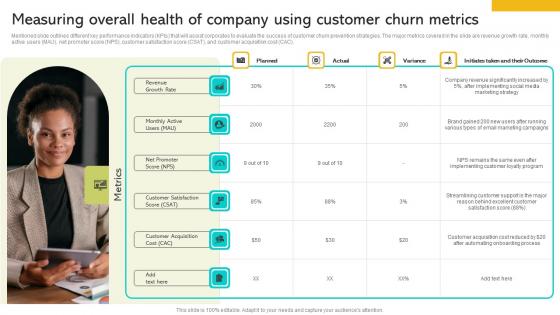
Implementing Strategies To Enhance Measuring Overall Health Of Company Using Customer Slides PDF
Mentioned slide outlines different key performance indicators KPIs that will assist corporates to evaluate the success of customer churn prevention strategies. The major metrics covered in the slide are revenue growth rate, monthly active users MAU, net promoter score NPS, customer satisfaction score CSAT, and customer acquisition cost CAC. Slidegeeks has constructed Implementing Strategies To Enhance Measuring Overall Health Of Company Using Customer Slides PDF after conducting extensive research and examination. These presentation templates are constantly being generated and modified based on user preferences and critiques from editors. Here, you will find the most attractive templates for a range of purposes while taking into account ratings and remarks from users regarding the content. This is an excellent jumping-off point to explore our content and will give new users an insight into our top-notch PowerPoint Templates. Mentioned slide outlines different key performance indicators KPIs that will assist corporates to evaluate the success of customer churn prevention strategies. The major metrics covered in the slide are revenue growth rate, monthly active users MAU, net promoter score NPS, customer satisfaction score CSAT, and customer acquisition cost CAC.
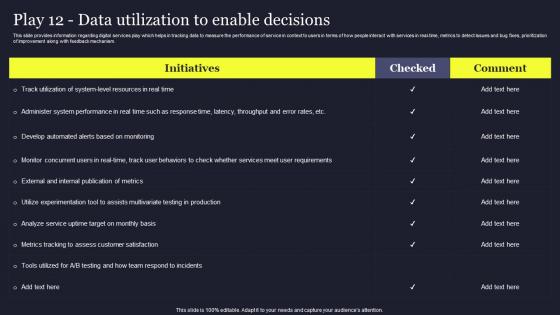
Play 12 Data Utilization To Enable Decisions Playbook For Managing Us Introduction Pdf
This slide provides information regarding digital services play which helps in tracking data to measure the performance of service in context to users in terms of how people interact with services in real-time, metrics to detect issues and bug fixes, prioritization of improvement along with feedback mechanism. The Play 12 Data Utilization To Enable Decisions Playbook For Managing Us Introduction Pdf is a compilation of the most recent design trends as a series of slides. It is suitable for any subject or industry presentation, containing attractive visuals and photo spots for businesses to clearly express their messages. This template contains a variety of slides for the user to input data, such as structures to contrast two elements, bullet points, and slides for written information. Slidegeeks is prepared to create an impression. This slide provides information regarding digital services play which helps in tracking data to measure the performance of service in context to users in terms of how people interact with services in realtime, metrics to detect issues and bug fixes, prioritization of improvement along with feedback mechanism.
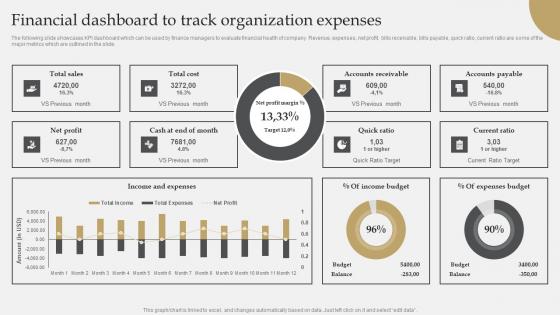
IT Industry Market Research Financial Dashboard To Track Organization Expenses Introduction Pdf
The following slide showcases KPI dashboard which can be used by finance managers to evaluate financial health of company. Revenue, expenses, net profit, bills receivable, bills payable, quick ratio, current ratio are some of the major metrics which are outlined in the slide. Present like a pro with IT Industry Market Research Financial Dashboard To Track Organization Expenses Introduction Pdf Create beautiful presentations together with your team, using our easy-to-use presentation slides. Share your ideas in real-time and make changes on the fly by downloading our templates. So whether you are in the office, on the go, or in a remote location, you can stay in sync with your team and present your ideas with confidence. With Slidegeeks presentation got a whole lot easier. Grab these presentations today. The following slide showcases KPI dashboard which can be used by finance managers to evaluate financial health of company. Revenue, expenses, net profit, bills receivable, bills payable, quick ratio, current ratio are some of the major metrics which are outlined in the slide.
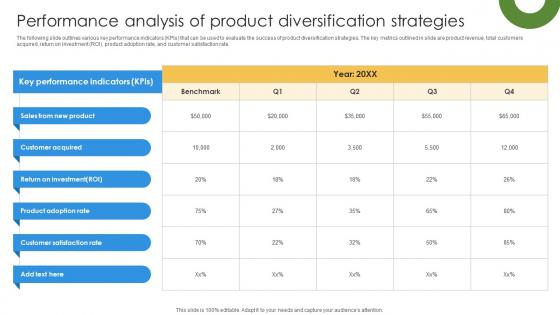
Marketing Growth Strategy To Strengthen Performance Analysis Of Product Strategy SS V
The following slide outlines various key performance indicators KPIs that can be used to evaluate the success of product diversification strategies. The key metrics outlined in slide are product revenue, total customers acquired, return on investment ROI, product adoption rate, and customer satisfaction rate. If you are looking for a format to display your unique thoughts, then the professionally designed Marketing Growth Strategy To Strengthen Performance Analysis Of Product Strategy SS V is the one for you. You can use it as a Google Slides template or a PowerPoint template. Incorporate impressive visuals, symbols, images, and other charts. Modify or reorganize the text boxes as you desire. Experiment with shade schemes and font pairings. Alter, share or cooperate with other people on your work. Download Marketing Growth Strategy To Strengthen Performance Analysis Of Product Strategy SS V and find out how to give a successful presentation. Present a perfect display to your team and make your presentation unforgettable. The following slide outlines various key performance indicators KPIs that can be used to evaluate the success of product diversification strategies. The key metrics outlined in slide are product revenue, total customers acquired, return on investment ROI, product adoption rate, and customer satisfaction rate.
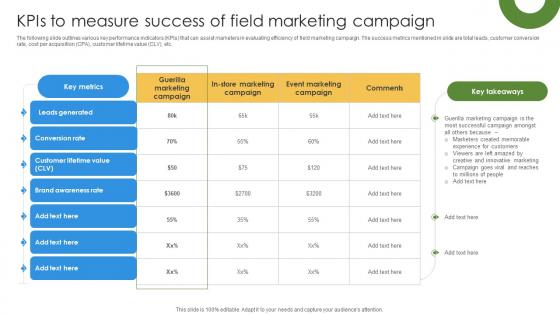
Marketing Growth Strategy Kpis To Measure Success Of Field Marketing Campaign Strategy SS V
The following slide outlines various key performance indicators KPIs that can assist marketers in evaluating efficiency of field marketing campaign. The success metrics mentioned in slide are total leads, customer conversion rate, cost per acquisition CPA, customer lifetime value CLV, etc. Welcome to our selection of the Marketing Growth Strategy Kpis To Measure Success Of Field Marketing Campaign Strategy SS V. These are designed to help you showcase your creativity and bring your sphere to life. Planning and Innovation are essential for any business that is just starting out. This collection contains the designs that you need for your everyday presentations. All of our PowerPoints are 100Percent editable, so you can customize them to suit your needs. This multi-purpose template can be used in various situations. Grab these presentation templates today. The following slide outlines various key performance indicators KPIs that can assist marketers in evaluating efficiency of field marketing campaign. The success metrics mentioned in slide are total leads, customer conversion rate, cost per acquisition CPA, customer lifetime value CLV, etc.
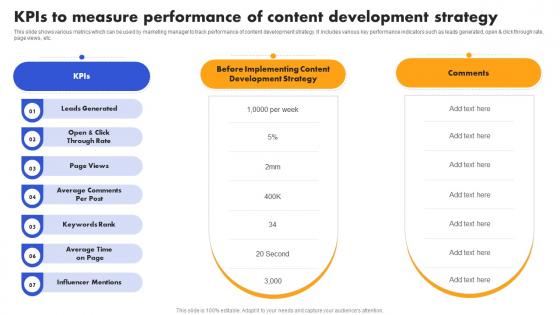
SEO Strategy To Improve ROI Kpis To Measure Performance Of Content Strategy SS V
This slide shows various metrics which can be used by marketing manager to track performance of content development strategy. It includes various key performance indicators such as leads generated, open and click through rate, page views, etc. Explore a selection of the finest SEO Strategy To Improve ROI Kpis To Measure Performance Of Content Strategy SS V here. With a plethora of professionally designed and pre-made slide templates, you can quickly and easily find the right one for your upcoming presentation. You can use our SEO Strategy To Improve ROI Kpis To Measure Performance Of Content Strategy SS V to effectively convey your message to a wider audience. Slidegeeks has done a lot of research before preparing these presentation templates. The content can be personalized and the slides are highly editable. Grab templates today from Slidegeeks. This slide shows various metrics which can be used by marketing manager to track performance of content development strategy. It includes various key performance indicators such as leads generated, open and click through rate, page views, etc.
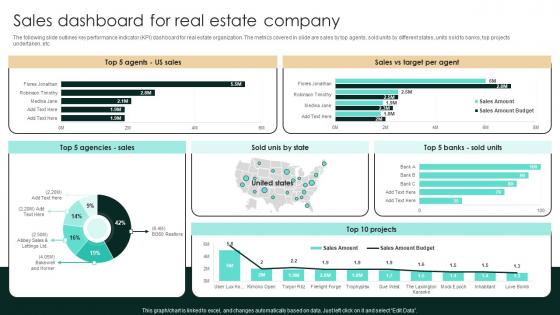
Sales Dashboard For Real Estate Company Strategic Real Estate Introduction Pdf
The following slide outlines key performance indicator KPI dashboard for real estate organization. The metrics covered in slide are sales by top agents, sold units by different states, units sold to banks, top projects undertaken, etc. If you are looking for a format to display your unique thoughts, then the professionally designed Sales Dashboard For Real Estate Company Strategic Real Estate Introduction Pdf is the one for you. You can use it as a Google Slides template or a PowerPoint template. Incorporate impressive visuals, symbols, images, and other charts. Modify or reorganize the text boxes as you desire. Experiment with shade schemes and font pairings. Alter, share or cooperate with other people on your work. Download Sales Dashboard For Real Estate Company Strategic Real Estate Introduction Pdf and find out how to give a successful presentation. Present a perfect display to your team and make your presentation unforgettable. The following slide outlines key performance indicator KPI dashboard for real estate organization. The metrics covered in slide are sales by top agents, sold units by different states, units sold to banks, top projects undertaken, etc.
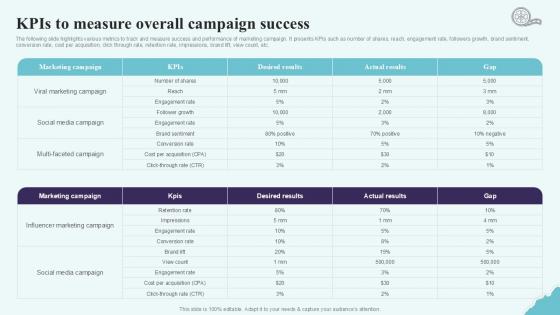
Kpis To Measure Overall Campaign Success Strategic Plan To Increase Film Ppt Powerpoint Strategy SS V
The following slide highlights various metrics to track and measure success and performance of marketing campaign. It presents KPIs such as number of shares, reach, engagement rate, followers growth, brand sentiment, conversion rate, cost per acquisition, click through rate, retention rate, impressions, brand lift, view count, etc. Are you searching for a Kpis To Measure Overall Campaign Success Strategic Plan To Increase Film Ppt Powerpoint Strategy SS V that is uncluttered, straightforward, and original Its easy to edit, and you can change the colors to suit your personal or business branding. For a presentation that expresses how much effort you have put in, this template is ideal With all of its features, including tables, diagrams, statistics, and lists, its perfect for a business plan presentation. Make your ideas more appealing with these professional slides. Download Kpis To Measure Overall Campaign Success Strategic Plan To Increase Film Ppt Powerpoint Strategy SS V from Slidegeeks today. The following slide highlights various metrics to track and measure success and performance of marketing campaign. It presents KPIs such as number of shares, reach, engagement rate, followers growth, brand sentiment, conversion rate, cost per acquisition, click through rate, retention rate, impressions, brand lift, view count, etc.
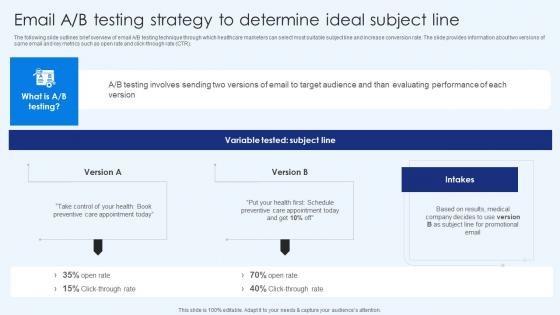
Email A B Testing Strategy To Determine Ideal Healthcare Promotion Portrait Pdf
The following slide outlines brief overview of email A B testing technique through which healthcare marketers can select most suitable subject line and increase conversion rate. The slide provides information about two versions of same email and key metrics such as open rate and click-through rate CTR. Slidegeeks is here to make your presentations a breeze with Email A B Testing Strategy To Determine Ideal Healthcare Promotion Portrait Pdf With our easy-to-use and customizable templates, you can focus on delivering your ideas rather than worrying about formatting. With a variety of designs to choose from, you are sure to find one that suits your needs. And with animations and unique photos, illustrations, and fonts, you can make your presentation pop. So whether you are giving a sales pitch or presenting to the board, make sure to check out Slidegeeks first The following slide outlines brief overview of email A B testing technique through which healthcare marketers can select most suitable subject line and increase conversion rate. The slide provides information about two versions of same email and key metrics such as open rate and click-through rate CTR.
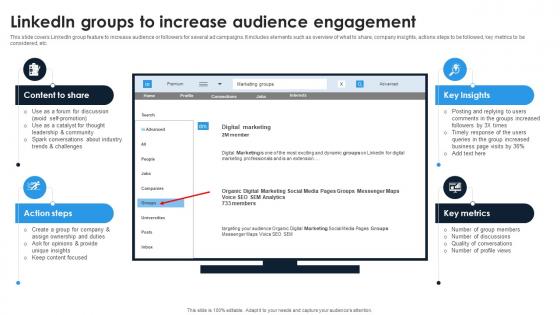
Linkedin Content Strategies Linkedin Groups To Increase Audience Engagement MKT SS V
This slide covers LinkedIn group feature to increase audience or followers for several ad campaigns. It includes elements such as overview of what to share, company insights, actions steps to be followed, key metrics to be considered, etc. Formulating a presentation can take up a lot of effort and time, so the content and message should always be the primary focus. The visuals of the PowerPoint can enhance the presenters message, so our Linkedin Content Strategies Linkedin Groups To Increase Audience Engagement MKT SS V was created to help save time. Instead of worrying about the design, the presenter can concentrate on the message while our designers work on creating the ideal templates for whatever situation is needed. Slidegeeks has experts for everything from amazing designs to valuable content, we have put everything into Linkedin Content Strategies Linkedin Groups To Increase Audience Engagement MKT SS V. This slide covers LinkedIn group feature to increase audience or followers for several ad campaigns. It includes elements such as overview of what to share, company insights, actions steps to be followed, key metrics to be considered, etc.
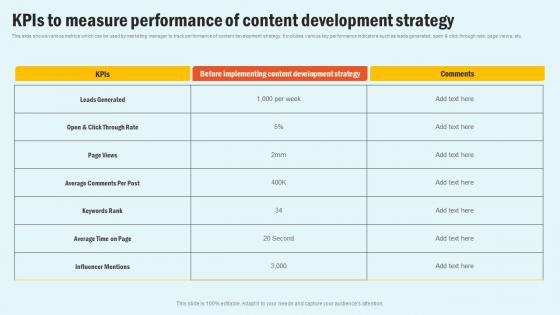
KPIs To Measure Performance Of Enhancing Website Performance With Search Engine Content Elements Pdf
This slide shows various metrics which can be used by marketing manager to track performance of content development strategy. It includes various key performance indicators such as leads generated, open and click through rate, page views, etc. Explore a selection of the finest KPIs To Measure Performance Of Enhancing Website Performance With Search Engine Content Elements Pdf here. With a plethora of professionally designed and pre made slide templates, you can quickly and easily find the right one for your upcoming presentation. You can use our KPIs To Measure Performance Of Enhancing Website Performance With Search Engine Content Elements Pdf to effectively convey your message to a wider audience. Slidegeeks has done a lot of research before preparing these presentation templates. The content can be personalized and the slides are highly editable. Grab templates today from Slidegeeks. This slide shows various metrics which can be used by marketing manager to track performance of content development strategy. It includes various key performance indicators such as leads generated, open and click through rate, page views, etc.
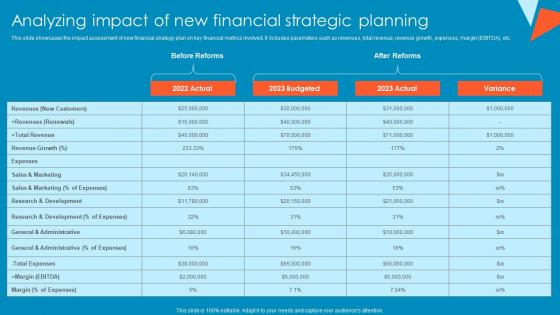
Analyzing Impact Of New Financial Strategic Planning Tactical Financial Governance Diagrams Pdf
This slide showcases the impact assessment of new financial strategy plan on key financial metrics involved. It includes parameters such as revenues, total revenue, revenue growth, expenses, margin EBITDA, etc.If you are looking for a format to display your unique thoughts, then the professionally designed Analyzing Impact Of New Financial Strategic Planning Tactical Financial Governance Diagrams Pdf is the one for you. You can use it as a Google Slides template or a PowerPoint template. Incorporate impressive visuals, symbols, images, and other charts. Modify or reorganize the text boxes as you desire. Experiment with shade schemes and font pairings. Alter, share or cooperate with other people on your work. Download Analyzing Impact Of New Financial Strategic Planning Tactical Financial Governance Diagrams Pdf and find out how to give a successful presentation. Present a perfect display to your team and make your presentation unforgettable. This slide showcases the impact assessment of new financial strategy plan on key financial metrics involved. It includes parameters such as revenues, total revenue, revenue growth, expenses, margin EBITDA, etc.
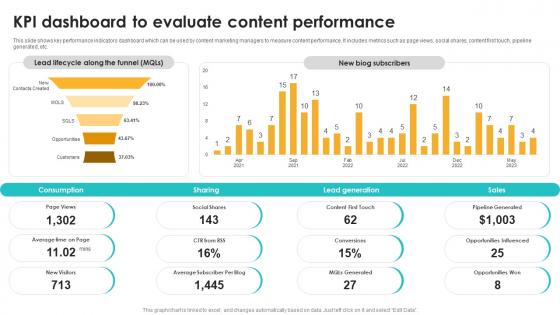
Kpi Dashboard To Evaluate Content Performance Seo Content Plan To Drive Strategy SS V
This slide shows key performance indicators dashboard which can be used by content marketing managers to measure content performance. It includes metrics such as page views, social shares, content first touch, pipeline generated, etc. This Kpi Dashboard To Evaluate Content Performance Seo Content Plan To Drive Strategy SS V is perfect for any presentation, be it in front of clients or colleagues. It is a versatile and stylish solution for organizing your meetings. The Kpi Dashboard To Evaluate Content Performance Seo Content Plan To Drive Strategy SS V features a modern design for your presentation meetings. The adjustable and customizable slides provide unlimited possibilities for acing up your presentation. Slidegeeks has done all the homework before launching the product for you. So, do not wait, grab the presentation templates today This slide shows key performance indicators dashboard which can be used by content marketing managers to measure content performance. It includes metrics such as page views, social shares, content first touch, pipeline generated, etc.
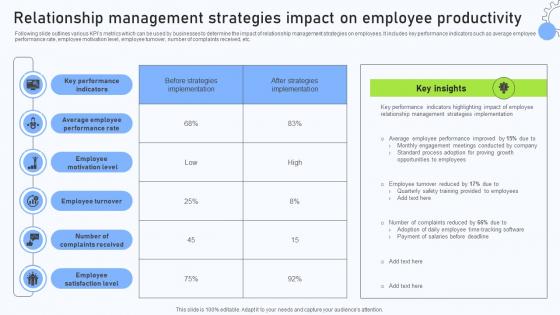
Relationship Management Strategies Impact On Employee Productivity
Following slide outlines various KPIs metrics which can be used by businesses to determine the impact of relationship management strategies on employees. It includes key performance indicators such as average employee performance rate, employee motivation level, employee turnover, number of complaints received, etc. If you are looking for a format to display your unique thoughts, then the professionally designed Relationship Management Strategies Impact On Employee Productivity is the one for you. You can use it as a Google Slides template or a PowerPoint template. Incorporate impressive visuals, symbols, images, and other charts. Modify or reorganize the text boxes as you desire. Experiment with shade schemes and font pairings. Alter, share or cooperate with other people on your work. Download Relationship Management Strategies Impact On Employee Productivity and find out how to give a successful presentation. Present a perfect display to your team and make your presentation unforgettable. Following slide outlines various KPIs metrics which can be used by businesses to determine the impact of relationship management strategies on employees. It includes key performance indicators such as average employee performance rate, employee motivation level, employee turnover, number of complaints received, etc.
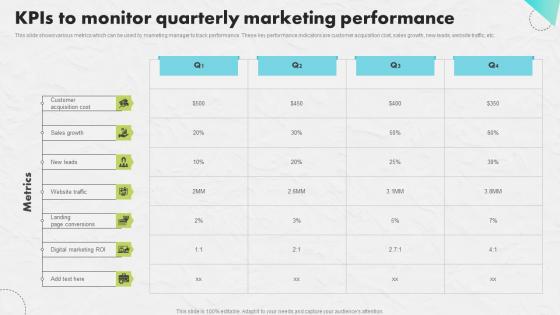
KPIs To Monitor Quarterly Developing An Impactful SEO Marketing Plan Demonstration Pdf
This slide shows various metrics which can be used by marketing manager to track performance. These key performance indicators are customer acquisition cost, sales growth, new leads, website traffic, etc. If you are looking for a format to display your unique thoughts, then the professionally designed KPIs To Monitor Quarterly Developing An Impactful SEO Marketing Plan Demonstration Pdf is the one for you. You can use it as a Google Slides template or a PowerPoint template. Incorporate impressive visuals, symbols, images, and other charts. Modify or reorganize the text boxes as you desire. Experiment with shade schemes and font pairings. Alter, share or cooperate with other people on your work. Download KPIs To Monitor Quarterly Developing An Impactful SEO Marketing Plan Demonstration Pdf and find out how to give a successful presentation. Present a perfect display to your team and make your presentation unforgettable. This slide shows various metrics which can be used by marketing manager to track performance. These key performance indicators are customer acquisition cost, sales growth, new leads, website traffic, etc.
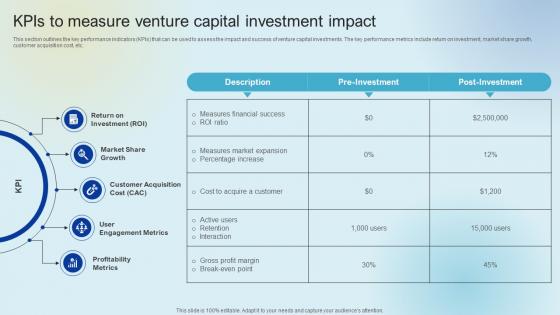
KPIs To Measure Venture Capital Investment Raising Venture Capital A Holistic Approach Fin SS V
This section outlines the key performance indicators KPIs that can be used to assess the impact and success of venture capital investments. The key performance metrics include return on investment, market share growth, customer acquisition cost, etc. This modern and well-arranged KPIs To Measure Venture Capital Investment Raising Venture Capital A Holistic Approach Fin SS V provides lots of creative possibilities. It is very simple to customize and edit with the Powerpoint Software. Just drag and drop your pictures into the shapes. All facets of this template can be edited with Powerpoint, no extra software is necessary. Add your own material, put your images in the places assigned for them, adjust the colors, and then you can show your slides to the world, with an animated slide included. This section outlines the key performance indicators KPIs that can be used to assess the impact and success of venture capital investments. The key performance metrics include return on investment, market share growth, customer acquisition cost, etc.
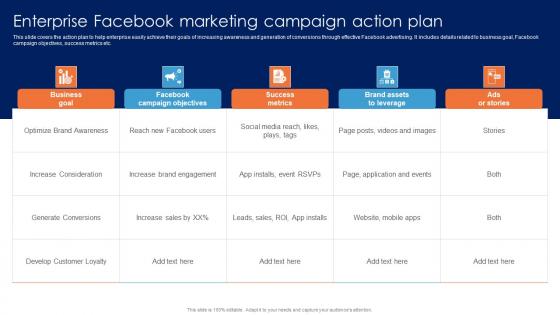
Enterprise Facebook Marketing Campaign Guide For Data Driven Advertising Introduction Pdf
This slide covers the action plan to help enterprise easily achieve their goals of increasing awareness and generation of conversions through effective Facebook advertising. It includes details related to business goal, Facebook campaign objectives, success metrics etc.This Enterprise Facebook Marketing Campaign Guide For Data Driven Advertising Introduction Pdf from Slidegeeks makes it easy to present information on your topic with precision. It provides customization options, so you can make changes to the colors, design, graphics, or any other component to create a unique layout. It is also available for immediate download, so you can begin using it right away. Slidegeeks has done good research to ensure that you have everything you need to make your presentation stand out. Make a name out there for a brilliant performance. This slide covers the action plan to help enterprise easily achieve their goals of increasing awareness and generation of conversions through effective Facebook advertising. It includes details related to business goal, Facebook campaign objectives, success metrics etc.
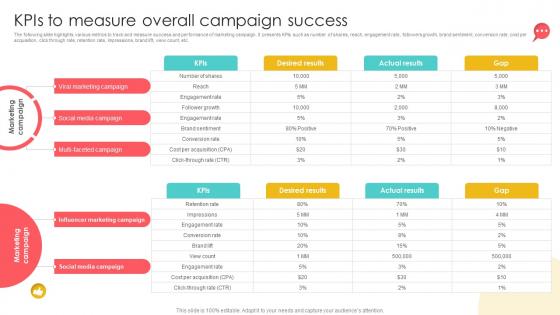
Marketing Channels For Movie Kpis To Measure Overall Campaign Success Strategy SS V
The following slide highlights various metrics to track and measure success and performance of marketing campaign. It presents KPIs such as number of shares, reach, engagement rate, followers growth, brand sentiment, conversion rate, cost per acquisition, click through rate, retention rate, impressions, brand lift, view count, etc. Are you searching for a Marketing Channels For Movie Kpis To Measure Overall Campaign Success Strategy SS V that is uncluttered, straightforward, and original Its easy to edit, and you can change the colors to suit your personal or business branding. For a presentation that expresses how much effort you have put in, this template is ideal With all of its features, including tables, diagrams, statistics, and lists, its perfect for a business plan presentation. Make your ideas more appealing with these professional slides. Download Marketing Channels For Movie Kpis To Measure Overall Campaign Success Strategy SS V from Slidegeeks today. The following slide highlights various metrics to track and measure success and performance of marketing campaign. It presents KPIs such as number of shares, reach, engagement rate, followers growth, brand sentiment, conversion rate, cost per acquisition, click through rate, retention rate, impressions, brand lift, view count, etc.
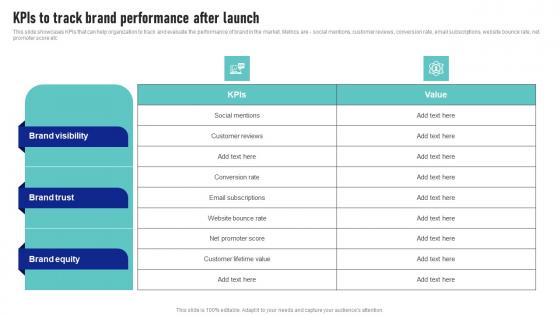
Kpis To Track Brand Performance After Launch Launching New Product Brand Brochure Pdf
This slide showcases KPIs that can help organization to track and evaluate the performance of brand in the market. Metrics are social mentions, customer reviews, conversion rate, email subscriptions, website bounce rate, net promoter score etc Are you searching for a Kpis To Track Brand Performance After Launch Launching New Product Brand Brochure Pdf that is uncluttered, straightforward, and original It is easy to edit, and you can change the colors to suit your personal or business branding. For a presentation that expresses how much effort you have put in, this template is ideal With all of its features, including tables, diagrams, statistics, and lists, it is perfect for a business plan presentation. Make your ideas more appealing with these professional slides. Download Kpis To Track Brand Performance After Launch Launching New Product Brand Brochure Pdf from Slidegeeks today. This slide showcases KPIs that can help organization to track and evaluate the performance of brand in the market. Metrics are social mentions, customer reviews, conversion rate, email subscriptions, website bounce rate, net promoter score etc


 Continue with Email

 Home
Home


