Feature Compare
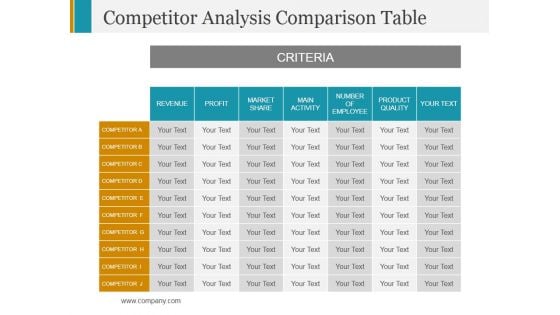
Competitor Analysis Comparison Table Ppt PowerPoint Presentation Infographics Design Inspiration
This is a competitor analysis comparison table ppt powerpoint presentation infographics design inspiration. This is a seven stage process. The stages in this process are revenue, profit, market share, main activity.
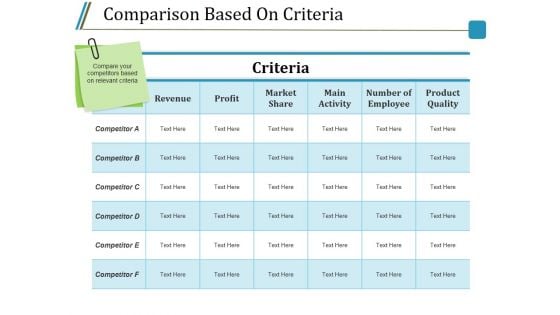
Comparison Based On Criteria Ppt PowerPoint Presentation Outline Pictures
This is a comparison based on criteria ppt powerpoint presentation outline pictures. This is a six stage process. The stages in this process are revenue, profit, market share, main activity, number of employee.
Comparison Based On Criteria Ppt PowerPoint Presentation Icon Example Introduction
This is a comparison based on criteria ppt powerpoint presentation icon example introduction. This is a six stage process. The stages in this process are criteria, revenue, profit, market share, main activity.
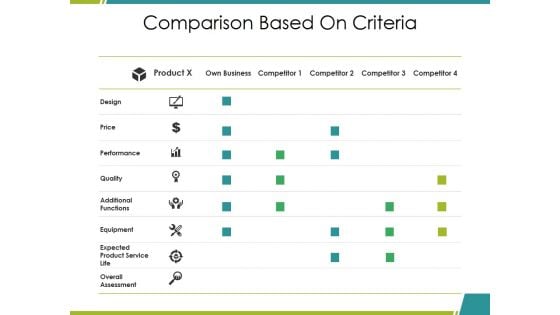
Comparison Based On Criteria Ppt PowerPoint Presentation Infographics Elements
This is a comparison based on criteria ppt powerpoint presentation infographics elements. This is a four stage process. The stages in this process are design, price, performance, product, competitor.
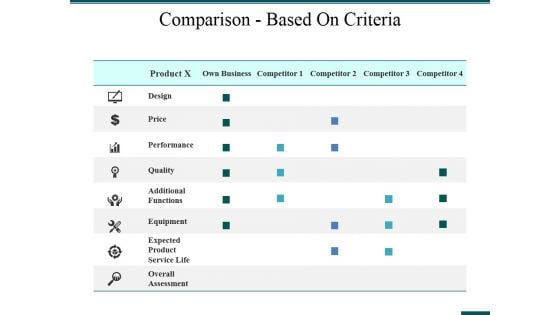
Comparison Based On Criteria Ppt PowerPoint Presentation Inspiration Graphic Tips
This is a comparison based on criteria ppt powerpoint presentation inspiration graphic tips. This is afour stage process. The stages in this process are design, price, quality, additional functions, equipment.
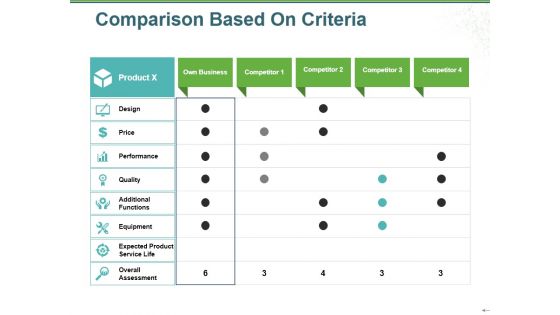
Comparison Based On Criteria Ppt PowerPoint Presentation Summary Good
This is a comparison based on criteria ppt powerpoint presentation summary good. This is a four stage process. The stages in this process are product, design, price, performance, quality.
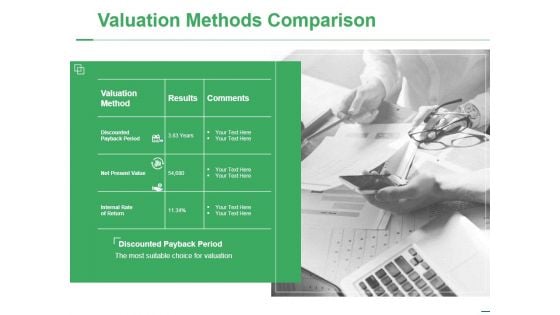
Valuation Methods Comparison Ppt PowerPoint Presentation Inspiration Background Images
This is a valuation methods comparison ppt powerpoint presentation inspiration background images. This is a two stage process. The stages in this process are valuation method, results, comments, internal rate of return, net present value.
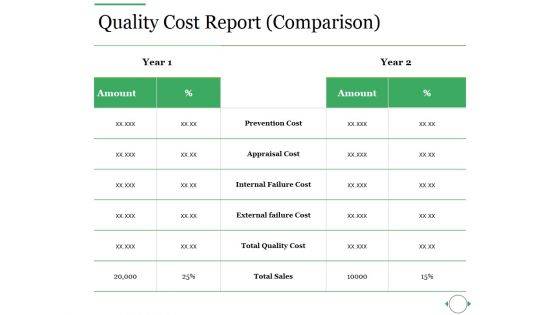
Quality Cost Report Comparison Ppt PowerPoint Presentation Ideas Slides
This is a quality cost report comparison ppt powerpoint presentation ideas slides. This is a two stage process. The stages in this process are prevention cost, appraisal cost, internal failure cost, external failure cost, total quality cost.
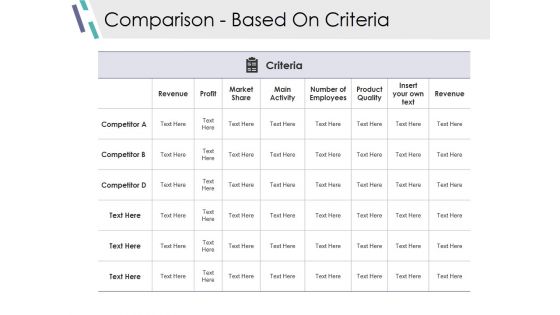
Comparison Based On Criteria Ppt PowerPoint Presentation Show Outline
This is a comparison based on criteria ppt powerpoint presentation show outline. This is a six stage process. The stages in this process are revenue, profit, market share, main activity, number of employees.

Comparison Based On Criteria Ppt PowerPoint Presentation Show Graphics Pictures
This is a comparison based on criteria ppt powerpoint presentation show graphics pictures. This is a seven stage process. The stages in this process are competitor, revenue, profit, market share, main activity.
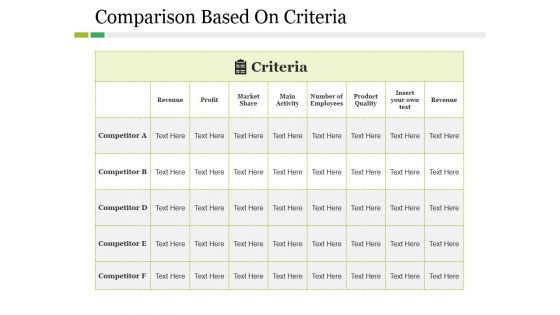
Comparison Based On Criteria Ppt PowerPoint Presentation Styles Picture
This is a comparison based on criteria ppt powerpoint presentation styles picture. This is a five stage process. The stages in this process are competitor, revenue, profit, criteria, market share.
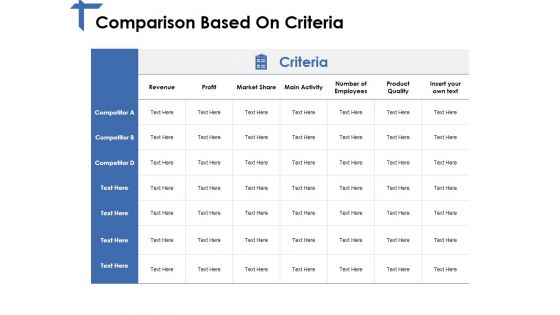
Comparison Based On Criteria Ppt PowerPoint Presentation Model Layouts
This is a comparison based on criteria ppt powerpoint presentation model layouts. This is a seven stage process. The stages in this process are revenue, profit, market share, main activity, product quality.
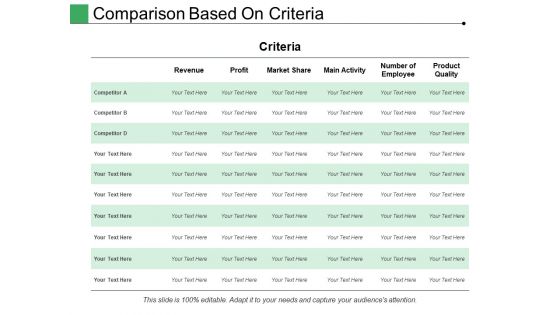
Comparison Based On Criteria Ppt PowerPoint Presentation Gallery Information
This is a comparison based on criteria ppt powerpoint presentation gallery information. This is a six stage process. The stages in this process are criteria, revenue, profit, business, competitor.
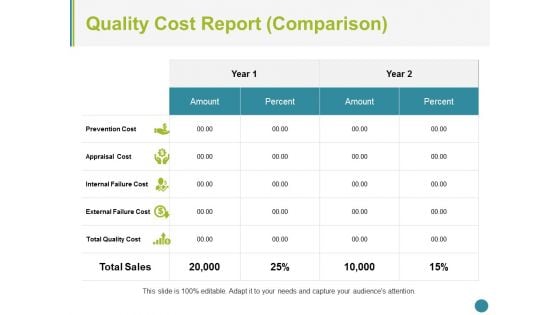
Quality Cost Report Comparison Ppt PowerPoint Presentation Summary Portfolio
This is a quality cost report comparison ppt powerpoint presentation summary portfolio. This is a two stage process. The stages in this process are prevention cost, appraisal cost, internal failure cost, external failure cost, total quality cost.
Comparison Sample Budget Ppt Ppt PowerPoint Presentation Gallery Icon
This is a comparison sample budget ppt ppt powerpoint presentation gallery icon. This is a two stage process. The stages in this process are business, management, strategy, analysis, icons.
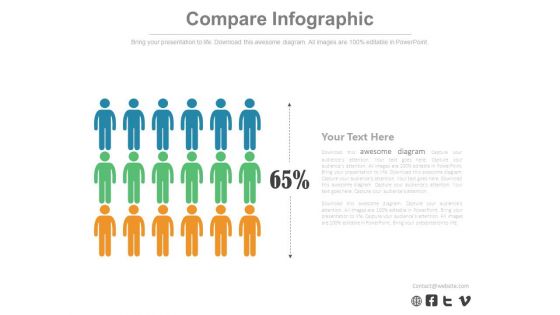
Three Teams Skill Analysis Comparison Chart Powerpoint Slides
Create visually stunning and define your PPT presentations in a unique and inspiring manner using our above template. It contains graphics of comparison chart. This business slide helps to display teams skill analysis. Deliver amazing presentations to mesmerize your audience by using this PPT slide design.
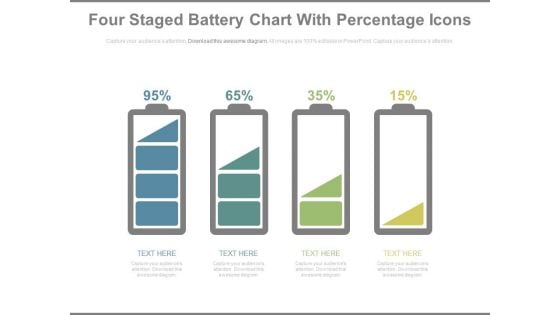
Battery Chart With Percentage Values For Comparison PowerPoint Slides
This year?s sales has matched up with your expectations. Now match this slide with your presentation to show the same. Show your company?s performance or business growth with this four staged battery chart PowerPoint template. With this slide, you can easily convince your colleagues how your company gave a tremendous growth over the years or months. Perfect illustration to show that the targets are achieved. This PPT template is easy to edit. You can choose the color of your choice. Your colleagues are already impressed with the sales growth. Now impress others and choose this PPT innovative designed template.
Green Left And Red Right Arrows For Comparison Powerpoint Slides
This professional slide contains graphics of green left and red right arrows. You may use this PowerPoint template to display opposite directions. Add this PPT slide to your presentation and impress your superiors.
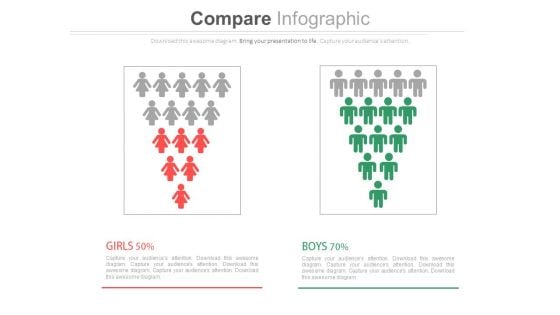
Male Female Gender Ratio Analysis Comparison Chart Powerpoint Slides
This PowerPoint template has been designed with graphics of male and female icons. Download this PPT slide to depict gender ratio analysis. Grab the attention of your team with this eye catching template.

Comparison Chart For Value Stream Mapping Before And After Slide Ppt Example
This is a comparison chart for value stream mapping before and after slide ppt example. This is a two stage process. The stages in this process are pollen.

Two Segments Layout For Analytics Software Comparison Ppt PowerPoint Presentation Portfolio Graphics Pictures PDF
Presenting two segments layout for analytics software comparison ppt powerpoint presentation portfolio graphics pictures pdf to dispense important information. This template comprises two stages. It also presents valuable insights into the topics including two segments layout for analytics software comparison. This is a completely customizable PowerPoint theme that can be put to use immediately. So, download it and address the topic impactfully.
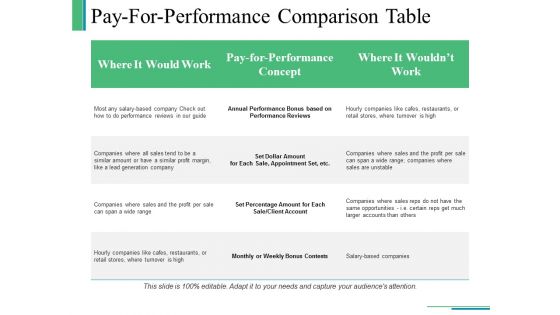
Pay For Performance Comparison Table Ppt PowerPoint Presentation Outline Design Templates
This is a pay for performance comparison table ppt powerpoint presentation outline design templates. This is a three stage process. The stages in this process are business, management, table, planning, strategy.
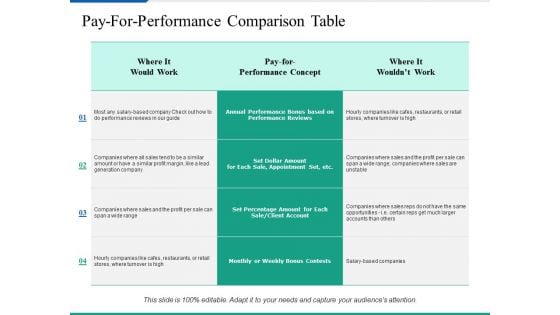
Pay For Performance Comparison Table Ppt PowerPoint Presentation Inspiration Layout Ideas
This is a pay for performance comparison table ppt powerpoint presentation inspiration layout ideas. This is a four stage process. The stages in this process are table, management, business, marketing.
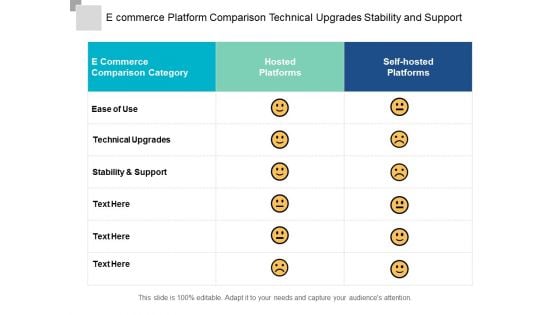
E Commerce Platform Comparison Technical Upgrades Stability And Support Ppt Powerpoint Presentation Layouts
This is a e commerce platform comparison technical upgrades stability and support ppt powerpoint presentation layouts. This is a three stage process. The stages in this process are ecommerce, mercantilism, commercialism.
Product Sales Distribution And Velocity Comparison Ppt PowerPoint Presentation Icon Outline
This is a product sales distribution and velocity comparison ppt powerpoint presentation icon outline. This is a six stage process. The stages in this process are product distribution, distribution system, numeric distribution.
Twitter Google Plus Facebook Social Media Powerpoint Slides
This professional slide contains graphics of Twitter, Google plus and Face book social media logos. You may use this chart for comparison of social media sites. Add this slide to your presentation and impress your superiors.
Business Competitors Analysis Table Ppt Powerpoint Presentation Icon Brochure
This is a business competitors analysis table ppt powerpoint presentation icon brochure. This is a six stage process. The stages in this process are comparison chart, comparison table, comparison matrix.
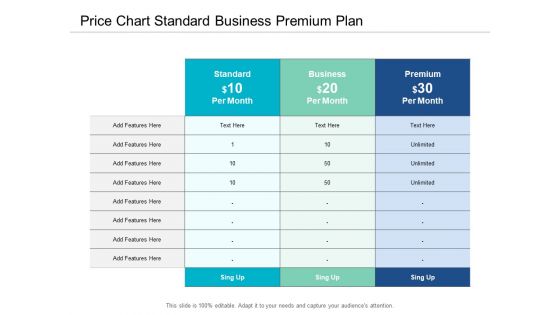
Price Chart Standard Business Premium Plan Ppt Powerpoint Presentation Visual Aids Infographic Template
This is a price chart standard business premium plan ppt powerpoint presentation visual aids infographic template. This is a three stage process. The stages in this process are comparison chart, comparison table, comparison matrix.

Comparison Between Secure Web Gateway And Firewalls Web Access Control Solution
This slide demonstrates the concept of two security technologies named firewalls and Secure Web Gateways. The purpose of this slide is to compare firewalls and SWGs on the basis of various factors such as function, scope, granularity, features and deployment. Are you in need of a template that can accommodate all of your creative concepts This one is crafted professionally and can be altered to fit any style. Use it with Google Slides or PowerPoint. Include striking photographs, symbols, depictions, and other visuals. Fill, move around, or remove text boxes as desired. Test out color palettes and font mixtures. Edit and save your work, or work with colleagues. Download Web Access Control Solution Comparison Between Secure Web Gateway And Firewalls and observe how to make your presentation outstanding. Give an impeccable presentation to your group and make your presentation unforgettable. This slide demonstrates the concept of two security technologies named firewalls and Secure Web Gateways. The purpose of this slide is to compare firewalls and SWGs on the basis of various factors such as function, scope, granularity, features and deployment. Are you in need of a template that can accommodate all of your creative concepts This one is crafted professionally and can be altered to fit any style. Use it with Google Slides or PowerPoint. Include striking photographs, symbols, depictions, and other visuals. Fill, move around, or remove text boxes as desired. Test out color palettes and font mixtures. Edit and save your work, or work with colleagues. Download Web Access Control Solution Comparison Between Secure Web Gateway And Firewalls and observe how to make your presentation outstanding. Give an impeccable presentation to your group and make your presentation unforgettable.
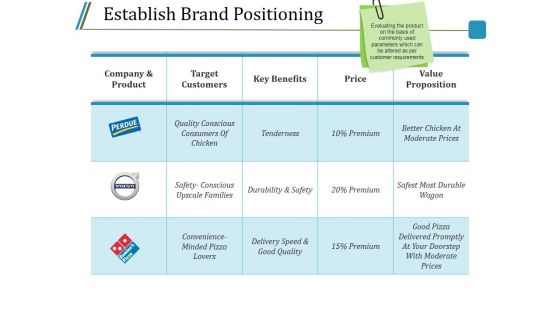
Establish Brand Positioning Ppt PowerPoint Presentation Styles Pictures
This is a establish brand positioning ppt powerpoint presentation styles pictures. This is a three stage process. The stages in this process are company and product, target customers, key benefits, price, value proposition.
Establish Brand Positioning Ppt PowerPoint Presentation Icon Background Designs
This is a establish brand positioning ppt powerpoint presentation icon background designs. This is a three stage process. The stages in this process are key benefits, price, value proposition, company and product, target customers.
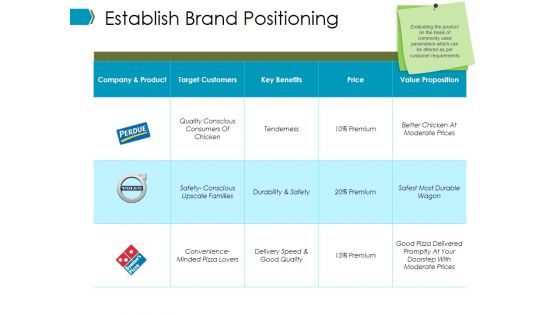
Establish Brand Positioning Ppt PowerPoint Presentation Infographics Brochure
This is a establish brand positioning ppt powerpoint presentation infographics brochure. This is a four stage process. The stages in this process are company and product, target customers, key benefits, price, value proposition.
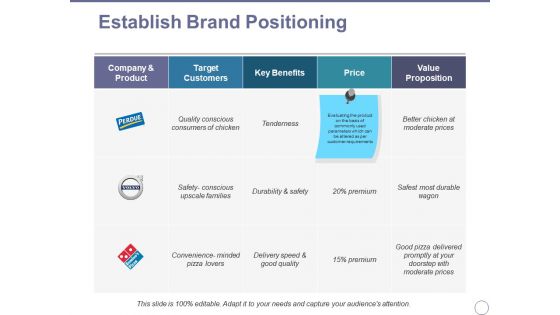
Establish Brand Positioning Ppt PowerPoint Presentation Show Infographic Template
This is a establish brand positioning ppt powerpoint presentation show infographic template. This is a four stage process. The stages in this process are target customers, key benefits, price, value proposition, company and product.
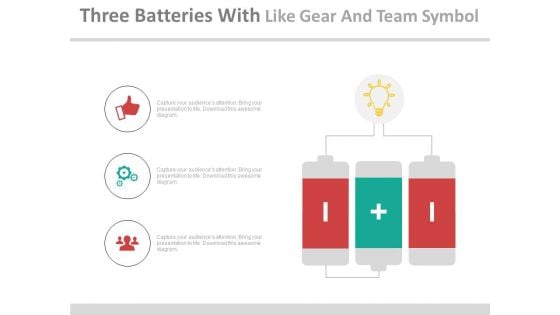
Three Batteries With Positive Negative Signs Powerpoint Slides
This PPT slide displays graphics of three batteries with positive and negative signs. Use this PPT design for visual display of comparison process. This PowerPoint template can be customized as per requirements of business education or any other theme.

Three Batteries As Growth Steps Powerpoint Slides
This PowerPoint template has been designed with graphics of three batteries. Download this PPT slide for data comparisons or it may be used to display growth steps. Add this slide to your presentation and impress your superiors.
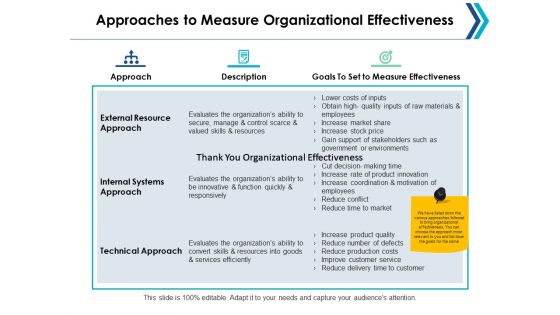
Approaches To Measure Organizational Effectiveness Ppt Powerpoint Presentation Model Show
This is a approaches to measure organizational effectiveness ppt powerpoint presentation model show. This is a three stage process. The stages in this process are comparison, male, female, marketing, strategy.
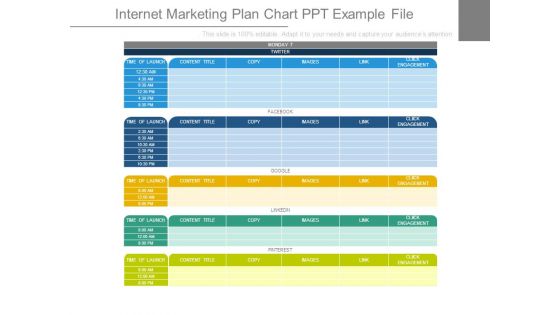
Internet Marketing Plan Chart Ppt Example File
This is a internet marketing plan chart ppt example file. This is a five stage process. The stages in this process are monday, twitter, time of launch, content title, copy, images, link, click engagement, face book, google, linkedin, pinterest.
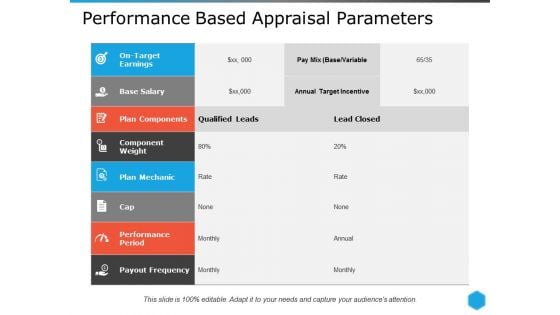
Performance Based Appraisal Parameters Ppt PowerPoint Presentation File Deck
This is a performance based appraisal parameters ppt powerpoint presentation file deck. This is a two stage process. The stages in this process are on target earnings, base salary, plan components, component weight, plan mechanic, performance period.
Sales Team Compensation Plan Ppt PowerPoint Presentation Icon Rules
This is a sales team compensation plan ppt powerpoint presentation pictures slide download. This is a three stage process. The stages in this process are pay mix, plan type, design component, direct sales manager.
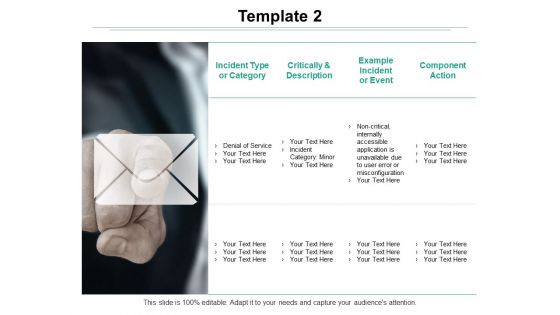
Template 2 Ppt PowerPoint Presentation Slides Format
This is a template 2 ppt powerpoint presentation slides format. This is a two stage process. The stages in this process are example incident or event, component action, table.

Table Of Contents Ppt PowerPoint Presentation Professional Background Designs
This is a table of contents ppt powerpoint presentation professional background designs. This is a two stage process. The stages in this process are business operations summary, operational highlights, milestones achieved, company objectives, operational challenges.
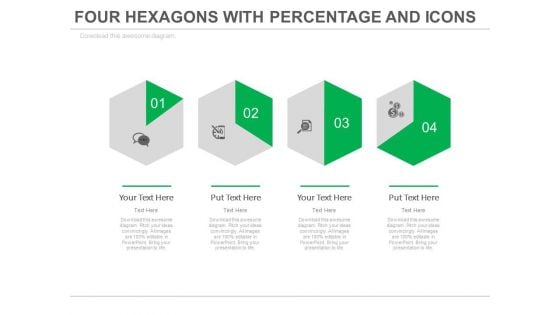
Four Steps Of Financial Growth Analysis Powerpoint Slides
This PowerPoint template with multiple Hexagons can be creatively used to present a timeline in a visual manner. This slide can also help the audience understand a 6 step process in an easier manner. The icons are totally customizable and can be edited to represent the particular process happening at that stage. It can also be used to represent different times or different activities to be carried out at different times in in a day in an office or an organization (e.g. - Medicine schedule) since the hexagon represents a clock and change of shade moves in a clockwise manner. The diagram can be used to represent a comparison or a report or an analysis of the data.
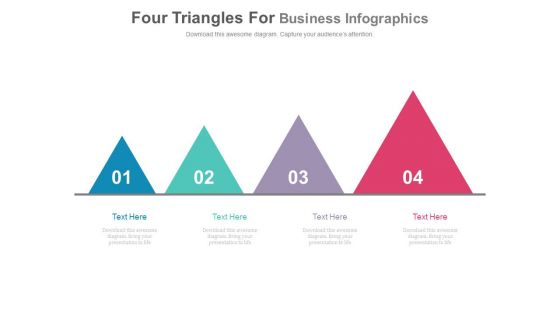
Four Triangles In Progressive Order Powerpoint Slides
The multicolored triangles in this slide can be used for various purposes. The differently sized triangles can be used by a company or an organization to present their growth over the years. The triangles can also be used to portray a comparison between different products or services being offered by a business and the increasing size can portray the added advantages of opting for the next package. The numbers inside the triangles can be used to demonstrate progressive steps involved in a process or a procedure. It can also be used to depict ways to get closer or to achieve a target. The triangles can effectively represent the departments as per their workload or importance.
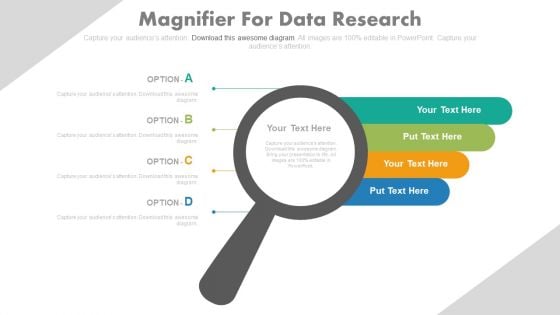
Magnifier With Four Options Tags Powerpoint Slides
The Magnifying glass used in this PowerPoint template can be used for various purposes. This slide can be the perfect answer to business or organizations dealing with investigation or rendering their services as a private detective or other investigation services. The slide can be effectively used to send across a message about verification or double checking of any kind of information. It can be used to imply in depth analysis of a report or minute details about meetings. The colorful tags can further be used to present the results or comparisons between available options or variants of products or services. The slide is customizable and icons and colors can be changed as per needs and convenience.
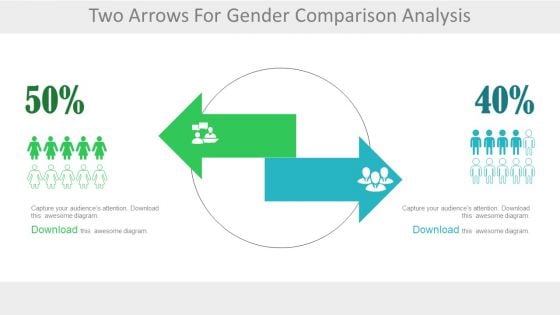
Two Arrows For Male Female Ratio Analysis Powerpoint Slides
Use this professionally created PowerPoint template to create the perfect slide to educate your audience about comparisons between choices and opinions of different genders. The slide can be used to denote the sex ratio or the changes occurring in the same. The 2 colored arrows can be used to refer to the 2 genders or even 2 teams or groups. This slide can be effectively used in corporate or business presentations to demonstrate the conversion of probable customers to sale. Other concepts like brain drain or brand preference or people making different choices can also be demonstrated using this template. A human resource manager can use this slide to demonstrate the transfer of employees to other locations or companies.
Work Space Authentication Process Flow Of Verification Factors Icons PDF
Pitch your topic with ease and precision using this work space authentication process flow of verification factors icons pdf. This layout presents information on rust relationship, authentication, corporate data center. It is also available for immediate download and adjustment. So, changes can be made in the color, design, graphics or any other component to create a unique layout.
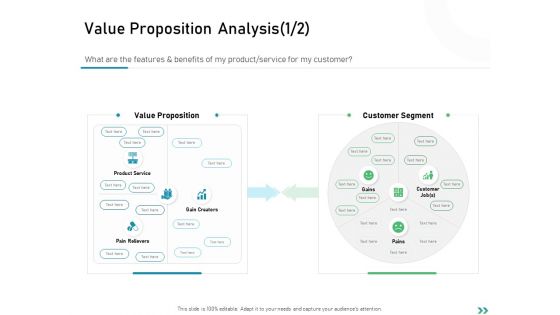
Global Expansion Strategies Value Proposition Analysis Customer Ppt Styles Diagrams PDF
What are the features and benefits of my product or service for my customer. This is a global expansion strategies value proposition analysis customer ppt styles diagrams pdf template with various stages. Focus and dispense information on two stages using this creative set, that comes with editable features. It contains large content boxes to add your information on topics like value proposition, customer segment. You can also showcase facts, figures, and other relevant content using this PPT layout. Grab it now.
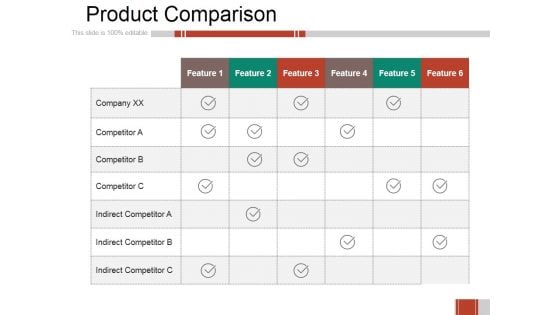
Product Comparison Ppt PowerPoint Presentation Visual Aids Gallery
This is a product comparison ppt powerpoint presentation visual aids gallery. This is a six stage process. The stages in this process are business, table, marketing, data analysis, feature.
Content And Sales Tools Ppt PowerPoint Presentation Visual Aids Icon
This is a content and sales tools ppt powerpoint presentation visual aids icon. This is a five stage process. The stages in this process areinternal sales tools, demo script, datasheets, feature, advantage.
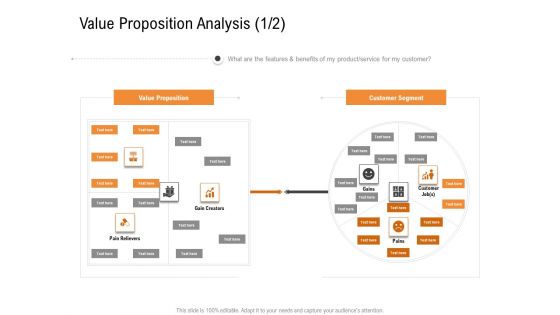
Opportunities And Threats For Penetrating In New Market Segments Value Proposition Analysis Customer Sample PDF
What are the features and benefits of my product or service for my customer. This is a opportunities and threats for penetrating in new market segments value proposition analysis customer sample pdf template with various stages. Focus and dispense information on two stages using this creative set, that comes with editable features. It contains large content boxes to add your information on topics like value proposition, customer segment. You can also showcase facts, figures, and other relevant content using this PPT layout. Grab it now.
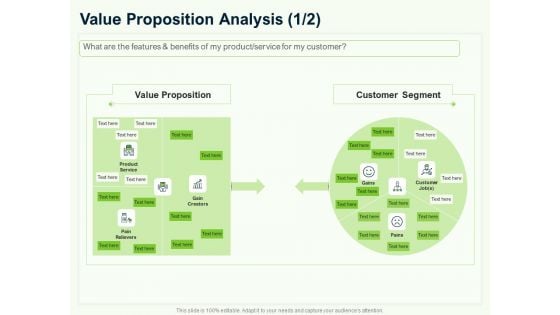
Guide To Overseas Expansion Plan For Corporate Entity Value Proposition Analysis Customer Download PDF
What are the features and benefits of my product or service for my customer. This is a guide to overseas expansion plan for corporate entity value proposition analysis customer download pdf template with various stages. Focus and dispense information on two stages using this creative set, that comes with editable features. It contains large content boxes to add your information on topics like value proposition, customer segment. You can also showcase facts, figures, and other relevant content using this PPT layout. Grab it now.
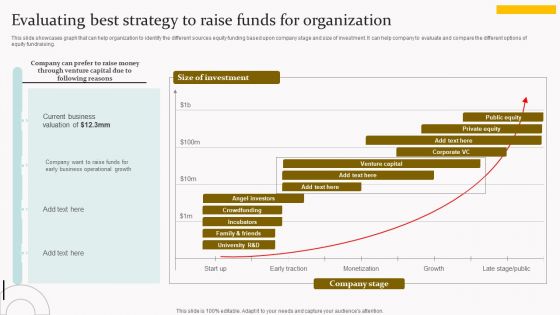
Evaluating Best Strategy To Raise Funds For Organization Ideas PDF
This slide showcases graph that can help organization to identify the different sources equity funding based upon company stage and size of investment. It can help company to evaluate and compare the different options of equity fundraising. Are you searching for a Evaluating Best Strategy To Raise Funds For Organization Ideas PDF that is uncluttered, straightforward, and original Its easy to edit, and you can change the colors to suit your personal or business branding. For a presentation that expresses how much effort you have put in, this template is ideal With all of its features, including tables, diagrams, statistics, and lists, its perfect for a business plan presentation. Make your ideas more appealing with these professional slides. Download Evaluating Best Strategy To Raise Funds For Organization Ideas PDF from Slidegeeks today.

Comparison Between User User And Item Item Memory Based Collaborative Filtering Pictures PDF
This slide represents the user-user and item-item memory based collaborative filtering recommendation techniques. The purpose of this slide is to compare the two memory based collaborative filtering recommendation methods based on different factors.Crafting an eye-catching presentation has never been more straightforward. Let your presentation shine with this tasteful yet straightforward Comparison Between User User And Item Item Memory Based Collaborative Filtering Pictures PDF template. It offers a minimalistic and classy look that is great for making a statement. The colors have been employed intelligently to add a bit of playfulness while still remaining professional. Construct the ideal Comparison Between User User And Item Item Memory Based Collaborative Filtering Pictures PDF that effortlessly grabs the attention of your audience Begin now and be certain to wow your customers

Monthly Report For Customer Satisfaction Survey Outcome Information PDF
This slide showcases customer satisfaction survey outcome monthly report that can help organization to compare the CSAT score and take timely corrective actions to correct the deviations. It showcases comparison for a period of 2 months and its key elements are customer experience, payment experience, website design and performance. Persuade your audience using this Monthly Report For Customer Satisfaction Survey Outcome Information PDF. This PPT design covers four stages, thus making it a great tool to use. It also caters to a variety of topics including Customer Experience, Payment Experience, Website Design. Download this PPT design now to present a convincing pitch that not only emphasizes the topic but also showcases your presentation skills.
PowerPoint Design Process 15x14 Rectangular Jigsaw Puzzle Matrix Ppt Process
PowerPoint Design Process 15x14 Rectangular Jigsaw Puzzle Matrix PPT Process-It is all there in bits and pieces. Individual components well researched and understood in their place. Now you need to get it all together to form the complete picture and reach the goal. You have the ideas and plans on how to go about it. Use this template to illustrate your method, piece by piece, and interlock the whole process in the minds of your audience. It is a 4x3 12 pieces Rectangular Jigsaw Puzzle Matrix.-PowerPoint Design Process 15x14 Rectangular Jigsaw Puzzle Matrix PPT Process Our PowerPoint Design Process 15x14 Rectangular Jigsaw Puzzle Matrix Ppt Process compare to a classic dessert. Your audience will have their cake and eat it too.
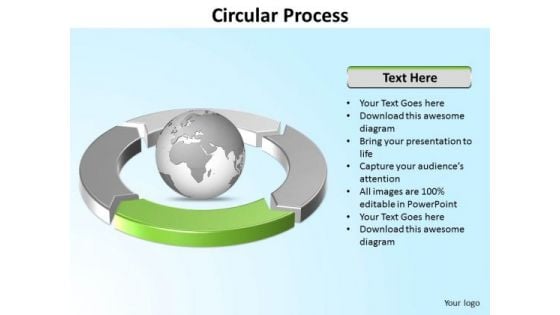
Ppt Four Segments Around Spinning Globe PowerPoint Template Circle Green Templates
PPT four segments around spinning globe powerpoint template circle green Templates-This PowerPoint Diagram can be used to represent worldwide issues such as Global warming, Acid Rain, Poverty, Racism,Obesity, overpopulation. It is illustrated by Green component. This Diagram will fit for Business Presentations.-Can be used for presentations on abstract, achievement, aim, arrow, background, business, chart, communication, company, competition, concept, design, development, diagram, direction, finance, financial, forecast, forward, goal, graph, graphic, growth, icon, illustration, increase, investment, leader, leadership, marketing, motion, moving, path, price, process, profit, progress, progress bar, shape, sign, success, symbol, target, team, teamwork, turquoise blue, up, upward-PPT four segments around spinning globe powerpoint template circle green Templates Compare products and services with our Ppt Four Segments Around Spinning Globe PowerPoint Template Circle Green Templates. You will come out on top.
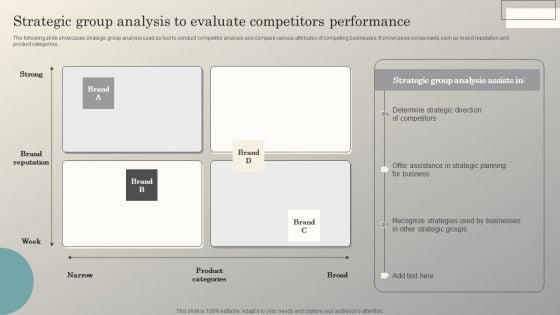
Steps To Conduct Competitor Analysis Strategic Group Analysis To Evaluate Competitors Mockup PDF
The following slide showcases strategic group analysis used as tool to conduct competitor analysis and compare various attributes of competing businesses. It showcases components such as brand reputation and product categories. Slidegeeks is one of the best resources for PowerPoint templates. You can download easily and regulate Steps To Conduct Competitor Analysis Strategic Group Analysis To Evaluate Competitors Mockup PDF for your personal presentations from our wonderful collection. A few clicks is all it takes to discover and get the most relevant and appropriate templates. Use our Templates to add a unique zing and appeal to your presentation and meetings. All the slides are easy to edit and you can use them even for advertisement purposes.
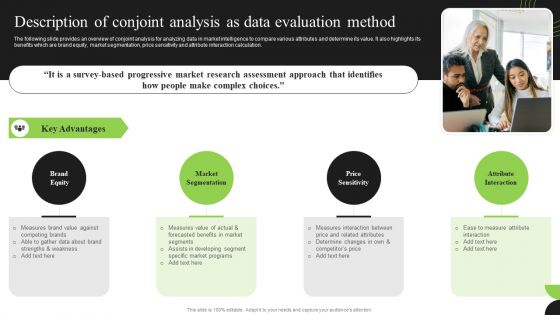
Guidebook For Executing Business Market Intelligence Description Of Conjoint Analysis As Data Professional PDF
The following slide provides an overview of conjoint analysis for analyzing data in market intelligence to compare various attributes and determine its value. It also highlights its benefits which are brand equity, market segmentation, price sensitivity and attribute interaction calculation. Create an editable Guidebook For Executing Business Market Intelligence Description Of Conjoint Analysis As Data Professional PDF that communicates your idea and engages your audience. Whether you are presenting a business or an educational presentation, pre designed presentation templates help save time. Guidebook For Executing Business Market Intelligence Description Of Conjoint Analysis As Data Professional PDF is highly customizable and very easy to edit, covering many different styles from creative to business presentations. Slidegeeks has creative team members who have crafted amazing templates. So, go and get them without any delay.
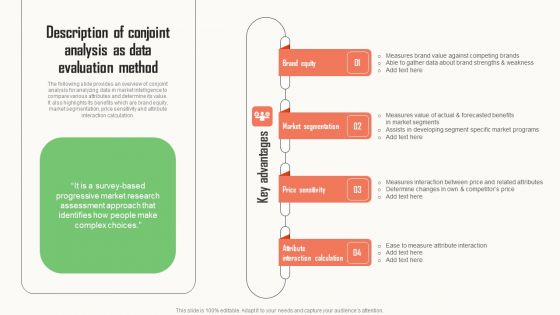
Strategic Market Insight Implementation Guide Description Of Conjoint Analysis As Data Evaluation Method Graphics PDF
The following slide provides an overview of conjoint analysis for analyzing data in market intelligence to compare various attributes and determine its value. It also highlights its benefits which are brand equity, market segmentation, price sensitivity and attribute interaction calculation. Whether you have daily or monthly meetings, a brilliant presentation is necessary. Strategic Market Insight Implementation Guide Description Of Conjoint Analysis As Data Evaluation Method Graphics PDF can be your best option for delivering a presentation. Represent everything in detail using Strategic Market Insight Implementation Guide Description Of Conjoint Analysis As Data Evaluation Method Graphics PDF and make yourself stand out in meetings. The template is versatile and follows a structure that will cater to your requirements. All the templates prepared by Slidegeeks are easy to download and edit. Our research experts have taken care of the corporate themes as well. So, give it a try and see the results.
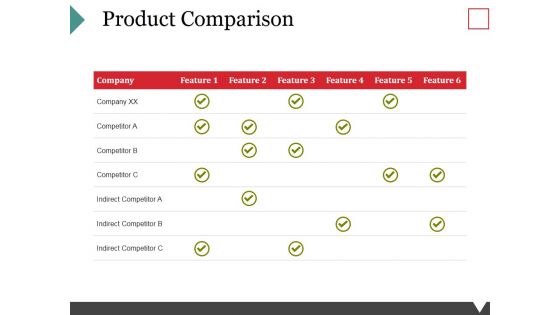
Product Comparison Ppt PowerPoint Presentation Show Infographic Template
This is a product comparison ppt powerpoint presentation show infographic template. This is a six stage process. The stages in this process are company, comparison, business, feature, competitor.


 Continue with Email

 Home
Home


