Feedback Icon
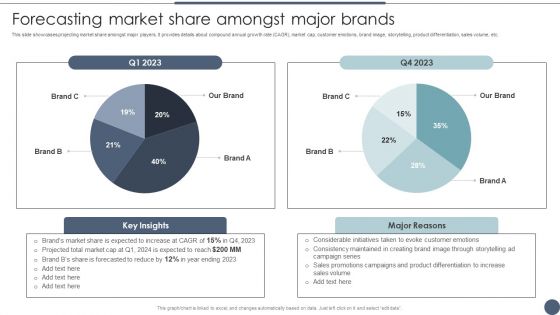
Forecasting Market Share Amongst Major Brands Utilizing Emotional And Rational Branding For Improved Consumer Themes PDF
This slide showcases projecting market share amongst major players. It provides details about compound annual growth rate CAGR, market cap, customer emotions, brand image, storytelling, product differentiation, sales volume, etc. This modern and well-arranged Forecasting Market Share Amongst Major Brands Utilizing Emotional And Rational Branding For Improved Consumer Themes PDF provides lots of creative possibilities. It is very simple to customize and edit with the Powerpoint Software. Just drag and drop your pictures into the shapes. All facets of this template can be edited with Powerpoint no extra software is necessary. Add your own material, put your images in the places assigned for them, adjust the colors, and then you can show your slides to the world, with an animated slide included.
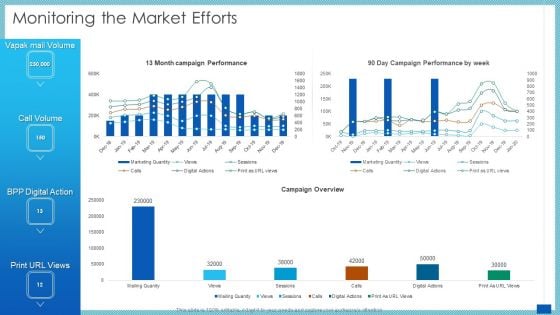
Evaluation Evolving Advanced Enterprise Development Marketing Tactics Monitoring The Market Efforts Diagrams PDF
Deliver an awe inspiring pitch with this creative evaluation evolving advanced enterprise development marketing tactics monitoring the market efforts diagrams pdf bundle. Topics like campaign performance, campaign overview, digital action can be discussed with this completely editable template. It is available for immediate download depending on the needs and requirements of the user.
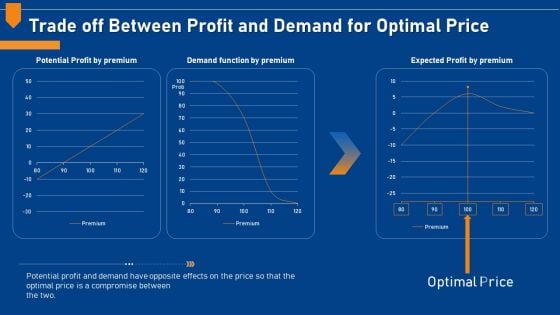
Evaluating Price Efficiency In Organization Trade Off Between Profit And Demand For Optimal Price Diagrams PDF
Deliver an awe inspiring pitch with this creative evaluating price efficiency in organization trade off between profit and demand for optimal price diagrams pdf bundle. Topics like potential profit by premium, demand function by premium, expected profit by premium can be discussed with this completely editable template. It is available for immediate download depending on the needs and requirements of the user.
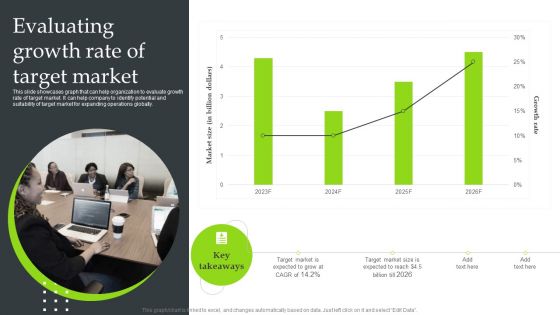
Expansion Strategic Plan Evaluating Growth Rate Of Target Market Diagrams PDF
This slide showcases graph that can help organization to evaluate growth rate of target market. It can help company to identify potential and suitability of target market for expanding operations globally. Do you have to make sure that everyone on your team knows about any specific topic I yes, then you should give Expansion Strategic Plan Evaluating Growth Rate Of Target Market Diagrams PDF a try. Our experts have put a lot of knowledge and effort into creating this impeccable Expansion Strategic Plan Evaluating Growth Rate Of Target Market Diagrams PDF. You can use this template for your upcoming presentations, as the slides are perfect to represent even the tiniest detail. You can download these templates from the Slidegeeks website and these are easy to edit. So grab these today.
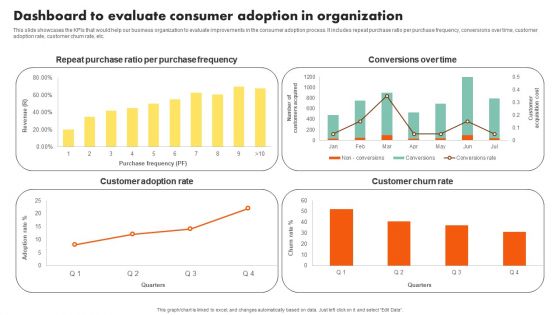
Examining Customer Experience Path To Enhance Adoption Rate Dashboard To Evaluate Consumer Adoption Diagrams PDF
This slide showcases the KPIs that would help our business organization to evaluate improvements in the consumer adoption process. It includes repeat purchase ratio per purchase frequency, conversions over time, customer adoption rate, customer churn rate, etc. Create an editable Examining Customer Experience Path To Enhance Adoption Rate Dashboard To Evaluate Consumer Adoption Diagrams PDF that communicates your idea and engages your audience. Whether youre presenting a business or an educational presentation, pre designed presentation templates help save time. Examining Customer Experience Path To Enhance Adoption Rate Dashboard To Evaluate Consumer Adoption Diagrams PDF is highly customizable and very easy to edit, covering many different styles from creative to business presentations. Slidegeeks has creative team members who have crafted amazing templates. So, go and get them without any delay.
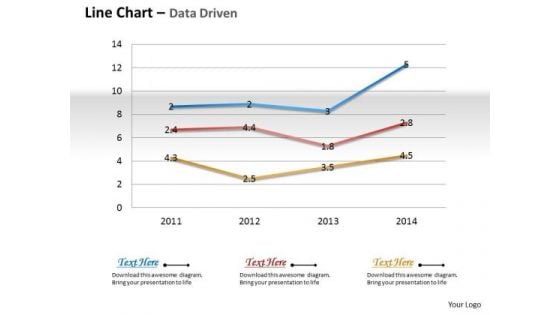
Business Data Analysis Chart Shows Changes Over The Time PowerPoint Templates
Document The Process On Our business data analysis chart shows changes over the time Powerpoint Templates. Make A Record Of Every Detail.
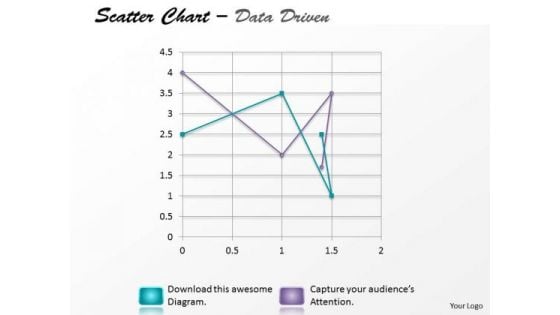
Data Analysis Excel Driven Multiple Series Scatter Chart PowerPoint Slides Templates
Your Listeners Will Never Doodle. Our data analysis excel driven multiple series scatter chart powerpoint slides Templates Will Hold Their Concentration.
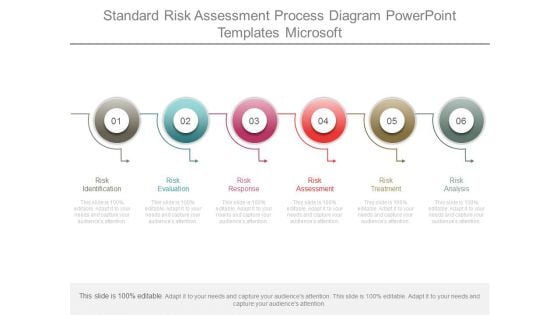
Standard Risk Assessment Process Diagram Powerpoint Templates Microsoft
This is a standard risk assessment process diagram powerpoint templates microsoft. This is a six stage process. The stages in this process are risk identification, risk evaluation, risk response, risk assessment, risk treatment, risk analysis.
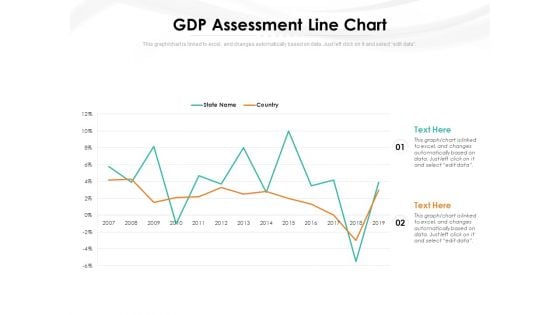
GDP Assessment Line Chart Ppt PowerPoint Presentation Professional Skills PDF
Presenting this set of slides with name gdp assessment line chart ppt powerpoint presentation professional skills pdf. The topics discussed in these slide is gdp assessment line chart. This is a completely editable PowerPoint presentation and is available for immediate download. Download now and impress your audience.
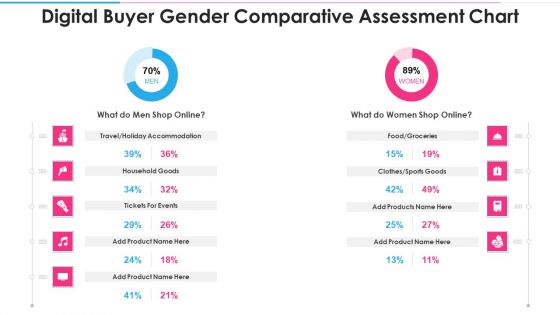
Digital Buyer Gender Comparative Assessment Chart Introduction PDF
Showcasing this set of slides titled digital buyer gender comparative assessment chart introduction pdf. The topics addressed in these templates are digital buyer gender comparative assessment chart. All the content presented in this PPT design is completely editable. Download it and make adjustments in color, background, font etc. as per your unique business setting.
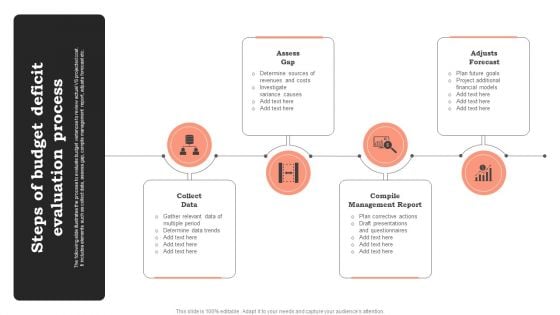
Steps Of Budget Deficit Evaluation Process Diagrams PDF
The following slide illustrates the process to evaluate budget variances to review actual VS projected cost. It includes elements such as collect data, assess gap, compile management report, adjusts forecast etc. Persuade your audience using this Steps Of Budget Deficit Evaluation Process Diagrams PDF. This PPT design covers Three stages, thus making it a great tool to use. It also caters to a variety of topics including Budget Deficit, Evaluation Process. Download this PPT design now to present a convincing pitch that not only emphasizes the topic but also showcases your presentation skills.

Product Expansion And Growth Chart To Improve Market Share Ppt PowerPoint Presentation Model File Formats PDF
Presenting this set of slides with name product expansion and growth chart to improve market share ppt powerpoint presentation model file formats pdf. This is a four stage process. The stages in this process are present products, new markets, market development, diversification invoicing new products and new markets. This is a completely editable PowerPoint presentation and is available for immediate download. Download now and impress your audience.
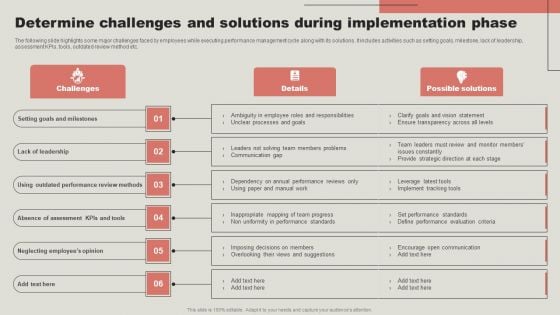
Determine Challenges And Solutions During Implementation Phase Infographics PDF
The following slide highlights some major challenges faced by employees while executing performance management cycle along with its solutions. It includes activities such as setting goals, milestone, lack of leadership, assessment KPIs, tools, outdated review method etc. This Determine Challenges And Solutions During Implementation Phase Infographics PDF from Slidegeeks makes it easy to present information on your topic with precision. It provides customization options, so you can make changes to the colors, design, graphics, or any other component to create a unique layout. It is also available for immediate download, so you can begin using it right away. Slidegeeks has done good research to ensure that you have everything you need to make your presentation stand out. Make a name out there for a brilliant performance.
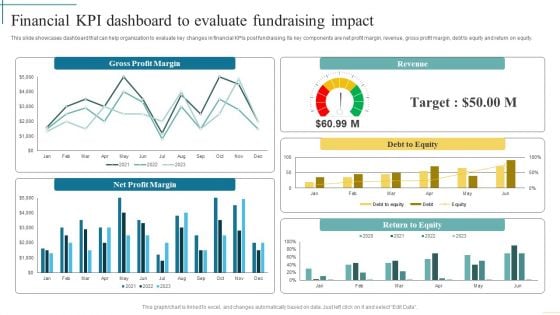
Financial Kpi Dashboard To Evaluate Fundraising Impact Developing Fundraising Techniques Diagrams PDF
This slide showcases dashboard that can help organization to evaluate key changes in financial KPIs post fundraising. Its key components are net profit margin, revenue, gross profit margin, debt to equity and return on equity. From laying roadmaps to briefing everything in detail, our templates are perfect for you. You can set the stage with your presentation slides. All you have to do is download these easy-to-edit and customizable templates. Financial Kpi Dashboard To Evaluate Fundraising Impact Developing Fundraising Techniques Diagrams PDF will help you deliver an outstanding performance that everyone would remember and praise you for. Do download this presentation today.
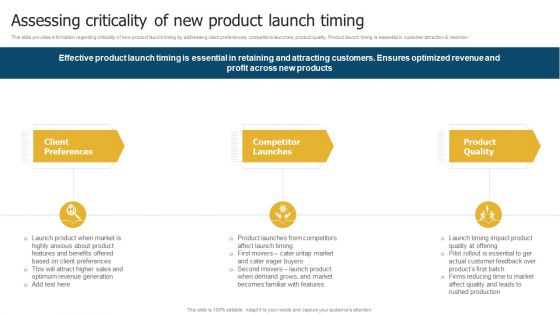
Merchandise Launch Kickoff Playbook Assessing Criticality Of New Product Launch Timing Structure PDF
This slide provides information regarding criticality of new product launch timing by addressing client preferences, competitors launches, product quality. Product launch timing is essential in customer attraction and retention. If you are looking for a format to display your unique thoughts, then the professionally designed Merchandise Launch Kickoff Playbook Assessing Criticality Of New Product Launch Timing Structure PDF is the one for you. You can use it as a Google Slides template or a PowerPoint template. Incorporate impressive visuals, symbols, images, and other charts. Modify or reorganize the text boxes as you desire. Experiment with shade schemes and font pairings. Alter, share or cooperate with other people on your work. Download Merchandise Launch Kickoff Playbook Assessing Criticality Of New Product Launch Timing Structure PDF and find out how to give a successful presentation. Present a perfect display to your team and make your presentation unforgettable.
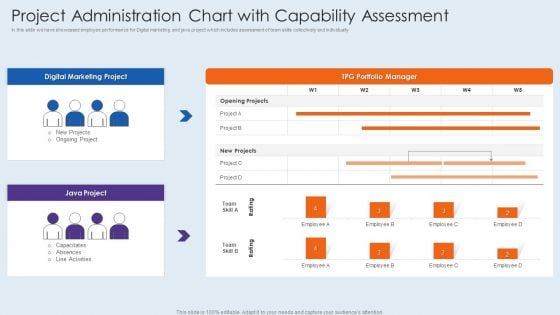
Project Administration Chart With Capability Assessment Elements PDF
In this slide we have showcased employee performance for Digital marketing and java project which includes assessment of team skills collectively and individually. Showcasing this set of slides titled project administration chart with capability assessment elements pdf. The topics addressed in these templates are project administration chart with capability assessment. All the content presented in this PPT design is completely editable. Download it and make adjustments in color, background, font etc. as per your unique business setting.
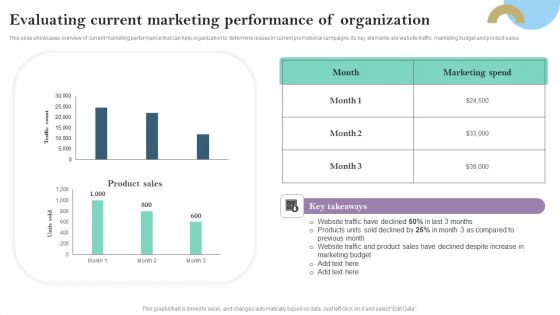
Evaluating Current Marketing Performance Of Organization Ppt PowerPoint Presentation Diagram Templates PDF
This slide showcases overview of current marketing performance that can help organization to determine issues in current promotional campaigns. Its key elements are website traffic, marketing budget and product sales Explore a selection of the finest Evaluating Current Marketing Performance Of Organization Ppt PowerPoint Presentation Diagram Templates PDF here. With a plethora of professionally designed and pre made slide templates, you can quickly and easily find the right one for your upcoming presentation. You can use our Evaluating Current Marketing Performance Of Organization Ppt PowerPoint Presentation Diagram Templates PDF to effectively convey your message to a wider audience. Slidegeeks has done a lot of research before preparing these presentation templates. The content can be personalized and the slides are highly editable. Grab templates today from Slidegeeks.
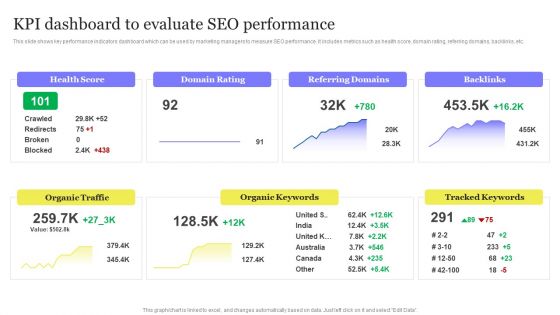
Enhancing Digital Visibility Using SEO Content Strategy KPI Dashboard To Evaluate SEO Performance Diagrams PDF
This slide shows key performance indicators dashboard which can be used by marketing managers to measure SEO performance. It includes metrics such as health score, domain rating, referring domains, backlinks, etc. This Enhancing Digital Visibility Using SEO Content Strategy KPI Dashboard To Evaluate SEO Performance Diagrams PDF is perfect for any presentation, be it in front of clients or colleagues. It is a versatile and stylish solution for organizing your meetings. The Enhancing Digital Visibility Using SEO Content Strategy KPI Dashboard To Evaluate SEO Performance Diagrams PDF features a modern design for your presentation meetings. The adjustable and customizable slides provide unlimited possibilities for acing up your presentation. Slidegeeks has done all the homework before launching the product for you. So, do not wait, grab the presentation templates today
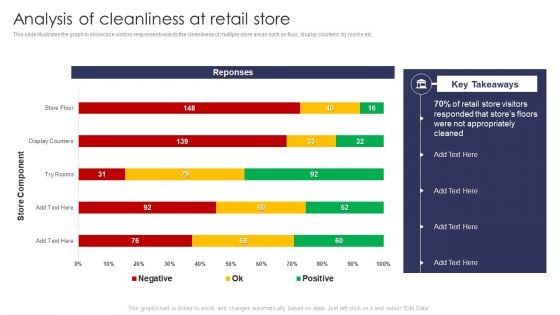
Analysis Of Cleanliness At Retail Store Retail Outlet Operations Performance Evaluation Diagrams PDF
This slide illustrates the graph to showcase visitors responses towards the cleanliness of multiple store areas such as floor, display counters, try rooms etc.Deliver and pitch your topic in the best possible manner with this Analysis Of Cleanliness At Retail Store Retail Outlet Operations Performance Evaluation Diagrams PDF. Use them to share invaluable insights on Retail Store, Visitors Responded, Stores Floors and impress your audience. This template can be altered and modified as per your expectations. So, grab it now.
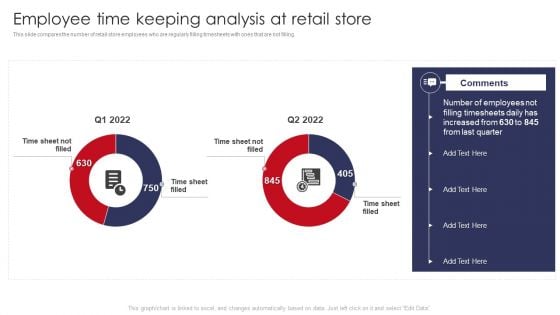
Employee Time Keeping Analysis At Retail Store Retail Outlet Operations Performance Evaluation Diagrams PDF
This slide compares the number of retail store employees who are regularly filling timesheets with ones that are not filling.Deliver an awe inspiring pitch with this creative Employee Time Keeping Analysis At Retail Store Retail Outlet Operations Performance Evaluation Diagrams PDF bundle. Topics like Filling Timesheets, Increased, Last Quarter can be discussed with this completely editable template. It is available for immediate download depending on the needs and requirements of the user.
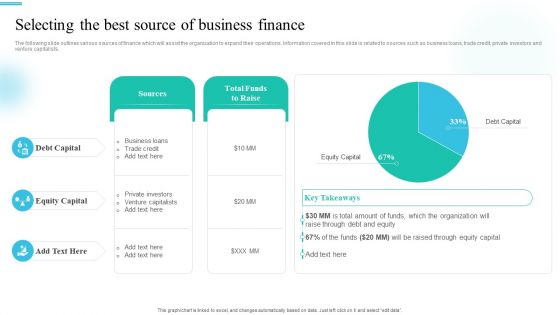
Monetary Planning And Evaluation Guide Selecting The Best Source Of Business Finance Ppt Gallery Diagrams PDF
The following slide outlines various sources of finance which will assist the organization to expand their operations. Information covered in this slide is related to sources such as business loans, trade credit, private investors and venture capitalists. Presenting this PowerPoint presentation, titled Monetary Planning And Evaluation Guide Selecting The Best Source Of Business Finance Ppt Gallery Diagrams PDF, with topics curated by our researchers after extensive research. This editable presentation is available for immediate download and provides attractive features when used. Download now and captivate your audience. Presenting this Monetary Planning And Evaluation Guide Selecting The Best Source Of Business Finance Ppt Gallery Diagrams PDF. Our researchers have carefully researched and created these slides with all aspects taken into consideration. This is a completely customizable Monetary Planning And Evaluation Guide Selecting The Best Source Of Business Finance Ppt Gallery Diagrams PDF that is available for immediate downloading. Download now and make an impact on your audience. Highlight the attractive features available with our PPTs.
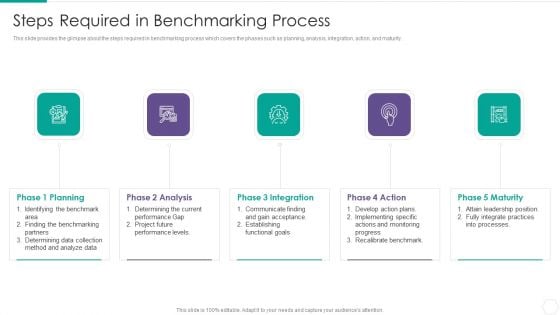
Quantitative Risk Assessment Steps Required In Benchmarking Process Diagrams PDF
This slide provides the glimpse about the steps required in benchmarking process which covers the phases such as planning, analysis, integration, action, and maturity. This is a Quantitative Risk Assessment Steps Required In Benchmarking Process Diagrams PDF template with various stages. Focus and dispense information on five stages using this creative set, that comes with editable features. It contains large content boxes to add your information on topics like Analysis, Planning, Integration, Maturity. You can also showcase facts, figures, and other relevant content using this PPT layout. Grab it now.
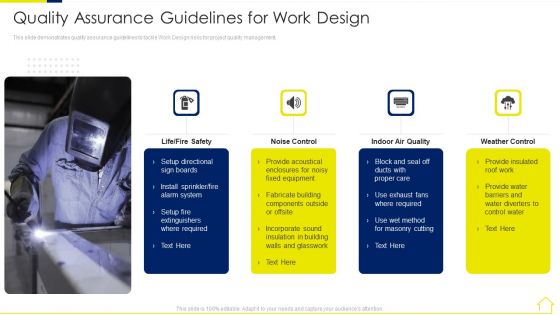
Risk Assessment Methods Real Estate Development Project Quality Assurance Guidelines For Work Design Formats PDF
This slide demonstrates quality assurance guidelines to tackle Work Design risks for project quality management. Presenting risk assessment methods real estate development project quality assurance guidelines for building themes pdf to provide visual cues and insights. Share and navigate important information on four stages that need your due attention. This template can be used to pitch topics like quality assurance guidelines for work design. In addtion, this PPT design contains high resolution images, graphics, etc, that are easily editable and available for immediate download.
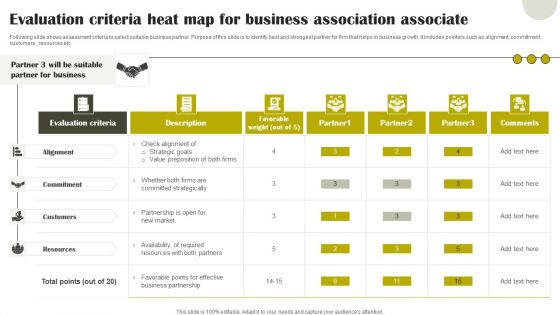
Evaluation Criteria Heat Map For Business Association Associate Diagrams PDF
Following slide shows assessment criteria to select suitable business partner. Purpose of this slide is to identify best and strongest partner for firm that helps in business growth. It includes pointers such as alignment, commitment, customers , resources etc. Pitch your topic with ease and precision using this Evaluation Criteria Heat Map For Business Association Associate Diagrams PDF. This layout presents information on Evaluation Criteria, Resources, Business Partnership. It is also available for immediate download and adjustment. So, changes can be made in the color, design, graphics or any other component to create a unique layout.
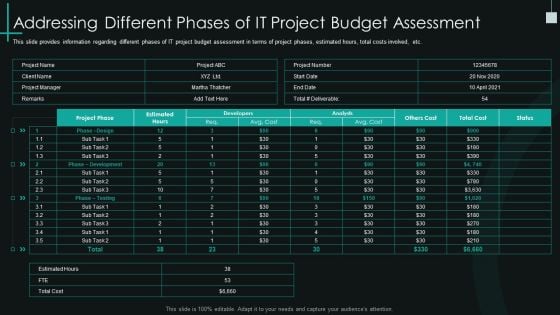
Fundamental Pmp Elements Of It Projects It Addressing Different Phases Of It Project Budget Assessment Guidelines PDF
This slide provides information regarding different phases of IT project budget assessment in terms of project phases, estimated hours, total costs involved, etc. Deliver an awe inspiring pitch with this creative fundamental pmp elements of it projects it addressing different phases of it project budget assessment guidelines pdf bundle. Topics like addressing different phases of it project budget assessment can be discussed with this completely editable template. It is available for immediate download depending on the needs and requirements of the user.
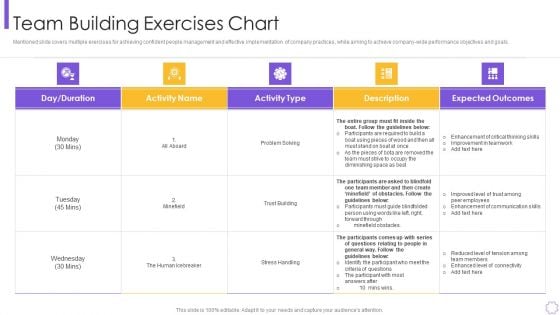
Organizational Program To Improve Team Productivity And Efficiency Team Building Exercises Chart Designs PDF
Mentioned slide covers multiple exercises for achieving confident people management and effective implementation of company practices, while aiming to achieve company-wide performance objectives and goals.Deliver an awe inspiring pitch with this creative organizational program to improve team productivity and efficiency team building exercises chart designs pdf bundle. Topics like enhancement of critical, enhancement of communication, reduced level of tension among can be discussed with this completely editable template. It is available for immediate download depending on the needs and requirements of the user.
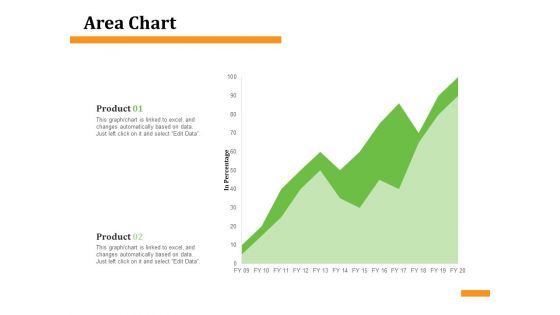
Firm Condition Assessment Area Chart Ppt Infographic Template Graphics PDF
Presenting this set of slides with name firm condition assessment area chart ppt infographic template graphics pdf. The topics discussed in these slide is area chart. This is a completely editable PowerPoint presentation and is available for immediate download. Download now and impress your audience.
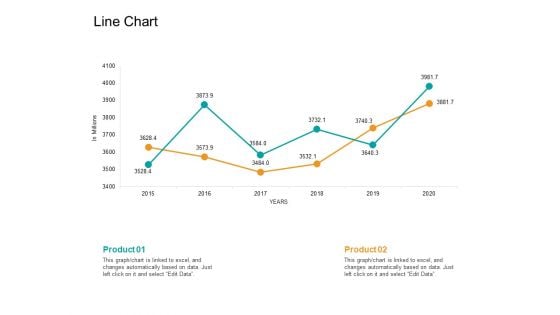
Facts Assessment Line Chart Ppt PowerPoint Presentation Outline Brochure PDF
Presenting this set of slides with name facts assessment line chart ppt powerpoint presentation outline brochure pdf. The topics discussed in these slide is line chart. This is a completely editable PowerPoint presentation and is available for immediate download. Download now and impress your audience.
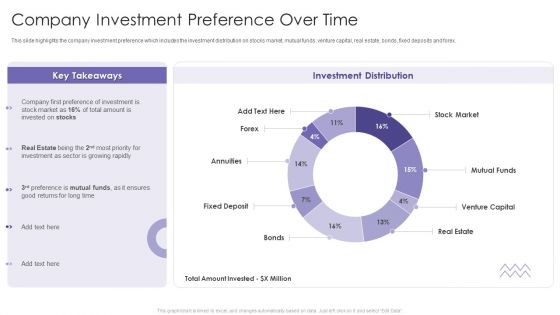
Evaluating Hedge Funds For Greater ROI Company Investment Preference Over Time Diagrams PDF
This slide highlights the company investment preference which includes the investment distribution on stocks market, mutual funds, venture capital, real estate, bonds, fixed deposits and forex. Deliver and pitch your topic in the best possible manner with this Evaluating Hedge Funds For Greater ROI Company Investment Preference Over Time Diagrams PDF. Use them to share invaluable insights on Investment Distribution, Stock Market, Mutual Funds, Venture Capital and impress your audience. This template can be altered and modified as per your expectations. So, grab it now.
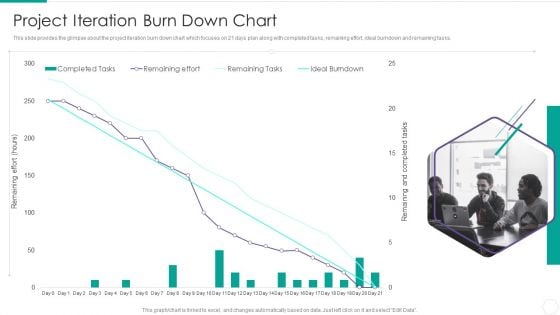
Quantitative Risk Assessment Project Iteration Burn Down Chart Sample PDF
This slide provides the glimpse about the project iteration burn down chart which focuses on 21 days plan along with completed tasks, remaining effort, ideal burndown and remaining tasks. Deliver an awe inspiring pitch with this creative Quantitative Risk Assessment Project Iteration Burn Down Chart Sample PDF bundle. Topics like Project Iteration Burn Down Chart can be discussed with this completely editable template. It is available for immediate download depending on the needs and requirements of the user.
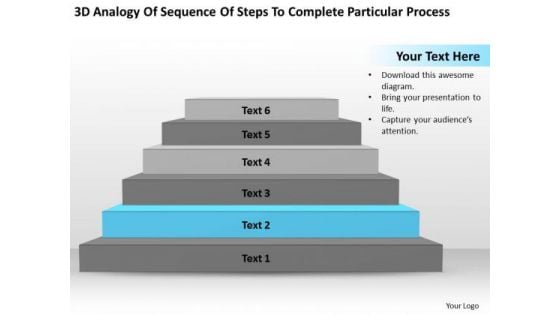
Particular Process Ppt What Is An Executive Summary In Business Plan PowerPoint Slides
We present our particular process ppt what is an executive summary in business plan PowerPoint Slides.Download and present our Flow Charts PowerPoint Templates because Our PowerPoint Templates and Slides will let you Illuminate the road ahead to Pinpoint the important landmarks along the way. Download and present our Process and Flows PowerPoint Templates because You are well armed with penetrative ideas. Our PowerPoint Templates and Slides will provide the gunpowder you need. Use our Business PowerPoint Templates because You can Create a matrix with our PowerPoint Templates and Slides. Feel the strength of your ideas click into place. Present our Flow Charts PowerPoint Templates because It will Raise the bar of your Thoughts. They are programmed to take you to the next level. Present our Shapes PowerPoint Templates because Our PowerPoint Templates and Slides will let you Clearly mark the path for others to follow.Use these PowerPoint slides for presentations relating to Step, stairs, vector, business, page, layout, concept, card, banner, compare, sequence, attractive,special, corporate, tutorial, order, symbol, brochure, step, simple, label, abstract, modern, creative, illustration, number, design, trendy, stairway, progress, background, advertising, promotion, navigation, explanation. The prominent colors used in the PowerPoint template are Gray, Blue light, Black. Give your audience whatever they fancy. Our Particular Process Ppt What Is An Executive Summary In Business Plan PowerPoint Slides cater for many a delight.
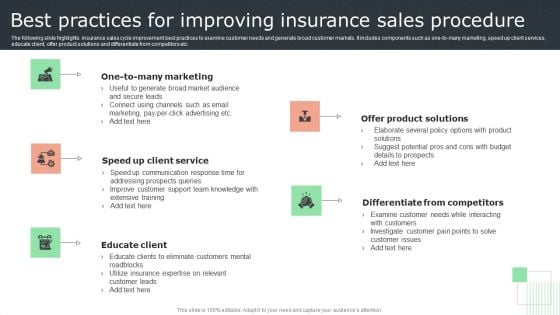
Best Practices For Improving Insurance Sales Procedure Slides PDF
The following slide highlights insurance sales cycle improvement best practices to examine customer needs and generate broad customer markets. It includes components such as one-to-many marketing, speed up client services, educate client, offer product solutions and differentiate from competitors etc. Presenting Best Practices For Improving Insurance Sales Procedure Slides PDF to dispense important information. This template comprises five stages. It also presents valuable insights into the topics including Marketing, Solutions, Competitors. This is a completely customizable PowerPoint theme that can be put to use immediately. So, download it and address the topic impactfully.
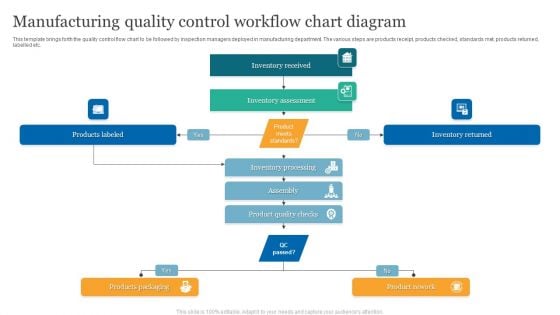
Manufacturing Quality Control Workflow Chart Diagram Ideas PDF
This template brings forth the quality control flow chart to be followed by inspection managers deployed in manufacturing department. The various steps are products receipt, products checked, standards met, products returned, labelled etc. Persuade your audience using this Manufacturing Quality Control Workflow Chart Diagram Ideas PDF. This PPT design covers One stage, thus making it a great tool to use. It also caters to a variety of topics including Inventory Received, Inventory Assessment, Inventory Returned. Download this PPT design now to present a convincing pitch that not only emphasizes the topic but also showcases your presentation skills.
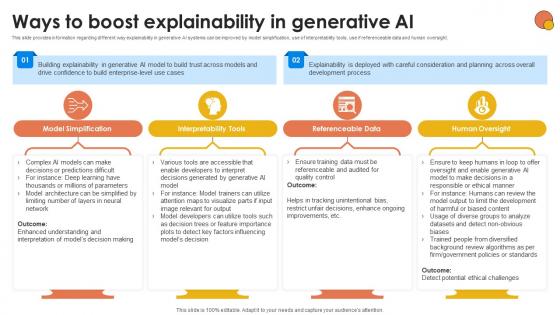
Ways To Boost Explainability In Generative AI For Better Productivity AI SS V
This slide provides information regarding different way explainability in generative AI systems can be improved by model simplification, use of interpretability tools, use if referenceable data and human oversight. Are you searching for a Ways To Boost Explainability In Generative AI For Better Productivity AI SS V that is uncluttered, straightforward, and original Its easy to edit, and you can change the colors to suit your personal or business branding. For a presentation that expresses how much effort you have put in, this template is ideal With all of its features, including tables, diagrams, statistics, and lists, its perfect for a business plan presentation. Make your ideas more appealing with these professional slides. Download Ways To Boost Explainability In Generative AI For Better Productivity AI SS V from Slidegeeks today. This slide provides information regarding different way explainability in generative AI systems can be improved by model simplification, use of interpretability tools, use if referenceable data and human oversight.
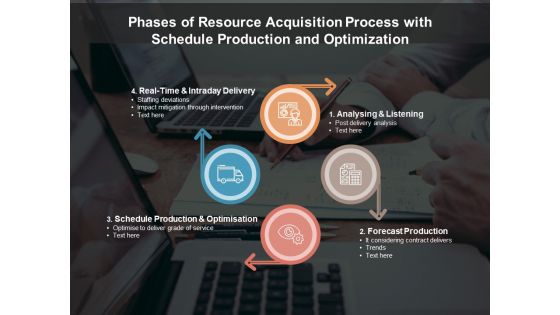
Phases Of Resource Acquisition Process With Schedule Production And Optimization Ppt PowerPoint Presentation Gallery Example File PDF
Presenting this set of slides with name phases of resource acquisition process with schedule production and optimization ppt powerpoint presentation gallery example file pdf. This is a four stage process. The stages in this process are real time and intraday delivery, analysing and listening, schedule production and optimisation, forecast production. This is a completely editable PowerPoint presentation and is available for immediate download. Download now and impress your audience.
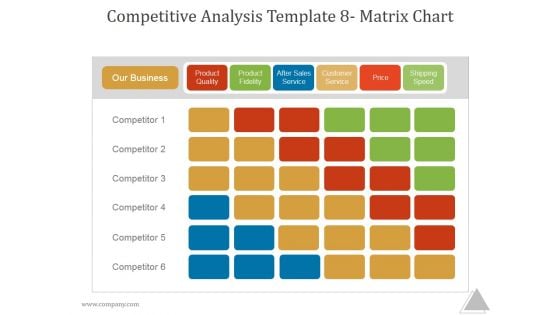
Competitive Analysis Template 8 Matrix Chart Ppt PowerPoint Presentation Templates
This is a competitive analysis template 8 matrix chart ppt powerpoint presentation templates. This is a six stage process. The stages in this process are our business, product quality, product fidelity, after sales service, customer service, price, shipping speed, competitor.
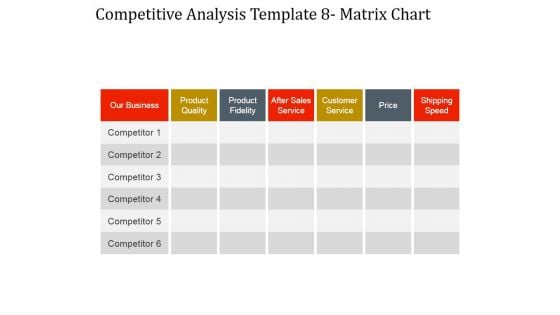
Competitive Analysis Matrix Chart Ppt PowerPoint Presentation Gallery
This is a competitive analysis matrix chart ppt powerpoint presentation gallery. This is a seven stage process. The stages in this process are our business, product quality, product fidelity, after sales service, customer service, price, shipping speed.
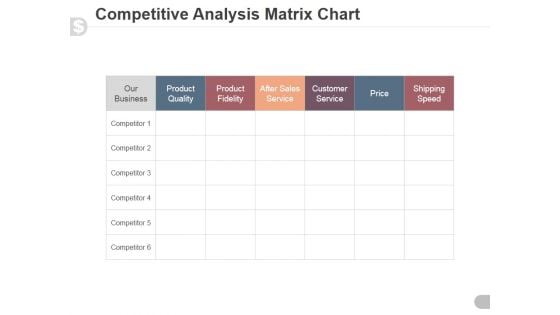
Competitive Analysis Matrix Chart Ppt PowerPoint Presentation Inspiration
This is a competitive analysis matrix chart ppt powerpoint presentation inspiration. This is a six stage process. The stages in this process are product quality, product fidelity, after sales service, customer service, price, shipping speed.
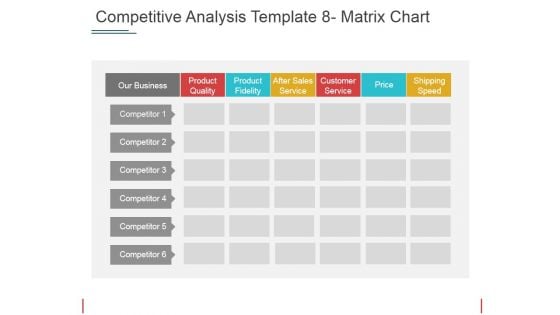
Competitive Analysis Matrix Chart Ppt PowerPoint Presentation Portfolio Format Ideas
This is a competitive analysis matrix chart ppt powerpoint presentation portfolio format ideas. This is a six stage process. The stages in this process are our business, product quality, product fidelity, after sales service, customer service.

ISO 9001 Standard For Quality Control Results After Implementation Of ISO 9001 Quality Systems Demonstration PDF
This template covers results of implication QMS ISO 9001 certification such as increasing customer satisfaction, operational efficiency, profitability, and export sales. Deliver an awe inspiring pitch with this creative ISO 9001 Standard For Quality Control Results After Implementation Of ISO 9001 Quality Systems Demonstration PDF bundle. Topics like Report Marketing Benefits, Report Increased Profitability, Report Improved Export Sales can be discussed with this completely editable template. It is available for immediate download depending on the needs and requirements of the user.
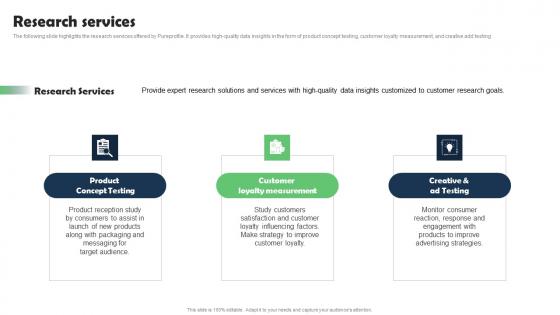
Research Services Marketing Research Services Management Business Themes Pdf
The following slide highlights the research services offered by Pureprofile. It provides high-quality data insights in the form of product concept testing, customer loyalty measurement, and creative add testing. This Research Services Marketing Research Services Management Business Themes Pdf from Slidegeeks makes it easy to present information on your topic with precision. It provides customization options, so you can make changes to the colors, design, graphics, or any other component to create a unique layout. It is also available for immediate download, so you can begin using it right away. Slidegeeks has done good research to ensure that you have everything you need to make your presentation stand out. Make a name out there for a brilliant performance. The following slide highlights the research services offered by Pureprofile. It provides high-quality data insights in the form of product concept testing, customer loyalty measurement, and creative add testing.
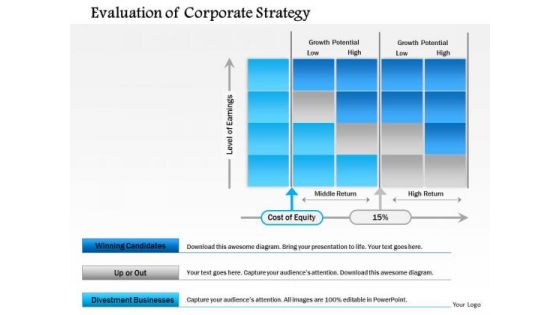
Business Framework Evaluation Of Corporate Strategy PowerPoint Presentation
This business framework has been crafted with graphic of text boxes. This PPT diagram contains the multiple text boxes. This PPT diagram may be used for progress and growth related presentations.
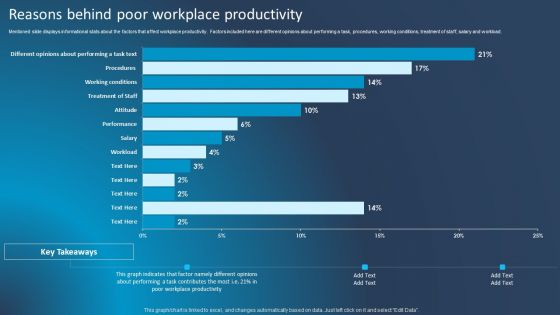
Improving Corporate Performance Reasons Behind Poor Workplace Productivity Designs PDF
Mentioned slide displays informational stats about the factors that affect workplace productivity. Factors included here are different opinions about performing a task, procedures, working conditions, treatment of staff, salary and workload. Coming up with a presentation necessitates that the majority of the effort goes into the content and the message you intend to convey. The visuals of a PowerPoint presentation can only be effective if it supplements and supports the story that is being told. Keeping this in mind our experts created Improving Corporate Performance Reasons Behind Poor Workplace Productivity Designs PDF to reduce the time that goes into designing the presentation. This way, you can concentrate on the message while our designers take care of providing you with the right template for the situation.
Project Decision Approval And Cost Tracking Matrix Topics PDF
The slide shows a matrix for making decisions by stakeholders of auto generated projects. It also includes utilized amounts in cost tracking. Presenting Project Decision Approval And Cost Tracking Matrix Topics PDF to dispense important information. This template comprises three stages. It also presents valuable insights into the topics including Evaluate, Plans, Project. This is a completely customizable PowerPoint theme that can be put to use immediately. So, download it and address the topic impactfully.
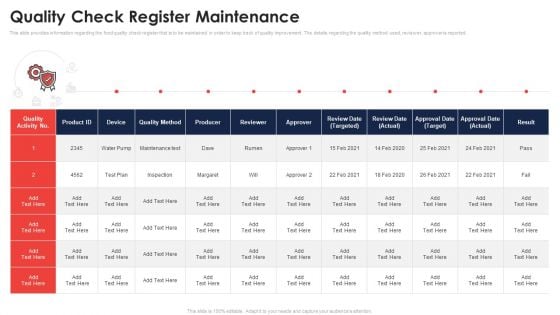
Quality Check Register Maintenance Application Of Quality Management For Food Processing Companies Diagrams PDF
This slide provides information regarding the food quality check register that is to be maintained in order to keep track of quality improvement. The details regarding the quality method used, reviewer, approver is reported. Deliver an awe inspiring pitch with this creative quality check register maintenance application of quality management for food processing companies diagrams pdf bundle. Topics like quality check register maintenance can be discussed with this completely editable template. It is available for immediate download depending on the needs and requirements of the user.
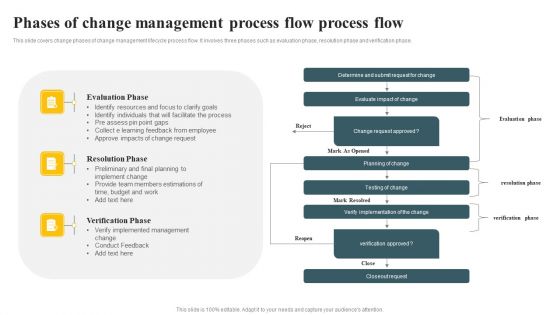
Phases Of Change Management Process Flow Process Flow Ppt PowerPoint Presentation Backgrounds PDF
This slide covers change phases of change management lifecycle process flow. It involves three phases such as evaluation phase, resolution phase and verification phase. Showcasing this set of slides titled Phases Of Change Management Process Flow Process Flow Ppt PowerPoint Presentation Backgrounds PDF. The topics addressed in these templates are Evaluation Phase, Resolution Phase, Verification Phase. All the content presented in this PPT design is completely editable. Download it and make adjustments in color, background, font etc. as per your unique business setting.
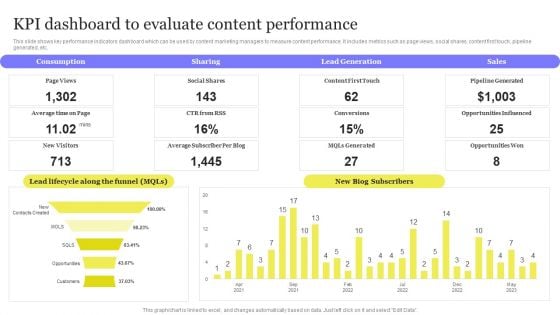
Enhancing Digital Visibility Using SEO Content Strategy KPI Dashboard To Evaluate Content Performance Diagrams PDF
This slide shows key performance indicators dashboard which can be used by content marketing managers to measure content performance. It includes metrics such as page views, social shares, content first touch, pipeline generated, etc. This modern and well arranged Enhancing Digital Visibility Using SEO Content Strategy KPI Dashboard To Evaluate Content Performance Diagrams PDF provides lots of creative possibilities. It is very simple to customize and edit with the Powerpoint Software. Just drag and drop your pictures into the shapes. All facets of this template can be edited with Powerpoint no extra software is necessary. Add your own material, put your images in the places assigned for them, adjust the colors, and then you can show your slides to the world, with an animated slide included.
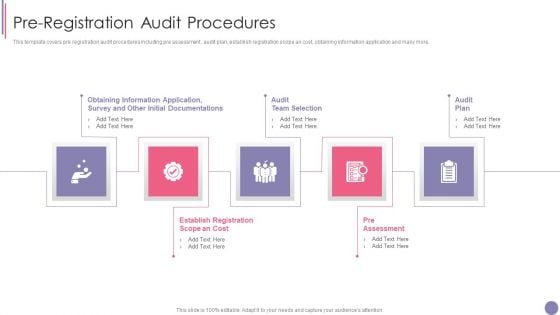
ISO 9001 Quality Assurance Software Accreditation Pre Registration Audit Procedures Diagrams PDF
This template covers pre registration audit procedures including pre assessment , audit plan, establish registration scope an cost, obtaining information application and many more. This is a ISO 9001 Quality Assurance Software Accreditation Pre Registration Audit Procedures Diagrams PDF template with various stages. Focus and dispense information on five stages using this creative set, that comes with editable features. It contains large content boxes to add your information on topics like Audit Team Selection, Pre Assessment, Audit Plan. You can also showcase facts, figures, and other relevant content using this PPT layout. Grab it now.
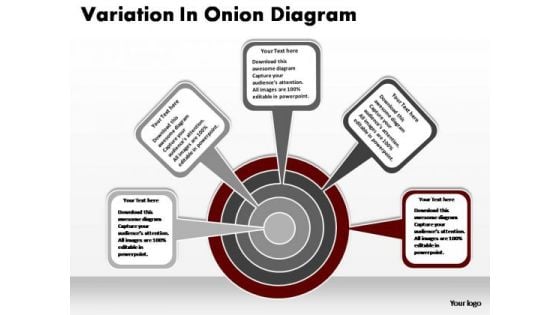
PowerPoint Process Strategy Onion Ppt Themes
PowerPoint Process Strategy Onion PPT Themes-Some are bound to be highly profitable for you to follow up. Put all this brilliant views to your audience.-PowerPoint Process Strategy Onion PPT Themes Empower yourself with our PowerPoint Process Strategy Onion Ppt Themes. Put extra force behind your thoughts.
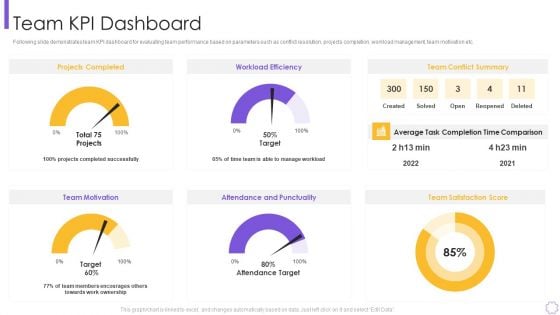
Organizational Program To Improve Team Productivity And Efficiency Team Kpi Dashboard Clipart PDF
Following slide demonstrates team KPI dashboard for evaluating team performance based on parameters such as conflict resolution, projects completion, workload management, team motivation etc. Deliver and pitch your topic in the best possible manner with this organizational program to improve team productivity and efficiency team kpi dashboard clipart pdf Use them to share invaluable insights on projects completed, workload efficiency, attendance and punctualityand impress your audience. This template can be altered and modified as per your expectations. So, grab it now.
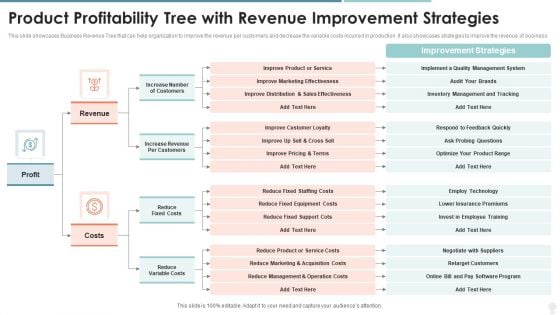
Product Profitability Tree With Revenue Improvement Strategies Microsoft PDF
This slide showcases Business Revenue Tree that can help organization to improve the revenue per customers and decrease the variable costs incurred in production. It also showcases strategies to improve the revenue of business. Persuade your audience using this product profitability tree with revenue improvement strategies microsoft pdf. This PPT design covers two stages, thus making it a great tool to use. It also caters to a variety of topics including product profitability tree with revenue improvement strategies. Download this PPT design now to present a convincing pitch that not only emphasizes the topic but also showcases your presentation skills.
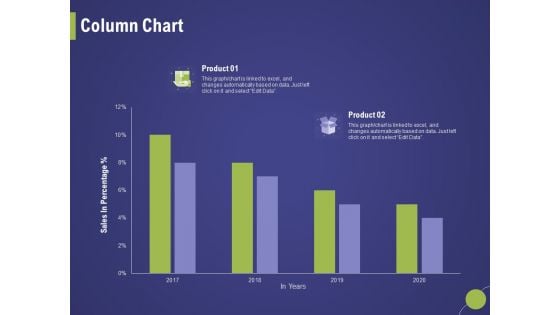
Firm Capability Assessment Column Chart Ppt Ideas Microsoft PDF
Presenting this set of slides with name firm capability assessment column chart ppt ideas microsoft pdf. The topics discussed in these slides are product 1, product 2. This is a completely editable PowerPoint presentation and is available for immediate download. Download now and impress your audience.
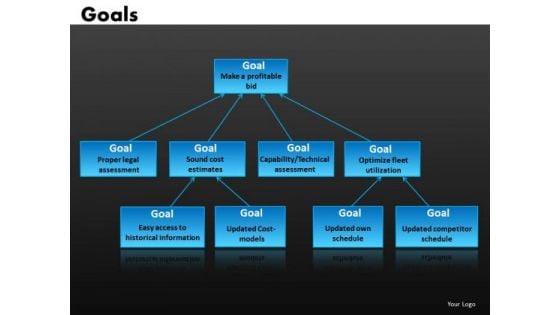
Network Diagram Of Goals PowerPoint Templates Goals Network Ppt Slides
Network Diagram of Goals PowerPoint Templates Goals Network PPT Slides-These high quality powerpoint pre-designed slides and powerpoint templates have been carefully created by our professional team to help you impress your audience. All slides have been created and are 100% editable in powerpoint. Each and every property of any graphic - color, size, orientation, shading, outline etc. can be modified to help you build an effective powerpoint presentation. Any text can be entered at any point in the powerpoint template or slide. Simply DOWNLOAD, TYPE and PRESENT!-These PowerPoint presentation slides can be used to represent concepts relating to--Accuracy, accurate, achievement, aim, aiming, arrow, aspirations, background, best, business, center, challenge, chance, circle, competition, competitive, concept, conceptual, dart, decision, efficiency, game, goal, leisure, luck, marketing, objective, perfect, perfection, performance, red, shape, shot, solution, sport, strategy, success, successful, symbol, target, win, winner-Network Diagram of Goals PowerPoint Templates Goals Network PPT Slides Display performance improvement with our Network Diagram Of Goals PowerPoint Templates Goals Network Ppt Slides. They will make you look good.
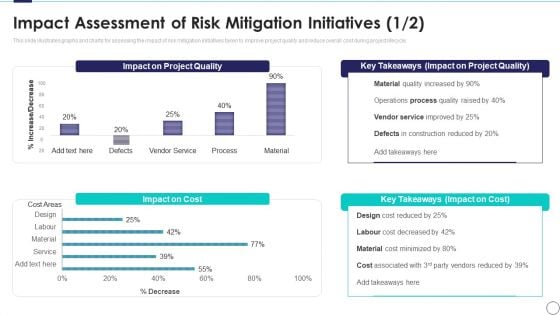
Impact Assessment Of Risk Mitigation Initiatives Risk Assessment And Mitigation Plan Ppt Summary File Formats PDF
This slide illustrates graphs and charts for assessing the impact of risk mitigation initiatives taken to improve project quality and reduce overall cost during project lifecycle. Deliver an awe inspiring pitch with this creative impact assessment of risk mitigation initiatives risk assessment and mitigation plan ppt summary file formats pdf bundle. Topics like impact on cost, material quality increased, impact on project quality can be discussed with this completely editable template. It is available for immediate download depending on the needs and requirements of the user.
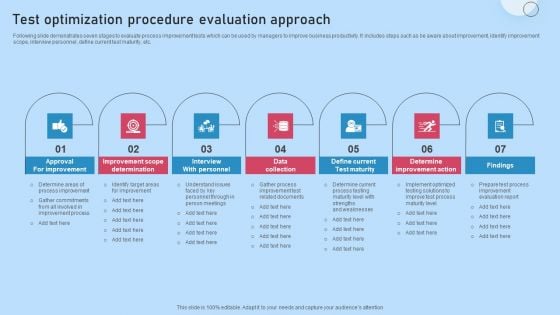
Test Optimization Procedure Evaluation Approach Ideas PDF
Following slide demonstrates seven stages to evaluate process improvement tests which can be used by managers to improve business productivity. It includes steps such as be aware about improvement, identify improvement scope, interview personnel, define current test maturity, etc. Presenting Test Optimization Procedure Evaluation Approach Ideas PDF to dispense important information. This template comprises seven stages. It also presents valuable insights into the topics including Approval For Improvement, Improvement Scope Determination, Interview With Personnel, Data Collection, Define Current Test Maturity. This is a completely customizable PowerPoint theme that can be put to use immediately. So, download it and address the topic impactfully.
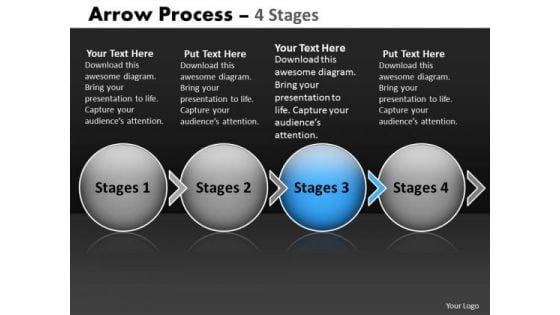
Ppt Theme Circular Flow Of 4 Stage Ishikawa Diagram PowerPoint Template Image
We present our PPT Theme circular flow of 4 stage ishikawa diagram PowerPoint template Image. Use our Arrows PowerPoint Templates because; explain your strategy to co-ordinate activities of these separate groups. Use our Symbol PowerPoint Templates because; Raise your Company stocks at the Opening Bell. Use our Business PowerPoint Templates because; explain your strategy to co-ordinate activities of these separate groups. Use our Process and Flows PowerPoint Templates because, Brilliant ideas popping up all over the place. Use our Marketing PowerPoint Templates because, now spread the fruits of your efforts and elaborate your ideas on the prevention, diagnosis, control and cure of prevalent diseases. Use these PowerPoint slides for presentations relating to Account, Arrow, Arrows, Away, Box, Business, Chart, Choice, Choose, Concept, Concepts, Consultation, Corporate, Design, Diagram, Direction, Elements, Flow, Follow, Follows, Future, Group, Grow, Increase, Lines, Many, Month, Move, Past, Period, Phase, Project, Report, Rise, Row, Step, Success, Text, Time, Timeline, Today, Up, Way, Ways, Work, Year. The prominent colors used in the PowerPoint template are Blue, Gray, and Black Equip your thoughts with our Ppt Theme Circular Flow Of 4 Stage Ishikawa Diagram PowerPoint Template Image. They will prove a worthwhile accessory.
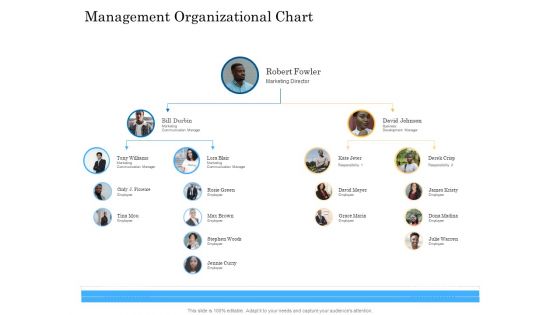
Deal Assessment Audit Process Management Organizational Chart Professional PDF
Presenting deal assessment audit process management organizational chart professional pdf to provide visual cues and insights. Share and navigate important information on seven stages that need your due attention. This template can be used to pitch topics like marketing communication, employee, business development manager. In addition, this PPT design contains high-resolution images, graphics, etc, that are easily editable and available for immediate download.
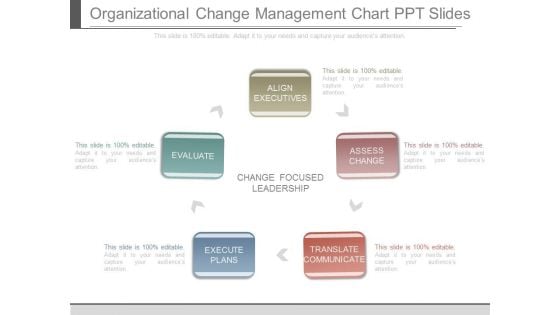
Organizational Change Management Chart Ppt Slides
This is a organizational change management chart ppt slides. This is a five stage process. The stages in this process are align executives, assess change, translate communicate, execute plans, evaluate.
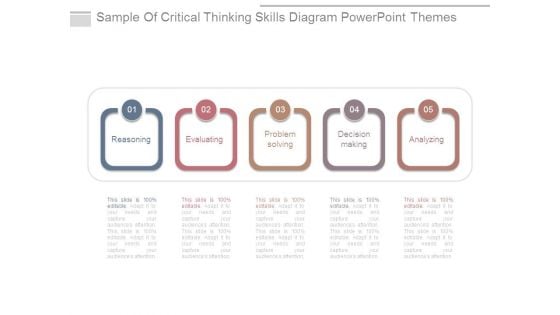
Sample Of Critical Thinking Skills Diagram Powerpoint Themes
This is a sample of critical thinking skills diagram powerpoint themes. This is a five stage process. The stages in this process are reasoning, evaluating, problem solving, decision making, analyzing.
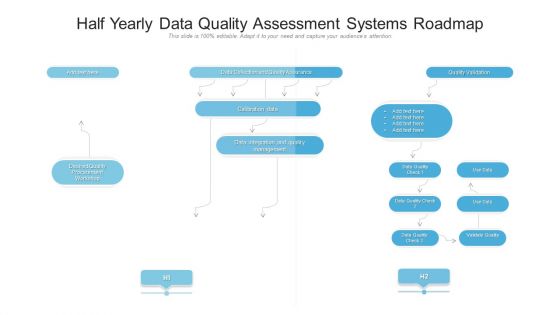
Half Yearly Data Quality Assessment Systems Roadmap Diagrams
We present our half yearly data quality assessment systems roadmap diagrams. This PowerPoint layout is easy-to-edit so you can change the font size, font type, color, and shape conveniently. In addition to this, the PowerPoint layout is Google Slides compatible, so you can share it with your audience and give them access to edit it. Therefore, download and save this well-researched half yearly data quality assessment systems roadmap diagrams in different formats like PDF, PNG, and JPG to smoothly execute your business plan.

 Home
Home