Feedback Loop Icon
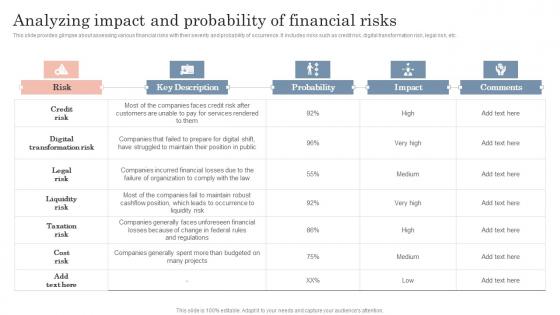
Analyzing Impact And Probability Of Guide To Corporate Financial Growth Plan Diagrams Pdf
This slide provides glimpse about assessing various financial risks with their severity and probability of occurrence. It includes risks such as credit risk, digital transformation risk, legal risk, etc.Get a simple yet stunning designed Analyzing Impact And Probability Of Guide To Corporate Financial Growth Plan Diagrams Pdf. It is the best one to establish the tone in your meetings. It is an excellent way to make your presentations highly effective. So, download this PPT today from Slidegeeks and see the positive impacts. Our easy-to-edit Analyzing Impact And Probability Of Guide To Corporate Financial Growth Plan Diagrams Pdf can be your go-to option for all upcoming conferences and meetings. So, what are you waiting for Grab this template today. This slide provides glimpse about assessing various financial risks with their severity and probability of occurrence. It includes risks such as credit risk, digital transformation risk, legal risk, etc.
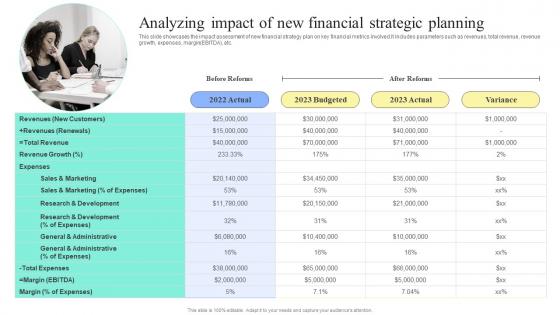
Strategic Financial Planning And Administration Analyzing Impact Of New Financial Diagrams PDF
This slide showcases the impact assessment of new financial strategy plan on key financial metrics involved.It includes parameters such as revenues, total revenue, revenue growth, expenses, margin EBITDA, etc. Get a simple yet stunning designed Strategic Financial Planning And Administration Analyzing Impact Of New Financial Diagrams PDF. It is the best one to establish the tone in your meetings. It is an excellent way to make your presentations highly effective. So, download this PPT today from Slidegeeks and see the positive impacts. Our easy-to-edit Strategic Financial Planning And Administration Analyzing Impact Of New Financial Diagrams PDF can be your go-to option for all upcoming conferences and meetings. So, what are you waiting for Grab this template today. This slide showcases the impact assessment of new financial strategy plan on key financial metrics involved.It includes parameters such as revenues, total revenue, revenue growth, expenses, marginEBITDA, etc.
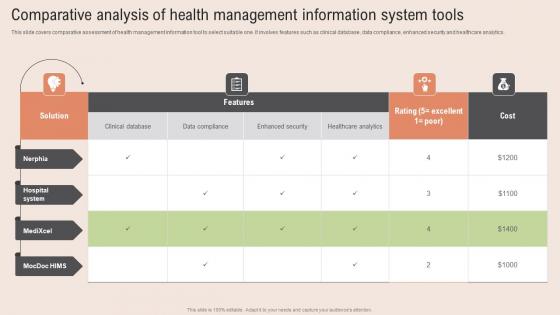
Comparative Analysis Health Healthcare Information Tech To Enhance Medical Facilities Diagrams Pdf
This slide covers comparative assessment of health management information tool to select suitable one. It involves features such as clinical database, data compliance, enhanced security and healthcare analytics. Do you have to make sure that everyone on your team knows about any specific topic I yes, then you should give Comparative Analysis Health Healthcare Information Tech To Enhance Medical Facilities Diagrams Pdf a try. Our experts have put a lot of knowledge and effort into creating this impeccable Comparative Analysis Health Healthcare Information Tech To Enhance Medical Facilities Diagrams Pdf. You can use this template for your upcoming presentations, as the slides are perfect to represent even the tiniest detail. You can download these templates from the Slidegeeks website and these are easy to edit. So grab these today This slide covers comparative assessment of health management information tool to select suitable one. It involves features such as clinical database, data compliance, enhanced security and healthcare analytics.

Summary Financial Accounting Statement Profit And Loss Analysis Dashboard Elements PDF
This graph or chart is linked to excel, and changes automatically based on data. Just left click on it and select Edit Data. Deliver an awe inspiring pitch with this creative Summary Financial Accounting Statement Profit And Loss Analysis Dashboard Elements PDF bundle. Topics like P And L Structure Dynamics, Dupont Rations, Debt Coverage Ratios, Creditworthiness Assessment can be discussed with this completely editable template. It is available for immediate download depending on the needs and requirements of the user.
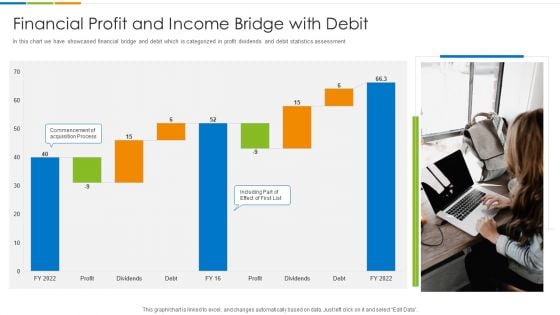
Financial Profit And Income Bridge With Debit Ppt PowerPoint Presentation File Outline PDF
In this chart we have showcased financial bridge and debit which is categorized in profit dividends and debit statistics assessment. Pitch your topic with ease and precision using this Financial Profit And Income Bridge With Debit Ppt PowerPoint Presentation File Outline PDF. This layout presents information on Profit Dividends, Debt Commencement, Acquisition Process. It is also available for immediate download and adjustment. So, changes can be made in the color, design, graphics or any other component to create a unique layout.
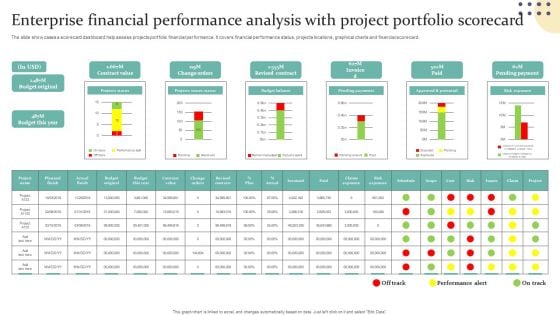
Enterprise Financial Performance Analysis With Project Portfolio Scorecard Guidelines PDF
The slide showcases a scorecard dashboard help assess projects portfolio financial performance. It covers financial performance status, projects locations, graphical charts and financial scorecard. Showcasing this set of slides titled Enterprise Financial Performance Analysis With Project Portfolio Scorecard Guidelines PDF. The topics addressed in these templates are Projects Status, Projects Issues Status, Budget Balance. All the content presented in this PPT design is completely editable. Download it and make adjustments in color, background, font etc. as per your unique business setting.
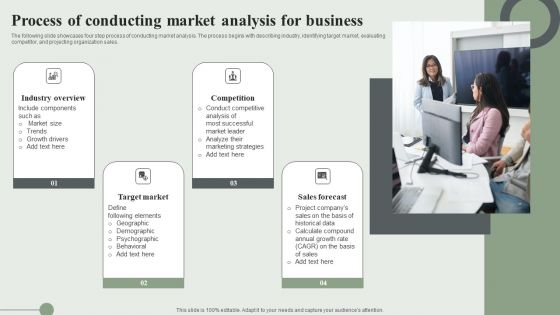
Process Of Conducting Market Analysis For Business Ppt PowerPoint Presentation Diagram PDF
The following slide showcases four step process of conducting market analysis. The process begins with describing industry, identifying target market, evaluating competitor, and projecting organization sales. If you are looking for a format to display your unique thoughts, then the professionally designed Process Of Conducting Market Analysis For Business Ppt PowerPoint Presentation Diagram PDF is the one for you. You can use it as a Google Slides template or a PowerPoint template. Incorporate impressive visuals, symbols, images, and other charts. Modify or reorganize the text boxes as you desire. Experiment with shade schemes and font pairings. Alter, share or cooperate with other people on your work. Download Process Of Conducting Market Analysis For Business Ppt PowerPoint Presentation Diagram PDF and find out how to give a successful presentation. Present a perfect display to your team and make your presentation unforgettable.
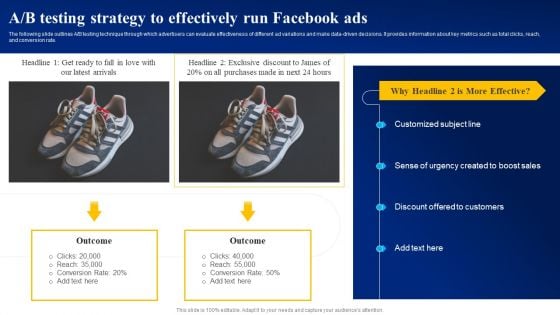
A B Testing Strategy To Effectively Run Facebook Ads Ppt PowerPoint Presentation Diagram PDF
The following slide outlines A or B testing technique through which advertisers can evaluate effectiveness of different ad variations and make data-driven decisions. It provides information about key metrics such as total clicks, reach, and conversion rate. If you are looking for a format to display your unique thoughts, then the professionally designed A B Testing Strategy To Effectively Run Facebook Ads Ppt PowerPoint Presentation Diagram PDF is the one for you. You can use it as a Google Slides template or a PowerPoint template. Incorporate impressive visuals, symbols, images, and other charts. Modify or reorganize the text boxes as you desire. Experiment with shade schemes and font pairings. Alter, share or cooperate with other people on your work. Download A B Testing Strategy To Effectively Run Facebook Ads Ppt PowerPoint Presentation Diagram PDF and find out how to give a successful presentation. Present a perfect display to your team and make your presentation unforgettable.
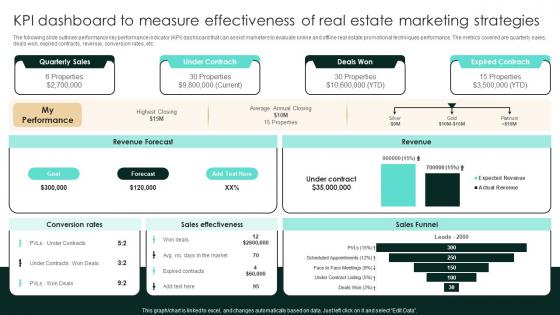
KPI Dashboard To Measure Effectiveness Of Real Estate Marketing Strategic Real Estate Structure Pdf
The following slide outlines performance key performance indicator KPI dashboard that can assist marketers to evaluate online and offline real estate promotional techniques performance. The metrics covered are quarterly sales, deals won, expired contracts, revenue, conversion rates, etc. Here you can discover an assortment of the finest PowerPoint and Google Slides templates. With these templates, you can create presentations for a variety of purposes while simultaneously providing your audience with an eye-catching visual experience. Download KPI Dashboard To Measure Effectiveness Of Real Estate Marketing Strategic Real Estate Structure Pdf to deliver an impeccable presentation. These templates will make your job of preparing presentations much quicker, yet still, maintain a high level of quality. Slidegeeks has experienced researchers who prepare these templates and write high-quality content for you. Later on, you can personalize the content by editing the KPI Dashboard To Measure Effectiveness Of Real Estate Marketing Strategic Real Estate Structure Pdf The following slide outlines performance key performance indicator KPI dashboard that can assist marketers to evaluate online and offline real estate promotional techniques performance. The metrics covered are quarterly sales, deals won, expired contracts, revenue, conversion rates, etc.
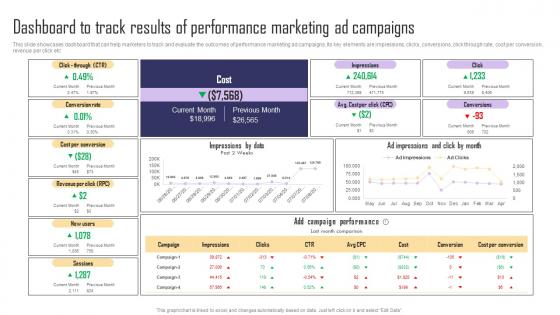
Dashboard To Track Results Of Performance Marketing Paid Internet Marketing Strategy Information Pdf
This slide showcases dashboard that can help marketers to track and evaluate the outcomes of performance marketing ad campaigns. Its key elements are impressions, clicks, conversions, click through rate, cost per conversion, revenue per click etc. Do you have an important presentation coming up Are you looking for something that will make your presentation stand out from the rest Look no further than Dashboard To Track Results Of Performance Marketing Paid Internet Marketing Strategy Information Pdf. With our professional designs, you can trust that your presentation will pop and make delivering it a smooth process. And with Slidegeeks, you can trust that your presentation will be unique and memorable. So why wait Grab Dashboard To Track Results Of Performance Marketing Paid Internet Marketing Strategy Information Pdf today and make your presentation stand out from the rest. This slide showcases dashboard that can help marketers to track and evaluate the outcomes of performance marketing ad campaigns. Its key elements are impressions, clicks, conversions, click through rate, cost per conversion, revenue per click etc.
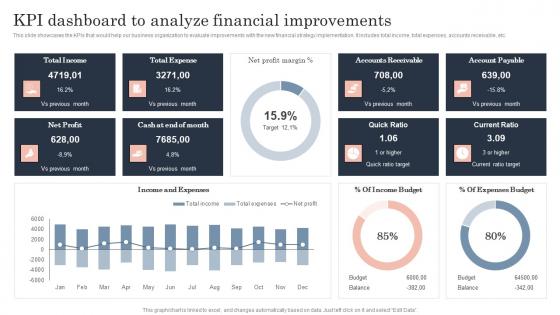
Kpi Dashboard To Analyze Financial Guide To Corporate Financial Growth Plan Designs Pdf
This slide showcases the KPIs that would help our business organization to evaluate improvements with the new financial strategy implementation. It includes total income, total expenses, accounts receivable, etc.Presenting this PowerPoint presentation, titled Kpi Dashboard To Analyze Financial Guide To Corporate Financial Growth Plan Designs Pdf, with topics curated by our researchers after extensive research. This editable presentation is available for immediate download and provides attractive features when used. Download now and captivate your audience. Presenting this Kpi Dashboard To Analyze Financial Guide To Corporate Financial Growth Plan Designs Pdf. Our researchers have carefully researched and created these slides with all aspects taken into consideration. This is a completely customizable Kpi Dashboard To Analyze Financial Guide To Corporate Financial Growth Plan Designs Pdf that is available for immediate downloading. Download now and make an impact on your audience. Highlight the attractive features available with our PPTs. This slide showcases the KPIs that would help our business organization to evaluate improvements with the new financial strategy implementation. It includes total income, total expenses, accounts receivable, etc.
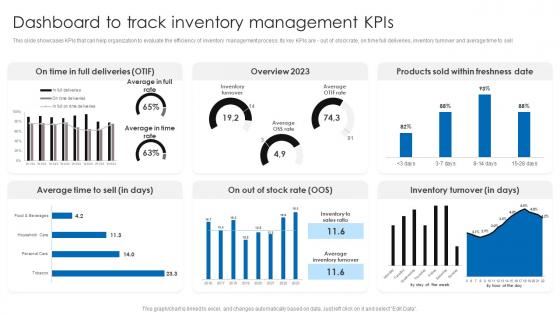
Dashboard To Track Inventory Management Kpis Retail Stock Administration Strategies Rules Pdf
This slide showcases KPIs that can help organization to evaluate the efficiency of inventory management process. Its key KPIs are - out of stock rate, on time full deliveries, inventory turnover and average time to sell.Coming up with a presentation necessitates that the majority of the effort goes into the content and the message you intend to convey. The visuals of a PowerPoint presentation can only be effective if it supplements and supports the story that is being told. Keeping this in mind our experts created Dashboard To Track Inventory Management Kpis Retail Stock Administration Strategies Rules Pdf to reduce the time that goes into designing the presentation. This way, you can concentrate on the message while our designers take care of providing you with the right template for the situation. This slide showcases KPIs that can help organization to evaluate the efficiency of inventory management process. Its key KPIs are out of stock rate, on time full deliveries, inventory turnover and average time to sell
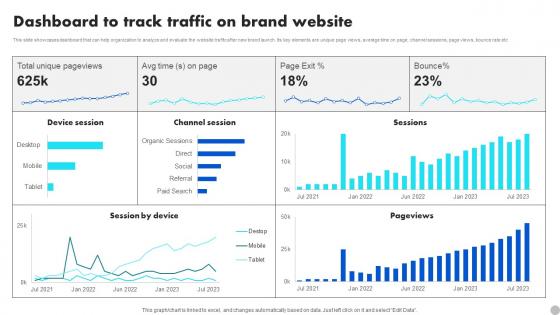
Dashboard To Track Traffic On Brand Website Brand Diversification Approach Rules Pdf
This slide showcases dashboard that can help organization to analyze and evaluate the website traffic after new brand launch. Its key elements are unique page views, average time on page, channel sessions, page views, bounce rate etc. Are you in need of a template that can accommodate all of your creative concepts This one is crafted professionally and can be altered to fit any style. Use it with Google Slides or PowerPoint. Include striking photographs, symbols, depictions, and other visuals. Fill, move around, or remove text boxes as desired. Test out color palettes and font mixtures. Edit and save your work, or work with colleagues. Download Dashboard To Track Traffic On Brand Website Brand Diversification Approach Rules Pdf and observe how to make your presentation outstanding. Give an impeccable presentation to your group and make your presentation unforgettable. This slide showcases dashboard that can help organization to analyze and evaluate the website traffic after new brand launch. Its key elements are unique page views, average time on page, channel sessions, page views, bounce rate etc.
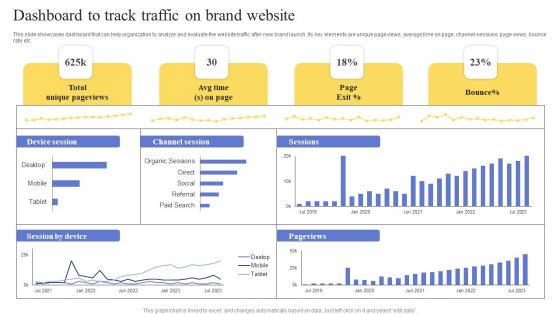
Dashboard To Track Traffic On Brand Website Maximizing Revenue Using Professional Pdf
This slide showcases dashboard that can help organization to analyze and evaluate the website traffic after new brand launch. Its key elements are unique page views, average time on page, channel sessions, page views, bounce rate etc. Are you in need of a template that can accommodate all of your creative concepts This one is crafted professionally and can be altered to fit any style. Use it with Google Slides or PowerPoint. Include striking photographs, symbols, depictions, and other visuals. Fill, move around, or remove text boxes as desired. Test out color palettes and font mixtures. Edit and save your work, or work with colleagues. Download Dashboard To Track Traffic On Brand Website Maximizing Revenue Using Professional Pdf and observe how to make your presentation outstanding. Give an impeccable presentation to your group and make your presentation unforgettable. This slide showcases dashboard that can help organization to analyze and evaluate the website traffic after new brand launch. Its key elements are unique page views, average time on page, channel sessions, page views, bounce rate etc.
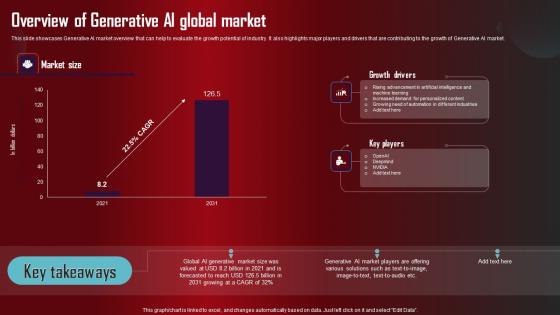
Overview Of Generative AI Global Market Role Of Generative AI Tools Across Slides Pdf
This slide showcases Generative AI market overview that can help to evaluate the growth potential of industry. It also highlights major players and drivers that are contributing to the growth of Generative AI market. Do you have to make sure that everyone on your team knows about any specific topic I yes, then you should give Overview Of Generative AI Global Market Role Of Generative AI Tools Across Slides Pdf a try. Our experts have put a lot of knowledge and effort into creating this impeccable Overview Of Generative AI Global Market Role Of Generative AI Tools Across Slides Pdf. You can use this template for your upcoming presentations, as the slides are perfect to represent even the tiniest detail. You can download these templates from the Slidegeeks website and these are easy to edit. So grab these today. This slide showcases Generative AI market overview that can help to evaluate the growth potential of industry. It also highlights major players and drivers that are contributing to the growth of Generative AI market.
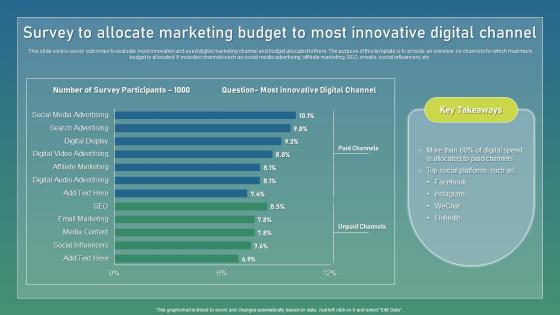
Survey To Allocate Marketing Budget Strategic Guide For Sustainable Sample Pdf
This slide covers survey outcomes to evaluate most innovative and used digital marketing channel and budget allocated to them. The purpose of this template is to provide an overview on channels for which maximum budget is allocated. It includes channels such as social media advertising, affiliate marketing, SEO, emails, social influencers, etc. Want to ace your presentation in front of a live audience Our Survey To Allocate Marketing Budget Strategic Guide For Sustainable Sample Pdf can help you do that by engaging all the users towards you. Slidegeeks experts have put their efforts and expertise into creating these impeccable powerpoint presentations so that you can communicate your ideas clearly. Moreover, all the templates are customizable, and easy to edit and downloadable. Use these for both personal and commercial use. This slide covers survey outcomes to evaluate most innovative and used digital marketing channel and budget allocated to them. The purpose of this template is to provide an overview on channels for which maximum budget is allocated. It includes channels such as social media advertising, affiliate marketing, SEO, emails, social influencers, etc.
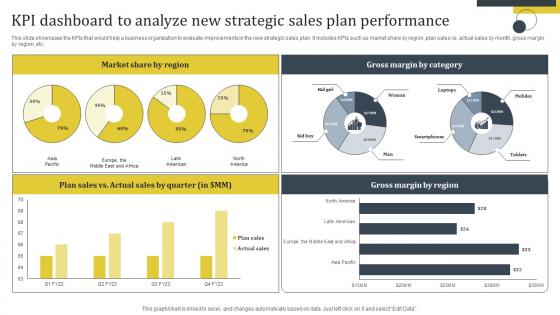
Enhance Customer Retention Kpi Dashboard To Analyze New Strategic Sales Plan Elements Pdf
This slide showcases the KPIs that would help a business organization to evaluate improvements in the new strategic sales plan. It includes KPIs such as market share by region, plan sales vs. actual sales by month, gross margin by region, etc. Welcome to our selection of the Enhance Customer Retention Kpi Dashboard To Analyze New Strategic Sales Plan Elements Pdf. These are designed to help you showcase your creativity and bring your sphere to life. Planning and Innovation are essential for any business that is just starting out. This collection contains the designs that you need for your everyday presentations. All of our PowerPoints are 100 percent editable, so you can customize them to suit your needs. This multi-purpose template can be used in various situations. Grab these presentation templates today. This slide showcases the KPIs that would help a business organization to evaluate improvements in the new strategic sales plan. It includes KPIs such as market share by region, plan sales vs. actual sales by month, gross margin by region, etc.
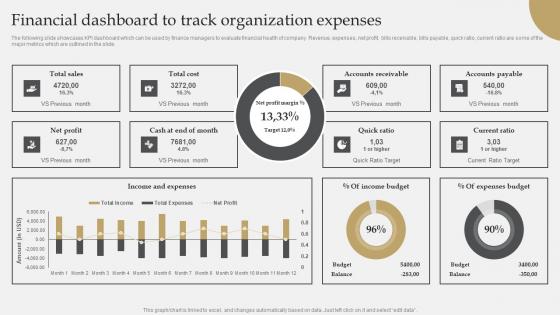
IT Industry Market Research Financial Dashboard To Track Organization Expenses Introduction Pdf
The following slide showcases KPI dashboard which can be used by finance managers to evaluate financial health of company. Revenue, expenses, net profit, bills receivable, bills payable, quick ratio, current ratio are some of the major metrics which are outlined in the slide. Present like a pro with IT Industry Market Research Financial Dashboard To Track Organization Expenses Introduction Pdf Create beautiful presentations together with your team, using our easy-to-use presentation slides. Share your ideas in real-time and make changes on the fly by downloading our templates. So whether you are in the office, on the go, or in a remote location, you can stay in sync with your team and present your ideas with confidence. With Slidegeeks presentation got a whole lot easier. Grab these presentations today. The following slide showcases KPI dashboard which can be used by finance managers to evaluate financial health of company. Revenue, expenses, net profit, bills receivable, bills payable, quick ratio, current ratio are some of the major metrics which are outlined in the slide.
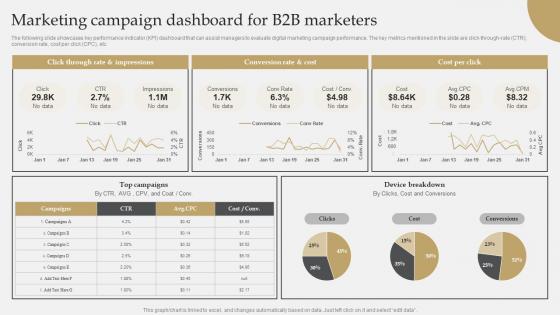
IT Industry Market Research Marketing Campaign Dashboard For B2b Marketers Demonstration Pdf
The following slide showcases key performance indicator KPI dashboard that can assist managers to evaluate digital marketing campaign performance. The key metrics mentioned in the slide are click-through-rate CTR, conversion rate, cost per click CPC, etc. Are you in need of a template that can accommodate all of your creative concepts This one is crafted professionally and can be altered to fit any style. Use it with Google Slides or PowerPoint. Include striking photographs, symbols, depictions, and other visuals. Fill, move around, or remove text boxes as desired. Test out color palettes and font mixtures. Edit and save your work, or work with colleagues. Download IT Industry Market Research Marketing Campaign Dashboard For B2b Marketers Demonstration Pdf and observe how to make your presentation outstanding. Give an impeccable presentation to your group and make your presentation unforgettable. The following slide showcases key performance indicator KPI dashboard that can assist managers to evaluate digital marketing campaign performance. The key metrics mentioned in the slide are click-through-rate CTR, conversion rate, cost per click CPC, etc.
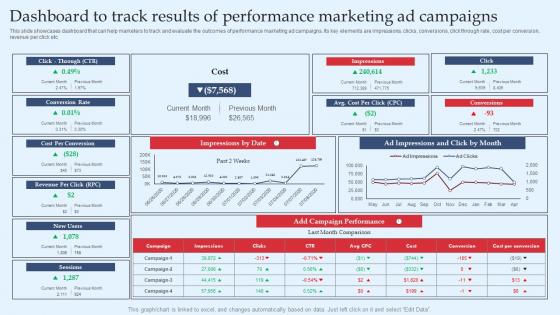
Strategic Performance Marketing Campaign Dashboard To Track Results Of Performance Inspiration Pdf
This slide showcases dashboard that can help marketers to track and evaluate the outcomes of performance marketing ad campaigns. Its key elements are impressions, clicks, conversions, click through rate, cost per conversion, revenue per click etc. Crafting an eye-catching presentation has never been more straightforward. Let your presentation shine with this tasteful yet straightforward Strategic Performance Marketing Campaign Dashboard To Track Results Of Performance Inspiration Pdf template. It offers a minimalistic and classy look that is great for making a statement. The colors have been employed intelligently to add a bit of playfulness while still remaining professional. Construct the ideal Strategic Performance Marketing Campaign Dashboard To Track Results Of Performance Inspiration Pdf that effortlessly grabs the attention of your audience. Begin now and be certain to wow your customers. This slide showcases dashboard that can help marketers to track and evaluate the outcomes of performance marketing ad campaigns. Its key elements are impressions, clicks, conversions, click through rate, cost per conversion, revenue per click etc.
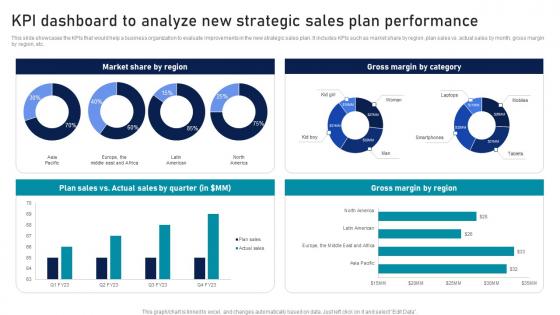
KPI Dashboard To Analyze New Strategic Sales Plan Strategic Sales Plan To Enhance Ideas Pdf
This slide showcases the KPIs that would help a business organization to evaluate improvements in the new strategic sales plan. It includes KPIs such as market share by region, plan sales vs. actual sales by month, gross margin by region, etc. Explore a selection of the finest KPI Dashboard To Analyze New Strategic Sales Plan Strategic Sales Plan To Enhance Ideas Pdf here. With a plethora of professionally designed and pre-made slide templates, you can quickly and easily find the right one for your upcoming presentation. You can use our KPI Dashboard To Analyze New Strategic Sales Plan Strategic Sales Plan To Enhance Ideas Pdf to effectively convey your message to a wider audience. Slidegeeks has done a lot of research before preparing these presentation templates. The content can be personalized and the slides are highly editable. Grab templates today from Slidegeeks. This slide showcases the KPIs that would help a business organization to evaluate improvements in the new strategic sales plan. It includes KPIs such as market share by region, plan sales vs. actual sales by month, gross margin by region, etc.
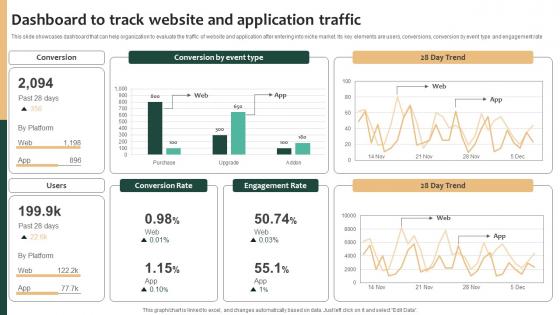
Tailored Product Approach Dashboard To Track Website And Application Traffic Structure Pdf
This slide showcases dashboard that can help organization to evaluate the traffic of website and application after entering into niche market. Its key elements are users, conversions, conversion by event type and engagement rate. Do you have to make sure that everyone on your team knows about any specific topic I yes, then you should give Tailored Product Approach Dashboard To Track Website And Application Traffic Structure Pdf a try. Our experts have put a lot of knowledge and effort into creating this impeccable Tailored Product Approach Dashboard To Track Website And Application Traffic Structure Pdf You can use this template for your upcoming presentations, as the slides are perfect to represent even the tiniest detail. You can download these templates from the Slidegeeks website and these are easy to edit. So grab these today This slide showcases dashboard that can help organization to evaluate the traffic of website and application after entering into niche market. Its key elements are users, conversions, conversion by event type and engagement rate
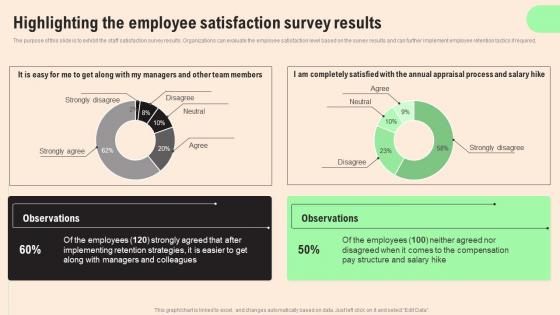
Highlighting Employee Satisfaction HR Retention Techniques For Business Owners Information Pdf
The purpose of this slide is to exhibit the staff satisfaction survey results. Organizations can evaluate the employee satisfaction level based on the survey results and can further implement employee retention tactics if required. Here you can discover an assortment of the finest PowerPoint and Google Slides templates. With these templates, you can create presentations for a variety of purposes while simultaneously providing your audience with an eye catching visual experience. Download Highlighting Employee Satisfaction HR Retention Techniques For Business Owners Information Pdf to deliver an impeccable presentation. These templates will make your job of preparing presentations much quicker, yet still, maintain a high level of quality. Slidegeeks has experienced researchers who prepare these templates and write high quality content for you. Later on, you can personalize the content by editing the Highlighting Employee Satisfaction HR Retention Techniques For Business Owners Information Pdf. The purpose of this slide is to exhibit the staff satisfaction survey results. Organizations can evaluate the employee satisfaction level based on the survey results and can further implement employee retention tactics if required.
Dashboard For Tracking Ambassador Techniques For Generating Brand Awareness Graphics Pdf
This slide covers the KPI dashboard for companies to evaluate the performance of ambassador marketing campaigns. It includes metrics such as the number of brand ambassadors, the total number of shares, clicks, CPS, revenue, commissions, etc. Do you have an important presentation coming up Are you looking for something that will make your presentation stand out from the rest Look no further than Dashboard For Tracking Ambassador Techniques For Generating Brand Awareness Graphics Pdf. With our professional designs, you can trust that your presentation will pop and make delivering it a smooth process. And with Slidegeeks, you can trust that your presentation will be unique and memorable. So why wait Grab Dashboard For Tracking Ambassador Techniques For Generating Brand Awareness Graphics Pdf today and make your presentation stand out from the rest This slide covers the KPI dashboard for companies to evaluate the performance of ambassador marketing campaigns. It includes metrics such as the number of brand ambassadors, the total number of shares, clicks, CPS, revenue, commissions, etc.
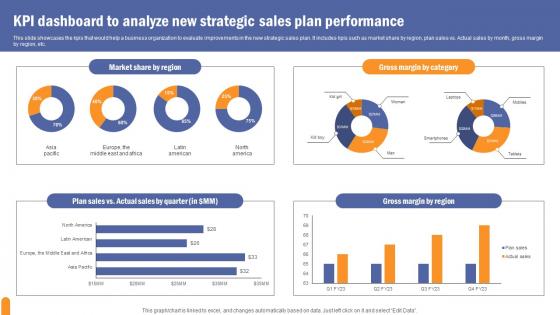
KPI Dashboard To Analyze Developing Extensive Sales And Operations Strategy Slides Pdf
This slide showcases the kpis that would help a business organization to evaluate improvements in the new strategic sales plan. It includes kpis such as market share by region, plan sales vs. Actual sales by month, gross margin by region, etc. Explore a selection of the finest KPI Dashboard To Analyze Developing Extensive Sales And Operations Strategy Slides Pdf here. With a plethora of professionally designed and pre made slide templates, you can quickly and easily find the right one for your upcoming presentation. You can use our KPI Dashboard To Analyze Developing Extensive Sales And Operations Strategy Slides Pdf to effectively convey your message to a wider audience. Slidegeeks has done a lot of research before preparing these presentation templates. The content can be personalized and the slides are highly editable. Grab templates today from Slidegeeks. This slide showcases the kpis that would help a business organization to evaluate improvements in the new strategic sales plan. It includes kpis such as market share by region, plan sales vs. Actual sales by month, gross margin by region, etc.
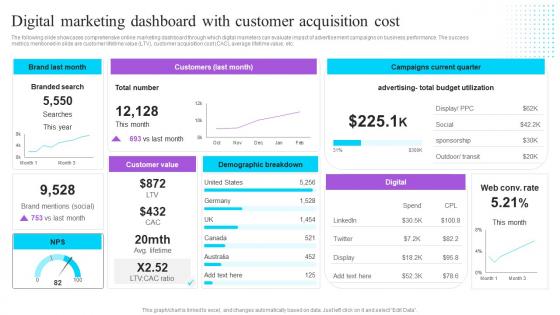
Digital Marketing Dashboard With Customer Effective GTM Techniques Clipart PDF
The following slide showcases comprehensive online marketing dashboard through which digital marketers can evaluate impact of advertisement campaigns on business performance. The success metrics mentioned in slide are customer lifetime value LTV, customer acquisition cost CAC, average lifetime value, etc. Slidegeeks is here to make your presentations a breeze with Digital Marketing Dashboard With Customer Effective GTM Techniques Clipart PDF With our easy-to-use and customizable templates, you can focus on delivering your ideas rather than worrying about formatting. With a variety of designs to choose from, you are sure to find one that suits your needs. And with animations and unique photos, illustrations, and fonts, you can make your presentation pop. So whether you are giving a sales pitch or presenting to the board, make sure to check out Slidegeeks first The following slide showcases comprehensive online marketing dashboard through which digital marketers can evaluate impact of advertisement campaigns on business performance. The success metrics mentioned in slide are customer lifetime value LTV, customer acquisition cost CAC, average lifetime value, etc.
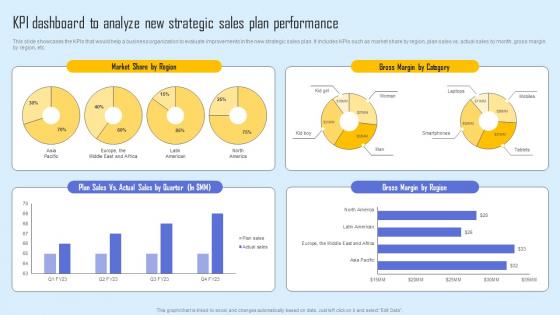
KPI Dashboard Analyze New Effective Sales Strategy To Enhance Customer Retention Background Pdf
This slide showcases the KPIs that would help a business organization to evaluate improvements in the new strategic sales plan. It includes KPIs such as market share by region, plan sales vs. actual sales by month, gross margin by region, etc. Explore a selection of the finest KPI Dashboard Analyze New Effective Sales Strategy To Enhance Customer Retention Background Pdf here. With a plethora of professionally designed and pre made slide templates, you can quickly and easily find the right one for your upcoming presentation. You can use our KPI Dashboard Analyze New Effective Sales Strategy To Enhance Customer Retention Background Pdf to effectively convey your message to a wider audience. Slidegeeks has done a lot of research before preparing these presentation templates. The content can be personalized and the slides are highly editable. Grab templates today from Slidegeeks. This slide showcases the KPIs that would help a business organization to evaluate improvements in the new strategic sales plan. It includes KPIs such as market share by region, plan sales vs. actual sales by month, gross margin by region, etc.
Dashboard For Tracking Ambassador Marketing Tracking Word Mouth Marketing Summary PDF
This slide covers the KPI dashboard for companies to evaluate the performance of ambassador marketing campaigns. It includes metrics such as the number of brand ambassadors, the total number of shares, clicks, CPS, revenue, commissions, etc. Do you have an important presentation coming up Are you looking for something that will make your presentation stand out from the rest Look no further than Dashboard For Tracking Ambassador Marketing Tracking Word Mouth Marketing Summary PDF. With our professional designs, you can trust that your presentation will pop and make delivering it a smooth process. And with Slidegeeks, you can trust that your presentation will be unique and memorable. So why wait Grab Dashboard For Tracking Ambassador Marketing Tracking Word Mouth Marketing Summary PDF today and make your presentation stand out from the rest This slide covers the KPI dashboard for companies to evaluate the performance of ambassador marketing campaigns. It includes metrics such as the number of brand ambassadors, the total number of shares, clicks, CPS, revenue, commissions, etc.
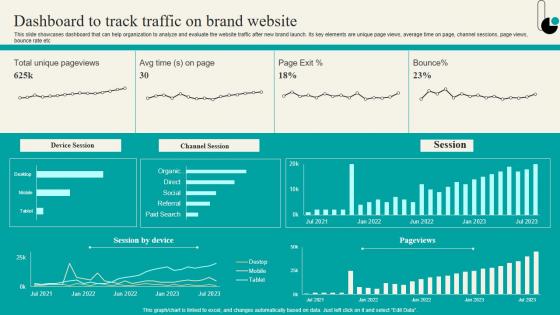
Dashboard To Track Traffic On Brand Website Strategic Marketing Plan Structure PDF
This slide showcases dashboard that can help organization to analyze and evaluate the website traffic after new brand launch. Its key elements are unique page views, average time on page, channel sessions, page views, bounce rate etc. Are you in need of a template that can accommodate all of your creative concepts This one is crafted professionally and can be altered to fit any style. Use it with Google Slides or PowerPoint. Include striking photographs, symbols, depictions, and other visuals. Fill, move around, or remove text boxes as desired. Test out color palettes and font mixtures. Edit and save your work, or work with colleagues. Download Dashboard To Track Traffic On Brand Website Strategic Marketing Plan Structure PDF and observe how to make your presentation outstanding. Give an impeccable presentation to your group and make your presentation unforgettable. This slide showcases dashboard that can help organization to analyze and evaluate the website traffic after new brand launch. Its key elements are unique page views, average time on page, channel sessions, page views, bounce rate etc.
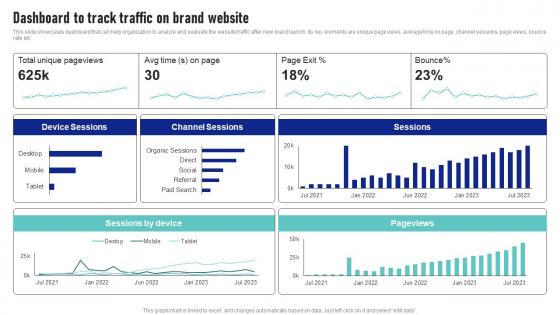
Dashboard To Track Traffic On Brand Website Launching New Product Brand Sample Pdf
This slide showcases dashboard that can help organization to analyze and evaluate the website traffic after new brand launch. Its key elements are unique page views, average time on page, channel sessions, page views, bounce rate etc Are you in need of a template that can accommodate all of your creative concepts This one is crafted professionally and can be altered to fit any style. Use it with Google Slides or PowerPoint. Include striking photographs, symbols, depictions, and other visuals. Fill, move around, or remove text boxes as desired. Test out color palettes and font mixtures. Edit and save your work, or work with colleagues. Download Dashboard To Track Traffic On Brand Website Launching New Product Brand Sample Pdf and observe how to make your presentation outstanding. Give an impeccable presentation to your group and make your presentation unforgettable. This slide showcases dashboard that can help organization to analyze and evaluate the website traffic after new brand launch. Its key elements are unique page views, average time on page, channel sessions, page views, bounce rate etc
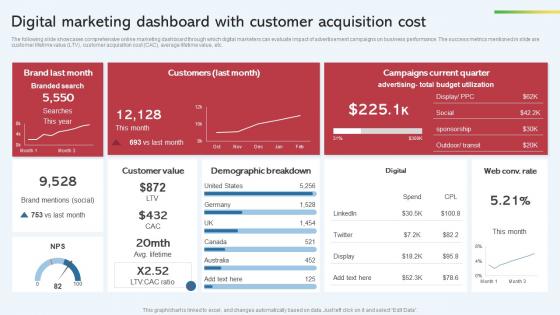
Digital Marketing Dashboard With Customer Acquisition Cost Effective Startup Promotion Plan Formats Pdf
The following slide showcases comprehensive online marketing dashboard through which digital marketers can evaluate impact of advertisement campaigns on business performance. The success metrics mentioned in slide are customer lifetime value LTV, customer acquisition cost CAC, average lifetime value, etc. Slidegeeks is here to make your presentations a breeze with Digital Marketing Dashboard With Customer Acquisition Cost Effective Startup Promotion Plan Formats Pdf With our easy to use and customizable templates, you can focus on delivering your ideas rather than worrying about formatting. With a variety of designs to choose from, you are sure to find one that suits your needs. And with animations and unique photos, illustrations, and fonts, you can make your presentation pop. So whether you are giving a sales pitch or presenting to the board, make sure to check out Slidegeeks first. The following slide showcases comprehensive online marketing dashboard through which digital marketers can evaluate impact of advertisement campaigns on business performance. The success metrics mentioned in slide are customer lifetime value LTV, customer acquisition cost CAC, average lifetime value, etc.
Dashboard Tracking Ambassador Implementing Social Media Tactics For Boosting WOM Demonstration Pdf
This slide covers the KPI dashboard for companies to evaluate the performance of ambassador marketing campaigns. It includes metrics such as the number of brand ambassadors, the total number of shares, clicks, CPS, revenue, commissions, etc.Find highly impressive Dashboard Tracking Ambassador Implementing Social Media Tactics For Boosting WOM Demonstration Pdf on Slidegeeks to deliver a meaningful presentation. You can save an ample amount of time using these presentation templates. No need to worry to prepare everything from scratch because Slidegeeks experts have already done a huge research and work for you. You need to download Dashboard Tracking Ambassador Implementing Social Media Tactics For Boosting WOM Demonstration Pdf for your upcoming presentation. All the presentation templates are 100 percent editable and you can change the color and personalize the content accordingly. Download now This slide covers the KPI dashboard for companies to evaluate the performance of ambassador marketing campaigns. It includes metrics such as the number of brand ambassadors, the total number of shares, clicks, CPS, revenue, commissions, etc.
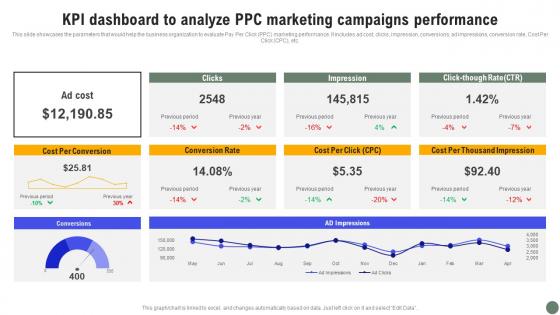
KPI Dashboard To Analyze PPC Exhaustive Guide Of Pay Per Click Advertising Initiatives Inspiration Pdf
This slide showcases the parameters that would help the business organization to evaluate Pay Per Click PPC marketing performance. It includes ad cost, clicks, impression, conversions, ad impressions, conversion rate, Cost Per Click CPC, etc. Formulating a presentation can take up a lot of effort and time, so the content and message should always be the primary focus. The visuals of the PowerPoint can enhance the presenters message, so our KPI Dashboard To Analyze PPC Exhaustive Guide Of Pay Per Click Advertising Initiatives Inspiration Pdf was created to help save time. Instead of worrying about the design, the presenter can concentrate on the message while our designers work on creating the ideal templates for whatever situation is needed. Slidegeeks has experts for everything from amazing designs to valuable content, we have put everything into KPI Dashboard To Analyze PPC Exhaustive Guide Of Pay Per Click Advertising Initiatives Inspiration Pdf This slide showcases the parameters that would help the business organization to evaluate Pay Per Click PPC marketing performance. It includes ad cost, clicks, impression, conversions, ad impressions, conversion rate, Cost Per Click CPC, etc.
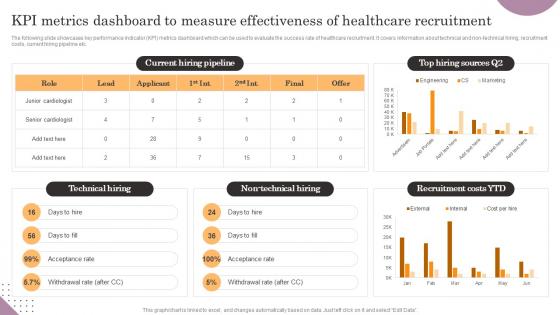
KPI Metrics Dashboard To Measure Effectiveness Of General Management Information Pdf
The following slide showcases key performance indicator KPI metrics dashboard which can be used to evaluate the success rate of healthcare recruitment. It covers information about technical and non-technical hiring, recruitment costs, current hiring pipeline etc. Presenting this PowerPoint presentation, titled KPI Metrics Dashboard To Measure Effectiveness Of General Management Information Pdf, with topics curated by our researchers after extensive research. This editable presentation is available for immediate download and provides attractive features when used. Download now and captivate your audience. Presenting this KPI Metrics Dashboard To Measure Effectiveness Of General Management Information Pdf. Our researchers have carefully researched and created these slides with all aspects taken into consideration. This is a completely customizable KPI Metrics Dashboard To Measure Effectiveness Of General Management Information Pdf that is available for immediate downloading. Download now and make an impact on your audience. Highlight the attractive features available with our PPTs. The following slide showcases key performance indicator KPI metrics dashboard which can be used to evaluate the success rate of healthcare recruitment. It covers information about technical and non-technical hiring, recruitment costs, current hiring pipeline etc.
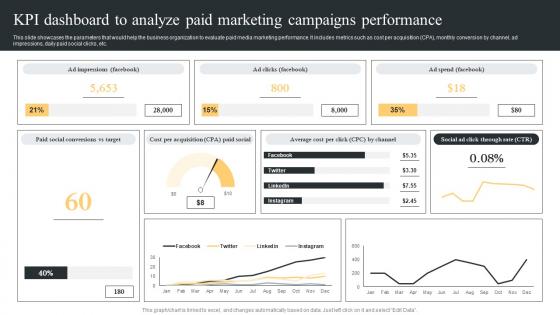
KPI Dashboard To Analyze Paid Comprehensive Guide For Paid Media Marketing Strategies Sample Pdf
This slide showcases the parameters that would help the business organization to evaluate paid media marketing performance. It includes metrics such as cost per acquisition CPA, monthly conversion by channel, ad impressions, daily paid social clicks, etc. Coming up with a presentation necessitates that the majority of the effort goes into the content and the message you intend to convey. The visuals of a PowerPoint presentation can only be effective if it supplements and supports the story that is being told. Keeping this in mind our experts created KPI Dashboard To Analyze Paid Comprehensive Guide For Paid Media Marketing Strategies Sample Pdf to reduce the time that goes into designing the presentation. This way, you can concentrate on the message while our designers take care of providing you with the right template for the situation. This slide showcases the parameters that would help the business organization to evaluate paid media marketing performance. It includes metrics such as cost per acquisition CPA, monthly conversion by channel, ad impressions, daily paid social clicks, etc.
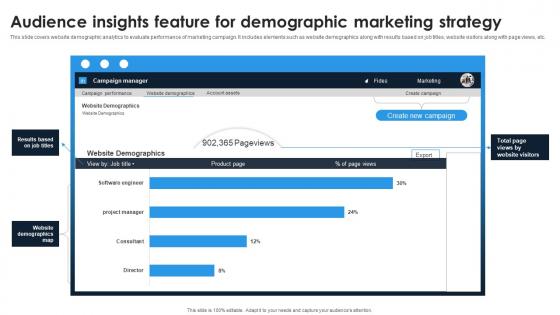
Linkedin Content Strategies Audience Insights Feature For Demographic MKT SS V
This slide covers website demographic analytics to evaluate performance of marketing campaign. It includes elements such as website demographics along with results based on job titles, website visitors along with page views, etc. Do you have to make sure that everyone on your team knows about any specific topic I yes, then you should give Linkedin Content Strategies Audience Insights Feature For Demographic MKT SS V a try. Our experts have put a lot of knowledge and effort into creating this impeccable Linkedin Content Strategies Audience Insights Feature For Demographic MKT SS V. You can use this template for your upcoming presentations, as the slides are perfect to represent even the tiniest detail. You can download these templates from the Slidegeeks website and these are easy to edit. So grab these today This slide covers website demographic analytics to evaluate performance of marketing campaign. It includes elements such as website demographics along with results based on job titles, website visitors along with page views, etc.
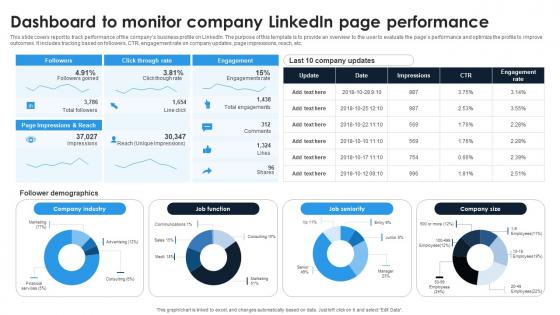
Linkedin Content Strategies Dashboard To Monitor Company Linkedin Page MKT SS V
This slide covers report to track performance of the compans business profile on LinkedIn. The purpose of this template is to provide an overview to the user to evaluate the pages performance and optimize the profile to improve outcomes. It includes tracking based on followers, CTR, engagement rate on company updates, page impressions, reach, etc. Slidegeeks is here to make your presentations a breeze with Linkedin Content Strategies Dashboard To Monitor Company Linkedin Page MKT SS V With our easy-to-use and customizable templates, you can focus on delivering your ideas rather than worrying about formatting. With a variety of designs to choose from, you are sure to find one that suits your needs. And with animations and unique photos, illustrations, and fonts, you can make your presentation pop. So whether you are giving a sales pitch or presenting to the board, make sure to check out Slidegeeks first This slide covers report to track performance of the compans business profile on LinkedIn. The purpose of this template is to provide an overview to the user to evaluate the pages performance and optimize the profile to improve outcomes. It includes tracking based on followers, CTR, engagement rate on company updates, page impressions, reach, etc.
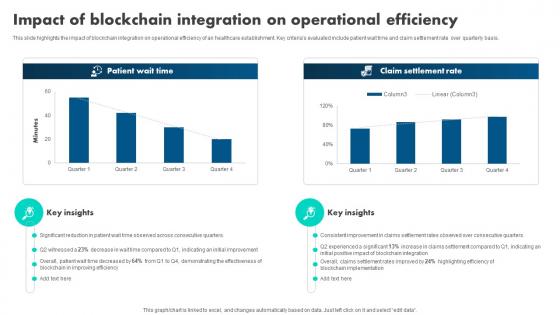
How Blockchain Is Reshaping Impact Of Blockchain Integration On Operational BCT SS V
This slide highlights the impact of blockchain integration on operational efficiency of an healthcare establishment. Key criterias evaluated include patient wait time and claim settlement rate over quarterly basis. Presenting this PowerPoint presentation, titled How Blockchain Is Reshaping Impact Of Blockchain Integration On Operational BCT SS V, with topics curated by our researchers after extensive research. This editable presentation is available for immediate download and provides attractive features when used. Download now and captivate your audience. Presenting this How Blockchain Is Reshaping Impact Of Blockchain Integration On Operational BCT SS V. Our researchers have carefully researched and created these slides with all aspects taken into consideration. This is a completely customizable How Blockchain Is Reshaping Impact Of Blockchain Integration On Operational BCT SS V that is available for immediate downloading. Download now and make an impact on your audience. Highlight the attractive features available with our PPTs. This slide highlights the impact of blockchain integration on operational efficiency of an healthcare establishment. Key criterias evaluated include patient wait time and claim settlement rate over quarterly basis.
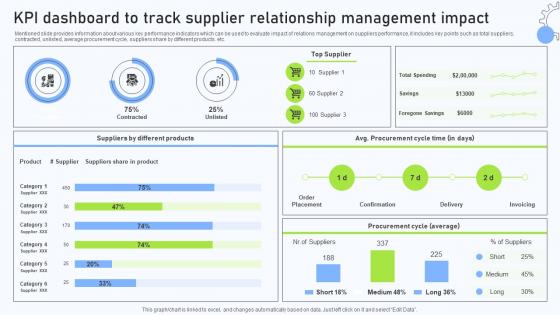
Relationship Management Automation KPI Dashboard To Track Supplier Relationship
Mentioned slide provides information about various key performance indicators which can be used to evaluate impact of relations management on suppliers performance, it includes key points such as total suppliers, contracted, unlisted, average procurement cycle, suppliers share by different products. etc. This Relationship Management Automation KPI Dashboard To Track Supplier Relationship is perfect for any presentation, be it in front of clients or colleagues. It is a versatile and stylish solution for organizing your meetings. The Relationship Management Automation KPI Dashboard To Track Supplier Relationship features a modern design for your presentation meetings. The adjustable and customizable slides provide unlimited possibilities for acing up your presentation. Slidegeeks has done all the homework before launching the product for you. So, do not wait, grab the presentation templates today Mentioned slide provides information about various key performance indicators which can be used to evaluate impact of relations management on suppliers performance, it includes key points such as total suppliers, contracted, unlisted, average procurement cycle, suppliers share by different products. etc.
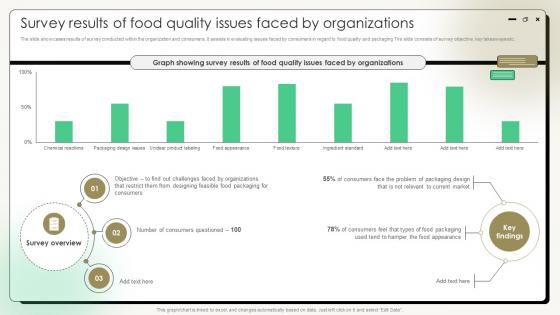
Comprehensive Guide On Current Strategies Survey Results Of Food Quality Issues Faced By Organizations
The slide showcases results of survey conducted within the organization and consumers. It assists in evaluating issues faced by consumers in regard to food quality and packaging The slide consists of survey objective, key takeaways etc. Do you have to make sure that everyone on your team knows about any specific topic I yes, then you should give Comprehensive Guide On Current Strategies Survey Results Of Food Quality Issues Faced By Organizations a try. Our experts have put a lot of knowledge and effort into creating this impeccable Comprehensive Guide On Current Strategies Survey Results Of Food Quality Issues Faced By Organizations. You can use this template for your upcoming presentations, as the slides are perfect to represent even the tiniest detail. You can download these templates from the Slidegeeks website and these are easy to edit. So grab these today The slide showcases results of survey conducted within the organization and consumers. It assists in evaluating issues faced by consumers in regard to food quality and packaging The slide consists of survey objective, key takeaways etc.
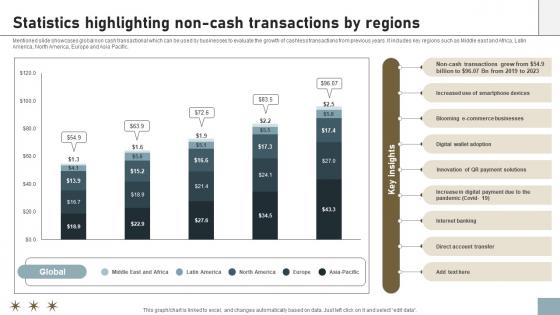
Online Payment Techniques Statistics Highlighting Non Cash Transactions By Regions
Mentioned slide showcases global non cash transactional which can be used by businesses to evaluate the growth of cashless transactions from previous years. It includes key regions such as Middle east and Africa, Latin America, North America, Europe and Asia Pacific. This modern and well-arranged Online Payment Techniques Statistics Highlighting Non Cash Transactions By Regions provides lots of creative possibilities. It is very simple to customize and edit with the Powerpoint Software. Just drag and drop your pictures into the shapes. All facets of this template can be edited with Powerpoint, no extra software is necessary. Add your own material, put your images in the places assigned for them, adjust the colors, and then you can show your slides to the world, with an animated slide included. Mentioned slide showcases global non cash transactional which can be used by businesses to evaluate the growth of cashless transactions from previous years. It includes key regions such as Middle east and Africa, Latin America, North America, Europe and Asia Pacific.
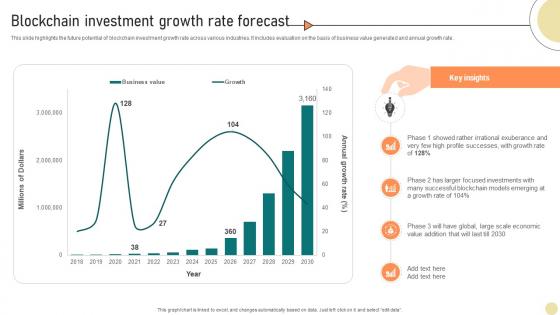
Visionary Guide To Blockchain Investment Growth Rate Forecast BCT SS V
This slide highlights the future potential of blockchain investment growth rate across various industries. It includes evaluation on the basis of business value generated and annual growth rate. Presenting this PowerPoint presentation, titled Visionary Guide To Blockchain Investment Growth Rate Forecast BCT SS V, with topics curated by our researchers after extensive research. This editable presentation is available for immediate download and provides attractive features when used. Download now and captivate your audience. Presenting this Visionary Guide To Blockchain Investment Growth Rate Forecast BCT SS V. Our researchers have carefully researched and created these slides with all aspects taken into consideration. This is a completely customizable Visionary Guide To Blockchain Investment Growth Rate Forecast BCT SS V that is available for immediate downloading. Download now and make an impact on your audience. Highlight the attractive features available with our PPTs. This slide highlights the future potential of blockchain investment growth rate across various industries. It includes evaluation on the basis of business value generated and annual growth rate.
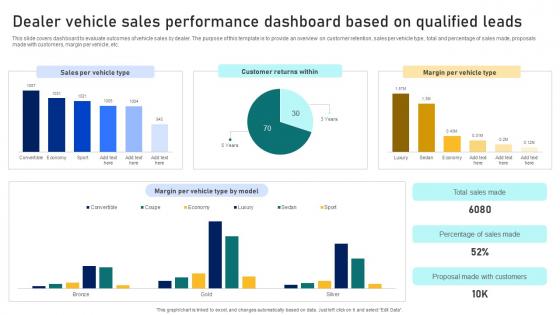
Guide To Building A Successful Dealer Vehicle Sales Performance Dashboard Based On Qualified Strategy SS V
This slide covers dashboard to evaluate outcomes of vehicle sales by dealer. The purpose of this template is to provide an overview on customer retention, sales per vehicle type, total and percentage of sales made, proposals made with customers, margin per vehicle, etc. Present like a pro with Guide To Building A Successful Dealer Vehicle Sales Performance Dashboard Based On Qualified Strategy SS V. Create beautiful presentations together with your team, using our easy-to-use presentation slides. Share your ideas in real-time and make changes on the fly by downloading our templates. So whether you are in the office, on the go, or in a remote location, you can stay in sync with your team and present your ideas with confidence. With Slidegeeks presentation got a whole lot easier. Grab these presentations today. This slide covers dashboard to evaluate outcomes of vehicle sales by dealer. The purpose of this template is to provide an overview on customer retention, sales per vehicle type, total and percentage of sales made, proposals made with customers, margin per vehicle, etc.
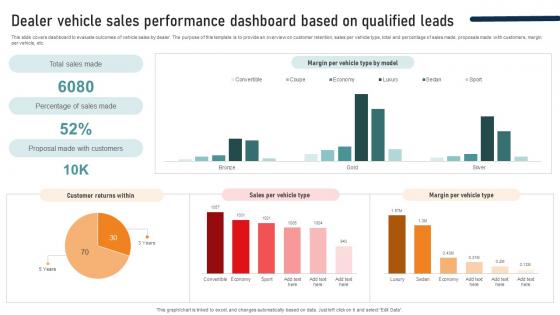
Ultimate Guide To Developing Dealer Vehicle Sales Performance Dashboard Based On Qualified Strategy SS V
This slide covers dashboard to evaluate outcomes of vehicle sales by dealer. The purpose of this template is to provide an overview on customer retention, sales per vehicle type, total and percentage of sales made, proposals made with customers, margin per vehicle, etc. Present like a pro with Ultimate Guide To Developing Dealer Vehicle Sales Performance Dashboard Based On Qualified Strategy SS V. Create beautiful presentations together with your team, using our easy-to-use presentation slides. Share your ideas in real-time and make changes on the fly by downloading our templates. So whether you are in the office, on the go, or in a remote location, you can stay in sync with your team and present your ideas with confidence. With Slidegeeks presentation got a whole lot easier. Grab these presentations today. This slide covers dashboard to evaluate outcomes of vehicle sales by dealer. The purpose of this template is to provide an overview on customer retention, sales per vehicle type, total and percentage of sales made, proposals made with customers, margin per vehicle, etc.
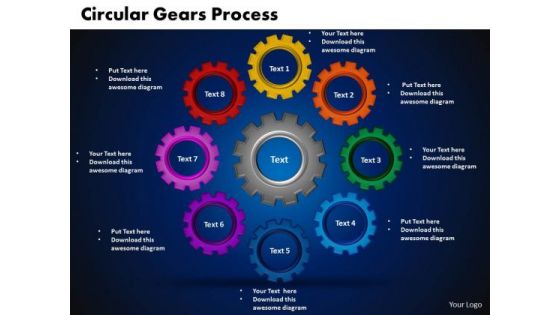
PowerPoint Theme Circular Gears Process Communication Ppt Presentation
PowerPoint Theme Circular Gears Process Communication PPT Presentation-The Gear Train is a basic element of living and daily business. Illustrate your ideas one by one and demonstrate how each is an important cog in running the entire wheel. Prove how they mesh to motivate the company team and provide the steam to activate the composite machine-PowerPoint Theme Circular Gears Process Communication PPT Presentation-This ppt can be used for presentations relating to-3d, Business, Circle, Circular, Clockwork, Cogs, Cogwheel, Colorful, Colors, Community, Component, Concept, Cooperate, Cooperation, Cycle, Cyclical, Different, Diverse, Diversity, Gear, Geometric, Hi-Tech, Idea, Industrial, Industry, Machine, Machinery, Mechanical, Mechanics, Round, Process, Progress Our PowerPoint Theme Circular Gears Process Communication Ppt Presentation are clear and concise. Your assessment will be completely accurate.

Arrow And Wall Success PowerPoint Templates And PowerPoint Themes 1012
Arrow And Wall Success PowerPoint Templates And PowerPoint Themes 1012-Develop competitive advantage with our above Template which contains a picture of Arrow blocked by wall which is coming in its way. This Template signifies the concept of obstacles coming in the way of success. This Also portrays how to tackle the obstacles peacefully. It is a powerful tool conceived to enable you to define your message in your Business and Leadership PPT presentations.-Arrow And Wall Success PowerPoint Templates And PowerPoint Themes 1012-This PowerPoint template can be used for presentations relating to-Arrow and wall, success, business, arrows, signs, shapes Our Arrow And Wall Success PowerPoint Templates And PowerPoint Themes 1012 see it through your eyes. They agree with the basis of your assessment.

Risk Cubes Business PowerPoint Templates And PowerPoint Themes 1112
Risk Cubes Business PowerPoint Templates And PowerPoint Themes 1112-This PowerPoint template with colorful bricks with letters on it, designed in blue colors, will be a terrific choice for presentations on financial risks, risks management, risk analysis, risk assessment, mitigation of risk, market risk, credit risk, liquidity risk , etc. Also use this template for presentations on breaking limits, taking risks, risk management, uncertainty on objectives, realization of opportunities, uncertainty in financial markets, project credit risk etc.-Risk Cubes Business PowerPoint Templates And PowerPoint Themes 1112-This PowerPoint template can be used for presentations relating to-Render of risk cubes, Cubes, Business, People, Success, Competition Our Risk Cubes Business PowerPoint Templates And PowerPoint Themes 1112 will cherish your thoughts. They give your ambitions due care.
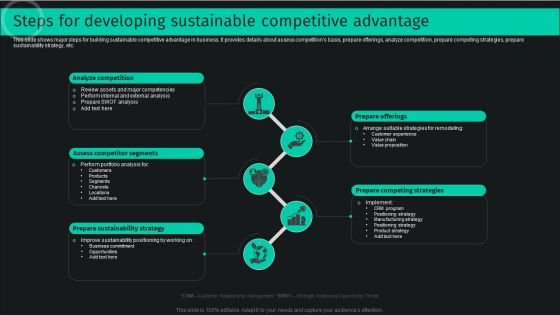
Steps For Developing Sustainable Competitive Advantage Themes PDF
This slide shows major steps for building sustainable competitive advantage in business. It provides details about assess competitions basis, prepare offerings, analyze competition, prepare competing strategies, prepare sustainability strategy, etc. Whether you have daily or monthly meetings, a brilliant presentation is necessary. Steps For Developing Sustainable Competitive Advantage Themes PDF can be your best option for delivering a presentation. Represent everything in detail using Steps For Developing Sustainable Competitive Advantage Themes PDF and make yourself stand out in meetings. The template is versatile and follows a structure that will cater to your requirements. All the templates prepared by Slidegeeks are easy to download and edit. Our research experts have taken care of the corporate themes as well. So, give it a try and see the results.
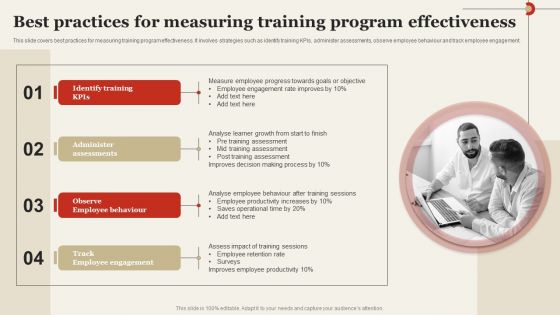
Best Practices For Measuring Training Program Effectiveness Themes PDF
This slide covers best practices for measuring training program effectiveness. It involves strategies such as identify training KPIs, administer assessments, observe employee behaviour and track employee engagement. Whether you have daily or monthly meetings, a brilliant presentation is necessary. Best Practices For Measuring Training Program Effectiveness Themes PDF can be your best option for delivering a presentation. Represent everything in detail using Best Practices For Measuring Training Program Effectiveness Themes PDF and make yourself stand out in meetings. The template is versatile and follows a structure that will cater to your requirements. All the templates prepared by Slidegeeks are easy to download and edit. Our research experts have taken care of the corporate themes as well. So, give it a try and see the results.
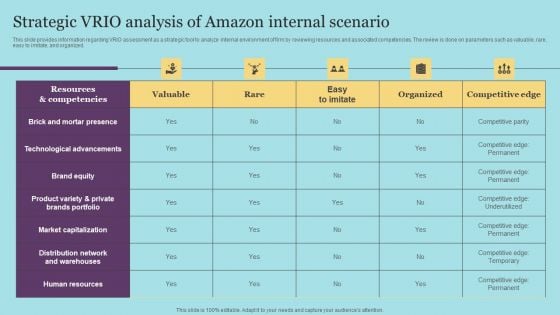
Strategic VRIO Analysis Of Amazon Internal Scenario Themes PDF
This slide provides information regarding VRIO assessment as a strategic tool to analyze internal environment of firm by reviewing resources and associated competencies. The review is done on parameters such as valuable, rare, easy to imitate, and organized. Whether you have daily or monthly meetings, a brilliant presentation is necessary. Strategic VRIO Analysis Of Amazon Internal Scenario Themes PDF can be your best option for delivering a presentation. Represent everything in detail using Strategic VRIO Analysis Of Amazon Internal Scenario Themes PDF and make yourself stand out in meetings. The template is versatile and follows a structure that will cater to your requirements. All the templates prepared by Slidegeeks are easy to download and edit. Our research experts have taken care of the corporate themes as well. So, give it a try and see the results.
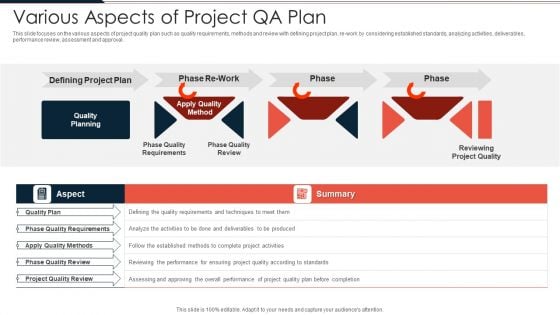
Various Aspects Of Project QA Plan Ppt PowerPoint Presentation File Design Inspiration PDF
This slide focuses on the various aspects of project quality plan such as quality requirements, methods and review with defining project plan, re work by considering established standards, analyzing activities, deliverables, performance review, assessment and approval. Pitch your topic with ease and precision using this various aspects of project qa plan ppt powerpoint presentation file design inspiration pdf. This layout presents information on defining project plan, phase quality requirements, phase quality review, phase quality requirements. It is also available for immediate download and adjustment. So, changes can be made in the color, design, graphics or any other component to create a unique layout.
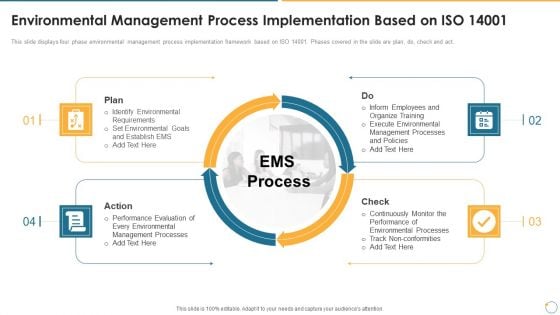
Collection Of Quality Assurance PPT Environmental Management Process Implementation Sample PDF
This slide displays four phase environmental management process implementation framework based on ISO 14001. Phases covered in the slide are plan, do, check and act. This is a collection of quality assurance ppt environmental management process implementation sample pdf template with various stages. Focus and dispense information on four stages using this creative set, that comes with editable features. It contains large content boxes to add your information on topics like environmental, management processes, performance evaluation, environmental goals , requirements. You can also showcase facts, figures, and other relevant content using this PPT layout. Grab it now.
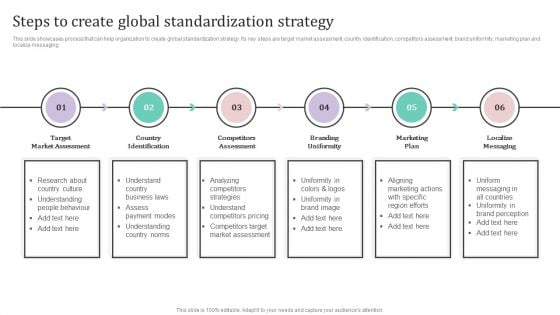
Steps To Create Global Standardization Strategy Ppt PowerPoint Presentation Diagram Images PDF
This slide showcases process that can help organization to create global standardization strategy. Its key steps are target market assessment, country identification, competitors assessment, brand uniformity, marketing plan and localize messaging. Slidegeeks is one of the best resources for PowerPoint templates. You can download easily and regulate Steps To Create Global Standardization Strategy Ppt PowerPoint Presentation Diagram Images PDF for your personal presentations from our wonderful collection. A few clicks is all it takes to discover and get the most relevant and appropriate templates. Use our Templates to add a unique zing and appeal to your presentation and meetings. All the slides are easy to edit and you can use them even for advertisement purposes.
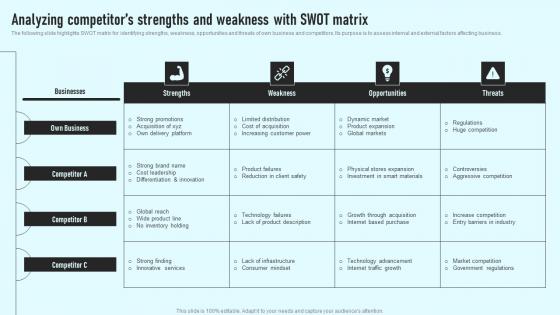
Analyzing Competitors Strengths And Weakness With Swot Matrix Comprehensive Guide Diagrams Pdf
The following slide highlights SWOT matrix for identifying strengths, weakness, opportunities and threats of own business and competitors. Its purpose is to assess internal and external factors affecting business. Slidegeeks is one of the best resources for PowerPoint templates. You can download easily and regulate Analyzing Competitors Strengths And Weakness With Swot Matrix Comprehensive Guide Diagrams Pdf for your personal presentations from our wonderful collection. A few clicks is all it takes to discover and get the most relevant and appropriate templates. Use our Templates to add a unique zing and appeal to your presentation and meetings. All the slides are easy to edit and you can use them even for advertisement purposes. The following slide highlights SWOT matrix for identifying strengths, weakness, opportunities and threats of own business and competitors. Its purpose is to assess internal and external factors affecting business.
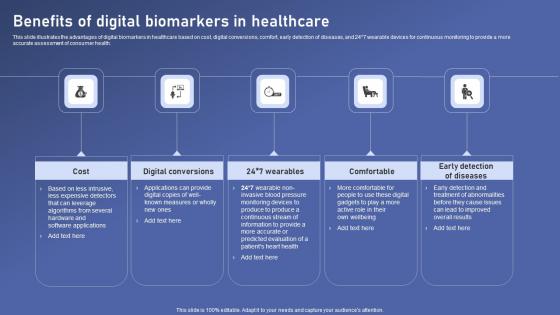
Benefits Of Digital Biomarkers Biomedical Data Science And Health Informatics Diagrams Pdf
This slide illustrates the advantages of digital biomarkers in healthcare based on cost, digital conversions, comfort, early detection of diseases, and 24 7 wearable devices for continuous monitoring to provide a more accurate assessment of consumer health. From laying roadmaps to briefing everything in detail, our templates are perfect for you. You can set the stage with your presentation slides. All you have to do is download these easy to edit and customizable templates. Benefits Of Digital Biomarkers Biomedical Data Science And Health Informatics Diagrams Pdf will help you deliver an outstanding performance that everyone would remember and praise you for. Do download this presentation today. This slide illustrates the advantages of digital biomarkers in healthcare based on cost, digital conversions, comfort, early detection of diseases, and 24 7 wearable devices for continuous monitoring to provide a more accurate assessment of consumer health.
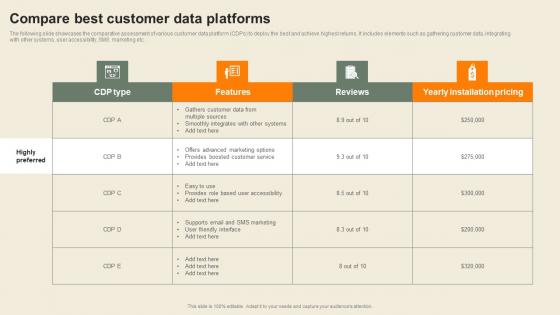
Compare Best Customer Data Platforms Usability Of CDP Software Tool Diagrams Pdf
The following slide showcases the comparative assessment of various customer data platform CDPs to deploy the best and achieve highest returns. It includes elements such as gathering customer data, integrating with other systems, user accessibility, SMS marketing etc. From laying roadmaps to briefing everything in detail, our templates are perfect for you. You can set the stage with your presentation slides. All you have to do is download these easy-to-edit and customizable templates. Compare Best Customer Data Platforms Usability Of CDP Software Tool Diagrams Pdf will help you deliver an outstanding performance that everyone would remember and praise you for. Do download this presentation today. The following slide showcases the comparative assessment of various customer data platform CDPs to deploy the best and achieve highest returns. It includes elements such as gathering customer data, integrating with other systems, user accessibility, SMS marketing etc.
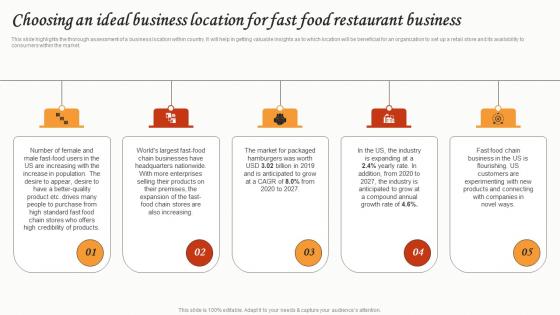
Choosing An Ideal Business Location For Fast Food Restaurant Small Restaurant Business Diagrams Pdf
This slide highlights the thorough assessment of a business location within country. It will help in getting valuable insights as to which location will be beneficial for an organization to set up a retail store and its availability to consumers within the market. Make sure to capture your audiences attention in your business displays with our gratis customizable Choosing An Ideal Business Location For Fast Food Restaurant Small Restaurant Business Diagrams Pdf These are great for business strategies, office conferences, capital raising or task suggestions. If you desire to acquire more customers for your tech business and ensure they stay satisfied, create your own sales presentation with these plain slides. This slide highlights the thorough assessment of a business location within country. It will help in getting valuable insights as to which location will be beneficial for an organization to set up a retail store and its availability to consumers within the market.
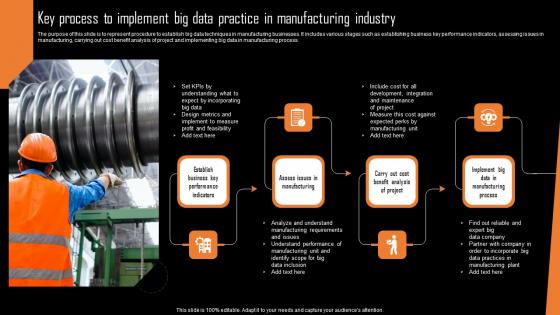
Key Process To Implement Big Data Practice In Manufacturing Industry Diagrams Pdf
The purpose of this slide is to represent procedure to establish big data techniques in manufacturing businesses. It includes various stages such as establishing business key performance indicators, assessing issues in manufacturing, carrying out cost benefit analysis of project and implementing big data in manufacturing process.Showcasing this set of slides titled Key Process To Implement Big Data Practice In Manufacturing Industry Diagrams Pdf The topics addressed in these templates are Expect Incorporating, Understand Performance, Manufacturing Plant All the content presented in this PPT design is completely editable. Download it and make adjustments in color, background, font etc. as per your unique business setting. The purpose of this slide is to represent procedure to establish big data techniques in manufacturing businesses. It includes various stages such as establishing business key performance indicators, assessing issues in manufacturing, carrying out cost benefit analysis of project and implementing big data in manufacturing process.
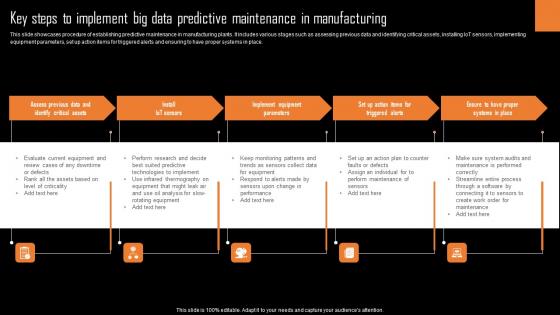
Key Steps To Implement Big Data Predictive Maintenance In Manufacturing Diagrams Pdf
This slide showcases procedure of establishing predictive maintenance in manufacturing plants. It includes various stages such as assessing previous data and identifying critical assets, installing IoT sensors, implementing equipment parameters, set up action items for triggered alerts and ensuring to have proper systems in place.Pitch your topic with ease and precision using this Key Steps To Implement Big Data Predictive Maintenance In Manufacturing Diagrams Pdf This layout presents information on Implement Equipment Parameters, Ensure Proper, Systems Place It is also available for immediate download and adjustment. So, changes can be made in the color, design, graphics or any other component to create a unique layout. This slide showcases procedure of establishing predictive maintenance in manufacturing plants. It includes various stages such as assessing previous data and identifying critical assets, installing IoT sensors, implementing equipment parameters, set up action items for triggered alerts and ensuring to have proper systems in place.

Time Is Money Business PowerPoint Templates And PowerPoint Themes 1112
We present our Time Is Money Business PowerPoint Templates And PowerPoint Themes 1112.Use our Money PowerPoint Templates because, Our Template designs are State of the Art. Use our Clocks PowerPoint Templates because, Enlighten others on your team with your views. Use our Finance PowerPoint Templates because, Brilliant ideas popping up all over the place. Use our Business PowerPoint Templates because,If making a mark is your obsession,. Use our Success PowerPoint Templates because, Emphasise the benefits of healthy food habits and lifestyles in respect of vital organs of the human anatomy.Use these PowerPoint slides for presentations relating to Time is money, clocks, business, finance, money, success. The prominent colors used in the PowerPoint template are Black, Red, Yellow Empower your counsellors with our Time Is Money Business PowerPoint Templates And PowerPoint Themes 1112. Make it more convenient to convey their assessments.


 Continue with Email

 Home
Home


