Finance Chart
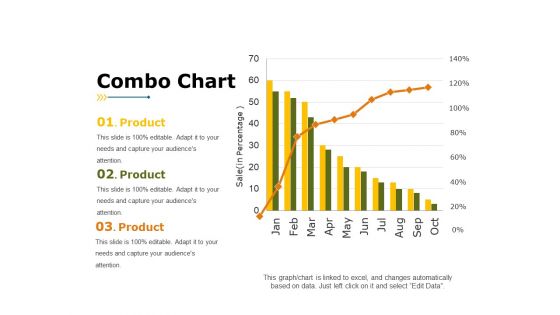
Combo Chart Ppt PowerPoint Presentation Portfolio Template
This is a combo chart ppt powerpoint presentation portfolio template. This is a three stage process. The stages in this process are product, business, marketing, combo chart, percentage.
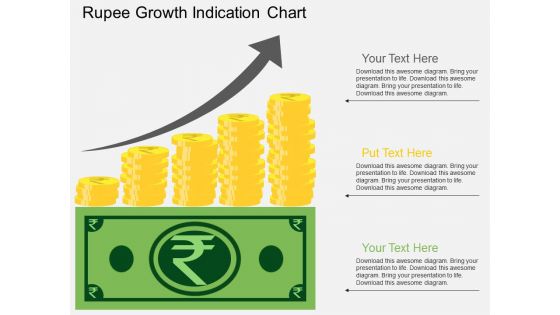
Rupee Growth Indication Chart Powerpoint Template
This business diagram displays rupee growth chart. This business diagram has been designed to implement strategic plan. Use this diagram to depict financial planning process in your presentations.
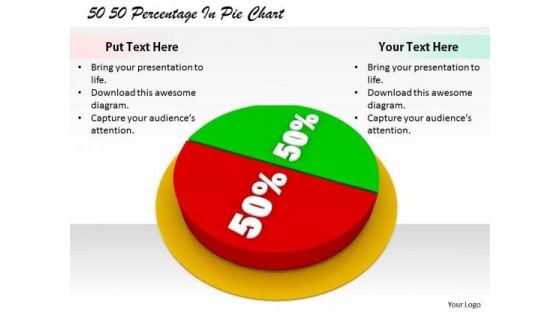
Stock Photo Corporate Business Strategy 50 Percentage Pie Chart Images
Extract admiration from the audience. Create a forceful impact with our stock photo corporate business strategy 50 percentage pie chart images. Force doors open with our finance. The audience will decide to let your thoughts enter.

Profit Chart Success PowerPoint Templates And PowerPoint Themes 1012
Profit Chart Success PowerPoint Templates And PowerPoint Themes 1012-The above template displays a diagram of a profit chart with percentages on tab. This image represents the concept of business success. It is a useful captivating tool conceived to enable you to define your message in your Business and Marketing PPT presentations. Go ahead and add personality to your presentations with our high quality growth business chart template.-Profit Chart Success PowerPoint Templates And PowerPoint Themes 1012-This PowerPoint template can be used for presentations relating to-Success profit chart graphic, business, finance, success, money, marketing Our Profit Chart Success PowerPoint Templates And PowerPoint Themes 1012 ensure an admirable address. The audience won't be able to fault your ideas.
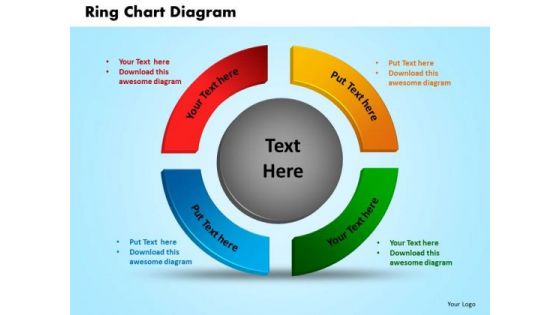
PowerPoint Process Ring Chart Diagram Strategy Ppt Templates
PowerPoint Process Ring Chart Diagram Strategy PPT Templates-Use This Business oriented PowerPoint Diagram which will help you to understand Inter-related approaches. This Ring Chart signifies Processes related to business, finance, investment, strategy, future, Marketing etc.-PowerPoint Process Ring Chart Diagram Strategy PPT Templates Give your thoughts an elixir with our PowerPoint Process Ring Chart Diagram Strategy Ppt Templates. They will reamain forever chic and charming.
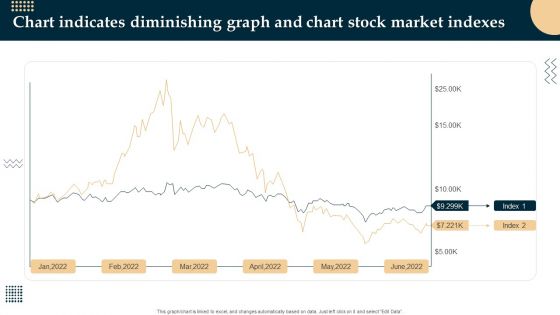
Chart Indicates Diminishing Graph And Chart Stock Market Indexes Themes PDF
Showcasing this set of slides titled Chart Indicates Diminishing Graph And Chart Stock Market Indexes Themes PDF. The topics addressed in these templates are Chart Indicates Diminishing Graph, Chart Stock Market Indexes. All the content presented in this PPT design is completely editable. Download it and make adjustments in color, background, font etc. as per your unique business setting.
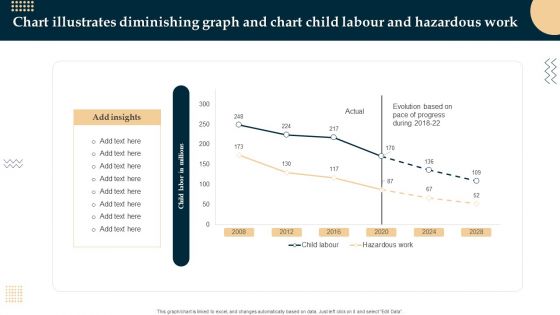
Chart Illustrates Diminishing Graph And Chart Child Labour And Hazardous Work Inspiration PDF
Showcasing this set of slides titled Chart Illustrates Diminishing Graph And Chart Child Labour And Hazardous Work Inspiration PDF. The topics addressed in these templates are Chart Illustrates Diminishing Graph, Hazardous Work, Chart Child Labour. All the content presented in this PPT design is completely editable. Download it and make adjustments in color, background, font etc. as per your unique business setting.

Chart Indicates Diminishing Graph And Chart Cash Payment Mode Inspiration PDF
Showcasing this set of slides titled Chart Indicates Diminishing Graph And Chart Cash Payment Mode Inspiration PDF. The topics addressed in these templates are Chart Indicates Diminishing Graph, Chart Cash Payment Mode. All the content presented in this PPT design is completely editable. Download it and make adjustments in color, background, font etc. as per your unique business setting.
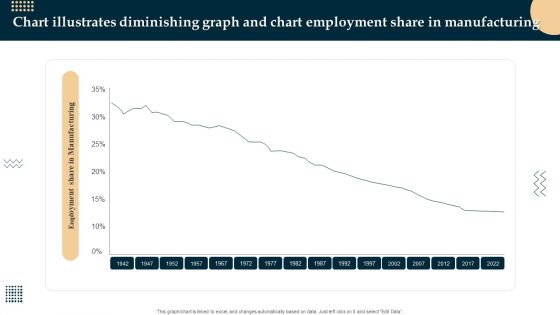
Chart Illustrates Diminishing Graph And Chart Employment Share In Manufacturing Diagrams PDF
Pitch your topic with ease and precision using this Chart Illustrates Diminishing Graph And Chart Employment Share In Manufacturing Diagrams PDF. This layout presents information on Chart Employment, Share In Manufacturing, Chart Illustrates Diminishing Graph. It is also available for immediate download and adjustment. So, changes can be made in the color, design, graphics or any other component to create a unique layout.
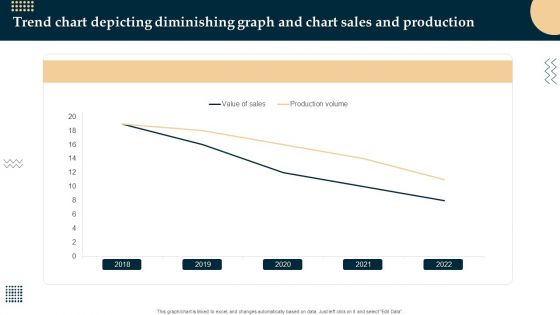
Trend Chart Depicting Diminishing Graph And Chart Sales And Production Structure PDF
Pitch your topic with ease and precision using this Trend Chart Depicting Diminishing Graph And Chart Sales And Production Structure PDF. This layout presents information on Trend Chart Depicting, Diminishing Graph, Chart Sales And Production. It is also available for immediate download and adjustment. So, changes can be made in the color, design, graphics or any other component to create a unique layout.

Chart Indicates Diminishing Graph And Chart Retail Value And Volume Download PDF
Pitch your topic with ease and precision using this Chart Indicates Diminishing Graph And Chart Retail Value And Volume Download PDF. This layout presents information on Chart Indicates Diminishing Graph, Chart Retail Value And Volume. It is also available for immediate download and adjustment. So, changes can be made in the color, design, graphics or any other component to create a unique layout.
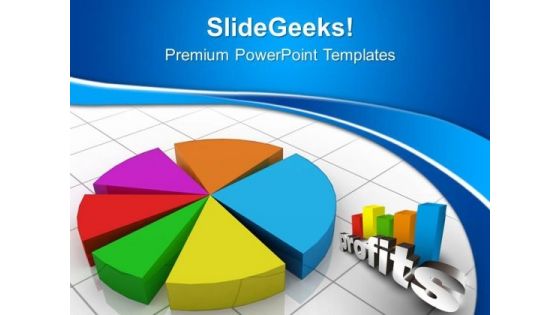
Pie Chart Marketing Business PowerPoint Templates And PowerPoint Themes 0612
Pie Chart Marketing Business PowerPoint Templates And PowerPoint Themes Business PPT Templates-Pie graph marketing, business, finance, sales, success, marketing Succeed admirably with our Pie Chart Marketing Business PowerPoint Templates And PowerPoint Themes 0612. Download without worries with our money back guaranteee.
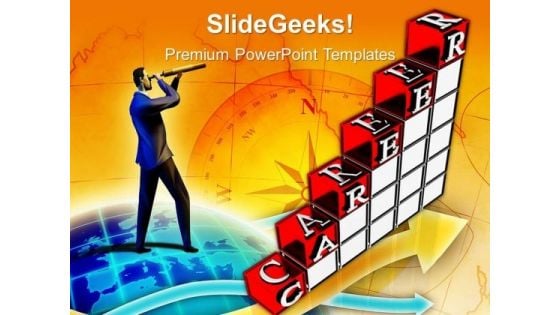
Career Growth Chart Success PowerPoint Templates And PowerPoint Themes 0912
Career Growth Chart Success PowerPoint Templates And PowerPoint Themes 0912-Microsoft Powerpoint Templates and Background with business or career growth-Business or career growth, finance, success, business, arrows, competition Expectations escalate with our Career Growth Chart Success PowerPoint Templates And PowerPoint Themes 0912. They do their best to cater to them.
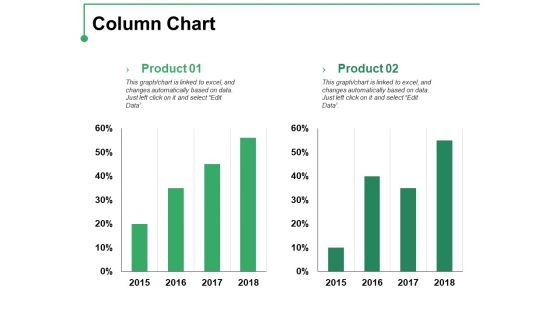
Column Chart Ppt PowerPoint Presentation Professional Template
This is a column chart ppt powerpoint presentation professional template. This is a two stage process. The stages in this process are product, percentage, finance, bar graph, growth.
Pie Chart Ppt PowerPoint Presentation Outline Icon
This is a pie chart ppt powerpoint presentation outline icon. This is a four stage process. The stages in this process are pie, process, percentage, finance, business.

Column Chart Ppt PowerPoint Presentation Ideas Format
This is a column chart ppt powerpoint presentation ideas format. This is a two stage process. The stages in this process are business, strategy, marketing, planning, finance.
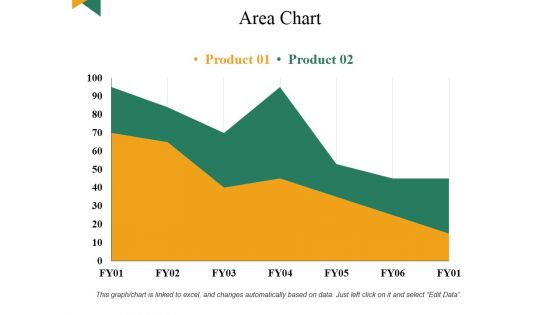
Area Chart Ppt PowerPoint Presentation Gallery Aids
This is a area chart ppt powerpoint presentation gallery aids. This is a two stage process. The stages in this process are business, graph, finance, marketing, planning.
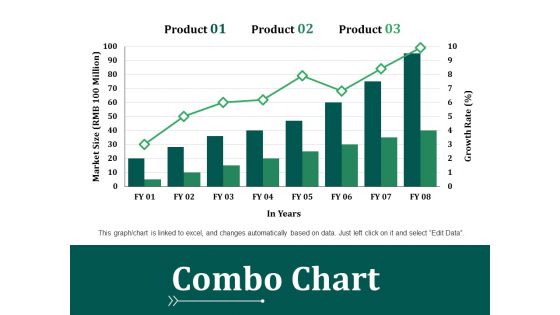
Combo Chart Ppt PowerPoint Presentation Summary Elements
This is a combo chart ppt powerpoint presentation summary elements. This is a three stage process. The stages in this process are business, marketing, strategy, planning, finance.
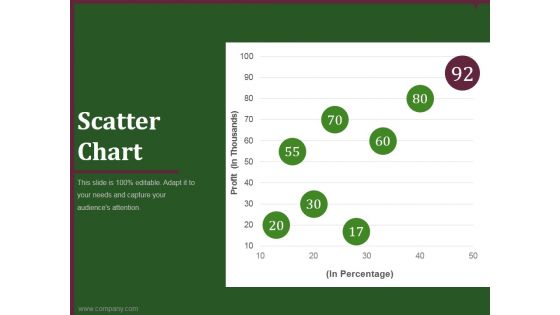
Scatter Chart Ppt PowerPoint Presentation Outline
This is a scatter chart ppt powerpoint presentation outline. This is a five stage process. The stages in this process are business, marketing, graph, percentage, finance.
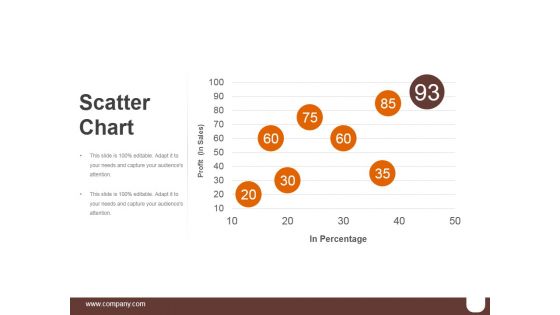
Scatter Chart Ppt PowerPoint Presentation Graphics
This is a scatter chart ppt powerpoint presentation graphics. This is a five stage process. The stages in this process are business, marketing, percentage, success, finance.
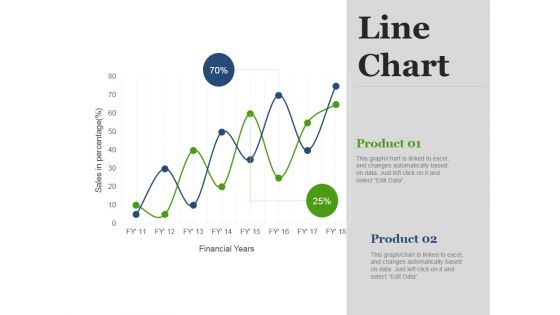
Line Chart Ppt PowerPoint Presentation Ideas Professional
This is a line chart ppt powerpoint presentation ideas professional. This is a two stage process. The stages in this process are finance, business, success, line, growth.
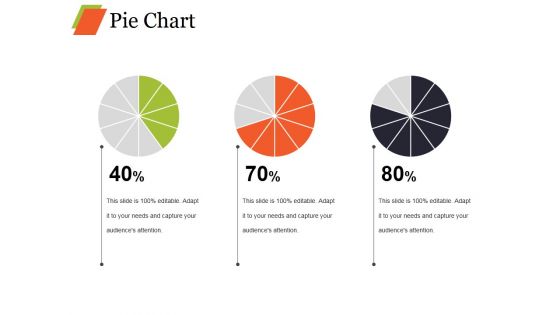
Pie Chart Ppt PowerPoint Presentation Layouts Topics
This is a pie chart ppt powerpoint presentation layouts topics. This is a three stage process. The stages in this process are pie, process, percentage, finance, business.

Column Chart Ppt PowerPoint Presentation Model Visuals
This is a column chart ppt powerpoint presentation model visuals. This is a two stage process. The stages in this process are product, year, graph, business, finance.
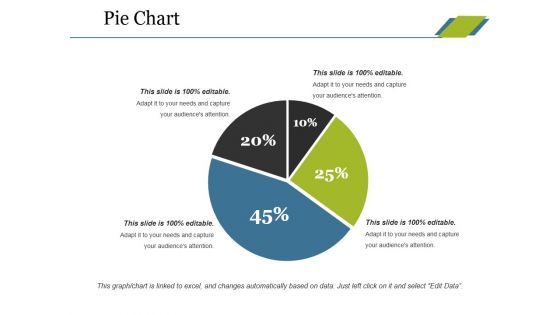
Pie Chart Ppt PowerPoint Presentation Layouts Gridlines
This is a pie chart ppt powerpoint presentation layouts gridlines. This is a four stage process. The stages in this process are pie, process, percentage, finance, business.
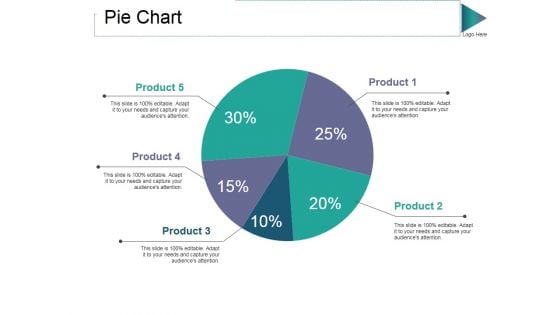
Pie Chart Ppt PowerPoint Presentation Model Grid
This is a pie chart ppt powerpoint presentation model grid. This is a five stage process. The stages in this process are product, pie, process, percentage, finance.
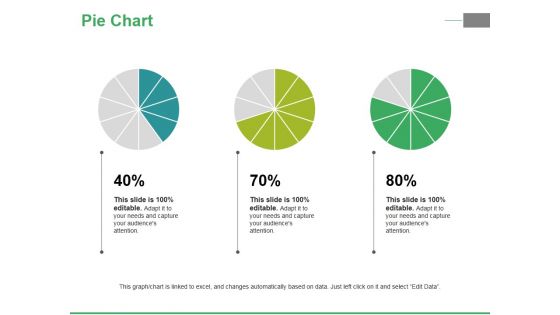
Pie Chart Ppt PowerPoint Presentation Ideas Inspiration
This is a pie chart ppt powerpoint presentation ideas inspiration. This is a three stage process. The stages in this process are pie, process, percentage, finance, business.
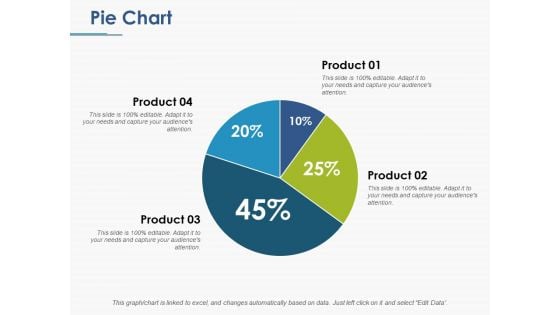
Pie Chart Ppt PowerPoint Presentation File Background
This is a pie chart ppt powerpoint presentation file background. This is a four stage process. The stages in this process are pie, process, percentage, finance, business.
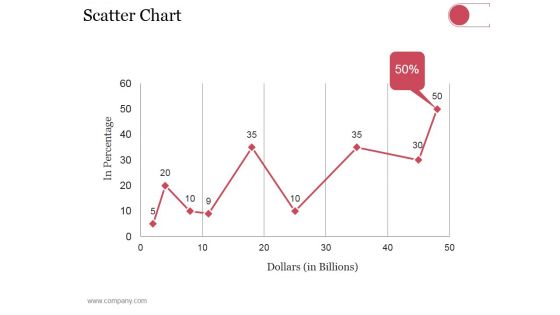
Scatter Chart Ppt PowerPoint Presentation Styles Show
This is a scatter chart ppt powerpoint presentation styles show. This is a nine stage process. The stages in this process are dollars, in percentage, finance, growth strategy.

Column Chart Ppt PowerPoint Presentation Portfolio Inspiration
This is a column chart ppt powerpoint presentation portfolio inspiration. This is a two stage process. The stages in this process are finance, marketing, management, investment, analysis.
Radar Chart Ppt PowerPoint Presentation Icon Guide
This is a radar chart ppt powerpoint presentation icon guide. This is a three stage process. The stages in this process are business, finance, management, strategy, planning.
Donut Chart Ppt Powerpoint Presentation Layouts Icons
This is a donut chart ppt powerpoint presentation layouts icons. This is a six stage process. The stages in this process are finance, marketing, management, donut circle.
Scatter Chart Ppt PowerPoint Presentation Icon Visuals
This is a scatter chart ppt powerpoint presentation icon visuals. This is a nine stage process. The stages in this process are business, growth, finance, success, marketing.
Scatter Chart Ppt PowerPoint Presentation Icon Mockup
This is a scatter chart ppt powerpoint presentation icon mockup. This is a nine stage process. The stages in this process are product, in percentage, dollars, percentage, finance.
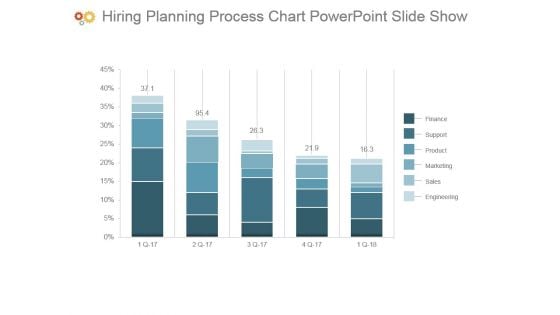
Hiring Planning Process Chart Powerpoint Slide Show
This is a hiring planning process chart powerpoint slide show. This is a five stage process. The stages in this process are finance, support, product, marketing, sales, engineering.
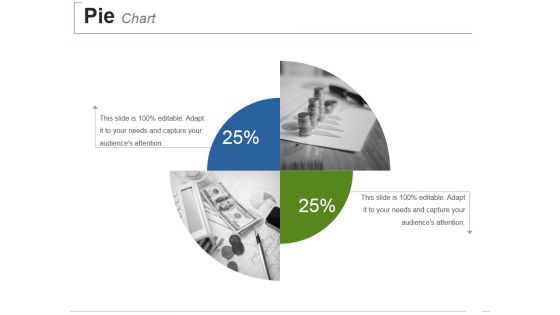
Pie Chart Ppt PowerPoint Presentation Styles Inspiration
This is a pie chart ppt powerpoint presentation styles inspiration. This is a two stage process. The stages in this process are finance, management, marketing, success, business, analysis.

Portfolio Evaluation Pie Chart Ppt Slides
This is a portfolio evolution pie chart ppt slides. This is a six stage process. The stages in this process are business, finance, marketing.
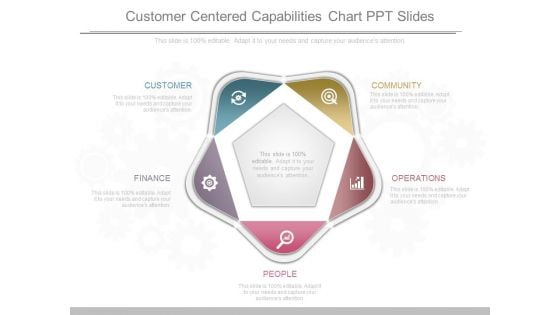
Customer Centered Capabilities Chart Ppt Slides
This is a customer centered capabilities chart ppt slides. This is a five stage process. The stages in this process are community, operations, people, finance, customer.
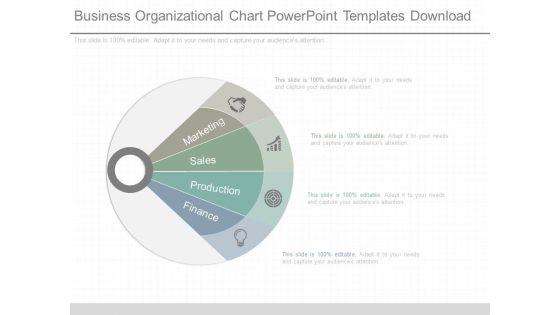
Business Organizational Chart Powerpoint Templates Download
This is a business organizational chart powerpoint templates download. This is a four stage process. The stages in this process are marketing, sales, production, finance.
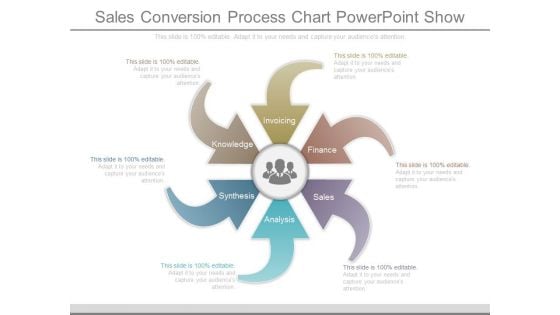
Sales Conversion Process Chart Powerpoint Show
This is a sales conversion process chart powerpoint show. This is a six stage process. The stages in this process are invoicing, finance, sales, analysis, synthesis, knowledge.
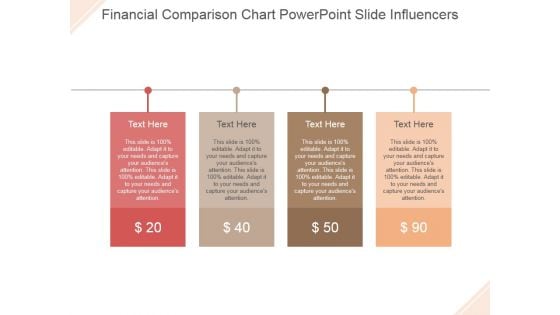
Financial Comparison Chart Ppt PowerPoint Presentation Styles
This is a financial comparison chart ppt powerpoint presentation styles. This is a four stage process. The stage in this process are dollar, business, symbol, finance, management.

Donut Chart Ppt PowerPoint Presentation Ideas
This is a donut chart ppt powerpoint presentation ideas. This is a six stage process. The stages in this process are business, strategy, marketing, analysis, finance.
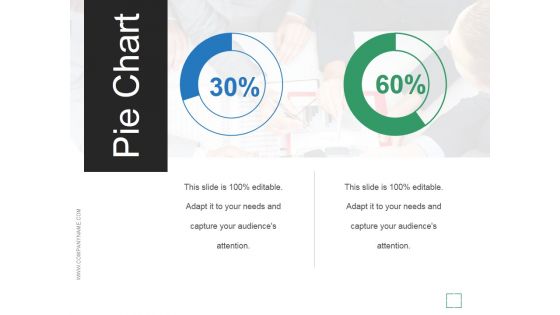
Pie Chart Ppt PowerPoint Presentation Sample
This is a pie chart ppt powerpoint presentation sample. This is a two stage process. The stages in this process are business, marketing, finance, analysis, management.
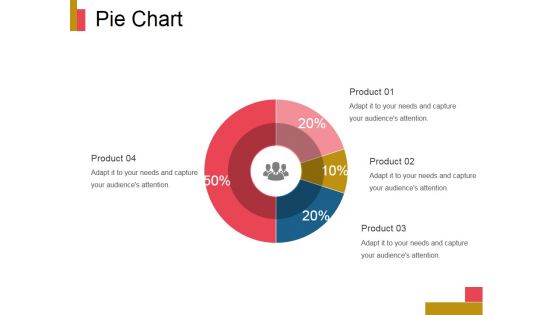
Pie Chart Ppt PowerPoint Presentation Design Ideas
This is a pie chart ppt powerpoint presentation design ideas. This is a four stage process. The stages in this process are product, finance, business, marketing, pie.
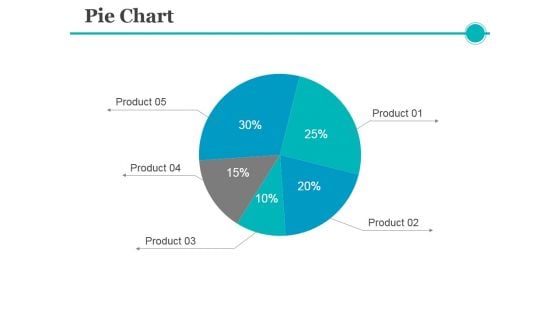
Pie Chart Ppt PowerPoint Presentation Professional Introduction
This is a pie chart ppt powerpoint presentation professional introduction. This is a five stage process. The stages in this process are product, finance, pie, process, business.
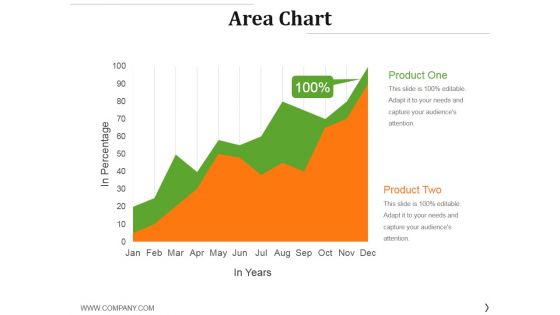
Area Chart Ppt PowerPoint Presentation Gallery Inspiration
This is a area chart ppt powerpoint presentation gallery inspiration. This is a two stage process. The stages in this process are product, growth, success, graph, finance.
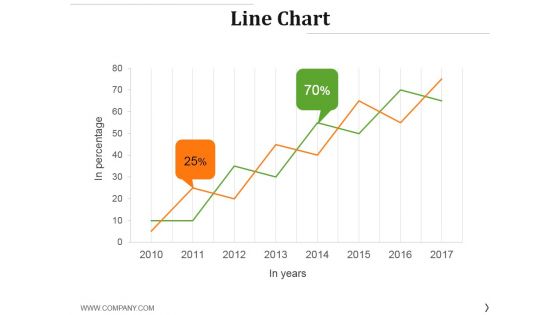
Line Chart Ppt PowerPoint Presentation Professional Template
This is a line chart ppt powerpoint presentation professional template. This is a two stage process. The stages in this process are business, finance, percentage, growth, success.
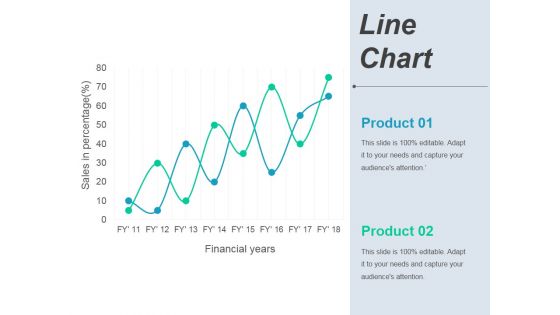
Line Chart Ppt PowerPoint Presentation Ideas Deck
This is a line chart ppt powerpoint presentation ideas deck. This is a two stage process. The stages in this process are business, marketing, finance, growth.
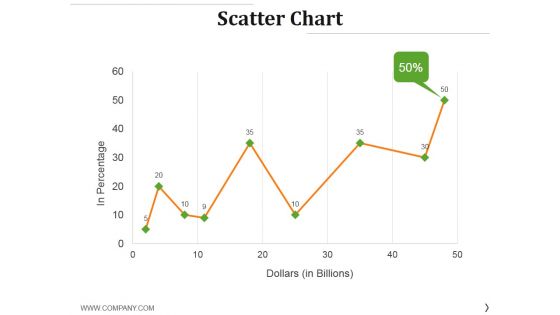
Scatter Chart Ppt PowerPoint Presentation Layouts Gridlines
This is a scatter chart ppt powerpoint presentation layouts gridlines. This is a nine stage process. The stages in this process are in percentage, dollars, growth, success, finance.
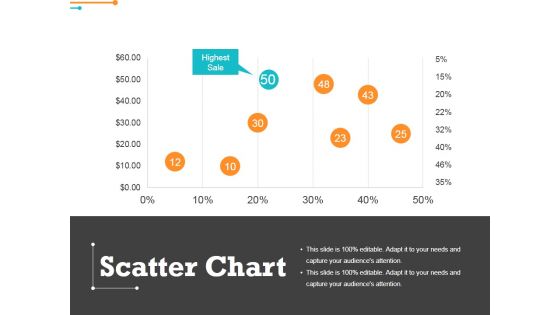
Scatter Chart Ppt PowerPoint Presentation Outline Graphics
This is a scatter chart ppt powerpoint presentation outline graphics. This is a eight stage process. The stages in this process are highest sale, percentage, finance, business.
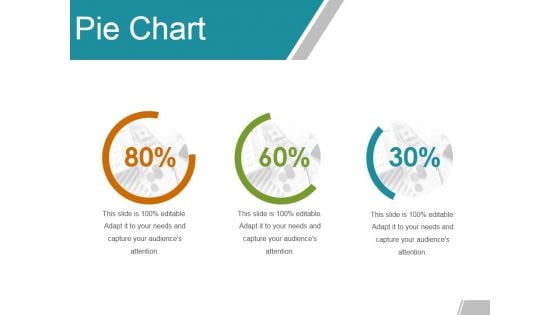
Pie Chart Ppt PowerPoint Presentation Summary Slide
This is a pie chart ppt powerpoint presentation summary slide. This is a three stage process. The stages in this process are percentage, finance, marketing, business.
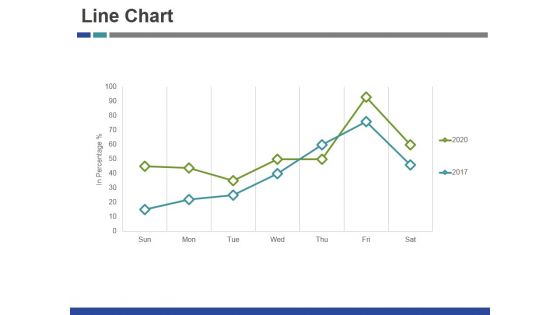
Line Chart Ppt PowerPoint Presentation Gallery Summary
This is a line chart ppt powerpoint presentation gallery summary. This is a two stage process. The stages in this process are finance, graph, business, management, marketing.
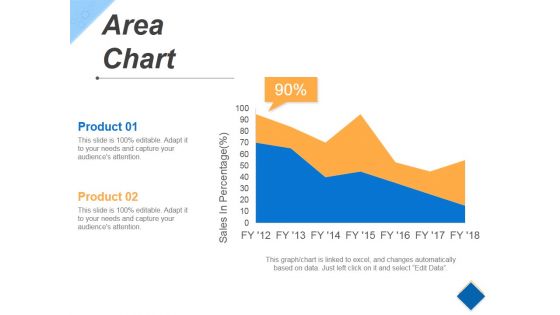
Area Chart Ppt PowerPoint Presentation Slides Gridlines
This is a area chart ppt powerpoint presentation slides gridlines. This is a two stage process. The stages in this process are business, finance, marketing, percentage.
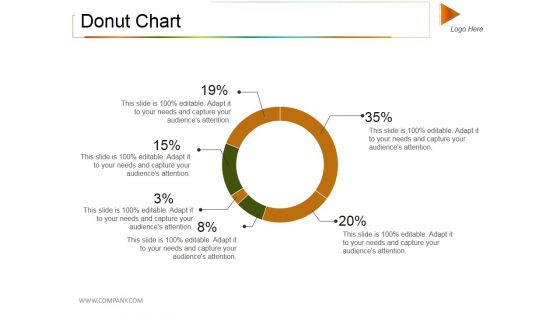
Donut Chart Ppt PowerPoint Presentation Model Rules
This is a donut chart ppt powerpoint presentation model rules. This is a six stage process. The stages in this process are donut, percentage, finance, business, marketing.
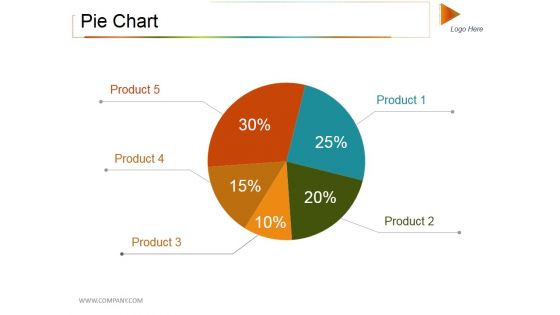
Pie Chart Ppt PowerPoint Presentation Styles Objects
This is a pie chart ppt powerpoint presentation styles objects. This is a five stage process. The stages in this process are pie, process, percentage, finance, business.
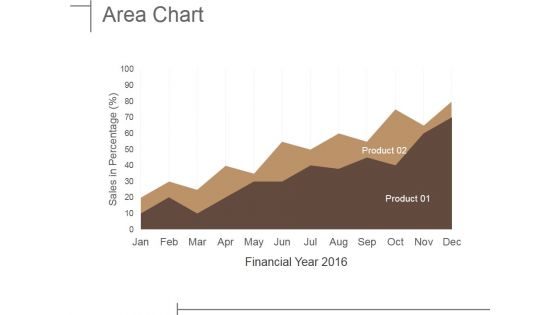
Area Chart Ppt PowerPoint Presentation Ideas Guide
This is a area chart ppt powerpoint presentation ideas guide. This is a two stage process. The stages in this process are growth, finance, success, business, marketing.
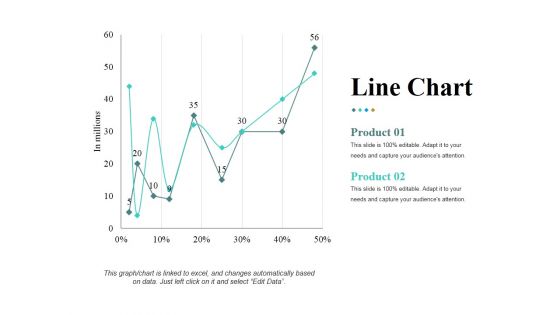
Line Chart Ppt PowerPoint Presentation Pictures Ideas
This is a line chart ppt powerpoint presentation pictures ideas. This is a two stage process. The stages in this process are in millions, percentage, finance, product, growth.
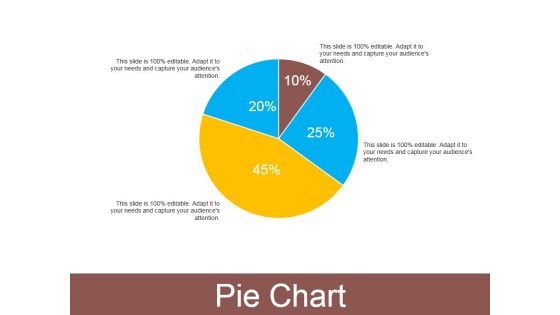
Pie Chart Ppt PowerPoint Presentation Outline Smartart
This is a pie chart ppt powerpoint presentation outline smartart. This is a four stage process. The stages in this process are pie, process, percentage, finance, business.
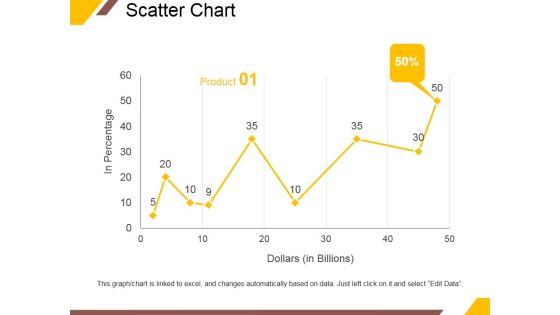
Scatter Chart Ppt PowerPoint Presentation Gallery Vector
This is a scatter chart ppt powerpoint presentation gallery vector. This is a nine stage process. The stages in this process are in percentage, dollars, product, percentage, finance.
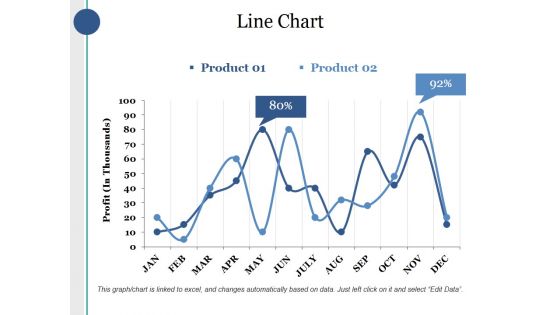
Line Chart Ppt PowerPoint Presentation Layouts Sample
This is a line chart ppt powerpoint presentation layouts sample. This is a two stage process. The stages in this process are product, profit, percentage, finance, business.
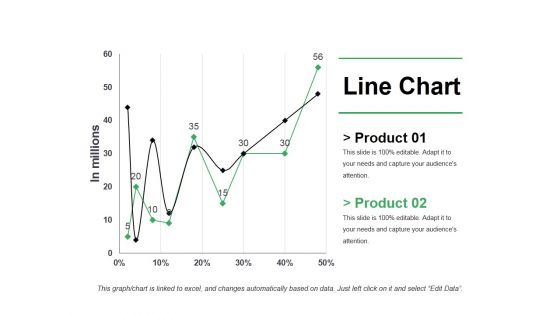
Line Chart Ppt PowerPoint Presentation Pictures Shapes
This is a line chart ppt powerpoint presentation pictures shapes. This is a two stage process. The stages in this process are business, marketing, strategy, finance, growth.


 Continue with Email

 Home
Home


