Finance Chart
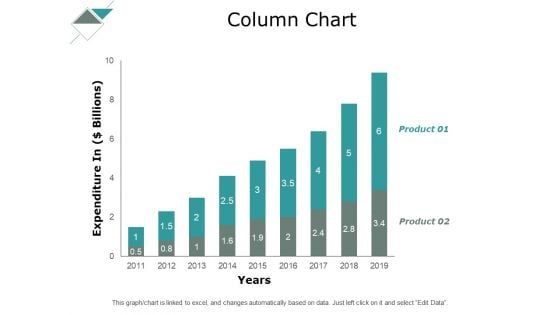
Column Chart Analysis Ppt PowerPoint Presentation Infographics Layout
Presenting this set of slides with name column chart analysis ppt powerpoint presentation infographics layout. The topics discussed in these slides are finance, marketing, management, investment, analysis. This is a completely editable PowerPoint presentation and is available for immediate download. Download now and impress your audience.
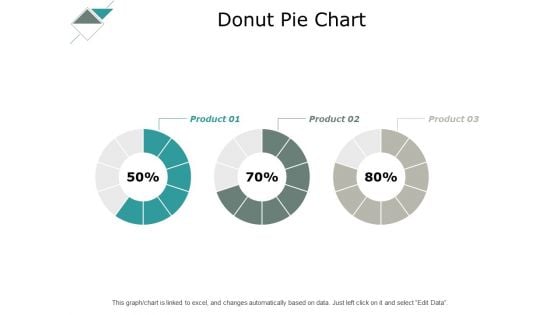
Donut Pie Chart Analysis Ppt PowerPoint Presentation Infographics Maker
Presenting this set of slides with name donut pie chart analysis ppt powerpoint presentation infographics maker. The topics discussed in these slides are finance, marketing, management, investment, analysis. This is a completely editable PowerPoint presentation and is available for immediate download. Download now and impress your audience.
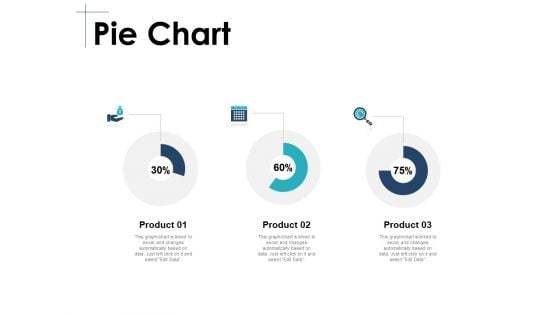
Pie Chart Analysis Ppt PowerPoint Presentation Background Designs
Presenting this set of slides with name pie chart analysis ppt powerpoint presentation background designs. The topics discussed in these slides are finance, marketing, management, investment, analysis. This is a completely editable PowerPoint presentation and is available for immediate download. Download now and impress your audience.

Donut Pie Chart Analysis Ppt PowerPoint Presentation Professional
Presenting this set of slides with name donut pie chart analysis ppt powerpoint presentation professional. The topics discussed in these slides are finance, marketing, management, investment, analysis. This is a completely editable PowerPoint presentation and is available for immediate download. Download now and impress your audience.
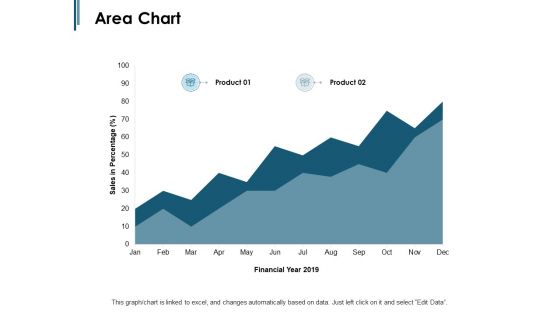
Area Chart Financial Year Ppt PowerPoint Presentation Styles Mockup
Presenting this set of slides with name area chart financial year ppt powerpoint presentation styles mockup. The topics discussed in these slides are finance, marketing, management, investment, analysis. This is a completely editable PowerPoint presentation and is available for immediate download. Download now and impress your audience.
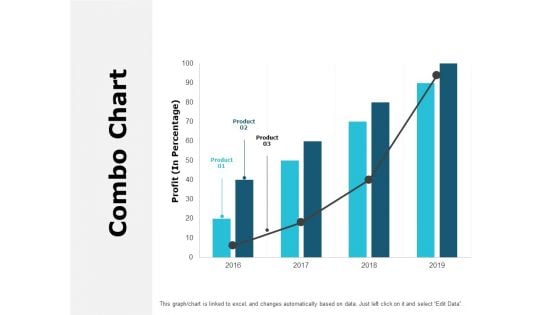
Combo Chart Analysis Ppt PowerPoint Presentation Outline Design Ideas
Presenting this set of slides with name combo chart analysis ppt powerpoint presentation outline design ideas. The topics discussed in these slides are finance, marketing, management, investment, analysis. This is a completely editable PowerPoint presentation and is available for immediate download. Download now and impress your audience.

Donut Pie Chart Analysis Ppt PowerPoint Presentation Inspiration Background Images
Presenting this set of slides with name donut pie chart analysis ppt powerpoint presentation inspiration background images. The topics discussed in these slides are finance, marketing, management, investment, analysis. This is a completely editable PowerPoint presentation and is available for immediate download. Download now and impress your audience.
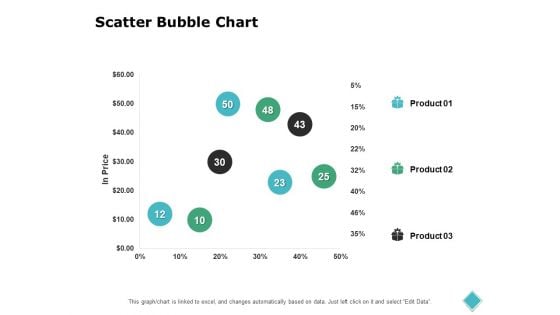
Scatter Bubble Chart Analysis Ppt PowerPoint Presentation File Backgrounds
Presenting this set of slides with name scatter bubble chart analysis ppt powerpoint presentation file backgrounds. The topics discussed in these slides are finance, marketing, management, investment, analysis. This is a completely editable PowerPoint presentation and is available for immediate download. Download now and impress your audience.
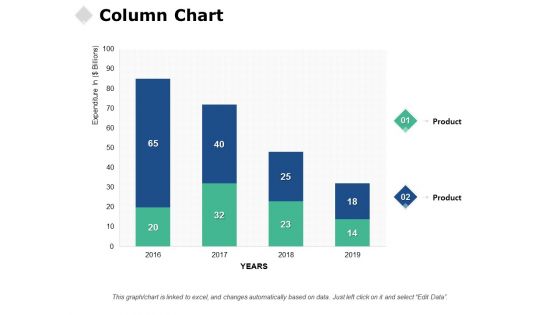
Column Chart Analysis Ppt PowerPoint Presentation Layouts Graphic Tips
Presenting this set of slides with name column chart analysis ppt powerpoint presentation layouts graphic tips. The topics discussed in these slides are finance, marketing, management, investment, analysis. This is a completely editable PowerPoint presentation and is available for immediate download. Download now and impress your audience.
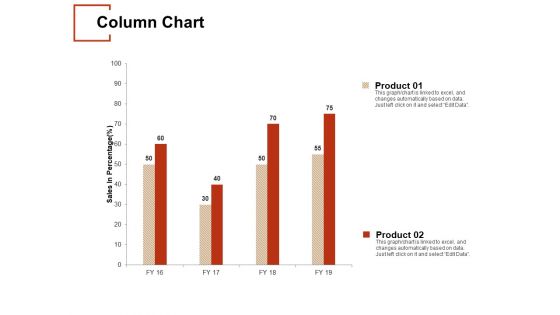
Column Chart Analysis Ppt PowerPoint Presentation Pictures Graphics Download
Presenting this set of slides with name column chart analysis ppt powerpoint presentation pictures graphics download. The topics discussed in these slides are finance, marketing, management, investment, analysis. This is a completely editable PowerPoint presentation and is available for immediate download. Download now and impress your audience.
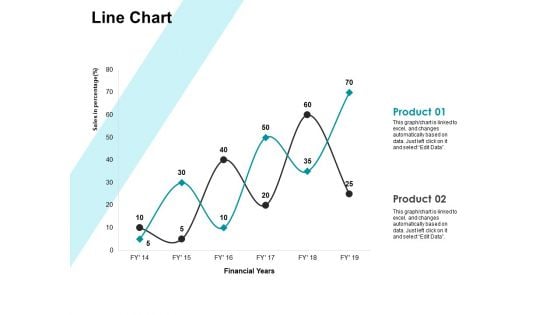
Line Chart Analysis Ppt PowerPoint Presentation Model Background Image
Presenting this set of slides with name line chart analysis ppt powerpoint presentation model background image. The topics discussed in these slides are finance, marketing, management, investment, analysis. This is a completely editable PowerPoint presentation and is available for immediate download. Download now and impress your audience.
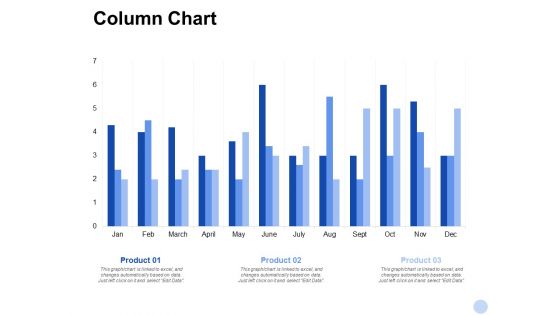
Column Chart Analysis Ppt PowerPoint Presentation File Deck
Presenting this set of slides with name column chart analysis ppt powerpoint presentation file deck. The topics discussed in these slides are finance, marketing, management, investment, analysis. This is a completely editable PowerPoint presentation and is available for immediate download. Download now and impress your audience.
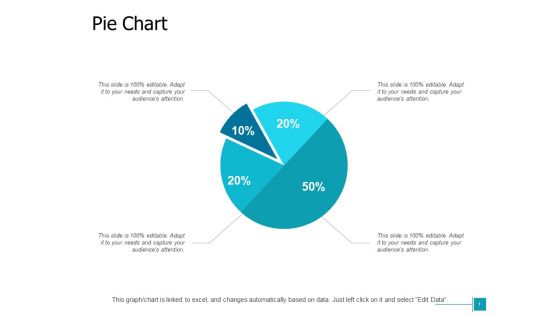
Pie Chart Analysis Ppt Powerpoint Presentation Inspiration Background Images
Presenting this set of slides with name pie chart analysis ppt powerpoint presentation inspiration background images. The topics discussed in these slides are finance, marketing, management, investment, analysis. This is a completely editable PowerPoint presentation and is available for immediate download. Download now and impress your audience.
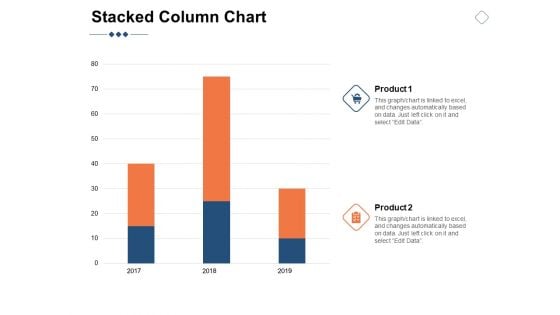
Stacked Column Chart Marketing Ppt PowerPoint Presentation Slide
Presenting this set of slides with name stacked column chart marketing ppt powerpoint presentation slide. The topics discussed in these slides are finance, analysis, business, investment, marketing. This is a completely editable PowerPoint presentation and is available for immediate download. Download now and impress your audience.
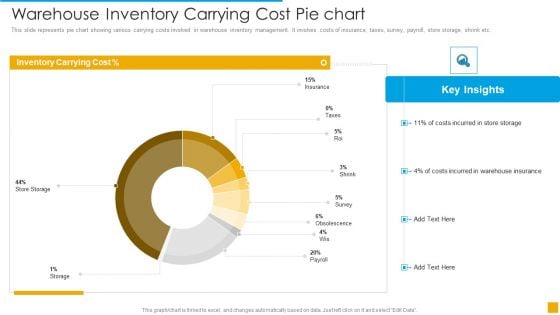
Warehouse Inventory Carrying Cost Pie Chart Demonstration PDF
This slide represents pie chart showing various carrying costs involved in warehouse inventory management. It involves costs of insurance, taxes, survey, payroll, store storage, shrink etc.Pitch your topic with ease and precision using this Warehouse Inventory Carrying Cost Pie Chart Demonstration PDF. This layout presents information on Cost, Inventory, Storage. It is also available for immediate download and adjustment. So, changes can be made in the color, design, graphics or any other component to create a unique layout.
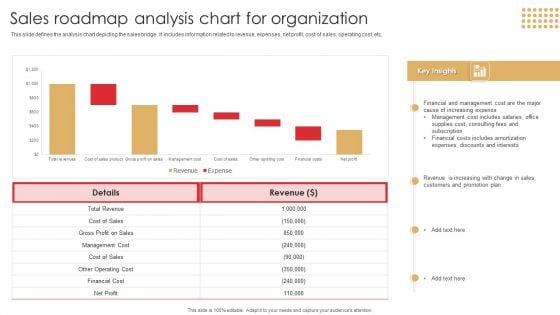
Sales Roadmap Analysis Chart For Organization Download PDF
This slide defines the analysis chart depicting the sales bridge . It includes information related to revenue, expenses, net profit, cost of sales, operating cost, etc.Showcasing this set of slides titled Sales Roadmap Analysis Chart For Organization Download PDF. The topics addressed in these templates are Management Cost, Financial Cost, Includes Amortization. All the content presented in this PPT design is completely editable. Download it and make adjustments in color, background, font etc. as per your unique business setting.
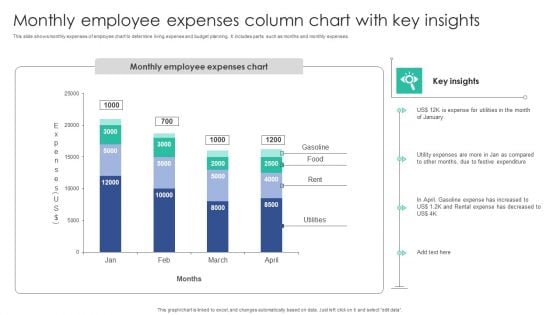
Monthly Employee Expenses Column Chart With Key Insights Download PDF
This slide shows monthly expenses of employee chart to determine living expense and budget planning. It includes parts such as months and monthly expenses.Showcasing this set of slides titled Monthly Employee Expenses Column Chart With Key Insights Download PDF. The topics addressed in these templates are Expense Utilities, Festive Expenditure, Gasoline Expense. All the content presented in this PPT design is completely editable. Download it and make adjustments in color, background, font etc. as per your unique business setting.

Digital Advertisement Spend Trend Chart By Industries Elements PDF
This slide depicts expenditure trends for digital advertising by top industries. It includes retail, automotive, financial services, telecom, consumer products, travel, healthcare, media, entertainment, etc. Showcasing this set of slides titled Digital Advertisement Spend Trend Chart By Industries Elements PDF. The topics addressed in these templates are Retail Sector, Total Budget, Chart By Industries. All the content presented in this PPT design is completely editable. Download it and make adjustments in color, background, font etc. as per your unique business setting.
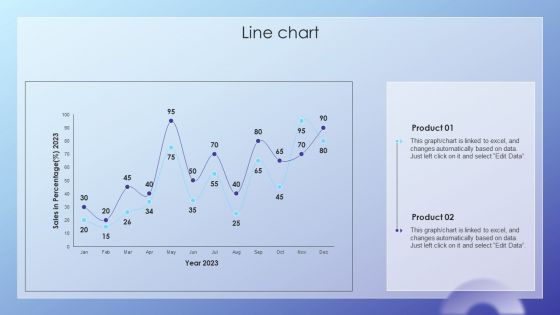
Client Acquisition Journey Plan Line Chart Ppt File Deck PDF
Create an editable Client Acquisition Journey Plan Line Chart Ppt File Deck PDF that communicates your idea and engages your audience. Whether youre presenting a business or an educational presentation, pre-designed presentation templates help save time. Client Acquisition Journey Plan Line Chart Ppt File Deck PDF is highly customizable and very easy to edit, covering many different styles from creative to business presentations. Slidegeeks has creative team members who have crafted amazing templates. So, go and get them without any delay.
Colorful Pie Chart Business PowerPoint Themes And PowerPoint Slides 0411
Microsoft PowerPoint Theme and Slide with a colorful 3d pie chart graph Be far sighted with our Colorful Pie Chart Business PowerPoint Themes And PowerPoint Slides 0411. They help you chart out a credible course.
Business Chart Arrows PowerPoint Templates And PowerPoint Themes 0812
Business Chart Arrows PowerPoint Templates And PowerPoint Themes 0812-Microsoft Powerpoint Templates and Background with business chart You like to be fair and square. Advise on the benefits with our Business Chart Arrows PowerPoint Templates And PowerPoint Themes 0812.
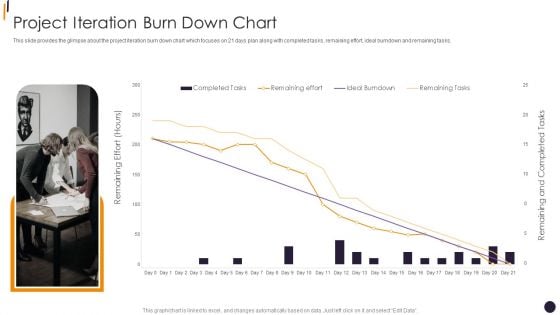
PMP Tools Project Iteration Burn Down Chart Slides PDF
This slide provides the glimpse about the project iteration burn down chart which focuses on 21 days plan along with completed tasks, remaining effort, ideal burndown and remaining tasks.Deliver an awe inspiring pitch with this creative PMP Tools Project Iteration Burn Down Chart Slides PDF bundle. Topics like Remaining Effort, Remaining Tasks, Completed Tasks can be discussed with this completely editable template. It is available for immediate download depending on the needs and requirements of the user.
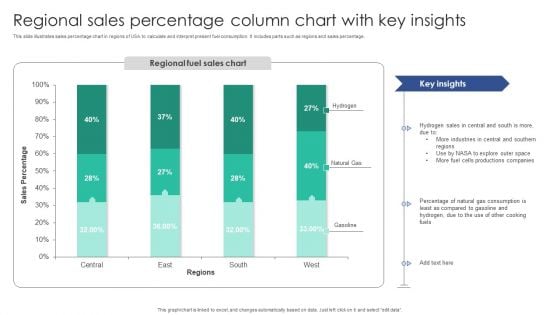
Regional Sales Percentage Column Chart With Key Insights Diagrams PDF
This slide illustrates sales percentage chart in regions of USA to calculate and interpret present fuel consumption. It includes parts such as regions and sales percentage.Pitch your topic with ease and precision using this Regional Sales Percentage Column Chart With Key Insights Diagrams PDF. This layout presents information on Industries Central, Sales Central, Productions Companies. It is also available for immediate download and adjustment. So, changes can be made in the color, design, graphics or any other component to create a unique layout.
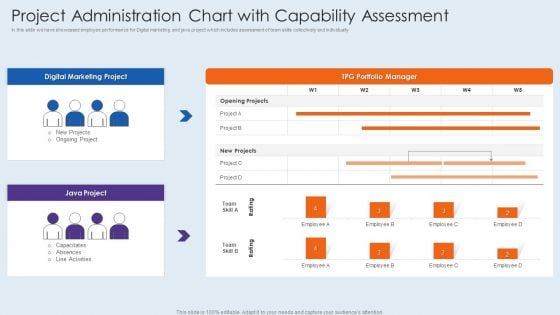
Project Administration Chart With Capability Assessment Elements PDF
In this slide we have showcased employee performance for Digital marketing and java project which includes assessment of team skills collectively and individually. Showcasing this set of slides titled project administration chart with capability assessment elements pdf. The topics addressed in these templates are project administration chart with capability assessment. All the content presented in this PPT design is completely editable. Download it and make adjustments in color, background, font etc. as per your unique business setting.
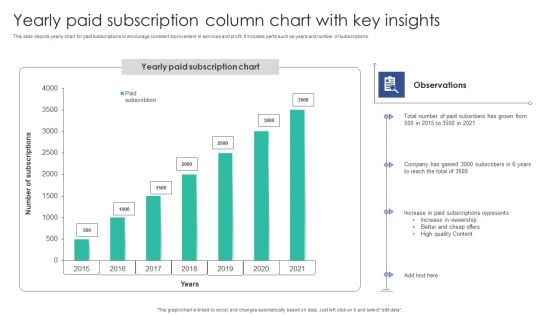
Yearly Paid Subscription Column Chart With Key Insights Microsoft PDF
This slide depicts yearly chart for paid subscriptions to encourage constant improvement in services and profit. It includes parts such as years and number of subscriptions.Showcasing this set of slides titled Yearly Paid Subscription Column Chart With Key Insights Microsoft PDF. The topics addressed in these templates are Paid Subscribers, Company Gained, Subscriptions Represents. All the content presented in this PPT design is completely editable. Download it and make adjustments in color, background, font etc. as per your unique business setting.
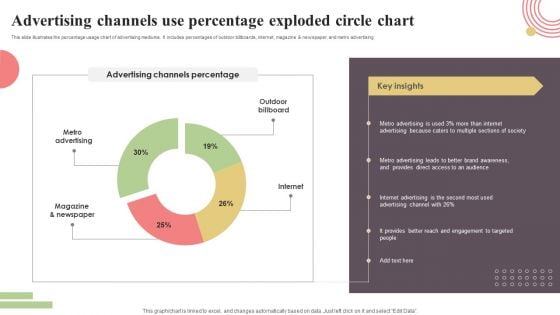
Advertising Channels Use Percentage Exploded Circle Chart Sample PDF
This slide illustrates the percentage usage chart of advertising mediums. It includes percentages of outdoor billboards, internet, magazine and newspaper, and metro advertising. Showcasing this set of slides titled Advertising Channels Use Percentage Exploded Circle Chart Sample PDF. The topics addressed in these templates are Metro Advertising, Magazine And Newspaper, Internet, Outdoor, Billboard. All the content presented in this PPT design is completely editable. Download it and make adjustments in color, background, font etc. as per your unique business setting.
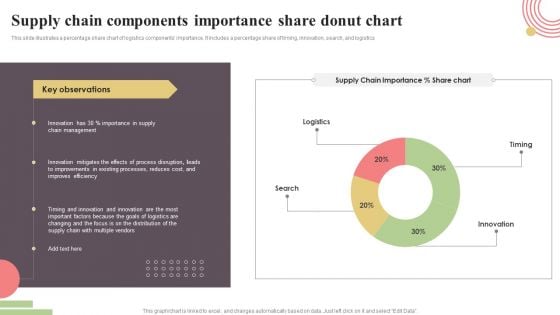
Supply Chain Components Importance Share Donut Chart Rules PDF
This slide illustrates a percentage share chart of logistics components importance. It includes a percentage share of timing, innovation, search, and logistics. Showcasing this set of slides titled Supply Chain Components Importance Share Donut Chart Rules PDF. The topics addressed in these templates are Timing, Innovation, Search, Logistics. All the content presented in this PPT design is completely editable. Download it and make adjustments in color, background, font etc. as per your unique business setting.
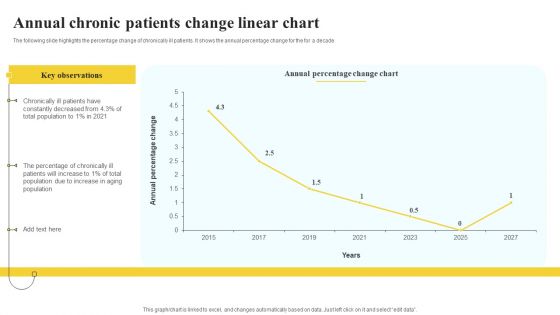
Annual Chronic Patients Change Linear Chart Demonstration PDF
The following slide highlights the percentage change of chronically ill patients. It shows the annual percentage change for the for a decade Showcasing this set of slides titled Annual Chronic Patients Change Linear Chart Demonstration PDF. The topics addressed in these templates are Key Observations, Annual Percentage, Linear Chart. All the content presented in this PPT design is completely editable. Download it and make adjustments in color, background, font etc. as per your unique business setting.
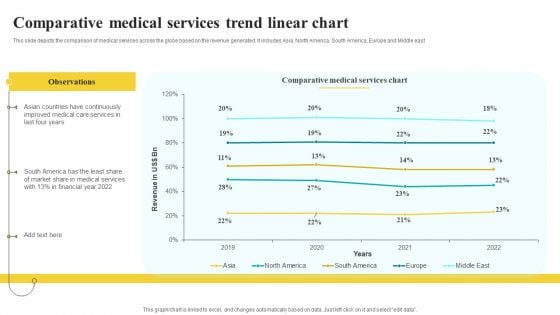
Comparative Medical Services Trend Linear Chart Mockup PDF
This slide depicts the comparison of medical services across the globe based on the revenue generated. It includes Asia, North America, South America, Europe and Middle east Showcasing this set of slides titled Comparative Medical Services Trend Linear Chart Mockup PDF. The topics addressed in these templates are Observations, Comparative Medical Services, Linear Chart. All the content presented in this PPT design is completely editable. Download it and make adjustments in color, background, font etc. as per your unique business setting.
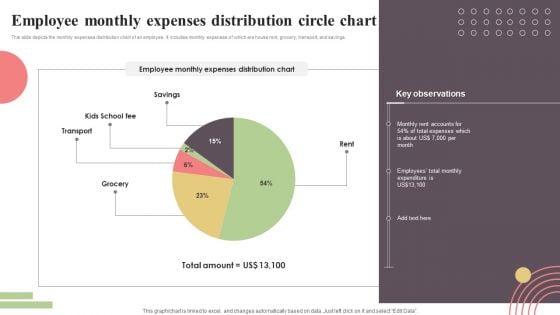
Employee Monthly Expenses Distribution Circle Chart Elements PDF
This slide depicts the monthly expenses distribution chart of an employee. It includes monthly expenses of which are house rent, grocery, transport, and savings. Showcasing this set of slides titled Employee Monthly Expenses Distribution Circle Chart Elements PDF. The topics addressed in these templates are Savings, Kids School Fee, Transport, Grocery, Rent. All the content presented in this PPT design is completely editable. Download it and make adjustments in color, background, font etc. as per your unique business setting.
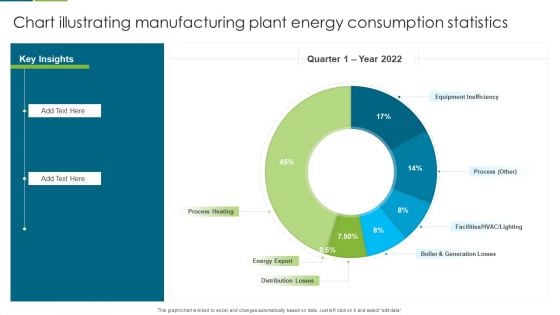
Chart Illustrating Manufacturing Plant Energy Consumption Statistics Slides PDF
This graph or chart is linked to excel, and changes automatically based on data. Just left click on it and select edit data. Pitch your topic with ease and precision using this Chart Illustrating Manufacturing Plant Energy Consumption Statistics Slides PDF. This layout presents information on Equipment Inefficiency, Process Heating, Energy Export. It is also available for immediate download and adjustment. So, changes can be made in the color, design, graphics or any other component to create a unique layout.
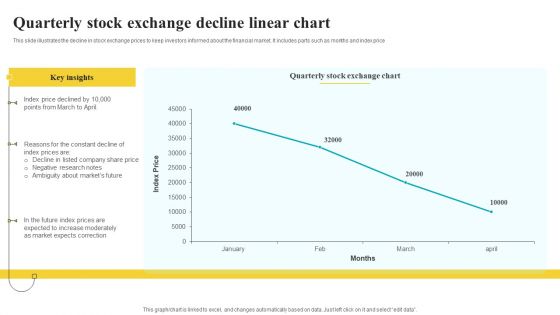
Quarterly Stock Exchange Decline Linear Chart Inspiration PDF
This slide illustrates the decline in stock exchange prices to keep investors informed about the financial market. It includes parts such as months and index price Pitch your topic with ease and precision using this Quarterly Stock Exchange Decline Linear Chart Inspiration PDF. This layout presents information on Key Insights, Exchange Chart, Correction. It is also available for immediate download and adjustment. So, changes can be made in the color, design, graphics or any other component to create a unique layout.
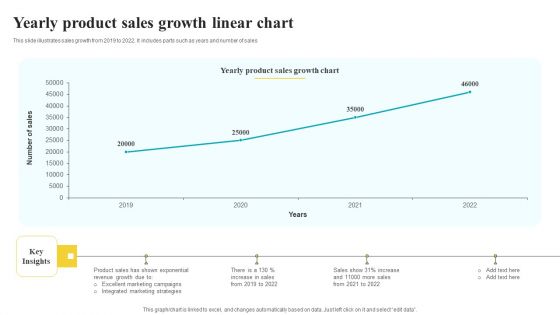
Yearly Product Sales Growth Linear Chart Pictures PDF
This slide illustrates sales growth from 2019 to 2022. It includes parts such as years and number of sales Pitch your topic with ease and precision using this Yearly Product Sales Growth Linear Chart Pictures PDF. This layout presents information on Sales Growth Chart, Key Insights, Strategies. It is also available for immediate download and adjustment. So, changes can be made in the color, design, graphics or any other component to create a unique layout.
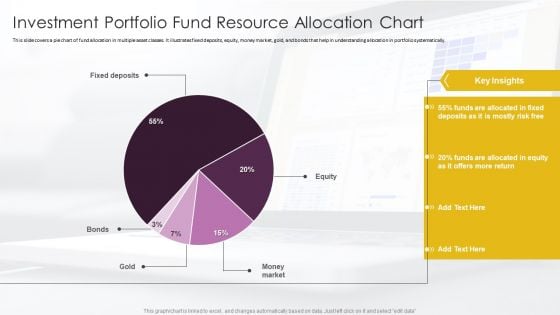
Investment Portfolio Fund Resource Allocation Chart Summary PDF
This slide covers a pie chart of fund allocation in multiple asset classes. It illustrates fixed deposits, equity, money market, gold, and bonds that help in understanding allocation in portfolio systematically. Showcasing this set of slides titled Investment Portfolio Fund Resource Allocation Chart Summary PDF. The topics addressed in these templates are Money Market, Equity, Fixed Deposits. All the content presented in this PPT design is completely editable. Download it and make adjustments in color, background, font etc. as per your unique business setting.
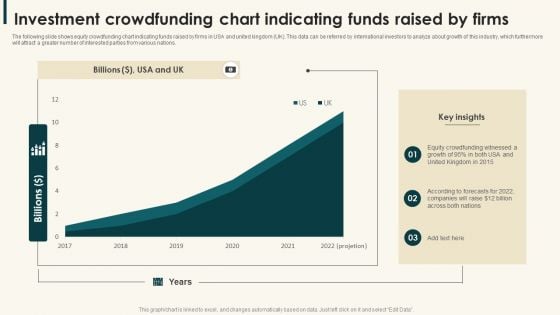
Investment Crowdfunding Chart Indicating Funds Raised By Firms Demonstration PDF
The following slide shows equity crowdfunding chart indicating funds raised by firms in USA and united kingdom UK. This data can be referred by international investors to analyze about growth of this industry, which furthermore will attract a greater number of interested parties from various nations.Showcasing this set of slides titled Investment Crowdfunding Chart Indicating Funds Raised By Firms Demonstration PDF. The topics addressed in these templates are Crowdfunding Witnessed, United Kingdom, Companies Raise. All the content presented in this PPT design is completely editable. Download it and make adjustments in color, background, font etc. as per your unique business setting.
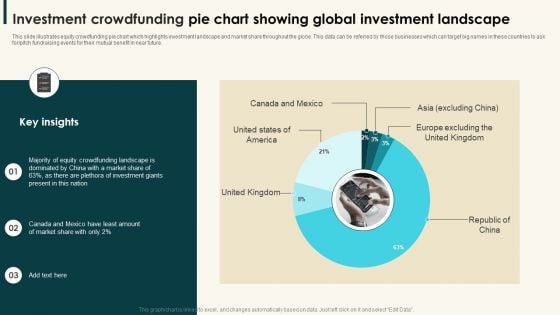
Investment Crowdfunding Pie Chart Showing Global Investment Landscape Structure PDF
This slide illustrates equity crowdfunding pie chart which highlights investment landscape and market share throughout the globe. This data can be referred by those businesses which can target big names in these countries to ask foror pitch fundraising events for their mutual benefit in near future.Showcasing this set of slides titled Investment Crowdfunding Pie Chart Showing Global Investment Landscape Structure PDF. The topics addressed in these templates are Europe Excluding, Equity Crowdfunding, Investment Giants. All the content presented in this PPT design is completely editable. Download it and make adjustments in color, background, font etc. as per your unique business setting.
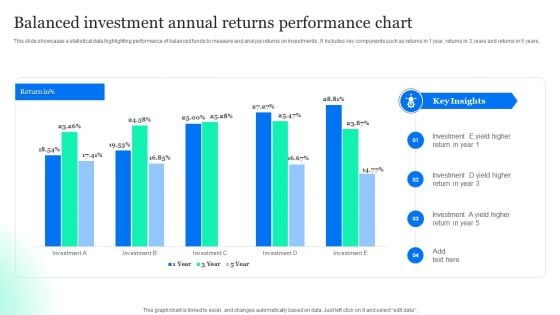
Balanced Investment Annual Returns Performance Chart Designs PDF
This slide showcases a statistical data highlighting performance of balanced funds to measure and analyze returns on investments . It includes key components such as returns in 1 year, returns in 3 years and returns in 5 years. Pitch your topic with ease and precision using this Balanced Investment Annual Returns Performance Chart Designs PDF. This layout presents information on Balanced Investment, Annual Returns, Performance Chart. It is also available for immediate download and adjustment. So, changes can be made in the color, design, graphics or any other component to create a unique layout.
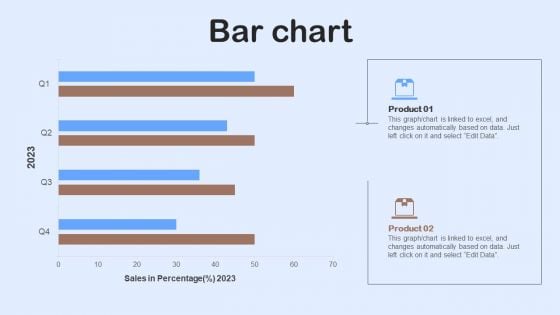
Nestle Performance Management Report Bar Chart Ppt Inspiration Shapes PDF
This graph or chart is linked to excel, and changes automatically based on data. Just left click on it and select Edit Data. Whether you have daily or monthly meetings, a brilliant presentation is necessary. Nestle Performance Management Report Bar Chart Ppt Inspiration Shapes PDF can be your best option for delivering a presentation. Represent everything in detail using Nestle Performance Management Report Bar Chart Ppt Inspiration Shapes PDF and make yourself stand out in meetings. The template is versatile and follows a structure that will cater to your requirements. All the templates prepared by Slidegeeks are easy to download and edit. Our research experts have taken care of the corporate themes as well. So, give it a try and see the results.
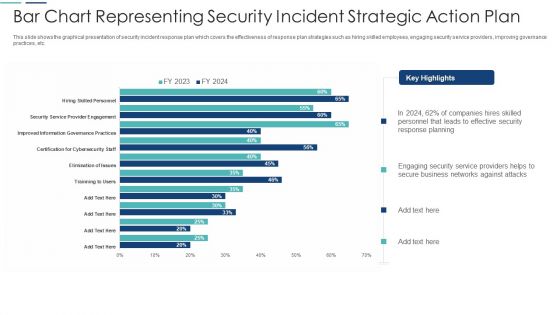
Bar Chart Representing Security Incident Strategic Action Plan Themes PDF
This slide shows the graphical presentation of security incident response plan which covers the effectiveness of response plan strategies such as hiring skilled employees, engaging security service providers, improving governance practices, etc. Showcasing this set of slides titled bar chart representing security incident strategic action plan themes pdf. The topics addressed in these templates are bar chart representing security incident strategic action plan. All the content presented in this PPT design is completely editable. Download it and make adjustments in color, background, font etc. as per your unique business setting.
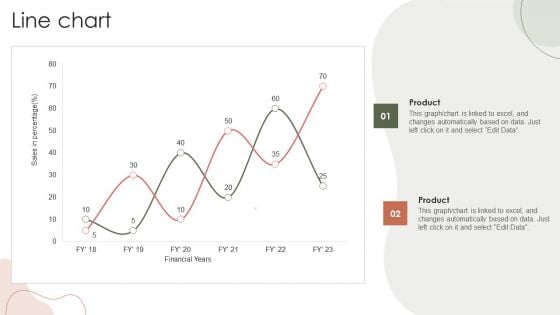
Digital Marketing Approach For Brand Awareness Line Chart Themes PDF
This Digital Marketing Approach For Brand Awareness Line Chart Themes PDF is perfect for any presentation, be it in front of clients or colleagues. It is a versatile and stylish solution for organizing your meetings. The Digital Marketing Approach For Brand Awareness Line Chart Themes PDF features a modern design for your presentation meetings. The adjustable and customizable slides provide unlimited possibilities for acing up your presentation. Slidegeeks has done all the homework before launching the product for you. So, dont wait, grab the presentation templates today
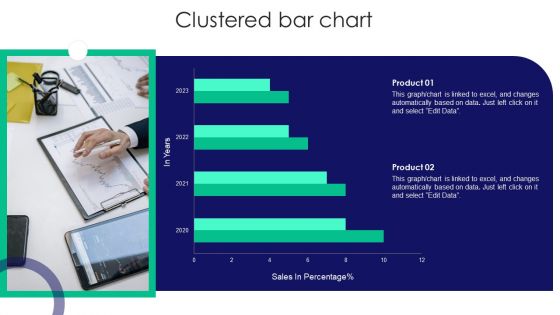
Guide To Business Customer Acquisition Clustered Bar Chart Mockup PDF
Crafting an eye catching presentation has never been more straightforward. Let your presentation shine with this tasteful yet straightforward Guide To Business Customer Acquisition Clustered Bar Chart Mockup PDF template. It offers a minimalistic and classy look that is great for making a statement. The colors have been employed intelligently to add a bit of playfulness while still remaining professional. Construct the ideal Guide To Business Customer Acquisition Clustered Bar Chart Mockup PDF that effortlessly grabs the attention of your audience. Begin now and be certain to wow your customers.
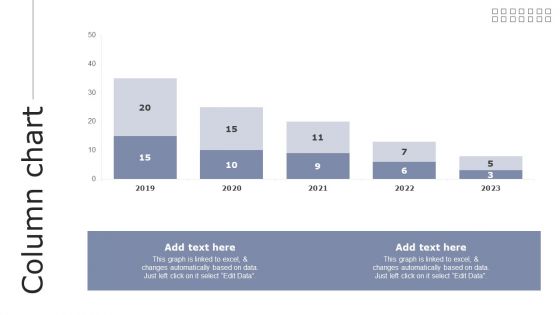
Column Chart Guide To Asset Cost Estimation Inspiration PDF
Do you have to make sure that everyone on your team knows about any specific topic I yes, then you should give Column Chart Guide To Asset Cost Estimation Inspiration PDF a try. Our experts have put a lot of knowledge and effort into creating this impeccable Column Chart Guide To Asset Cost Estimation Inspiration PDF. You can use this template for your upcoming presentations, as the slides are perfect to represent even the tiniest detail. You can download these templates from the Slidegeeks website and these are easy to edit. So grab these today.
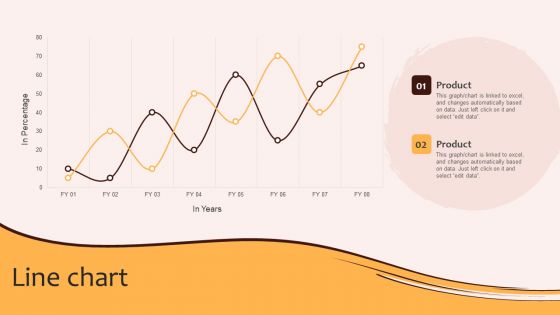
Line Chart Digital Marketing Plan For Restaurant Business Template PDF
Are you searching for a Line Chart Digital Marketing Plan For Restaurant Business Template PDF that is uncluttered, straightforward, and original Its easy to edit, and you can change the colors to suit your personal or business branding. For a presentation that expresses how much effort you have put in, this template is ideal With all of its features, including tables, diagrams, statistics, and lists, its perfect for a business plan presentation. Make your ideas more appealing with these professional slides. Download Line Chart Digital Marketing Plan For Restaurant Business Template PDF from Slidegeeks today.
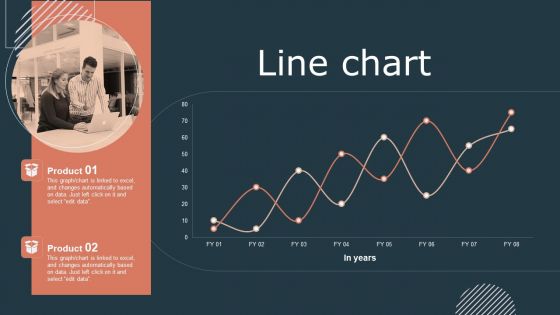
Effective Workforce Participation Action Planning Line Chart Inspiration PDF
Whether you have daily or monthly meetings, a brilliant presentation is necessary. Effective Workforce Participation Action Planning Line Chart Inspiration PDF can be your best option for delivering a presentation. Represent everything in detail using Effective Workforce Participation Action Planning Line Chart Inspiration PDF and make yourself stand out in meetings. The template is versatile and follows a structure that will cater to your requirements. All the templates prepared by Slidegeeks are easy to download and edit. Our research experts have taken care of the corporate themes as well. So, give it a try and see the results.
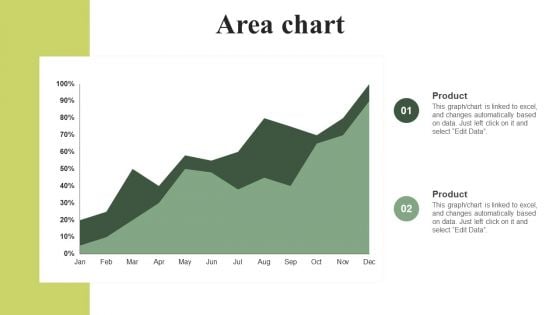
Area Chart Effective Planning For Monetary Strategy Execution Ideas PDF
Are you searching for a Area Chart Effective Planning For Monetary Strategy Execution Ideas PDF that is uncluttered, straightforward, and original Its easy to edit, and you can change the colors to suit your personal or business branding. For a presentation that expresses how much effort you have put in, this template is ideal With all of its features, including tables, diagrams, statistics, and lists, its perfect for a business plan presentation. Make your ideas more appealing with these professional slides. Download Area Chart Effective Planning For Monetary Strategy Execution Ideas PDF from Slidegeeks today.
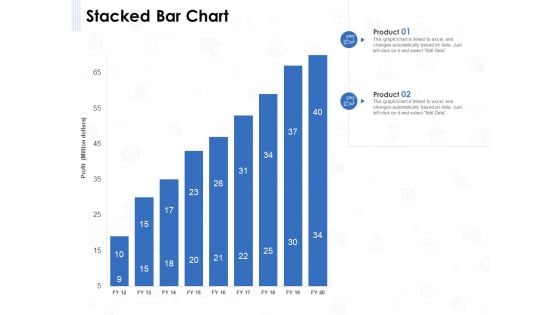
Seed Investment Stacked Bar Chart Ppt Show Smartart PDF
Presenting this set of slides with name seed investment stacked bar chart ppt show smartart pdf. The topics discussed in these slides are product 1, product 2. This is a completely editable PowerPoint presentation and is available for immediate download. Download now and impress your audience.
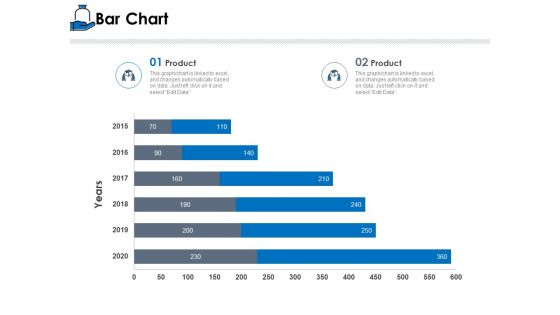
Startup Investment Ideas Bar Chart Ppt Layouts Layouts PDF
Presenting this set of slides with name startup investment ideas bar chart ppt layouts layouts pdf. The topics discussed in these slides are product 1, product 2. This is a completely editable PowerPoint presentation and is available for immediate download. Download now and impress your audience.
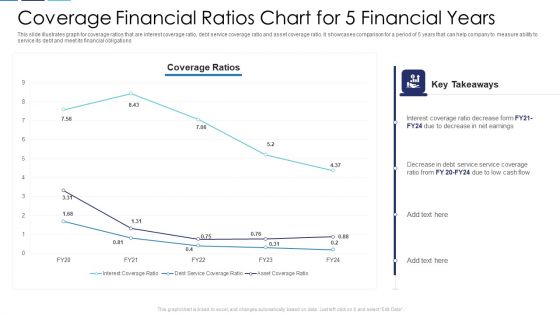
Coverage Financial Ratios Chart For 5 Financial Years Themes PDF
This slide illustrates graph for coverage ratios that are interest coverage ratio, debt service coverage ratio and asset coverage ratio. It showcases comparison for a period of 5 years that can help company to measure ability to service its debt and meet its financial obligations Showcasing this set of slides titled coverage financial ratios chart for 5 financial years themes pdf. The topics addressed in these templates are coverage financial ratios chart for 5 financial years. All the content presented in this PPT design is completely editable. Download it and make adjustments in color, background, font etc. as per your unique business setting.

Dividend Payout Financial Ratios Chart Comparison Themes PDF
This slide showcases dividend payout ratio graph that can help organization to determine the percentage of the companys earnings that is paid out to shareholders by way of dividend. It showcases comparison for a period of 8 years Showcasing this set of slides titled dividend payout financial ratios chart comparison themes pdf. The topics addressed in these templates are dividend payout financial ratios chart comparison. All the content presented in this PPT design is completely editable. Download it and make adjustments in color, background, font etc. as per your unique business setting.
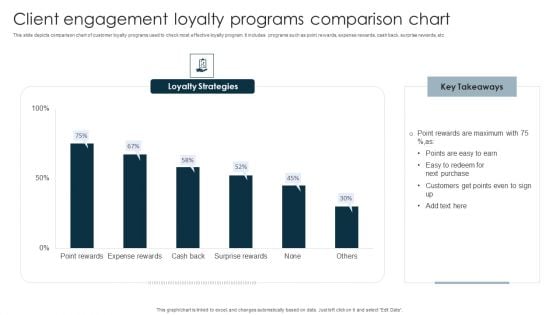
Client Engagement Loyalty Programs Comparison Chart Infographics PDF
This slide depicts comparison chart of customer loyalty programs used to check most effective loyalty program. It includes programs such as point rewards, expense rewards, cash back, surprise rewards, etc. Pitch your topic with ease and precision using this Client Engagement Loyalty Programs Comparison Chart Infographics PDF. This layout presents information on Point Rewards, Next Purchase, Customers. It is also available for immediate download and adjustment. So, changes can be made in the color, design, graphics or any other component to create a unique layout.
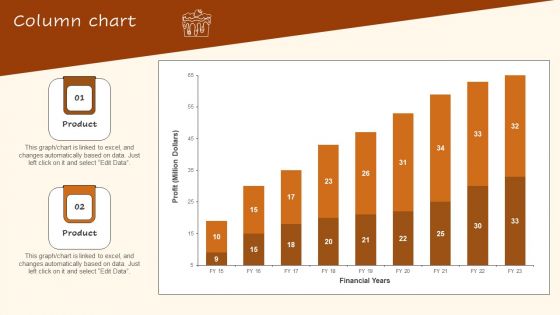
Digital Advertising Plan For Bakery Business Column Chart Sample PDF
Here you can discover an assortment of the finest PowerPoint and Google Slides templates. With these templates, you can create presentations for a variety of purposes while simultaneously providing your audience with an eye catching visual experience. Download Digital Advertising Plan For Bakery Business Column Chart Sample PDF to deliver an impeccable presentation. These templates will make your job of preparing presentations much quicker, yet still, maintain a high level of quality. Slidegeeks has experienced researchers who prepare these templates and write high quality content for you. Later on, you can personalize the content by editing the Digital Advertising Plan For Bakery Business Column Chart Sample PDF.
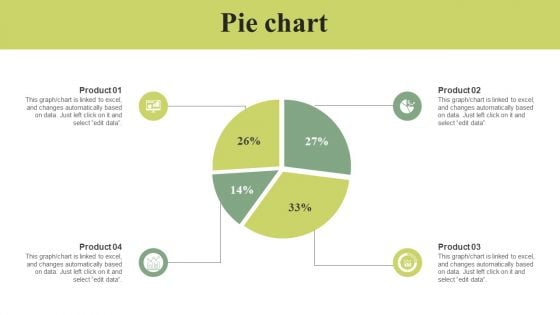
Pie Chart Effective Planning For Monetary Strategy Execution Brochure PDF
Formulating a presentation can take up a lot of effort and time, so the content and message should always be the primary focus. The visuals of the PowerPoint can enhance the presenters message, so our Pie Chart Effective Planning For Monetary Strategy Execution Brochure PDF was created to help save time. Instead of worrying about the design, the presenter can concentrate on the message while our designers work on creating the ideal templates for whatever situation is needed. Slidegeeks has experts for everything from amazing designs to valuable content, we have put everything into Pie Chart Effective Planning For Monetary Strategy Execution Brochure PDF
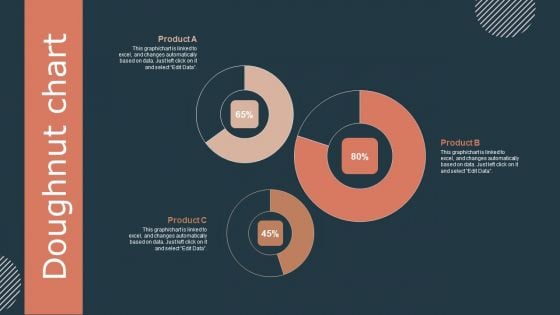
Effective Workforce Participation Action Planning Doughnut Chart Clipart PDF
Get a simple yet stunning designed Effective Workforce Participation Action Planning Doughnut Chart Clipart PDF. It is the best one to establish the tone in your meetings. It is an excellent way to make your presentations highly effective. So, download this PPT today from Slidegeeks and see the positive impacts. Our easy to edit Effective Workforce Participation Action Planning Doughnut Chart Clipart PDF can be your go to option for all upcoming conferences and meetings. So, what are you waiting for Grab this template today.
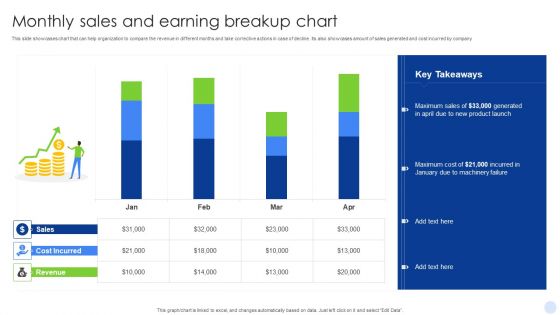
Monthly Sales And Earning Breakup Chart Clipart PDF
This slide showcases chart that can help organization to compare the revenue in different months and take corrective actions in case of decline. Its also showcases amount of sales generated and cost incurred by company. Showcasing this set of slides titled Monthly Sales And Earning Breakup Chart Clipart PDF. The topics addressed in these templates are New Product Launch, Machinery Failure. All the content presented in this PPT design is completely editable. Download it and make adjustments in color, background, font etc. as per your unique business setting.
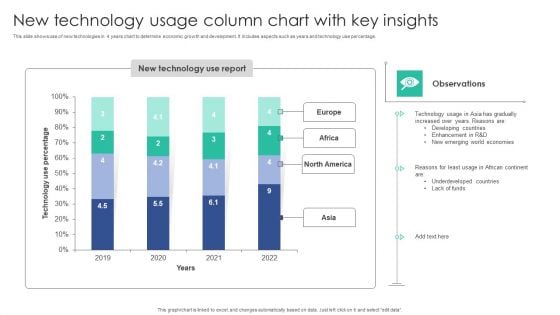
New Technology Usage Column Chart With Key Insights Brochure PDF
This slide shows use of new technologies in 4 years chart to determine economic growth and development. It Includes aspects such as years and technology use percentage.Pitch your topic with ease and precision using this New Technology Usage Column Chart With Key Insights Brochure PDF. This layout presents information on Technology Gradually, Increased Reasons, Developing Countries. It is also available for immediate download and adjustment. So, changes can be made in the color, design, graphics or any other component to create a unique layout.
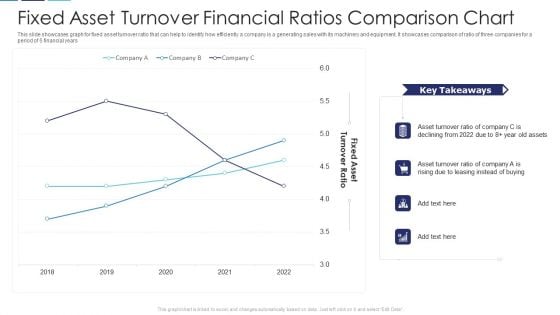
Fixed Asset Turnover Financial Ratios Comparison Chart Structure PDF
This slide showcases graph for fixed asset turnover ratio that can help to identify how efficiently a company is a generating sales with its machinery and equipment. It showcases comparison of ratio of three companies for a period of 5 financial years Showcasing this set of slides titled fixed asset turnover financial ratios comparison chart structure pdf. The topics addressed in these templates are fixed asset turnover financial ratios comparison chart. All the content presented in this PPT design is completely editable. Download it and make adjustments in color, background, font etc. as per your unique business setting.
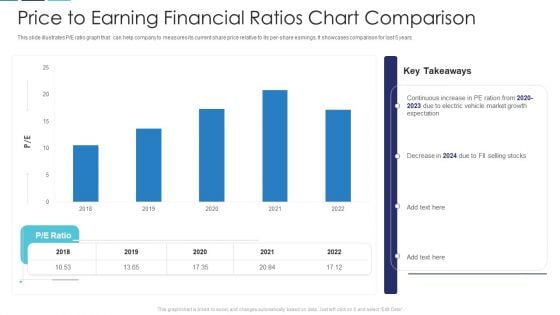
Price To Earning Financial Ratios Chart Comparison Slides PDF
This slide illustrates P or E ratio graph that can help company to measures its current share price relative to its per-share earnings. It showcases comparison for last 5 years Showcasing this set of slides titled price to earning financial ratios chart comparison slides pdf. The topics addressed in these templates are price to earning financial ratios chart comparison. All the content presented in this PPT design is completely editable. Download it and make adjustments in color, background, font etc. as per your unique business setting.
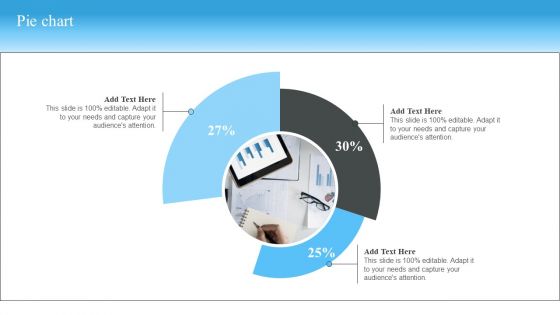
Market Evaluation Of IT Industry Pie Chart Formats PDF
Explore a selection of the finest Market Evaluation Of IT Industry Pie Chart Formats PDF here. With a plethora of professionally designed and pre made slide templates, you can quickly and easily find the right one for your upcoming presentation. You can use our Market Evaluation Of IT Industry Pie Chart Formats PDF to effectively convey your message to a wider audience. Slidegeeks has done a lot of research before preparing these presentation templates. The content can be personalized and the slides are highly editable. Grab templates today from Slidegeeks.
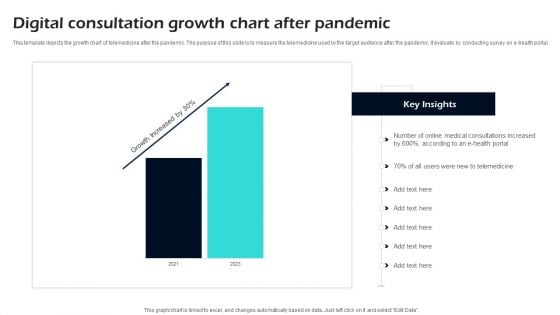
Digital Consultation Growth Chart After Pandemic Ppt Slides
This template depicts the growth chart of telemedicine after the pandemic. The purpose of this slide is to measure the telemedicine used by the target audience after the pandemic. It evaluate by conducting survey on e health portal Showcasing this set of slides titled Digital Consultation Growth Chart After Pandemic Ppt Slides. The topics addressed in these templates are Consultation, Growth, Pandemic. All the content presented in this PPT design is completely editable. Download it and make adjustments in color, background, font etc. as per your unique business setting.
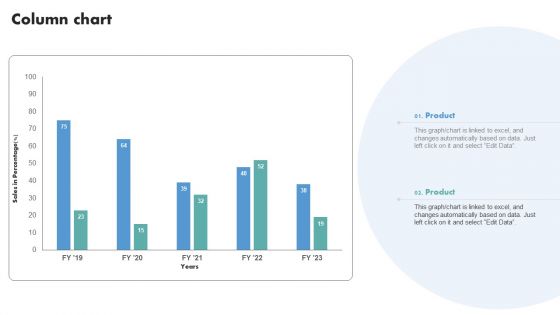
Techniques To Boost Brand Awareness Column Chart Ppt Slides PDF
Crafting an eye-catching presentation has never been more straightforward. Let your presentation shine with this tasteful yet straightforward Techniques To Boost Brand Awareness Column Chart Ppt Slides PDF template. It offers a minimalistic and classy look that is great for making a statement. The colors have been employed intelligently to add a bit of playfulness while still remaining professional. Construct the ideal Techniques To Boost Brand Awareness Column Chart Ppt Slides PDF that effortlessly grabs the attention of your audience Begin now and be certain to wow your customers.


 Continue with Email

 Home
Home


