Finance Chart
Financial Pie Chart Success PowerPoint Templates And PowerPoint Backgrounds 0411
Microsoft PowerPoint Template and Background with pie chart banner Achieve strong & sustainable quality gains with our Financial Pie Chart Success PowerPoint Templates And PowerPoint Backgrounds 0411. They will make you look good.
Year Analyzing Chart Business PowerPoint Templates And PowerPoint Backgrounds 0411
Microsoft PowerPoint Template and Background with business chart earnings of the year Your career will soar away. Our Year Analyzing Chart Business PowerPoint Templates And PowerPoint Backgrounds 0411 will give it wings.
Organizational Chart Business PowerPoint Templates And PowerPoint Backgrounds 0411
Microsoft PowerPoint Template and Background with organizational chart pyramid drawn on sticky notes Extract assent with our Organizational Chart Business PowerPoint Templates And PowerPoint Backgrounds 0411. The audience will become agreeable.
Business Chart Concept Success PowerPoint Templates And PowerPoint Backgrounds 0511
Microsoft PowerPoint Template and Background with business chart showing success Leave a good taste with our Business Chart Concept Success PowerPoint Templates And PowerPoint Backgrounds 0511. They always add to the fare.
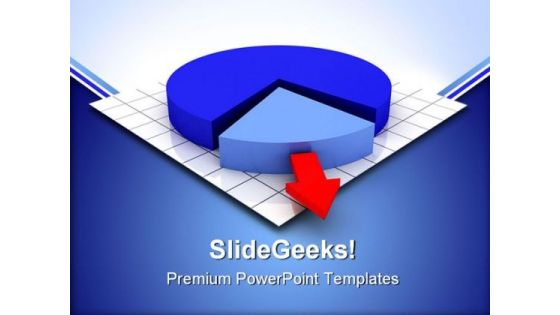
Pie Chart Business PowerPoint Templates And PowerPoint Backgrounds 0511
Microsoft PowerPoint Template and Background with a pie chart with one segment being removed Exert some pressure with our Pie Chart Business PowerPoint Templates And PowerPoint Backgrounds 0511. Get the decision in your favour.

Growth Chart Global PowerPoint Templates And PowerPoint Backgrounds 0611
Microsoft PowerPoint Template and Background with chart with upwards arrow over a map of the americas Complete the circuit with our Growth Chart Global PowerPoint Templates And PowerPoint Backgrounds 0611. Ideas will flash in your mind.
Pie Chart Success PowerPoint Templates And PowerPoint Backgrounds 0811
Microsoft PowerPoint Template and Background with pie chart stairs Take a blind date with our Pie Chart Success PowerPoint Templates And PowerPoint Backgrounds 0811. You will be charmed to the core.
Business Chart Background PowerPoint Templates And PowerPoint Backgrounds 1011
Microsoft PowerPoint Template and Background with charts, world map and globe Your thoughts will strike the right chords. Pluck the strings with our Business Chart Background PowerPoint Templates And PowerPoint Backgrounds 1011.
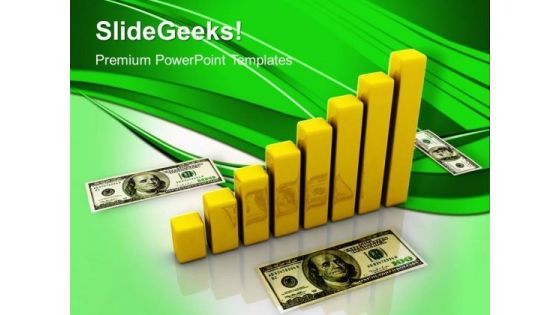
Bar Chart Dollar Business PowerPoint Templates And PowerPoint Themes 0912
Bar Chart Dollar Business PowerPoint Templates And PowerPoint Themes 0912-Microsoft Powerpoint Templates and Background with dollar bar graph-Dollar bar graph, money, finance, success, future, business Make people notice your slides with our Bar Chart Dollar Business PowerPoint Templates And PowerPoint Themes 0912. You will be at the top of your game.
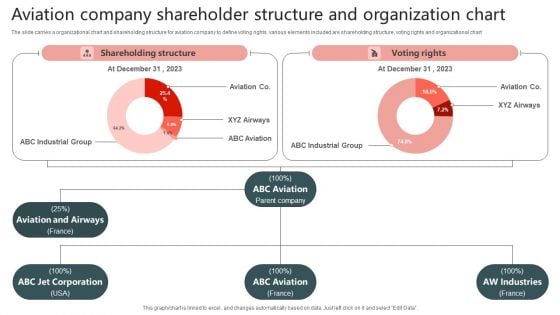
Aviation Company Shareholder Structure And Organization Chart Brochure PDF
The slide carries a organizational chart and shareholding structure for aviation company to define voting rights. various elements included are shareholding structure, voting rights and organizational chart. Showcasing this set of slides titled Aviation Company Shareholder Structure And Organization Chart Brochure PDF. The topics addressed in these templates are Aviation Company Shareholder Structure, Organization Chart. All the content presented in this PPT design is completely editable. Download it and make adjustments in color, background, font etc. as per your unique business setting.
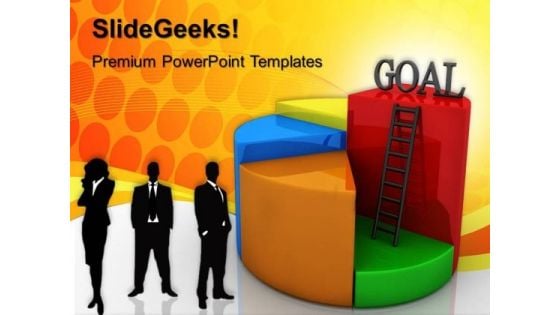
Goal Chart Concept Success PowerPoint Templates And PowerPoint Themes 0612
Goal Chart Concept Success PowerPoint Templates And PowerPoint Themes PPT Slides-Microsoft Powerpoint Templates and Background with pie chart concept Our Goal Chart Concept Success PowerPoint Templates And PowerPoint Themes 0612 will extend a hand. They provide all the assistance you desire.
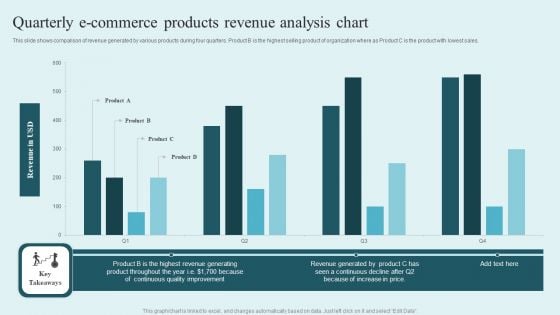
Quarterly E Commerce Products Revenue Analysis Chart Guidelines PDF
This slide shows comparison of revenue generated by various products during four quarters. Product B is the highest selling product of organization where as Product C is the product with lowest sales. Showcasing this set of slides titled Quarterly E Commerce Products Revenue Analysis Chart Guidelines PDF. The topics addressed in these templates are Revenue USD, Product, Continuous Quality Improvement. All the content presented in this PPT design is completely editable. Download it and make adjustments in color, background, font etc. as per your unique business setting.
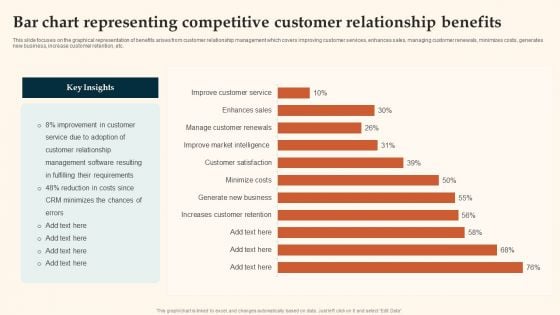
Bar Chart Representing Competitive Customer Relationship Benefits Demonstration PDF
This slide focuses on the graphical representation of benefits arises from customer relationship management which covers improving customer services, enhances sales, managing customer renewals, minimizes costs, generates new business, increase customer retention, etc. Showcasing this set of slides titled Bar Chart Representing Competitive Customer Relationship Benefits Demonstration PDF. The topics addressed in these templates are Management Software, Customer Relationship, Costs Since. All the content presented in this PPT design is completely editable. Download it and make adjustments in color, background, font etc. as per your unique business setting.
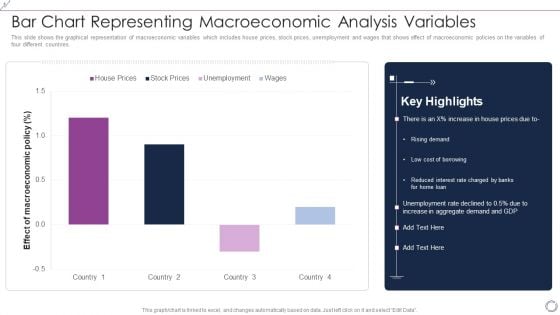
Bar Chart Representing Macroeconomic Analysis Variables Background PDF
This slide shows the graphical representation of macroeconomic variables which includes house prices, stock prices, unemployment and wages that shows effect of macroeconomic policies on the variables of four different countries. Showcasing this set of slides titled Bar Chart Representing Macroeconomic Analysis Variables Background PDF. The topics addressed in these templates are House Prices, Stock Prices, Unemployment, Wages. All the content presented in this PPT design is completely editable. Download it and make adjustments in color, background, font etc. as per your unique business setting.
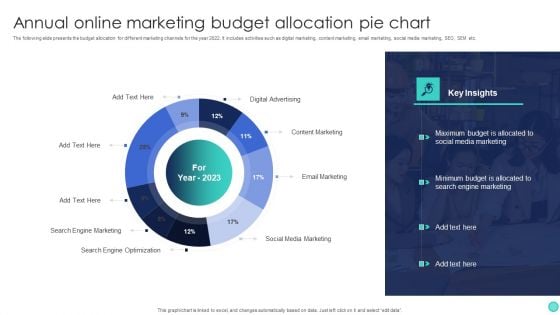
Annual Online Marketing Budget Allocation Pie Chart Pictures PDF
The following slide presents the budget allocation for different marketing channels for the year 2022. It includes activities such as digital marketing, content marketing, email marketing, social media marketing, SEO, SEM etc. Showcasing this set of slides titled Annual Online Marketing Budget Allocation Pie Chart Pictures PDF. The topics addressed in these templates are Digital Advertising, Content Marketing, Email Marketing, Social Media Marketing, Search Engine Optimization. All the content presented in this PPT design is completely editable. Download it and make adjustments in color, background, font etc. as per your unique business setting.
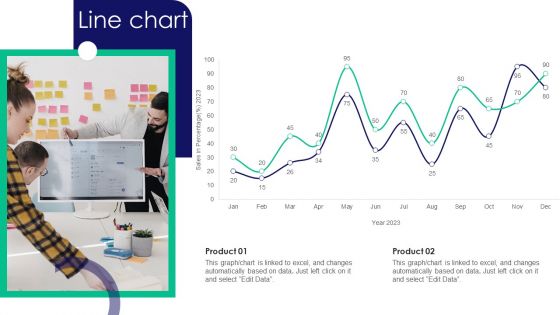
Guide To Business Customer Acquisition Line Chart Infographics PDF
Coming up with a presentation necessitates that the majority of the effort goes into the content and the message you intend to convey. The visuals of a PowerPoint presentation can only be effective if it supplements and supports the story that is being told. Keeping this in mind our experts created Guide To Business Customer Acquisition Line Chart Infographics PDF to reduce the time that goes into designing the presentation. This way, you can concentrate on the message while our designers take care of providing you with the right template for the situation.
Product Marketing And Promotional Budget Spends Pie Chart Icons PDF
This slide covers marketing expenditures from budget allotted. It includes percentages for online advertising, sales training, conventions, trade shows, print advertising, publications, radio advertisements, magazines, catalogues and brochures. Pitch your topic with ease and precision using this Product Marketing And Promotional Budget Spends Pie Chart Icons PDF. This layout presents information on Conventions Were Maximum, Drive Maximum, Profit And Sales. It is also available for immediate download and adjustment. So, changes can be made in the color, design, graphics or any other component to create a unique layout.
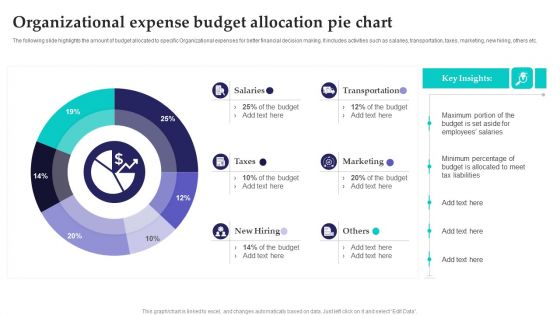
Organizational Expense Budget Allocation Pie Chart Inspiration PDF
The following slide highlights the amount of budget allocated to specific Organizational expenses for better financial decision making. It includes activities such as salaries, transportation, taxes, marketing, new hiring, others etc. Pitch your topic with ease and precision using this Organizational Expense Budget Allocation Pie Chart Inspiration PDF. This layout presents information on Transportation, Marketing, Budget. It is also available for immediate download and adjustment. So, changes can be made in the color, design, graphics or any other component to create a unique layout.
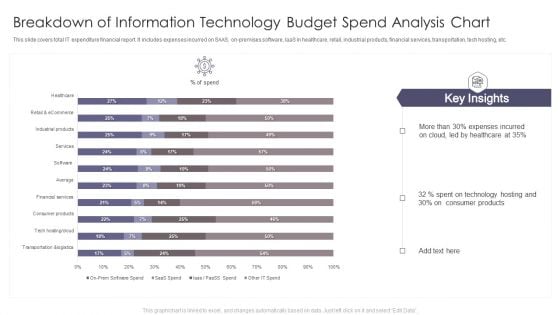
Breakdown Of Information Technology Budget Spend Analysis Chart Download PDF
This slide covers total IT expenditure financial report. It includes expenses incurred on SAAS, on-premises software, laaS in healthcare, retail, industrial products, financial services, transportation, tech hosting, etc. Pitch your topic with ease and precision using this Breakdown Of Information Technology Budget Spend Analysis Chart Download PDF. This layout presents information on Expenses Incurred, Technology Hosting, Consumer Products. It is also available for immediate download and adjustment. So, changes can be made in the color, design, graphics or any other component to create a unique layout.
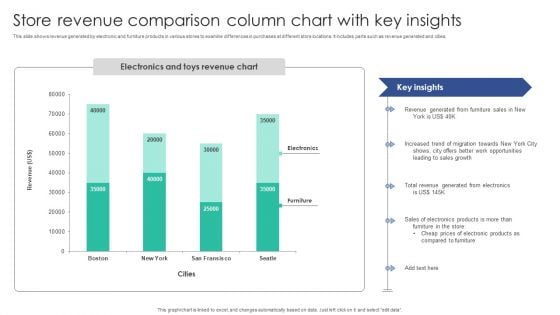
Store Revenue Comparison Column Chart With Key Insights Themes PDF
This slide shows revenue generated by electronic and furniture products in various stores to examine differences in purchases at different store locations. It includes parts such as revenue generated and cities. Showcasing this set of slides titled Store Revenue Comparison Column Chart With Key Insights Themes PDF. The topics addressed in these templates are Revenue Generated, Furniture Sales, Increased Trend. All the content presented in this PPT design is completely editable. Download it and make adjustments in color, background, font etc. as per your unique business setting.
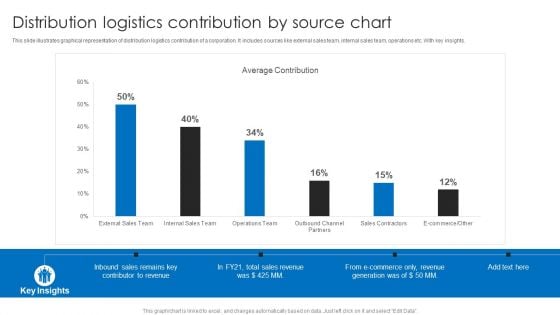
Distribution Logistics Contribution By Source Chart Ppt Model Guidelines PDF
This slide illustrates graphical representation of distribution logistics contribution of a corporation. It includes sources like external sales team, internal sales team, operations etc. With key insights. Showcasing this set of slides titled Distribution Logistics Contribution By Source Chart Ppt Model Guidelines PDF. The topics addressed in these templates are Average Contribution, Total Sales Revenue, E Commerce. All the content presented in this PPT design is completely editable. Download it and make adjustments in color, background, font etc. as per your unique business setting.
Target Vs Accomplishment Evaluation Chart Of Sales Representatives Icons PDF
This slide showcases sales targets and achievements of sales presentative which helps track employee efficiency. It provides information regarding set targets for sales representatives which strategies and success factors. Showcasing this set of slides titled Target Vs Accomplishment Evaluation Chart Of Sales Representatives Icons PDF. The topics addressed in these templates are Effective Communication, Manage Sales Targets, Set Activity Goals. All the content presented in this PPT design is completely editable. Download it and make adjustments in color, background, font etc. as per your unique business setting.
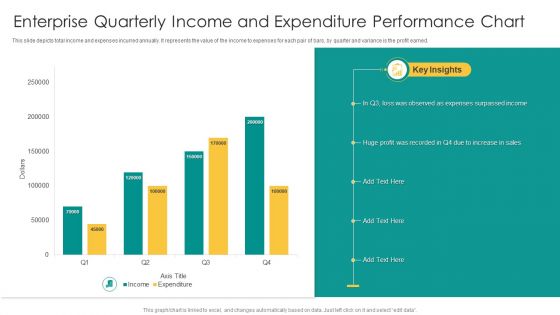
Enterprise Quarterly Income And Expenditure Performance Chart Graphics PDF
This slide depicts total income and expenses incurred annually. It represents the value of the income to expenses for each pair of bars, by quarter and variance is the profit earned. Pitch your topic with ease and precision using this Enterprise Quarterly Income And Expenditure Performance Chart Graphics PDF. This layout presents information on Expenses Surpassed Income, Sales, Huge Profit. It is also available for immediate download and adjustment. So, changes can be made in the color, design, graphics or any other component to create a unique layout.
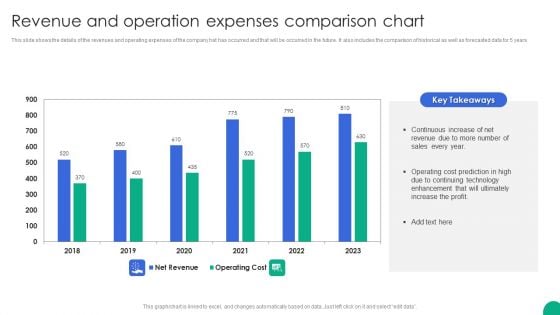
Revenue And Operation Expenses Comparison Chart Slides PDF
This slide shows the details of the revenues and operating expenses of the company hat has occurred and that will be occurred in the future. It also includes the comparison of historical as well as forecasted data for 5 years.Showcasing this set of slides titled Revenue And Operation Expenses Comparison Chart Slides PDF. The topics addressed in these templates are Continuous Increase, Operating Cost, Enhancement Ultimately. All the content presented in this PPT design is completely editable. Download it and make adjustments in color, background, font etc. as per your unique business setting.
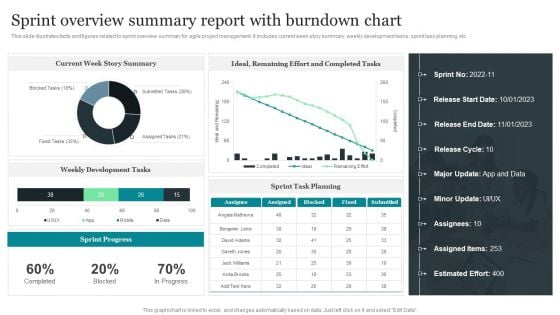
Sprint Overview Summary Report With Burndown Chart Rules PDF
This slide illustrates facts and figures related to sprint overview summary for agile project management. It includes current week story summary, weekly development tasks, sprint task planning, etc. Showcasing this set of slides titled Sprint Overview Summary Report With Burndown Chart Rules PDF. The topics addressed in these templates are Current Week Story Summary, Weekly Development Tasks, Sprint Task Planning. All the content presented in this PPT design is completely editable. Download it and make adjustments in color, background, font etc. as per your unique business setting.
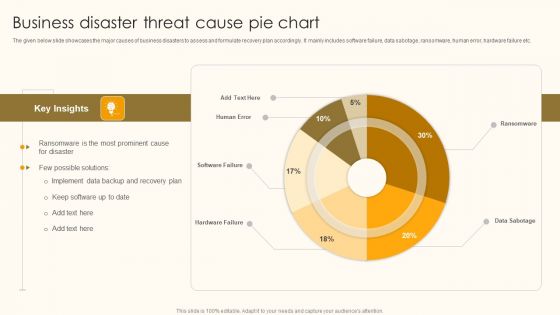
Business Disaster Threat Cause Pie Chart Ppt Pictures Gallery PDF
The given below slide showcases the major causes of business disasters to assess and formulate recovery plan accordingly. It mainly includes software failure, data sabotage, ransomware, human error, hardware failure etc. Showcasing this set of slides titled Business Disaster Threat Cause Pie Chart Ppt Pictures Gallery PDF. The topics addressed in these templates are Key Insights, Few Possible Solutions, Implement Data Backup. All the content presented in this PPT design is completely editable. Download it and make adjustments in color, background, font etc. as per your unique business setting.
Tracking Goals Alignment And Analytical Chart Slides PDF
This slide showcases a visual depiction of the organizations goals, overall progress, and goal alignment. It also includes enlisted objectives tracking details such as end date, assigner, progress, and performance rating. Showcasing this set of slides titled Tracking Goals Alignment And Analytical Chart Slides PDF. The topics addressed in these templates are Develop Process Improvement Plan, Increase Customer Retention Rate. All the content presented in this PPT design is completely editable. Download it and make adjustments in color, background, font etc. as per your unique business setting.
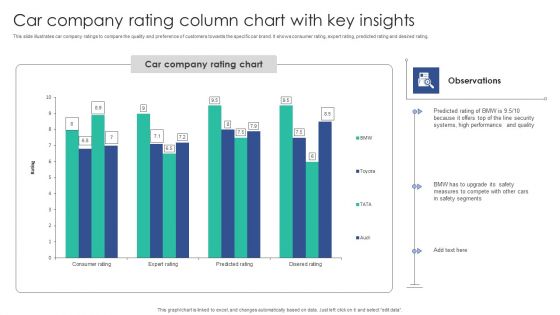
Car Company Rating Column Chart With Key Insights Structure PDF
This slide illustrates car company ratings to compare the quality and preference of customers towards the specific car brand. It shows consumer rating, expert rating, predicted rating and desired rating.Showcasing this set of slides titled Car Company Rating Column Chart With Key Insights Structure PDF. The topics addressed in these templates are Performance Quality, Top Security, Predicted Rating. All the content presented in this PPT design is completely editable. Download it and make adjustments in color, background, font etc. as per your unique business setting.
Outcomes Summary Of Company Revenues Using Pie Chart Icons PDF
This slide focuses on graphical representation of revenues earned by company which includes media such as print advertising, electronic-media, events, paid subscriptions , custom publishing, etc.Pitch your topic with ease and precision using this Outcomes Summary Of Company Revenues Using Pie Chart Icons PDF This layout presents information on Custom Publishing, Paid Subscriptions, Revenues Are Generated It is also available for immediate download and adjustment. So, changes can be made in the color, design, graphics or any other component to create a unique layout.
Six Months Business Valuation Chart Ppt Styles Icons PDF
This slide shows the 6 months graph to measure company valuation. It is representing that highest valuation of company was calculated in the month of June due to increase in sales. Pitch your topic with ease and precision using this Six Months Business Valuation Chart Ppt Styles Icons PDF. This layout presents information on Increase Sales, Company Valuation. It is also available for immediate download and adjustment. So, changes can be made in the color, design, graphics or any other component to create a unique layout.
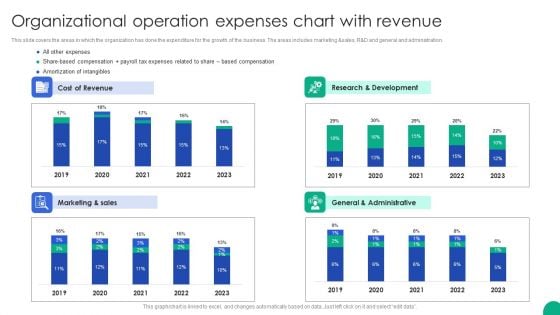
Organizational Operation Expenses Chart With Revenue Microsoft PDF
This slide covers the areas in which the organization has done the expenditure for the growth of the business. The areas includes marketing sales, R D and general and administration.Pitch your topic with ease and precision using this Organizational Operation Expenses Chart With Revenue Microsoft PDF. This layout presents information on Cost Revenue, Research Development, General Administrative. It is also available for immediate download and adjustment. So, changes can be made in the color, design, graphics or any other component to create a unique layout.
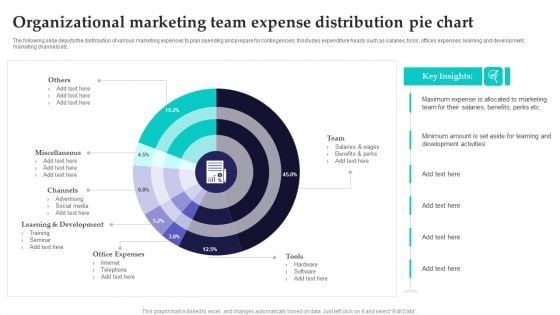
Organizational Marketing Team Expense Distribution Pie Chart Infographics PDF
The following slide depicts the distribution of various marketing expenses to plan spending and prepare for contingencies. It includes expenditure heads such as salaries, tools, offices expenses, learning and development, marketing channels etc. Pitch your topic with ease and precision using this Organizational Marketing Team Expense Distribution Pie Chart Infographics PDF. This layout presents information on Development, Office Expenses, Internet. It is also available for immediate download and adjustment. So, changes can be made in the color, design, graphics or any other component to create a unique layout.
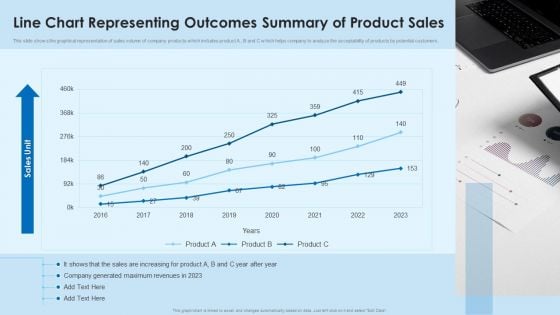
Line Chart Representing Outcomes Summary Of Product Sales Mockup PDF
This slide shows the graphical representation of sales volume of company products which includes product A , B and C which helps company to analyze the acceptability of products by potential customers.Pitch your topic with ease and precision using this Line Chart Representing Outcomes Summary Of Product Sales Mockup PDF This layout presents information on Company Generated, Maximum Revenues, Increasing For Product It is also available for immediate download and adjustment. So, changes can be made in the color, design, graphics or any other component to create a unique layout.
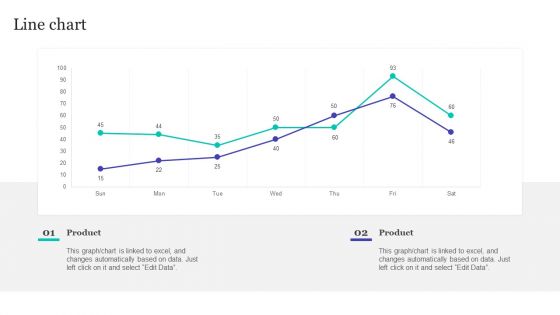
Strategic Brand Refreshing Actions Line Chart Information PDF
This Strategic Brand Refreshing Actions Line Chart Information PDF from Slidegeeks makes it easy to present information on your topic with precision. It provides customization options, so you can make changes to the colors, design, graphics, or any other component to create a unique layout. It is also available for immediate download, so you can begin using it right away. Slidegeeks has done good research to ensure that you have everything you need to make your presentation stand out. Make a name out there for a brilliant performance.
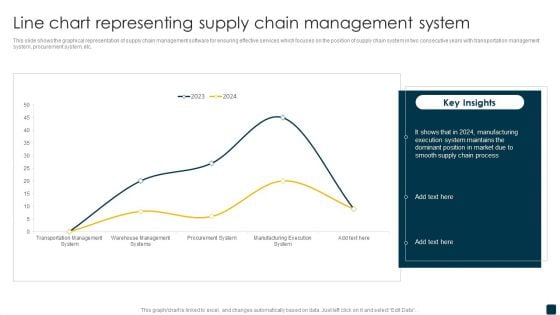
Line Chart Representing Supply Chain Management System Rules PDF
This slide shows the graphical representation of supply chain management software for ensuring effective services which focuses on the position of supply chain system in two consecutive years with transportation management system, procurement system, etc. Pitch your topic with ease and precision using this Line Chart Representing Supply Chain Management System Rules PDF. This layout presents information on Supply Chain Process, Manufacturing, Execution System. It is also available for immediate download and adjustment. So, changes can be made in the color, design, graphics or any other component to create a unique layout.
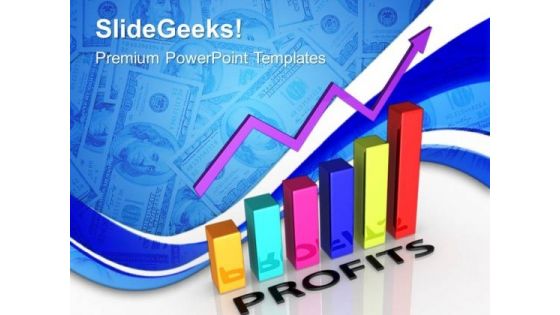
Profits Bar Chart Sales PowerPoint Templates And PowerPoint Themes 0612
Profits Bar Chart Sales PowerPoint Templates And PowerPoint Themes PPT Slides-Microsoft Powerpoint Templates and Background with graph with arrow Let our Profits Bar Chart Sales PowerPoint Templates And PowerPoint Themes 0612 do your errands. They will bring in the goodies for you.
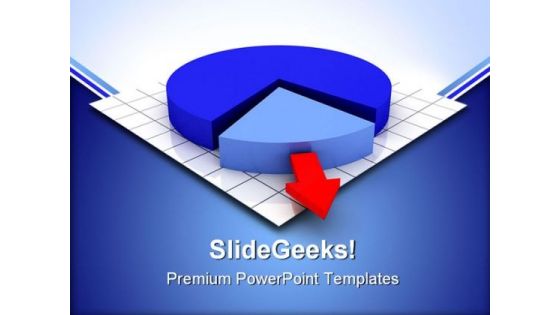
Pie Chart Business PowerPoint Themes And PowerPoint Slides 0511
Microsoft PowerPoint Slide and Theme with a pie chart with one segment being removed Our Pie Chart Business PowerPoint Themes And PowerPoint Slides 0511 save time creating a mind blowing presentation. With our money back guarantee you have nothing to lose.
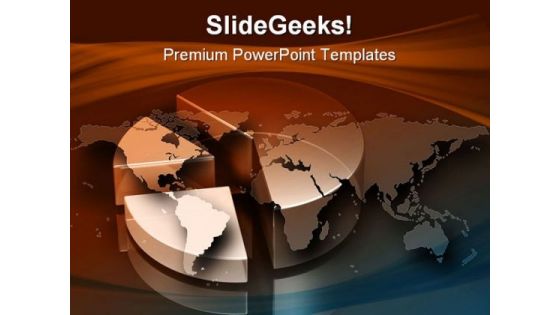
Pie Chart Business PowerPoint Themes And PowerPoint Slides 0711
Microsoft PowerPoint Theme and Slide with a flat map of the world over top of a transparent three-segment bar chart Be liberal with graphics in your presentations. Achieve that with our Pie Chart Business PowerPoint Themes And PowerPoint Slides 0711. Dont waste time struggling with PowerPoint. Let us do it for you.
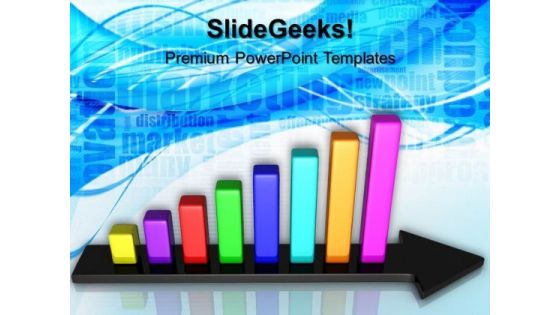
Bar Chart Growth Business PowerPoint Templates And PowerPoint Themes 0612
Bar Chart Growth Business PowerPoint Templates And PowerPoint Themes PPT Slides-Microsoft Powerpoint Templates and Background with business success with arrow Enumerate the facts on our Bar Chart Growth Business PowerPoint Templates And PowerPoint Themes 0612. Establish the correct chain of events.
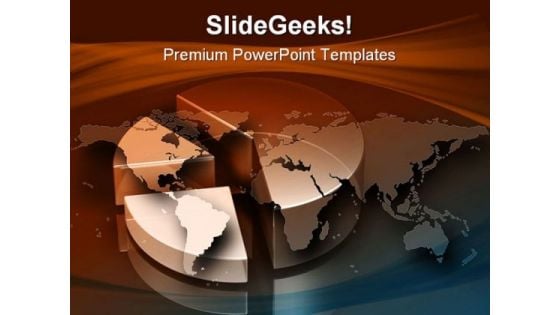
Pie Chart Business PowerPoint Templates And PowerPoint Backgrounds 0711
Microsoft PowerPoint Template and Background with a flat map of the world over top of a transparent three-segment bar chart Inform your audience with our Pie Chart Business PowerPoint Templates And PowerPoint Backgrounds 0711. Make sure your presentation gets the attention it deserves.
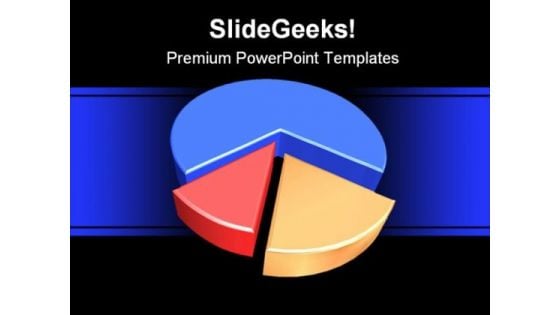
Pie Chart Business PowerPoint Templates And PowerPoint Backgrounds 0411
Microsoft PowerPoint Template and Background with rendering of pie graph on white background Get success delivered on a platter with our Pie Chart Business PowerPoint Templates And PowerPoint Backgrounds 0411. Dont pass up this opportunity to shine.
Pie Chart Business PowerPoint Themes And PowerPoint Slides 0411
Microsoft PowerPoint Theme and Slide with rendering of pie graph on white Slide Measure your team's success with our Pie Chart Business PowerPoint Themes And PowerPoint Slides 0411. You will be at the top of your game.
Money Chart Ppt Icon For Ppt Templates And Slides Cc
Microsoft PowerPoint Template and Background with financial diagram consisting of golden Restore faith with our Money Chart Ppt Icon For Ppt Templates And Slides Cc. Download without worries with our money back guaranteee.
Money Chart Ppt Icon For Ppt Templates And Slides F
Microsoft PowerPoint Template and Background with financial diagram consisting of golden Forge ahead with our Money Chart Ppt Icon For Ppt Templates And Slides F. Download without worries with our money back guaranteee.
Money Chart Ppt Icon For Ppt Templates And Slides C
Microsoft PowerPoint Template and Background with financial diagram consisting of golden Our Money Chart Ppt Icon For Ppt Templates And Slides C make a delicious offering. The audience will be drooling for more.
Money Chart Ppt Icon For Ppt Templates And Slides R
Microsoft PowerPoint Template and Background with financial diagram consisting of golden Gain approval with our Money Chart Ppt Icon For Ppt Templates And Slides R. Just download, type and present.
Money Chart Ppt Icon For Ppt Templates And Slides S
Microsoft PowerPoint Template and Background with financial diagram consisting of golden Make sensational presentations with our Money Chart Ppt Icon For Ppt Templates And Slides S. You'll always stay ahead of the game.
Colorful Bar Chart Business PowerPoint Templates And PowerPoint Backgrounds 0811
Microsoft PowerPoint Template and Background with of a three-dimensional multi-colored bar graph on a white background Address baseless allegations with our Colorful Bar Chart Business PowerPoint Templates And PowerPoint Backgrounds 0811. Give appropriate answers to clear all doubts.
Colorful Bar Chart Business PowerPoint Themes And PowerPoint Slides 0811
Microsoft PowerPoint Theme and Slide with of a three-dimensional multi-colored bar graph on a white Slide Don't leave your career to chance. Let our Colorful Bar Chart Business PowerPoint Themes And PowerPoint Slides 0811 help you take charge.
Financial Arrows Chart Business PowerPoint Backgrounds And Templates 1210
Microsoft PowerPoint Template and Background with fine image 3d of financial business graph Decrease wastage with our Financial Arrows Chart Business PowerPoint Backgrounds And Templates 1210. Download without worries with our money back guaranteee.
Blue Arrow Chart Symbol PowerPoint Themes And PowerPoint Slides 0511
Microsoft PowerPoint Slide and Theme with blue up arrows Mentor teams with our Blue Arrow Chart Symbol PowerPoint Themes And PowerPoint Slides 0511. Download without worries with our money back guaranteee.
Arrows Chart Business PowerPoint Themes And PowerPoint Slides 0211
Microsoft PowerPoint Theme and Slide with four colored arrows in a circle like a diagram Go aerial with our Arrows Chart Business PowerPoint Themes And PowerPoint Slides 0211. Give them a bird's eye view of the conditions.
Mountain Chart With Social Media Icons Powerpoint Slides
The above PPT template displays mountain chart with social media icons. This PowerPoint template has been designed to exhibit users of social media. Download this PPT slide to attract the attention of your audience.
Arrows Chart Business PowerPoint Templates And PowerPoint Backgrounds 0211
Microsoft PowerPoint Template and Background with four colored arrows in a circle like a diagram Arouse the excitement with our Arrows Chart Business PowerPoint Templates And PowerPoint Backgrounds 0211. Stir up the audience with your views.
Puzzles Chart Business PowerPoint Background And Template 1210
Microsoft PowerPoint Template and Background with Stair formed from pieces of the puzzle - 3d render Arm yourself with our Puzzles Chart Business PowerPoint Background And Template 1210. Carry your thoughts safely across.
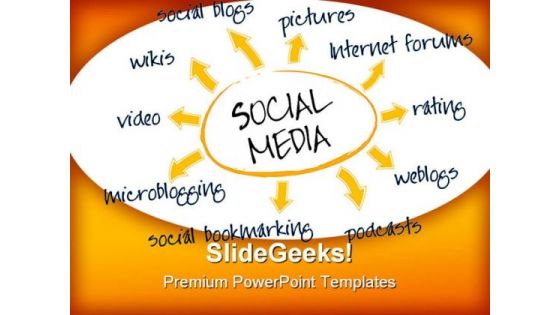
Social Media Chart Internet PowerPoint Templates And PowerPoint Backgrounds 0211
Microsoft PowerPoint Template and Background with social media mind map with networking concept Tickle their brains with our Social Media Chart Internet PowerPoint Templates And PowerPoint Backgrounds 0211. They will find you an entertaining speaker.
Blue Arrow Chart Symbol PowerPoint Templates And PowerPoint Backgrounds 0511
Microsoft PowerPoint Template and Background with blue up arrows Get the right fabric for your thoughts. Our Blue Arrow Chart Symbol PowerPoint Templates And PowerPoint Backgrounds 0511 will provide a fitting color.
Pie Chart Business PowerPoint Templates And PowerPoint Backgrounds 0611
Microsoft PowerPoint Template and Background with business accessories Our Pie Chart Business PowerPoint Templates And PowerPoint Backgrounds 0611 will blow your ideas. They will fan out across the audience.
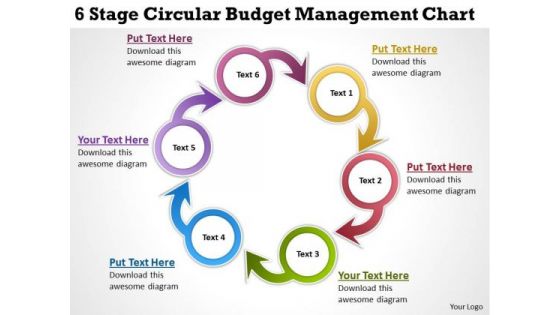
Business Diagram Templates 6 Stage Circular Budget Management Chart PowerPoint
We present our business diagram templates 6 stage circular budget management chart PowerPoint.Use our Circle Charts PowerPoint Templates because Our PowerPoint Templates and Slides will Activate the energies of your audience. Get their creative juices flowing with your words. Download and present our Business PowerPoint Templates because Our PowerPoint Templates and Slides will Activate the energies of your audience. Get their creative juices flowing with your words. Present our Shapes PowerPoint Templates because you should Whip up a frenzy with our PowerPoint Templates and Slides. They will fuel the excitement of your team. Use our Process and Flows PowerPoint Templates because You are an avid believer in ethical practices. Highlight the benefits that accrue with our PowerPoint Templates and Slides. Use our Arrows PowerPoint Templates because Our PowerPoint Templates and Slides will definately Enhance the stature of your presentation. Adorn the beauty of your thoughts with their colourful backgrounds.Use these PowerPoint slides for presentations relating to Arrow, Blue, Business, Chart, Circle, Complex, Concept, Data, Diagram, Financial, Graph, Graphic, Green, Icon, Illustration, Isolated, Model, Pink, Process, Purple, Red, Round, Set, Shape, Vector, Wheel, White, Yellow. The prominent colors used in the PowerPoint template are Yellow, Red, Blue. Engage our Business Diagram Templates 6 Stage Circular Budget Management Chart PowerPoint and experience the difference. Get accustomed to consistent brilliance.
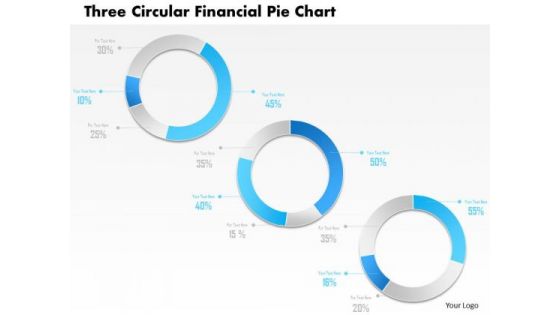
Business Diagram Three Circular Financial Pie Chart PowerPoint Template
This power point template has been designed with graphic of three circular pie chart. This pie chart is suitable for financial data representation. Use this PPt for your business and finance related presentations.


 Continue with Email

 Home
Home


