Finance Icons
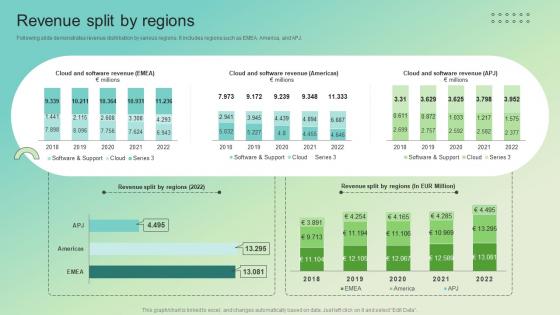
Revenue Split By Regions Enterprise Software Solution Providing Company Profile CP SS V
Following slide demonstrates revenue distribution by various regions. It includes regions such as EMEA, America, and APJ.Slidegeeks is here to make your presentations a breeze with Revenue Split By Regions Enterprise Software Solution Providing Company Profile CP SS V With our easy-to-use and customizable templates, you can focus on delivering your ideas rather than worrying about formatting. With a variety of designs to choose from, you are sure to find one that suits your needs. And with animations and unique photos, illustrations, and fonts, you can make your presentation pop. So whether you are giving a sales pitch or presenting to the board, make sure to check out Slidegeeks first Following slide demonstrates revenue distribution by various regions. It includes regions such as EMEA, America, and APJ.
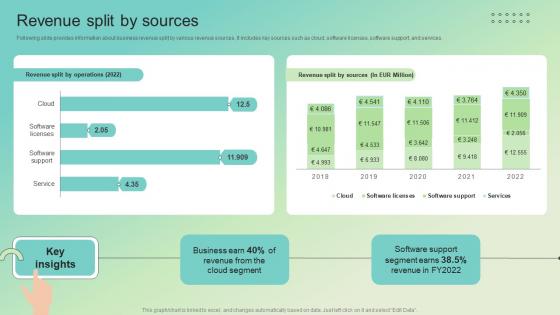
Revenue Split By Sources Enterprise Software Solution Providing Company Profile CP SS V
Following slide provides information about business revenue split by various revenue sources, It includes key sources such as cloud, software licenses, software support, and services.Do you have an important presentation coming up Are you looking for something that will make your presentation stand out from the rest Look no further than Revenue Split By Sources Enterprise Software Solution Providing Company Profile CP SS V. With our professional designs, you can trust that your presentation will pop and make delivering it a smooth process. And with Slidegeeks, you can trust that your presentation will be unique and memorable. So why wait Grab Revenue Split By Sources Enterprise Software Solution Providing Company Profile CP SS V today and make your presentation stand out from the rest Following slide provides information about business revenue split by various revenue sources, It includes key sources such as cloud, software licenses, software support, and services.
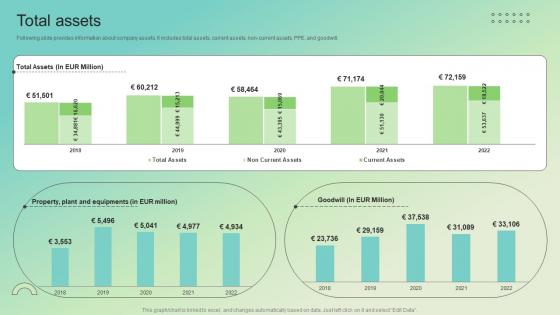
Total Assets Enterprise Software Solution Providing Company Profile CP SS V
Following slide provides information about company assets. It includes total assets, current assets, non-current assets, PPE, and goodwill.Formulating a presentation can take up a lot of effort and time, so the content and message should always be the primary focus. The visuals of the PowerPoint can enhance the presenters message, so our Total Assets Enterprise Software Solution Providing Company Profile CP SS V was created to help save time. Instead of worrying about the design, the presenter can concentrate on the message while our designers work on creating the ideal templates for whatever situation is needed. Slidegeeks has experts for everything from amazing designs to valuable content, we have put everything into Total Assets Enterprise Software Solution Providing Company Profile CP SS V. Following slide provides information about company assets. It includes total assets, current assets, non-current assets, PPE, and goodwill.
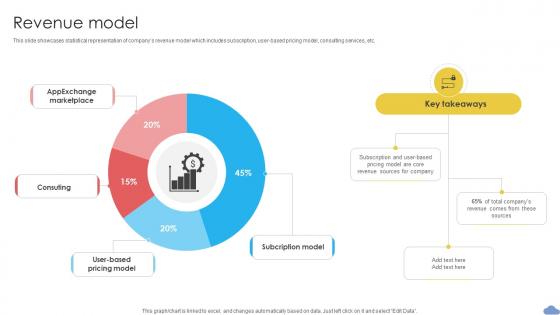
Revenue Model Cloud Based CRM Business Model BMC SS V
This slide showcases statistical representation of companys revenue model which includes subscription, user-based pricing model, consulting services, etc. Find highly impressive Revenue Model Cloud Based CRM Business Model BMC SS V on Slidegeeks to deliver a meaningful presentation. You can save an ample amount of time using these presentation templates. No need to worry to prepare everything from scratch because Slidegeeks experts have already done a huge research and work for you. You need to download Revenue Model Cloud Based CRM Business Model BMC SS V for your upcoming presentation. All the presentation templates are 100 percent editable and you can change the color and personalize the content accordingly. Download now This slide showcases statistical representation of companys revenue model which includes subscription, user-based pricing model, consulting services, etc.
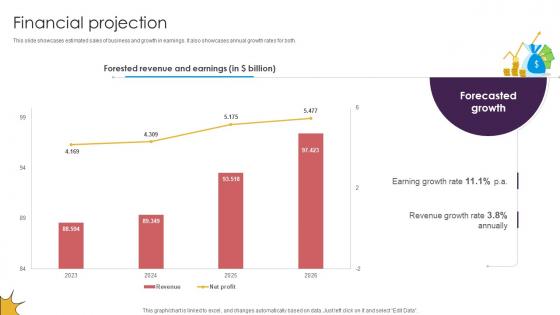
Financial Projection Delivery Service Provider Business Model BMC SS V
This slide showcases estimated sales of business and growth in earnings. It also showcases annual growth rates for both. There are so many reasons you need a Financial Projection Delivery Service Provider Business Model BMC SS V. The first reason is you can not spend time making everything from scratch, Thus, Slidegeeks has made presentation templates for you too. You can easily download these templates from our website easily. This slide showcases estimated sales of business and growth in earnings. It also showcases annual growth rates for both.
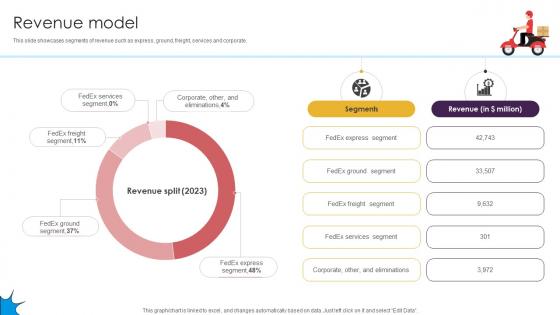
Revenue Model Delivery Service Provider Business Model BMC SS V
This slide showcases segments of revenue such as express, ground, freight, services and corporate. Find highly impressive Revenue Model Delivery Service Provider Business Model BMC SS V on Slidegeeks to deliver a meaningful presentation. You can save an ample amount of time using these presentation templates. No need to worry to prepare everything from scratch because Slidegeeks experts have already done a huge research and work for you. You need to download Revenue Model Delivery Service Provider Business Model BMC SS V for your upcoming presentation. All the presentation templates are 100 percent editable and you can change the color and personalize the content accordingly. Download now This slide showcases segments of revenue such as express, ground, freight, services and corporate.
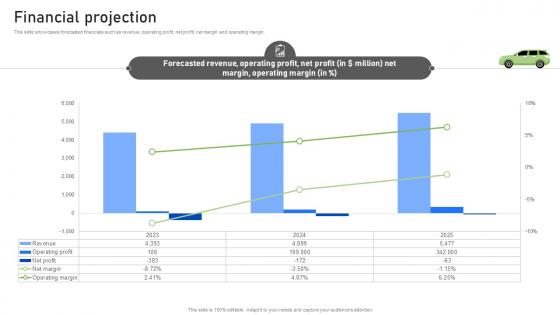
Financial Projection Rideshare Platform Business Model BMC SS V
This slide showcases forecasted financials such as revenue, operating profit, net profit, net margin and operating margin. There are so many reasons you need a Financial Projection Rideshare Platform Business Model BMC SS V. The first reason is you can not spend time making everything from scratch, Thus, Slidegeeks has made presentation templates for you too. You can easily download these templates from our website easily. This slide showcases forecasted financials such as revenue, operating profit, net profit, net margin and operating margin.
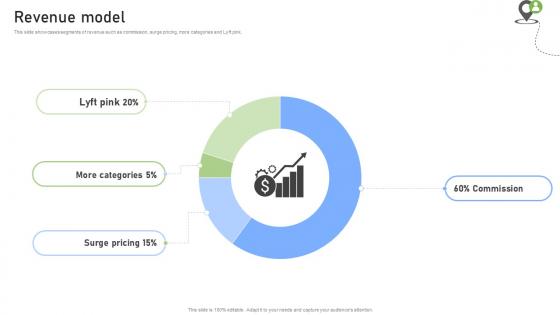
Revenue Model Rideshare Platform Business Model BMC SS V
This slide showcases segments of revenue such as commission, surge pricing, more categories and Lyft pink. If your project calls for a presentation, then Slidegeeks is your go-to partner because we have professionally designed, easy-to-edit templates that are perfect for any presentation. After downloading, you can easily edit Revenue Model Rideshare Platform Business Model BMC SS V and make the changes accordingly. You can rearrange slides or fill them with different images. Check out all the handy templates This slide showcases segments of revenue such as commission, surge pricing, more categories and Lyft pink.
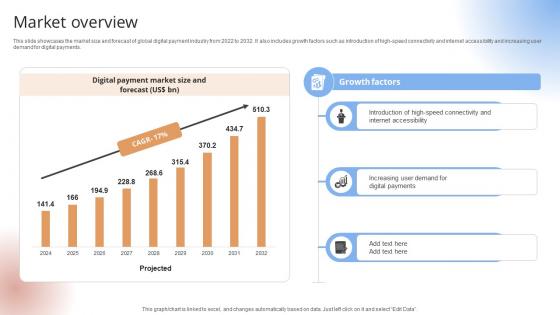
Market Overview Payment Gateway Provider Startup GTM Strategy GTM SS V
This slide showcases the market size and forecast of global digital payment industry from 2022 to 2032. It also includes growth factors such as introduction of high-speed connectivity and internet accessibility and increasing user demand for digital payments.This slide showcases the market size and forecast of global digital payment industry from 2022 to 2032. It also includes growth factors such as introduction of high-speed connectivity and internet accessibility and increasing user demand for digital payments.Crafting an eye-catching presentation has never been more straightforward. Let your presentation shine with this tasteful yet straightforward Market Overview Payment Gateway Provider Startup GTM Strategy GTM SS V template. It offers a minimalistic and classy look that is great for making a statement. The colors have been employed intelligently to add a bit of playfulness while still remaining professional. Construct the ideal Market Overview Payment Gateway Provider Startup GTM Strategy GTM SS V that effortlessly grabs the attention of your audience Begin now and be certain to wow your customers This slide showcases the market size and forecast of global digital payment industry from 2022 to 2032. It also includes growth factors such as introduction of high-speed connectivity and internet accessibility and increasing user demand for digital payments.
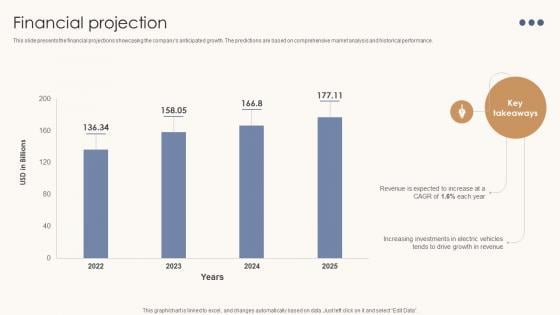
Financial Projection Automotive Assembly Business Model BMC SS V
This slide presents the financial projections showcasing the companys anticipated growth. The predictions are based on comprehensive market analysis and historical performance. There are so many reasons you need a Financial Projection Automotive Assembly Business Model BMC SS V. The first reason is you can not spend time making everything from scratch, Thus, Slidegeeks has made presentation templates for you too. You can easily download these templates from our website easily. This slide presents the financial projections showcasing the companys anticipated growth. The predictions are based on comprehensive market analysis and historical performance.
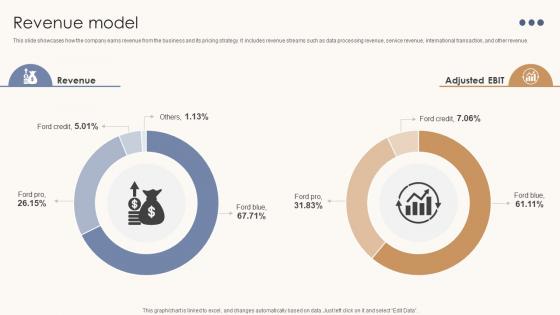
Revenue Model Automotive Assembly Business Model BMC SS V
This slide showcases how the company earns revenue from the business and its pricing strategy. It includes revenue streams such as data processing revenue, service revenue, international transaction, and other revenue. Find highly impressive Revenue Model Automotive Assembly Business Model BMC SS V on Slidegeeks to deliver a meaningful presentation. You can save an ample amount of time using these presentation templates. No need to worry to prepare everything from scratch because Slidegeeks experts have already done a huge research and work for you. You need to download Revenue Model Automotive Assembly Business Model BMC SS V for your upcoming presentation. All the presentation templates are 100 percent editable and you can change the color and personalize the content accordingly. Download now This slide showcases how the company earns revenue from the business and its pricing strategy. It includes revenue streams such as data processing revenue, service revenue, international transaction, and other revenue.

Spa Resort Business Plan Global Hotels Resorts And Cruise Lines Market By Geography BP SS V
This slide showcases the global hotels, resort and cruise lines industry by geography which includes North America, Europe, Asia-Pacific, Middle East and Africa and Central and South America. Find highly impressive Spa Resort Business Plan Global Hotels Resorts And Cruise Lines Market By Geography BP SS V on Slidegeeks to deliver a meaningful presentation. You can save an ample amount of time using these presentation templates. No need to worry to prepare everything from scratch because Slidegeeks experts have already done a huge research and work for you. You need to download Spa Resort Business Plan Global Hotels Resorts And Cruise Lines Market By Geography BP SS V for your upcoming presentation. All the presentation templates are 100 percent editable and you can change the color and personalize the content accordingly. Download now This slide showcases the global hotels, resort and cruise lines industry by geography which includes North America, Europe, Asia-Pacific, Middle East and Africa and Central and South America.

Spa Resort Business Plan Global Market Analysis Of Hotels Resorts And Cruise Lines Industry BP SS V
This slide showcases the global market analysis of the resort industry, including projected market size from 2022 to 2030. Primary reasons behind market growth includes consumers growing preference for leisure and luxury travel, etc. If your project calls for a presentation, then Slidegeeks is your go-to partner because we have professionally designed, easy-to-edit templates that are perfect for any presentation. After downloading, you can easily edit Spa Resort Business Plan Global Market Analysis Of Hotels Resorts And Cruise Lines Industry BP SS V and make the changes accordingly. You can rearrange slides or fill them with different images. Check out all the handy templates This slide showcases the global market analysis of the resort industry, including projected market size from 2022 to 2030. Primary reasons behind market growth includes consumers growing preference for leisure and luxury travel, etc.
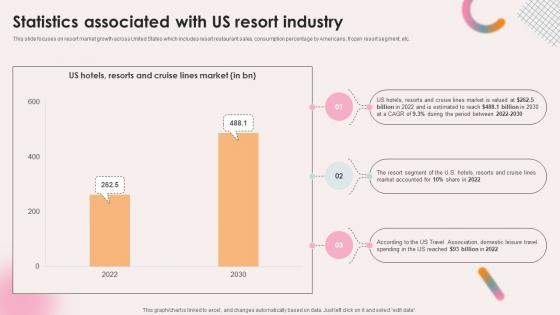
Spa Resort Business Plan Statistics Associated With Us Resort Industry BP SS V
This slide focuses on resort market growth across United States which includes resort restaurant sales, consumption percentage by Americans, frozen resort segment, etc. Create an editable Spa Resort Business Plan Statistics Associated With Us Resort Industry BP SS V that communicates your idea and engages your audience. Whether you are presenting a business or an educational presentation, pre-designed presentation templates help save time. Spa Resort Business Plan Statistics Associated With Us Resort Industry BP SS V is highly customizable and very easy to edit, covering many different styles from creative to business presentations. Slidegeeks has creative team members who have crafted amazing templates. So, go and get them without any delay. This slide focuses on resort market growth across United States which includes resort restaurant sales, consumption percentage by Americans, frozen resort segment, etc.
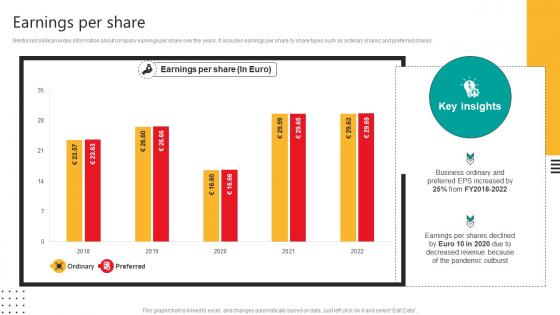
Earnings Per Share Automobile Development Company Profile CP SS V
Mentioned slide provides information about company earnings per share over the years. It includes earnings per share by share types such as ordinary shares and preferred shares.Slidegeeks is here to make your presentations a breeze with Earnings Per Share Automobile Development Company Profile CP SS V With our easy-to-use and customizable templates, you can focus on delivering your ideas rather than worrying about formatting. With a variety of designs to choose from, you are sure to find one that suits your needs. And with animations and unique photos, illustrations, and fonts, you can make your presentation pop. So whether you are giving a sales pitch or presenting to the board, make sure to check out Slidegeeks first Mentioned slide provides information about company earnings per share over the years. It includes earnings per share by share types such as ordinary shares and preferred shares.
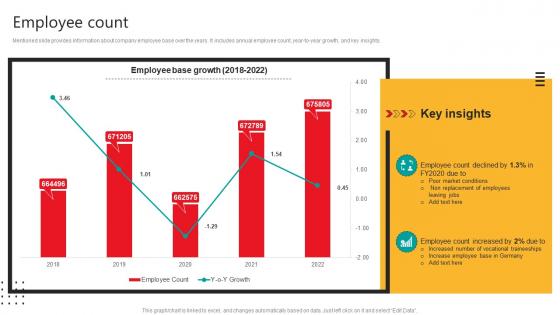
Employee Count Automobile Development Company Profile CP SS V
Mentioned slide provides information about company employee base over the years. It includes annual employee count, year-to-year growth, and key insights.Do you have an important presentation coming up Are you looking for something that will make your presentation stand out from the rest Look no further than Employee Count Automobile Development Company Profile CP SS V. With our professional designs, you can trust that your presentation will pop and make delivering it a smooth process. And with Slidegeeks, you can trust that your presentation will be unique and memorable. So why wait Grab Employee Count Automobile Development Company Profile CP SS V today and make your presentation stand out from the rest Mentioned slide provides information about company employee base over the years. It includes annual employee count, year-to-year growth, and key insights.
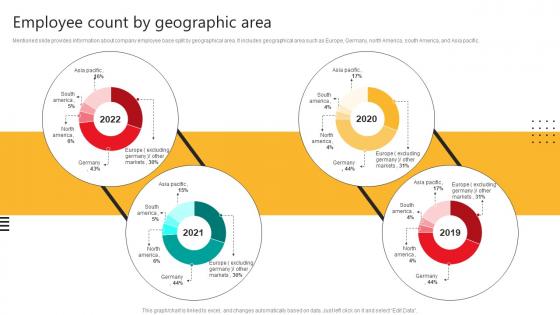
Employee Count By Geographic Area Automobile Development Company Profile CP SS V
Mentioned slide provides information about company employee base split by geographical area. It includes geographical area such as Europe, Germany, north America, south America, and Asia pacific.Find highly impressive Employee Count By Geographic Area Automobile Development Company Profile CP SS V on Slidegeeks to deliver a meaningful presentation. You can save an ample amount of time using these presentation templates. No need to worry to prepare everything from scratch because Slidegeeks experts have already done a huge research and work for you. You need to download Employee Count By Geographic Area Automobile Development Company Profile CP SS V for your upcoming presentation. All the presentation templates are 100 percent editable and you can change the color and personalize the content accordingly. Download now Mentioned slide provides information about company employee base split by geographical area. It includes geographical area such as Europe, Germany, north America, south America, and Asia pacific.
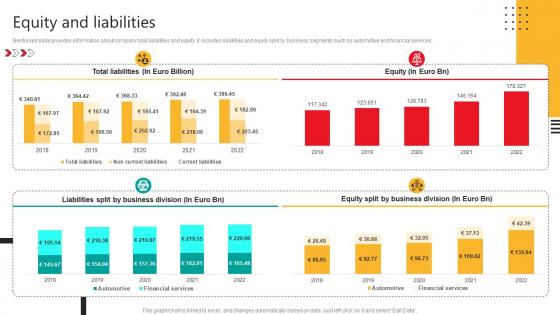
Equity And Liabilities Automobile Development Company Profile CP SS V
Mentioned slide provides information about company total liabilities and equity. It includes liabilities and equity split by business segments such as automotive and financial services.If your project calls for a presentation, then Slidegeeks is your go-to partner because we have professionally designed, easy-to-edit templates that are perfect for any presentation. After downloading, you can easily edit Equity And Liabilities Automobile Development Company Profile CP SS V and make the changes accordingly. You can rearrange slides or fill them with different images. Check out all the handy templates Mentioned slide provides information about company total liabilities and equity. It includes liabilities and equity split by business segments such as automotive and financial services.
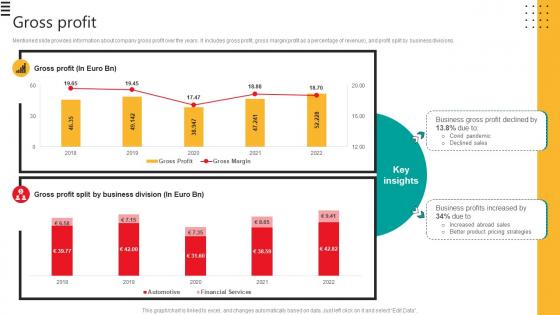
Gross Profit Automobile Development Company Profile CP SS V
Mentioned slide provides information about company gross profit over the years. It includes gross profit, gross marginprofit as a percentage of revenue, and profit split by business divisions.Formulating a presentation can take up a lot of effort and time, so the content and message should always be the primary focus. The visuals of the PowerPoint can enhance the presenters message, so our Gross Profit Automobile Development Company Profile CP SS V was created to help save time. Instead of worrying about the design, the presenter can concentrate on the message while our designers work on creating the ideal templates for whatever situation is needed. Slidegeeks has experts for everything from amazing designs to valuable content, we have put everything into Gross Profit Automobile Development Company Profile CP SS V. Mentioned slide provides information about company gross profit over the years. It includes gross profit, gross marginprofit as a percentage of revenue, and profit split by business divisions.
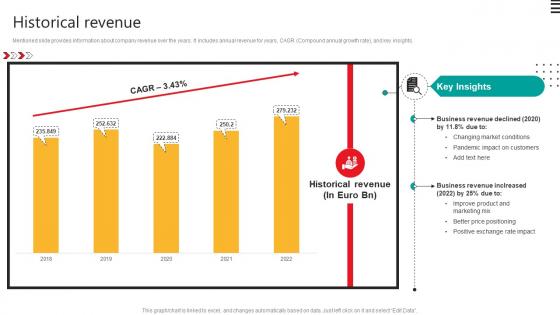
Historical Revenue Automobile Development Company Profile CP SS V
Mentioned slide provides information about company revenue over the years. It includes annual revenue for years, CAGR Compound annual growth rate, and key insights.Coming up with a presentation necessitates that the majority of the effort goes into the content and the message you intend to convey. The visuals of a PowerPoint presentation can only be effective if it supplements and supports the story that is being told. Keeping this in mind our experts created Historical Revenue Automobile Development Company Profile CP SS V to reduce the time that goes into designing the presentation. This way, you can concentrate on the message while our designers take care of providing you with the right template for the situation. Mentioned slide provides information about company revenue over the years. It includes annual revenue for years, CAGR Compound annual growth rate, and key insights.
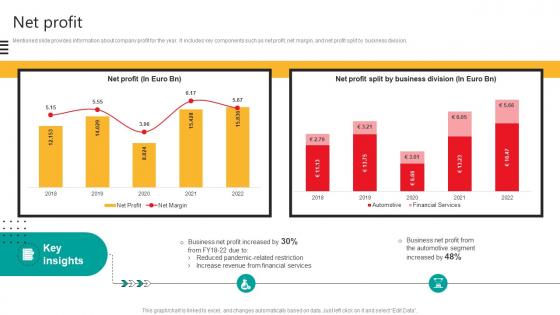
Net Profit Automobile Development Company Profile CP SS V
Mentioned slide provides information about company profit for the year. It includes key components such as net profit, net margin, and net profit split by business division.The Net Profit Automobile Development Company Profile CP SS V is a compilation of the most recent design trends as a series of slides. It is suitable for any subject or industry presentation, containing attractive visuals and photo spots for businesses to clearly express their messages. This template contains a variety of slides for the user to input data, such as structures to contrast two elements, bullet points, and slides for written information. Slidegeeks is prepared to create an impression. Mentioned slide provides information about company profit for the year. It includes key components such as net profit, net margin, and net profit split by business division.
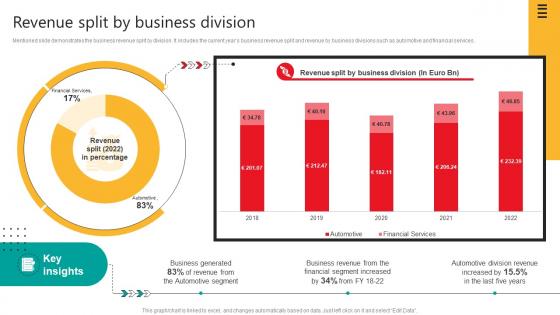
Revenue Split By Business Division Automobile Development Company Profile CP SS V
Mentioned slide demonstrates the business revenue split by division. It includes the current years business revenue split and revenue by business divisions such as automotive and financial services.Take your projects to the next level with our ultimate collection of Revenue Split By Business Division Automobile Development Company Profile CP SS V. Slidegeeks has designed a range of layouts that are perfect for representing task or activity duration, keeping track of all your deadlines at a glance. Tailor these designs to your exact needs and give them a truly corporate look with your own brand colors they will make your projects stand out from the rest Mentioned slide demonstrates the business revenue split by division. It includes the current years business revenue split and revenue by business divisions such as automotive and financial services.
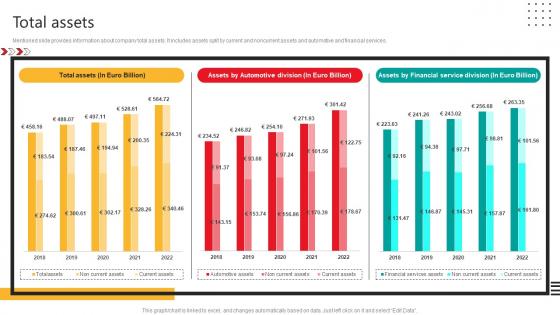
Total Assets Automobile Development Company Profile CP SS V
Mentioned slide provides information about company total assets. It includes assets split by current and noncurrent assets and automotive and financial services.Present like a pro with Total Assets Automobile Development Company Profile CP SS V. Create beautiful presentations together with your team, using our easy-to-use presentation slides. Share your ideas in real-time and make changes on the fly by downloading our templates. So whether you are in the office, on the go, or in a remote location, you can stay in sync with your team and present your ideas with confidence. With Slidegeeks presentation got a whole lot easier. Grab these presentations today. Mentioned slide provides information about company total assets. It includes assets split by current and noncurrent assets and automotive and financial services.
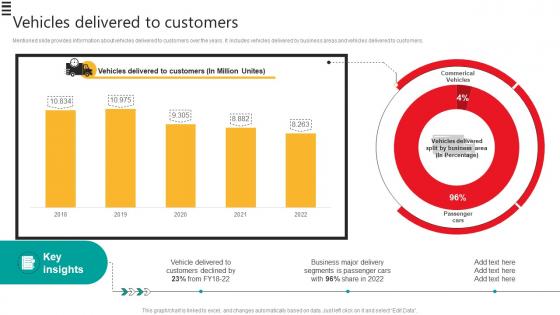
Vehicles Delivered To Customers Automobile Development Company Profile CP SS V
Mentioned slide provides information about vehicles delivered to customers over the years. It includes vehicles delivered by business areas and vehicles delivered to customers. Slidegeeks is here to make your presentations a breeze with Vehicles Delivered To Customers Automobile Development Company Profile CP SS V With our easy-to-use and customizable templates, you can focus on delivering your ideas rather than worrying about formatting. With a variety of designs to choose from, you are sure to find one that suits your needs. And with animations and unique photos, illustrations, and fonts, you can make your presentation pop. So whether you are giving a sales pitch or presenting to the board, make sure to check out Slidegeeks first Mentioned slide provides information about vehicles delivered to customers over the years. It includes vehicles delivered by business areas and vehicles delivered to customers.
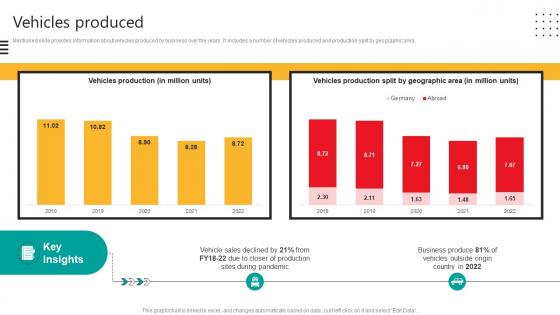
Vehicles Produced Automobile Development Company Profile CP SS V
Mentioned slide provides information about vehicles produced by business over the years. It includes a number of vehicles produced and production split by geographic area.Do you have an important presentation coming up Are you looking for something that will make your presentation stand out from the rest Look no further than Vehicles Produced Automobile Development Company Profile CP SS V. With our professional designs, you can trust that your presentation will pop and make delivering it a smooth process. And with Slidegeeks, you can trust that your presentation will be unique and memorable. So why wait Grab Vehicles Produced Automobile Development Company Profile CP SS V today and make your presentation stand out from the rest Mentioned slide provides information about vehicles produced by business over the years. It includes a number of vehicles produced and production split by geographic area.
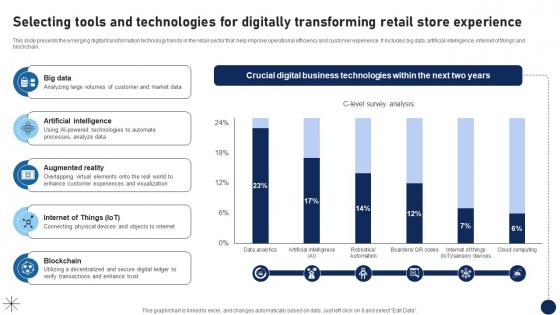
R77 Selecting Tools And Technologies For Digitally Transforming Retail Store Experience DT SS V
This slide presents the emerging digital transformation technology trends in the retail sector that help improve operational efficiency and customer experience. It includes big data, artificial intelligence, internet of things and blockchain.The R77 Selecting Tools And Technologies For Digitally Transforming Retail Store Experience DT SS V is a compilation of the most recent design trends as a series of slides. It is suitable for any subject or industry presentation, containing attractive visuals and photo spots for businesses to clearly express their messages. This template contains a variety of slides for the user to input data, such as structures to contrast two elements, bullet points, and slides for written information. Slidegeeks is prepared to create an impression. This slide presents the emerging digital transformation technology trends in the retail sector that help improve operational efficiency and customer experience. It includes big data, artificial intelligence, internet of things and blockchain.
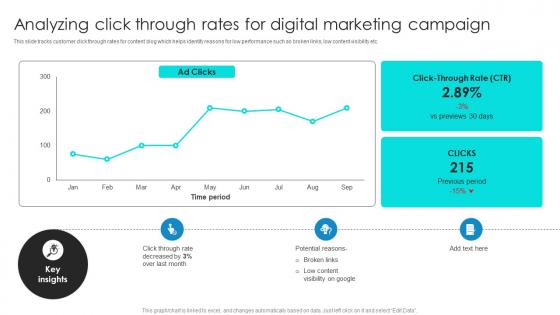
Project Benchmarking Process Analyzing Click Through Rates For Digital Marketing CRP DK SS V
This slide tracks customer click through rates for content blog which helps identify reasons for low performance such as broken links, low content visibility etc. Want to ace your presentation in front of a live audience Our Project Benchmarking Process Analyzing Click Through Rates For Digital Marketing CRP DK SS V can help you do that by engaging all the users towards you. Slidegeeks experts have put their efforts and expertise into creating these impeccable powerpoint presentations so that you can communicate your ideas clearly. Moreover, all the templates are customizable, and easy-to-edit and downloadable. Use these for both personal and commercial use. This slide tracks customer click through rates for content blog which helps identify reasons for low performance such as broken links, low content visibility etc.
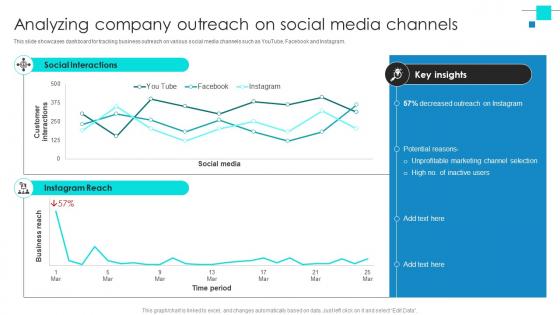
Project Benchmarking Process Analyzing Company Outreach On Social Media CRP DK SS V
This slide showcases dashboard for tracking business outreach on various social media channels such as YouTube, Facebook and Instagram. There are so many reasons you need a Project Benchmarking Process Analyzing Company Outreach On Social Media CRP DK SS V. The first reason is you can not spend time making everything from scratch, Thus, Slidegeeks has made presentation templates for you too. You can easily download these templates from our website easily. This slide showcases dashboard for tracking business outreach on various social media channels such as YouTube, Facebook and Instagram.

Project Benchmarking Process Analyzing Customer Bounce Rate For Company CRP DK SS V
This slide showcases website bounce rate monitoring which helps in identifying reasons for poor customer engagement such as usability issues etc. Do you have to make sure that everyone on your team knows about any specific topic I yes, then you should give Project Benchmarking Process Analyzing Customer Bounce Rate For Company CRP DK SS V a try. Our experts have put a lot of knowledge and effort into creating this impeccable Project Benchmarking Process Analyzing Customer Bounce Rate For Company CRP DK SS V. You can use this template for your upcoming presentations, as the slides are perfect to represent even the tiniest detail. You can download these templates from the Slidegeeks website and these are easy to edit. So grab these today This slide showcases website bounce rate monitoring which helps in identifying reasons for poor customer engagement such as usability issues etc.
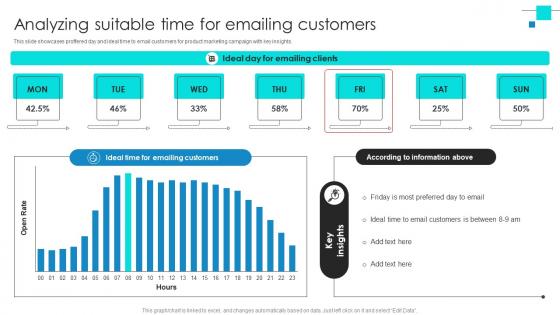
Project Benchmarking Process Analyzing Suitable Time For Emailing Customers CRP DK SS V
This slide showcases proffered day and ideal time to email customers for product marketing campaign with key insights. Get a simple yet stunning designed Project Benchmarking Process Analyzing Suitable Time For Emailing Customers CRP DK SS V. It is the best one to establish the tone in your meetings. It is an excellent way to make your presentations highly effective. So, download this PPT today from Slidegeeks and see the positive impacts. Our easy-to-edit Project Benchmarking Process Analyzing Suitable Time For Emailing Customers CRP DK SS V can be your go-to option for all upcoming conferences and meetings. So, what are you waiting for Grab this template today. This slide showcases proffered day and ideal time to email customers for product marketing campaign with key insights.
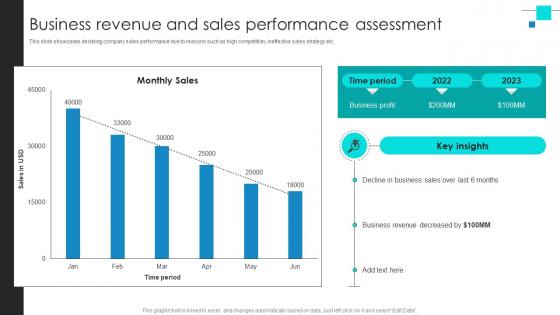
Project Benchmarking Process Business Revenue And Sales Performance Assessment CRP DK SS V
This slide showcases declining company sales performance due to reasons such as high competition, ineffective sales strategy etc. Present like a pro with Project Benchmarking Process Business Revenue And Sales Performance Assessment CRP DK SS V. Create beautiful presentations together with your team, using our easy-to-use presentation slides. Share your ideas in real-time and make changes on the fly by downloading our templates. So whether you are in the office, on the go, or in a remote location, you can stay in sync with your team and present your ideas with confidence. With Slidegeeks presentation got a whole lot easier. Grab these presentations today. This slide showcases declining company sales performance due to reasons such as high competition, ineffective sales strategy etc.
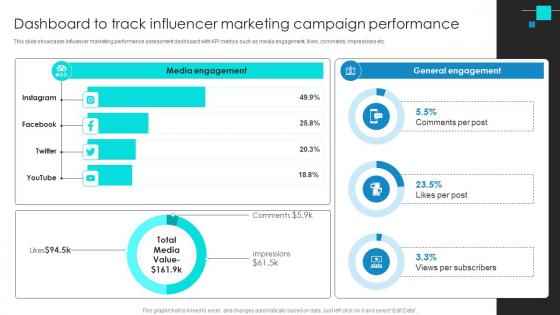
Project Benchmarking Process Dashboard To Track Influencer Marketing Campaign CRP DK SS V
This slide showcases influencer marketing performance assessment dashboard with KPI metrics such as media engagement, likes, comments, impressions etc. If your project calls for a presentation, then Slidegeeks is your go-to partner because we have professionally designed, easy-to-edit templates that are perfect for any presentation. After downloading, you can easily edit Project Benchmarking Process Dashboard To Track Influencer Marketing Campaign CRP DK SS V and make the changes accordingly. You can rearrange slides or fill them with different images. Check out all the handy templates This slide showcases influencer marketing performance assessment dashboard with KPI metrics such as media engagement, likes, comments, impressions etc.
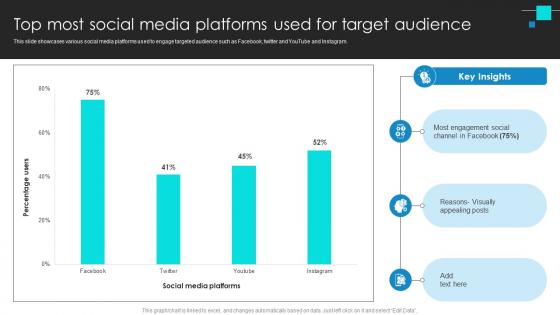
Project Benchmarking Process Top Most Social Media Platforms Used For Target Audience CRP DK SS V
This slide showcases various social media platforms used to engage targeted audience such as Facebook, twitter and YouTube and Instagram. Present like a pro with Project Benchmarking Process Top Most Social Media Platforms Used For Target Audience CRP DK SS V. Create beautiful presentations together with your team, using our easy-to-use presentation slides. Share your ideas in real-time and make changes on the fly by downloading our templates. So whether you are in the office, on the go, or in a remote location, you can stay in sync with your team and present your ideas with confidence. With Slidegeeks presentation got a whole lot easier. Grab these presentations today. This slide showcases various social media platforms used to engage targeted audience such as Facebook, twitter and YouTube and Instagram.
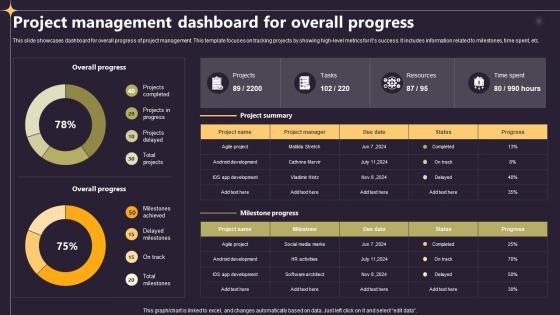
Closing A Project By Fulfilling Project Management Dashboard For Overall Progress PM SS V
This slide showcases dashboard for overall progress of project management. This template focuses on tracking projects by showing high-level metrics for its success. It includes information related to milestones, time spent, etc. This modern and well-arranged Closing A Project By Fulfilling Overview Of Planning Project In An Organisation PM SS V provides lots of creative possibilities. It is very simple to customize and edit with the Powerpoint Software. Just drag and drop your pictures into the shapes. All facets of this template can be edited with Powerpoint, no extra software is necessary. Add your own material, put your images in the places assigned for them, adjust the colors, and then you can show your slides to the world, with an animated slide included. This slide showcases dashboard for overall progress of project management. This template focuses on tracking projects by showing high-level metrics for its success. It includes information related to milestones, time spent, etc.
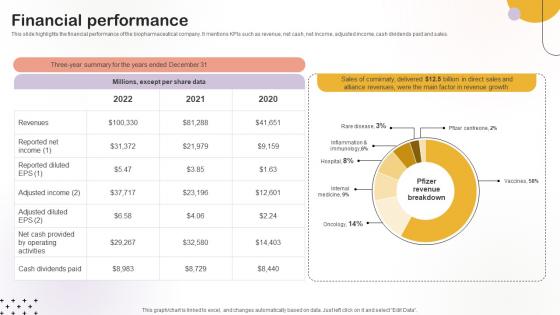
Financial Performance Medical Research Organization Pitch Deck
This slide highlights the financial performance of the biopharmaceutical company. It mentions KPIs such as revenue, net cash, net income, adjusted income, cash dividends paid and sales.From laying roadmaps to briefing everything in detail, our templates are perfect for you. You can set the stage with your presentation slides. All you have to do is download these easy-to-edit and customizable templates. Financial Performance Medical Research Organization Pitch Deck will help you deliver an outstanding performance that everyone would remember and praise you for. Do download this presentation today. This slide highlights the financial performance of the biopharmaceutical company. It mentions KPIs such as revenue, net cash, net income, adjusted income, cash dividends paid and sales.
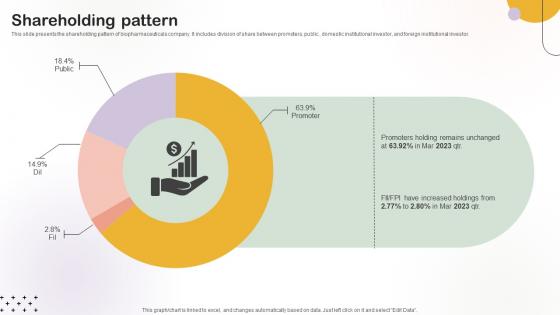
Shareholding Pattern Medical Research Organization Pitch Deck
This slide presents the shareholding pattern of biopharmaceuticals company. It includes division of share between promoters, public , domestic institutional investor, and foreign institutional investor.This modern and well-arranged Shareholding Pattern Medical Research Organization Pitch Deck provides lots of creative possibilities. It is very simple to customize and edit with the Powerpoint Software. Just drag and drop your pictures into the shapes. All facets of this template can be edited with Powerpoint, no extra software is necessary. Add your own material, put your images in the places assigned for them, adjust the colors, and then you can show your slides to the world, with an animated slide included. This slide presents the shareholding pattern of biopharmaceuticals company. It includes division of share between promoters, public , domestic institutional investor, and foreign institutional investor.
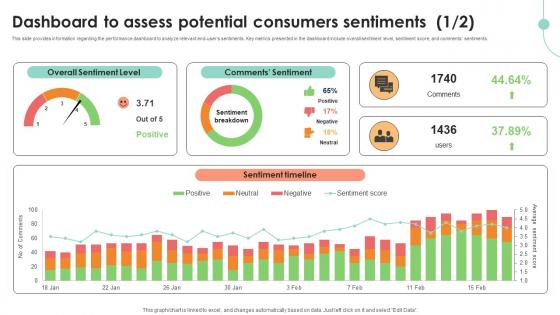
Dashboard To Assess Potential Consumers Decoding User Emotions In Depth Exploration AI SS V
This slide provides information regarding the performance dashboard to analyze relevant end-users sentiments. Key metrics presented in the dashboard include overall sentiment level, sentiment score, and comments sentiments. Do you have an important presentation coming up Are you looking for something that will make your presentation stand out from the rest Look no further than Dashboard To Assess Potential Consumers Decoding User Emotions In Depth Exploration AI SS V. With our professional designs, you can trust that your presentation will pop and make delivering it a smooth process. And with Slidegeeks, you can trust that your presentation will be unique and memorable. So why wait Grab Dashboard To Assess Potential Consumers Decoding User Emotions In Depth Exploration AI SS V today and make your presentation stand out from the rest This slide provides information regarding the performance dashboard to analyze relevant end-users sentiments. Key metrics presented in the dashboard include overall sentiment level, sentiment score, and comments sentiments.
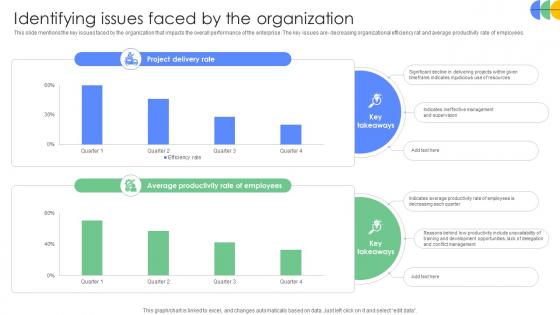
Driving Results Designing A Team Identifying Issues Faced By The Organization
This slide mentions the key issues faced by the organization that impacts the overall performance of the enterprise. The key issues are- decreasing organizational efficiency rat and average productivity rate of employees. Find highly impressive Driving Results Designing A Team Identifying Issues Faced By The Organization on Slidegeeks to deliver a meaningful presentation. You can save an ample amount of time using these presentation templates. No need to worry to prepare everything from scratch because Slidegeeks experts have already done a huge research and work for you. You need to download Driving Results Designing A Team Identifying Issues Faced By The Organization for your upcoming presentation. All the presentation templates are 100 percent editable and you can change the color and personalize the content accordingly. Download now This slide mentions the key issues faced by the organization that impacts the overall performance of the enterprise. The key issues are- decreasing organizational efficiency rat and average productivity rate of employees.
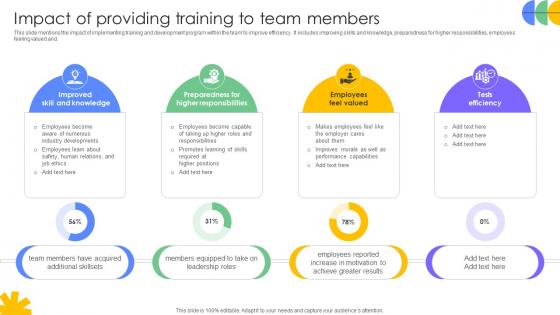
Driving Results Designing A Team Impact Of Providing Training To Team Members
This slide mentions the impact of implementing training and development program within the team to improve efficiency. It includes improving skills and knowledge, preparedness for higher responsibilities, employees feeling valued and. Are you in need of a template that can accommodate all of your creative concepts This one is crafted professionally and can be altered to fit any style. Use it with Google Slides or PowerPoint. Include striking photographs, symbols, depictions, and other visuals. Fill, move around, or remove text boxes as desired. Test out color palettes and font mixtures. Edit and save your work, or work with colleagues. Download Driving Results Designing A Team Impact Of Providing Training To Team Members and observe how to make your presentation outstanding. Give an impeccable presentation to your group and make your presentation unforgettable. This slide mentions the impact of implementing training and development program within the team to improve efficiency. It includes improving skills and knowledge, preparedness for higher responsibilities, employees feeling valued and.
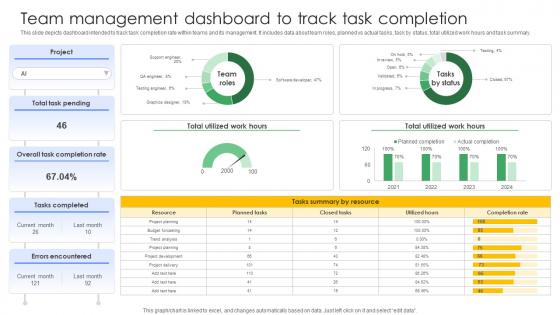
Driving Results Designing A Team Management Dashboard To Track Task Completion
This slide depicts dashboard intended to track task completion rate within teams and its management. It includes data about team roles, planned vs actual tasks, task by status, total utilized work hours and task summary. This modern and well-arranged Driving Results Designing A Team Management Dashboard To Track Task Completion provides lots of creative possibilities. It is very simple to customize and edit with the Powerpoint Software. Just drag and drop your pictures into the shapes. All facets of this template can be edited with Powerpoint, no extra software is necessary. Add your own material, put your images in the places assigned for them, adjust the colors, and then you can show your slides to the world, with an animated slide included. This slide depicts dashboard intended to track task completion rate within teams and its management. It includes data about team roles, planned vs actual tasks, task by status, total utilized work hours and task summary.
Driving Results Designing A Team Members Performance Tracking Dashboards
This slide depicts performance tracking dashboard for project manager to analyze work being done by the team. It includes average rating for the week, total work done and weekly change, employee rating and work done. This Driving Results Designing A Team Members Performance Tracking Dashboards is perfect for any presentation, be it in front of clients or colleagues. It is a versatile and stylish solution for organizing your meetings. The Driving Results Designing A Team Members Performance Tracking Dashboards features a modern design for your presentation meetings. The adjustable and customizable slides provide unlimited possibilities for acing up your presentation. Slidegeeks has done all the homework before launching the product for you. So, do not wait, grab the presentation templates today This slide depicts performance tracking dashboard for project manager to analyze work being done by the team. It includes average rating for the week, total work done and weekly change, employee rating and work done.
Driving Results Designing A Team Training And Development Program Tracking Dashboard
This slide depicts team development program tracking dashboard to analyze the impact of implementing training plan for the members. It includes training satisfaction rate, engagement score, drop-out rate and top 5 trainees. Take your projects to the next level with our ultimate collection of Driving Results Designing A Team Training And Development Program Tracking Dashboard. Slidegeeks has designed a range of layouts that are perfect for representing task or activity duration, keeping track of all your deadlines at a glance. Tailor these designs to your exact needs and give them a truly corporate look with your own brand colors they will make your projects stand out from the rest This slide depicts team development program tracking dashboard to analyze the impact of implementing training plan for the members. It includes training satisfaction rate, engagement score, drop-out rate and top 5 trainees.
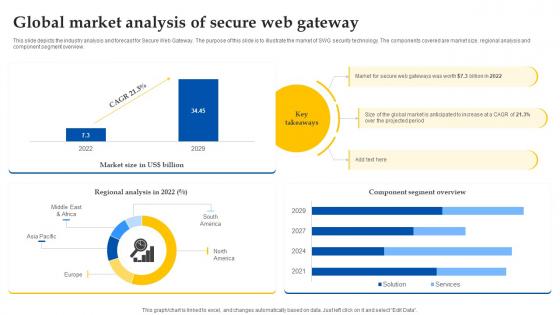
Web Access Control Solution Global Market Analysis Of Secure Web Gateway
This slide depicts the industry analysis and forecast for Secure Web Gateway. The purpose of this slide is to illustrate the market of SWG security technology. The components covered are market size, regional analysis and component segment overview. This Web Access Control Solution Global Market Analysis Of Secure Web Gateway is perfect for any presentation, be it in front of clients or colleagues. It is a versatile and stylish solution for organizing your meetings. The Web Access Control Solution Global Market Analysis Of Secure Web Gateway features a modern design for your presentation meetings. The adjustable and customizable slides provide unlimited possibilities for acing up your presentation. Slidegeeks has done all the homework before launching the product for you. So, do not wait, grab the presentation templates today This slide depicts the industry analysis and forecast for Secure Web Gateway. The purpose of this slide is to illustrate the market of SWG security technology. The components covered are market size, regional analysis and component segment overview.
Web Access Control Solution Secure Web Gateway Performance Tracking Dashboard
This slide represents a dashboard to maintain the record of various functions of Secure Web Gateway. The main components are top blocked web malware, web usage trend, top web application categories, risky web isolations, etc. Get a simple yet stunning designed Web Access Control Solution Secure Web Gateway Performance Tracking Dashboard. It is the best one to establish the tone in your meetings. It is an excellent way to make your presentations highly effective. So, download this PPT today from Slidegeeks and see the positive impacts. Our easy-to-edit Web Access Control Solution Secure Web Gateway Performance Tracking Dashboard can be your go-to option for all upcoming conferences and meetings. So, what are you waiting for Grab this template today. This slide represents a dashboard to maintain the record of various functions of Secure Web Gateway. The main components are top blocked web malware, web usage trend, top web application categories, risky web isolations, etc.
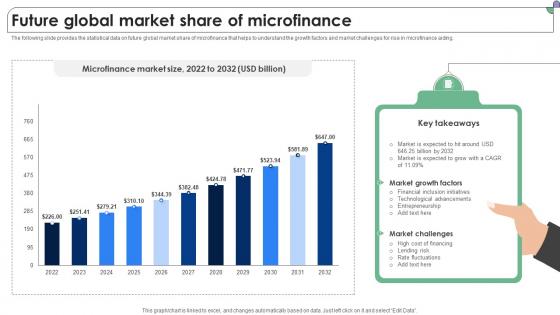
Future Global Market Share Of Microfinance Complete Guide To Microfinance Fin SS V
The following slide provides the statistical data on future global market share of microfinance that helps to understand the growth factors and market challenges for rise in microfinance aiding. Find highly impressive Future Global Market Share Of Microfinance Complete Guide To Microfinance Fin SS V on Slidegeeks to deliver a meaningful presentation. You can save an ample amount of time using these presentation templates. No need to worry to prepare everything from scratch because Slidegeeks experts have already done a huge research and work for you. You need to download Future Global Market Share Of Microfinance Complete Guide To Microfinance Fin SS V for your upcoming presentation. All the presentation templates are 100 percent editable and you can change the color and personalize the content accordingly. Download now The following slide provides the statistical data on future global market share of microfinance that helps to understand the growth factors and market challenges for rise in microfinance aiding.
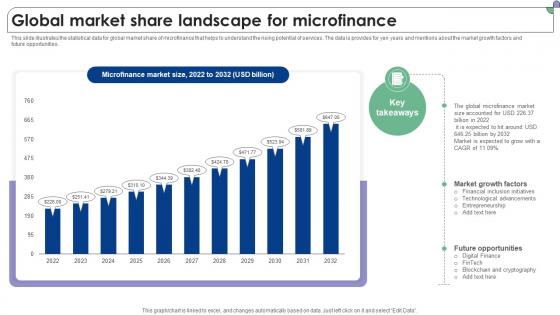
Global Market Share Landscape For Microfinance Complete Guide To Microfinance Fin SS V
This slide illustrates the statistical data for global market share of microfinance that helps to understand the rising potential of services. The data is provides for yen years and mentions about the market growth factors and future opportunities. Are you in need of a template that can accommodate all of your creative concepts This one is crafted professionally and can be altered to fit any style. Use it with Google Slides or PowerPoint. Include striking photographs, symbols, depictions, and other visuals. Fill, move around, or remove text boxes as desired. Test out color palettes and font mixtures. Edit and save your work, or work with colleagues. Download Global Market Share Landscape For Microfinance Complete Guide To Microfinance Fin SS V and observe how to make your presentation outstanding. Give an impeccable presentation to your group and make your presentation unforgettable. This slide illustrates the statistical data for global market share of microfinance that helps to understand the rising potential of services. The data is provides for yen years and mentions about the market growth factors and future opportunities.
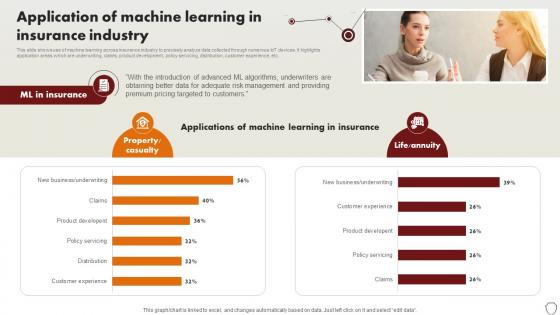
Technology Trends In Online Insurance Application Of Machine Learning In Insurance Industry
This slide shows use of machine learning across insurance industry to precisely analyze data collected through numerous IoT devices. It highlights application areas which are underwriting, claims, product development, policy servicing, distribution, customer experience, etc. Slidegeeks is here to make your presentations a breeze with Technology Trends In Online Insurance Application Of Machine Learning In Insurance Industry With our easy-to-use and customizable templates, you can focus on delivering your ideas rather than worrying about formatting. With a variety of designs to choose from, you are sure to find one that suits your needs. And with animations and unique photos, illustrations, and fonts, you can make your presentation pop. So whether you are giving a sales pitch or presenting to the board, make sure to check out Slidegeeks first This slide shows use of machine learning across insurance industry to precisely analyze data collected through numerous IoT devices. It highlights application areas which are underwriting, claims, product development, policy servicing, distribution, customer experience, etc.
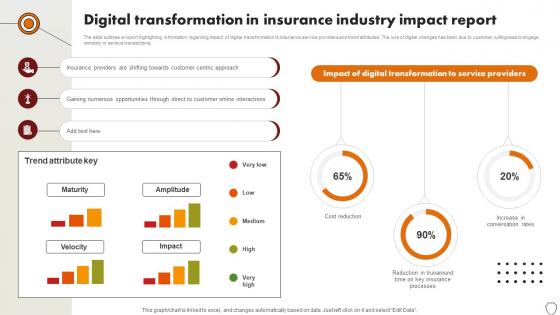
Technology Trends In Online Insurance Digital Transformation In Insurance Industry Impact Report
The slide outlines a report highlighting information regarding impact of digital transformation to insurance service providers and trend attributes. The lure of digital changes has been due to customer willingness to engage remotely in serious transactions. This Technology Trends In Online Insurance Digital Transformation In Insurance Industry Impact Report is perfect for any presentation, be it in front of clients or colleagues. It is a versatile and stylish solution for organizing your meetings. The Technology Trends In Online Insurance Digital Transformation In Insurance Industry Impact Report features a modern design for your presentation meetings. The adjustable and customizable slides provide unlimited possibilities for acing up your presentation. Slidegeeks has done all the homework before launching the product for you. So, do not wait, grab the presentation templates today The slide outlines a report highlighting information regarding impact of digital transformation to insurance service providers and trend attributes. The lure of digital changes has been due to customer willingness to engage remotely in serious transactions.
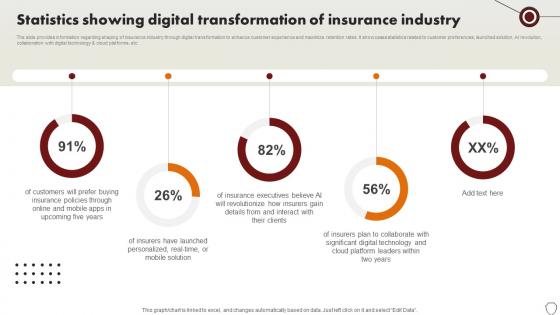
Technology Trends In Online Insurance Statistics Showing Digital Transformation Of Insurance Industry
The slide provides information regarding shaping of insurance industry through digital transformation to enhance customer experience and maximize retention rates. It showcases statistics related to customer preferences, launched solution, AI revolution, collaboration with digital technology and cloud platforms, etc. Make sure to capture your audiences attention in your business displays with our gratis customizable Technology Trends In Online Insurance Statistics Showing Digital Transformation Of Insurance Industry. These are great for business strategies, office conferences, capital raising or task suggestions. If you desire to acquire more customers for your tech business and ensure they stay satisfied, create your own sales presentation with these plain slides. The slide provides information regarding shaping of insurance industry through digital transformation to enhance customer experience and maximize retention rates. It showcases statistics related to customer preferences, launched solution, AI revolution, collaboration with digital technology and cloud platforms, etc.
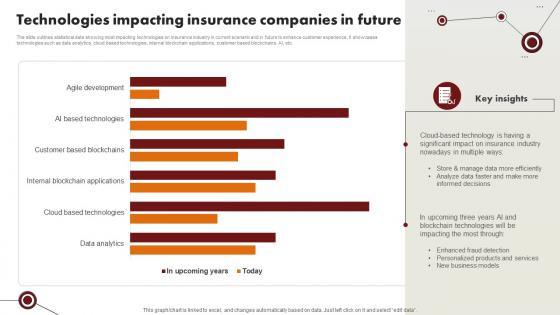
Technology Trends In Online Insurance Technologies Impacting Insurance Companies In Future
The slide outlines statistical data showing most impacting technologies on insurance industry in current scenario and in future to enhance customer experience, It showcases technologies such as data analytics, cloud based technologies, internal blockchain applications, customer based blockchains, AI, etc. This modern and well-arranged Technology Trends In Online Insurance Technologies Impacting Insurance Companies In Future provides lots of creative possibilities. It is very simple to customize and edit with the Powerpoint Software. Just drag and drop your pictures into the shapes. All facets of this template can be edited with Powerpoint, no extra software is necessary. Add your own material, put your images in the places assigned for them, adjust the colors, and then you can show your slides to the world, with an animated slide included. The slide outlines statistical data showing most impacting technologies on insurance industry in current scenario and in future to enhance customer experience, It showcases technologies such as data analytics, cloud based technologies, internal blockchain applications, customer based blockchains, AI, etc.
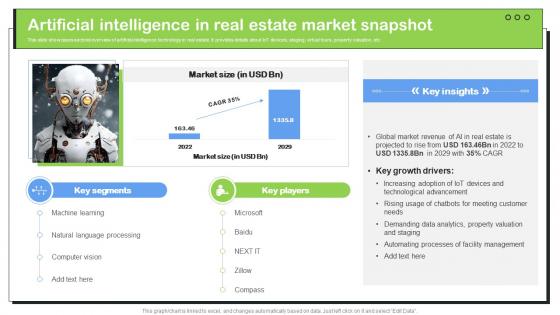
Transforming Real Estate Artificial Intelligence In Real Estate Market Snapshot ChatGPT SS V
This slide showcases sectoral overview of artificial intelligence technology in real estate. It provides details about IoT devices, staging, virtual tours, property valuation, etc. Do you have to make sure that everyone on your team knows about any specific topic I yes, then you should give Transforming Real Estate Artificial Intelligence In Real Estate Market Snapshot ChatGPT SS V a try. Our experts have put a lot of knowledge and effort into creating this impeccable Transforming Real Estate Artificial Intelligence In Real Estate Market Snapshot ChatGPT SS V. You can use this template for your upcoming presentations, as the slides are perfect to represent even the tiniest detail. You can download these templates from the Slidegeeks website and these are easy to edit. So grab these today This slide showcases sectoral overview of artificial intelligence technology in real estate. It provides details about IoT devices, staging, virtual tours, property valuation, etc.
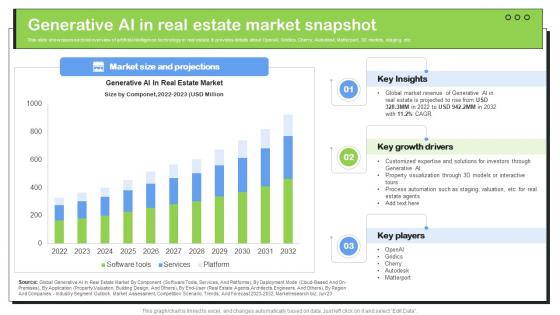
Transforming Real Estate Generative AI In Real Estate Market Snapshot ChatGPT SS V
This slide showcases sectoral overview of artificial intelligence technology in real estate. It provides details about OpenAI, Gridics, Cherry, Autodesk, Matterport, 3D models, staging, etc. Explore a selection of the finest Transforming Real Estate Generative AI In Real Estate Market Snapshot ChatGPT SS V here. With a plethora of professionally designed and pre-made slide templates, you can quickly and easily find the right one for your upcoming presentation. You can use our Transforming Real Estate Generative AI In Real Estate Market Snapshot ChatGPT SS V to effectively convey your message to a wider audience. Slidegeeks has done a lot of research before preparing these presentation templates. The content can be personalized and the slides are highly editable. Grab templates today from Slidegeeks. This slide showcases sectoral overview of artificial intelligence technology in real estate. It provides details about OpenAI, Gridics, Cherry, Autodesk, Matterport, 3D models, staging, etc.
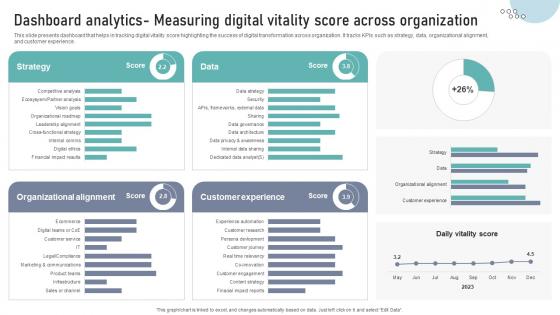
Dashboard Analytics Measuring Digital Vitality Score Across Organization DT SS V
This slide presents dashboard that helps in tracking digital vitality score highlighting the success of digital transformation across organization. It tracks KPIs such as strategy, data, organizational alignment,and customer experience.Make sure to capture your audiences attention in your business displays with our gratis customizable Dashboard Analytics Measuring Digital Vitality Score Across Organization DT SS V. These are great for business strategies, office conferences, capital raising or task suggestions. If you desire to acquire more customers for your tech business and ensure they stay satisfied, create your own sales presentation with these plain slides. This slide presents dashboard that helps in tracking digital vitality score highlighting the success of digital transformation across organization. It tracks KPIs such as strategy, data, organizational alignment,and customer experience.

Data Collection Storage And Analysis Strategies DT SS V
This slide present various digital strategies for effective data collection, storage, and analysis to improve data-based decision making. It includes customer feedback and surveys, cloud-based solutions, data visualization tools , etc. Coming up with a presentation necessitates that the majority of the effort goes into the content and the message you intend to convey. The visuals of a PowerPoint presentation can only be effective if it supplements and supports the story that is being told. Keeping this in mind our experts created Data Collection Storage And Analysis Strategies DT SS V to reduce the time that goes into designing the presentation. This way, you can concentrate on the message while our designers take care of providing you with the right template for the situation. This slide present various digital strategies for effective data collection, storage, and analysis to improve data-based decision making. It includes customer feedback and surveys, cloud-based solutions, data visualization tools , etc.
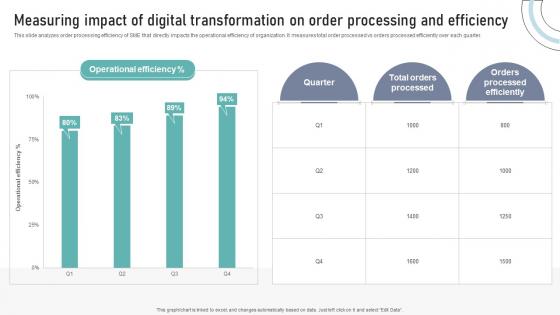
Measuring Impact Of Digital Transformation On Order Processing And Efficiency DT SS V
This slide analyzes order processing efficiency of SME that directly impacts the operational efficiency of organization. It measures total order processed vs orders processed efficiently over each quarter.Do you have an important presentation coming up Are you looking for something that will make your presentation stand out from the rest Look no further than Measuring Impact Of Digital Transformation On Order Processing And Efficiency DT SS V. With our professional designs, you can trust that your presentation will pop and make delivering it a smooth process. And with Slidegeeks, you can trust that your presentation will be unique and memorable. So why wait Grab Measuring Impact Of Digital Transformation On Order Processing And Efficiency DT SS V today and make your presentation stand out from the rest This slide analyzes order processing efficiency of SME that directly impacts the operational efficiency of organization. It measures total order processed vs orders processed efficiently over each quarter.

Overview Cybersecurity And Data Protection In Digital Transformation DT SS V
This slide presents an overview into the landscape of cybersecurity and data protection with its advantages. It also presents a survey analysis on share of SMEs that have implemented essential and basic IT security initiatives.Find highly impressive Overview Cybersecurity And Data Protection In Digital Transformation DT SS V on Slidegeeks to deliver a meaningful presentation. You can save an ample amount of time using these presentation templates. No need to worry to prepare everything from scratch because Slidegeeks experts have already done a huge research and work for you. You need to download Overview Cybersecurity And Data Protection In Digital Transformation DT SS V for your upcoming presentation. All the presentation templates are 100 percent editable and you can change the color and personalize the content accordingly. Download now This slide presents an overview into the landscape of cybersecurity and data protection with its advantages. It also presents a survey analysis on share of SMEs that have implemented essential and basic IT security initiatives.
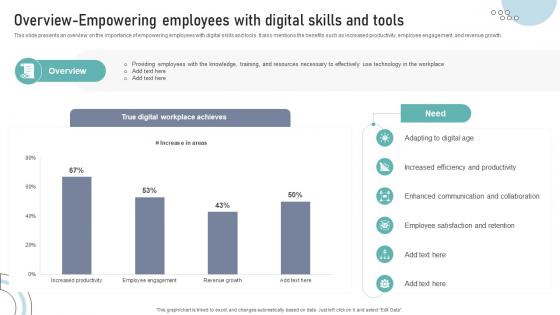
Overview Empowering Employees With Digital Skills And Tools DT SS V
This slide presents an overview on the importance of empowering employees with digital skills and tools. It also mentions the benefits such as increased productivity, employee engagement, and revenue growth.Are you in need of a template that can accommodate all of your creative concepts This one is crafted professionally and can be altered to fit any style. Use it with Google Slides or PowerPoint. Include striking photographs, symbols, depictions, and other visuals. Fill, move around, or remove text boxes as desired. Test out color palettes and font mixtures. Edit and save your work, or work with colleagues. Download Overview Empowering Employees With Digital Skills And Tools DT SS V and observe how to make your presentation outstanding. Give an impeccable presentation to your group and make your presentation unforgettable. This slide presents an overview on the importance of empowering employees with digital skills and tools. It also mentions the benefits such as increased productivity, employee engagement, and revenue growth.
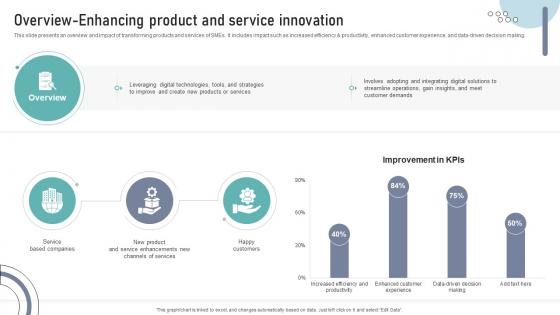
Overview Enhancing Product And Service Innovation DT SS V
This slide presents an overview and impact of transforming products and services of SMEs. It includes impact such as increased efficiency and productivity, enhanced customer experience, and data-driven decision making.Formulating a presentation can take up a lot of effort and time, so the content and message should always be the primary focus. The visuals of the PowerPoint can enhance the presenters message, so our Overview Enhancing Product And Service Innovation DT SS V was created to help save time. Instead of worrying about the design, the presenter can concentrate on the message while our designers work on creating the ideal templates for whatever situation is needed. Slidegeeks has experts for everything from amazing designs to valuable content, we have put everything into Overview Enhancing Product And Service Innovation DT SS V. This slide presents an overview and impact of transforming products and services of SMEs. It includes impact such as increased efficiency and productivity, enhanced customer experience, and data-driven decision making.
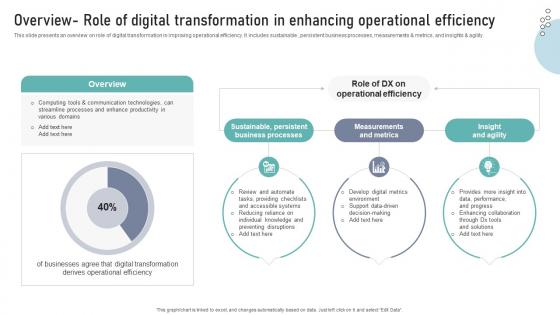
Overview Role Of Digital Transformation In Enhancing Operational Efficiency DT SS V
This slide presents an overview on role of digital transformation in improving operational efficiency. It includes sustainable , persistent business processes, measurements and metrics, and insights and agility.This Overview Role Of Digital Transformation In Enhancing Operational Efficiency DT SS V is perfect for any presentation, be it in front of clients or colleagues. It is a versatile and stylish solution for organizing your meetings. The Overview Role Of Digital Transformation In Enhancing Operational Efficiency DT SS V features a modern design for your presentation meetings. The adjustable and customizable slides provide unlimited possibilities for acing up your presentation. Slidegeeks has done all the homework before launching the product for you. So, do not wait, grab the presentation templates today This slide presents an overview on role of digital transformation in improving operational efficiency. It includes sustainable , persistent business processes, measurements and metrics, and insights and agility.
Inclusive Workplace Training Program Dei Tracking And Reporting Analysis Dashboard DTE SS V
The purpose of this slide is to highlight real-time metrics for effective evaluation and optimization of diversity, equity, and inclusion initiatives. Get a simple yet stunning designed Inclusive Workplace Training Program Dei Tracking And Reporting Analysis Dashboard DTE SS V. It is the best one to establish the tone in your meetings. It is an excellent way to make your presentations highly effective. So, download this PPT today from Slidegeeks and see the positive impacts. Our easy-to-edit Inclusive Workplace Training Program Dei Tracking And Reporting Analysis Dashboard DTE SS V can be your go-to option for all upcoming conferences and meetings. So, what are you waiting for Grab this template today. The purpose of this slide is to highlight real-time metrics for effective evaluation and optimization of diversity, equity, and inclusion initiatives.
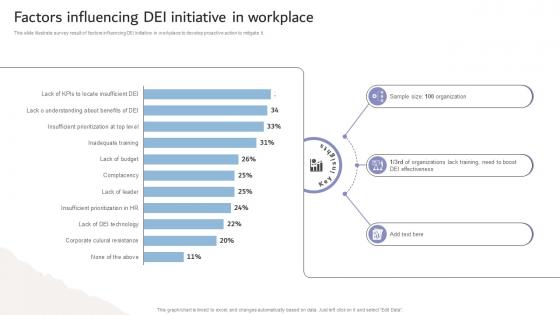
Inclusive Workplace Training Program Factors Influencing Dei Initiative In Workplace DTE SS V
This slide illustrate survey result of factors influencing DEI initiative in workplace to develop proactive action to mitigate it. If your project calls for a presentation, then Slidegeeks is your go-to partner because we have professionally designed, easy-to-edit templates that are perfect for any presentation. After downloading, you can easily edit Inclusive Workplace Training Program Factors Influencing Dei Initiative In Workplace DTE SS V and make the changes accordingly. You can rearrange slides or fill them with different images. Check out all the handy templates This slide illustrate survey result of factors influencing DEI initiative in workplace to develop proactive action to mitigate it.
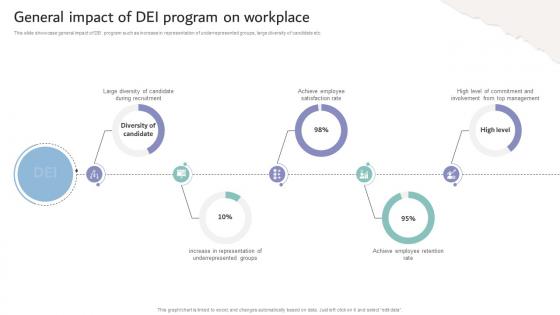
Inclusive Workplace Training Program General Impact Of Dei Program On Workplace DTE SS V
This slide showcase general impact of DEI program such as increase in representation of underrepresented groups, large diversity of candidate etc. Are you in need of a template that can accommodate all of your creative concepts This one is crafted professionally and can be altered to fit any style. Use it with Google Slides or PowerPoint. Include striking photographs, symbols, depictions, and other visuals. Fill, move around, or remove text boxes as desired. Test out color palettes and font mixtures. Edit and save your work, or work with colleagues. Download Inclusive Workplace Training Program General Impact Of Dei Program On Workplace DTE SS V and observe how to make your presentation outstanding. Give an impeccable presentation to your group and make your presentation unforgettable. This slide showcase general impact of DEI program such as increase in representation of underrepresented groups, large diversity of candidate etc.
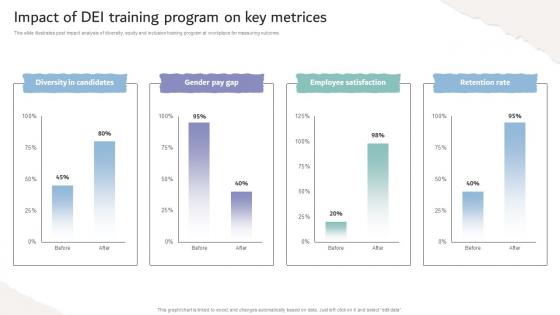
Inclusive Workplace Training Program Impact Of Dei Training Program On Key Metrices DTE SS V
This slide illustrates post impact analysis of diversity, equity and inclusion training program at workplace for measuring outcome. Formulating a presentation can take up a lot of effort and time, so the content and message should always be the primary focus. The visuals of the PowerPoint can enhance the presenters message, so our Inclusive Workplace Training Program Impact Of Dei Training Program On Key Metrices DTE SS V was created to help save time. Instead of worrying about the design, the presenter can concentrate on the message while our designers work on creating the ideal templates for whatever situation is needed. Slidegeeks has experts for everything from amazing designs to valuable content, we have put everything into Inclusive Workplace Training Program Impact Of Dei Training Program On Key Metrices DTE SS V. This slide illustrates post impact analysis of diversity, equity and inclusion training program at workplace for measuring outcome.
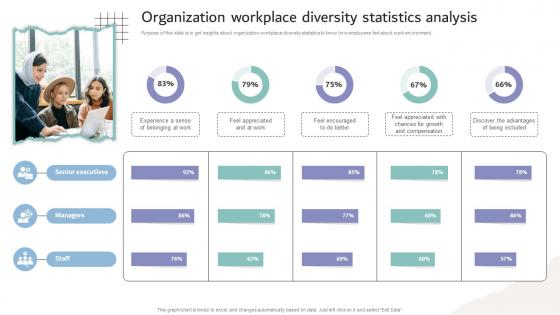
Inclusive Workplace Training Program Organization Workplace Diversity Statistics Analysis DTE SS V
Purpose of this slide is to get insights about organization workplace diversity statistics to know how employees feel about work environment. Coming up with a presentation necessitates that the majority of the effort goes into the content and the message you intend to convey. The visuals of a PowerPoint presentation can only be effective if it supplements and supports the story that is being told. Keeping this in mind our experts created Inclusive Workplace Training Program Organization Workplace Diversity Statistics Analysis DTE SS V to reduce the time that goes into designing the presentation. This way, you can concentrate on the message while our designers take care of providing you with the right template for the situation. Purpose of this slide is to get insights about organization workplace diversity statistics to know how employees feel about work environment.
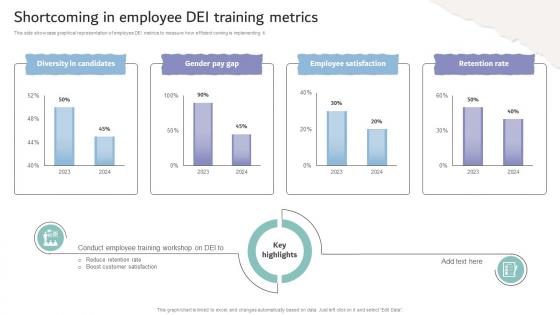
Inclusive Workplace Training Program Shortcoming In Employee Dei Training Metrics DTE SS V
This side showcase graphical representation of employee DEI metrics to measure how efficient coming is implementing it. Welcome to our selection of the Inclusive Workplace Training Program Shortcoming In Employee Dei Training Metrics DTE SS V. These are designed to help you showcase your creativity and bring your sphere to life. Planning and Innovation are essential for any business that is just starting out. This collection contains the designs that you need for your everyday presentations. All of our PowerPoints are 100Percent editable, so you can customize them to suit your needs. This multi-purpose template can be used in various situations. Grab these presentation templates today. This side showcase graphical representation of employee DEI metrics to measure how efficient coming is implementing it.
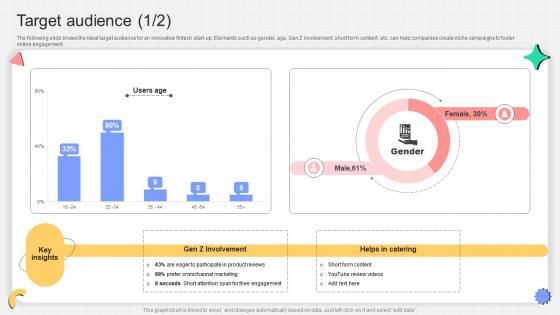
Target Audience P2p Payment Startup Go To Market Strategy GTM SS V
The following slide shows the ideal target audience for an innovative fintech start-up. Elements such as gender, age, Gen Z involvement, short form content, etc. can help companies create niche campaigns to foster online engagement.This Target Audience P2p Payment Startup Go To Market Strategy GTM SS V is perfect for any presentation, be it in front of clients or colleagues. It is a versatile and stylish solution for organizing your meetings. The Target Audience P2p Payment Startup Go To Market Strategy GTM SS V features a modern design for your presentation meetings. The adjustable and customizable slides provide unlimited possibilities for acing up your presentation. Slidegeeks has done all the homework before launching the product for you. So, do not wait, grab the presentation templates today The following slide shows the ideal target audience for an innovative fintech start-up. Elements such as gender, age, Gen Z involvement, short form content, etc. can help companies create niche campaigns to foster online engagement.
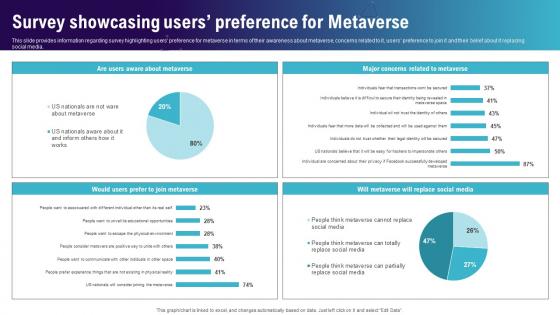
Survey Showcasing Users Preference For Metaverse Continuum Of Technology Revamping Business AI SS V
This slide provides information regarding survey highlighting users preference for metaverse in terms of their awareness about metaverse, concerns related to it, users preference to join it and their belief about it replacing social media. Are you in need of a template that can accommodate all of your creative concepts This one is crafted professionally and can be altered to fit any style. Use it with Google Slides or PowerPoint. Include striking photographs, symbols, depictions, and other visuals. Fill, move around, or remove text boxes as desired. Test out color palettes and font mixtures. Edit and save your work, or work with colleagues. Download Survey Showcasing Users Preference For Metaverse Continuum Of Technology Revamping Business AI SS V and observe how to make your presentation outstanding. Give an impeccable presentation to your group and make your presentation unforgettable. This slide provides information regarding survey highlighting users preference for metaverse in terms of their awareness about metaverse, concerns related to it, users preference to join it and their belief about it replacing social media.
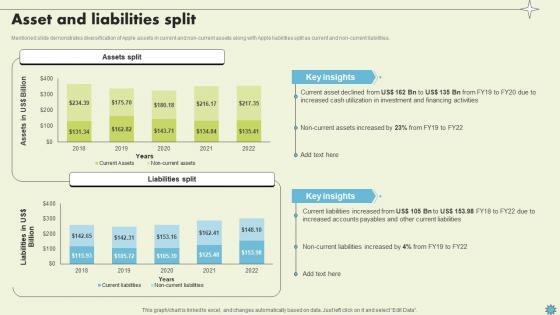
Asset And Liabilities Split Consumer Electronics Company Profile CP SS V
Mentioned slide demonstrates diversification of Apple assets in current and non-current assets along with Apple liabilities split as current and non-current liabilities.Do you have to make sure that everyone on your team knows about any specific topic I yes, then you should give Asset And Liabilities Split Consumer Electronics Company Profile CP SS V a try. Our experts have put a lot of knowledge and effort into creating this impeccable Asset And Liabilities Split Consumer Electronics Company Profile CP SS V. You can use this template for your upcoming presentations, as the slides are perfect to represent even the tiniest detail. You can download these templates from the Slidegeeks website and these are easy to edit. So grab these today Mentioned slide demonstrates diversification of Apple assets in current and non-current assets along with Apple liabilities split as current and non-current liabilities.
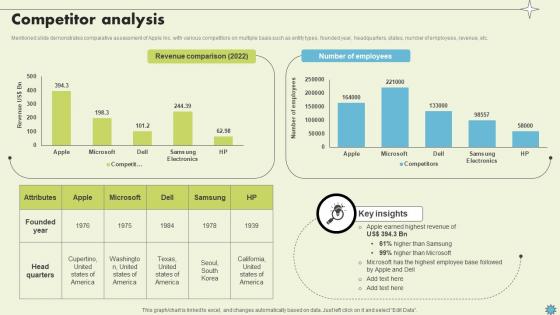
Competitor Analysis Consumer Electronics Company Profile CP SS V
Mentioned slide demonstrates comparative assessment of Apple Inc. with various competitors on multiple basis such as entity types, founded year, headquarters, states, number of employees, revenue, etc.Crafting an eye-catching presentation has never been more straightforward. Let your presentation shine with this tasteful yet straightforward Competitor Analysis Consumer Electronics Company Profile CP SS V template. It offers a minimalistic and classy look that is great for making a statement. The colors have been employed intelligently to add a bit of playfulness while still remaining professional. Construct the ideal Competitor Analysis Consumer Electronics Company Profile CP SS V that effortlessly grabs the attention of your audience Begin now and be certain to wow your customers Mentioned slide demonstrates comparative assessment of Apple Inc. with various competitors on multiple basis such as entity types, founded year, headquarters, states, number of employees, revenue, etc.
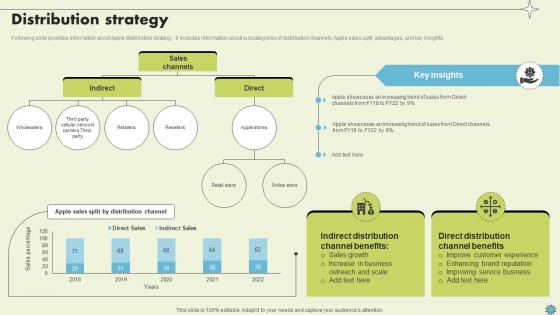
Distribution Strategy Consumer Electronics Company Profile CP SS V
Following slide provides information about Apple distribution strategy . It includes information about subcategories of distribution channels, Apple sales split, advantages, and key insights.Welcome to our selection of the Distribution Strategy Consumer Electronics Company Profile CP SS V. These are designed to help you showcase your creativity and bring your sphere to life. Planning and Innovation are essential for any business that is just starting out. This collection contains the designs that you need for your everyday presentations. All of our PowerPoints are 100 percent editable, so you can customize them to suit your needs. This multi-purpose template can be used in various situations. Grab these presentation templates today. Following slide provides information about Apple distribution strategy . It includes information about subcategories of distribution channels, Apple sales split, advantages, and key insights.
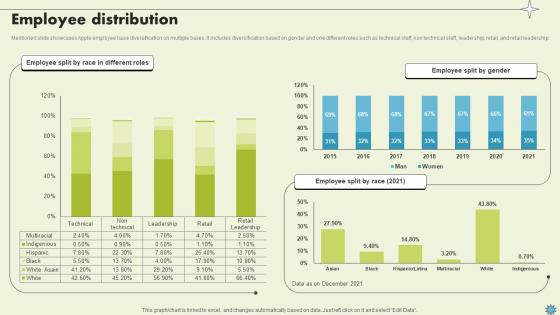
Employee Distribution Consumer Electronics Company Profile CP SS V
Mentioned slide showcases Apple employee base diversification on multiple bases. It includes diversification based on gender and one different roles such as technical staff, non technical staff, leadership, retail, and retail leadership.Explore a selection of the finest Employee Distribution Consumer Electronics Company Profile CP SS V here. With a plethora of professionally designed and pre-made slide templates, you can quickly and easily find the right one for your upcoming presentation. You can use our Employee Distribution Consumer Electronics Company Profile CP SS V to effectively convey your message to a wider audience. Slidegeeks has done a lot of research before preparing these presentation templates. The content can be personalized and the slides are highly editable. Grab templates today from Slidegeeks. Mentioned slide showcases Apple employee base diversification on multiple bases. It includes diversification based on gender and one different roles such as technical staff, non technical staff, leadership, retail, and retail leadership.
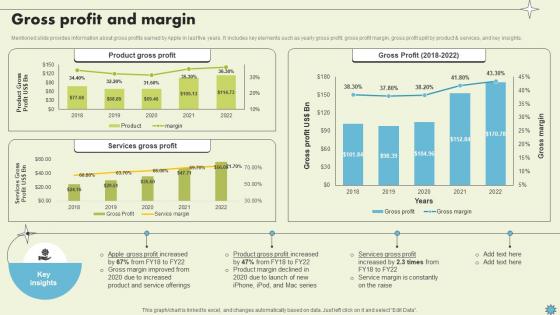
Gross Profit And Margin Consumer Electronics Company Profile CP SS V
Mentioned slide provides information about gross profits earned by Apple in last five years. It includes key elements such as yearly gross profit, gross profit margin, gross profit split by product and services, and key insights.Take your projects to the next level with our ultimate collection of Gross Profit And Margin Consumer Electronics Company Profile CP SS V. Slidegeeks has designed a range of layouts that are perfect for representing task or activity duration, keeping track of all your deadlines at a glance. Tailor these designs to your exact needs and give them a truly corporate look with your own brand colors they will make your projects stand out from the rest Mentioned slide provides information about gross profits earned by Apple in last five years. It includes key elements such as yearly gross profit, gross profit margin, gross profit split by product and services, and key insights.
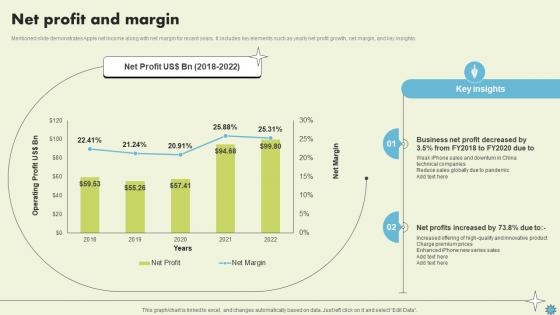
Net Profit And Margin Consumer Electronics Company Profile CP SS V
Mentioned slide demonstrates Apple net income along with net margin for recent years. It includes key elements such as yearly net profit growth, net margin, and key insights.Slidegeeks is here to make your presentations a breeze with Net Profit And Margin Consumer Electronics Company Profile CP SS V With our easy-to-use and customizable templates, you can focus on delivering your ideas rather than worrying about formatting. With a variety of designs to choose from, you are sure to find one that suits your needs. And with animations and unique photos, illustrations, and fonts, you can make your presentation pop. So whether you are giving a sales pitch or presenting to the board, make sure to check out Slidegeeks first Mentioned slide demonstrates Apple net income along with net margin for recent years. It includes key elements such as yearly net profit growth, net margin, and key insights.
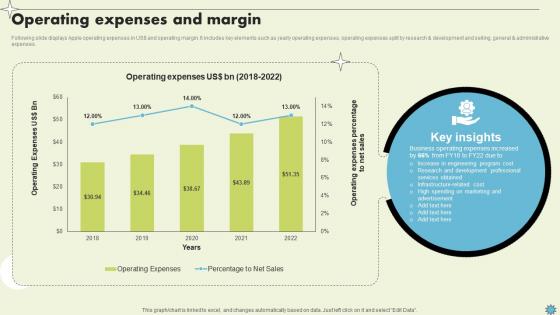
Operating Expenses And Margin Consumer Electronics Company Profile CP SS V
Following slide displays Apple operating expenses in USdollar and operating margin. It includes key elements such as yearly operating expenses, operating expenses split by research and development and selling, general and administrative expenses.Do you have an important presentation coming up Are you looking for something that will make your presentation stand out from the rest Look no further than Operating Expenses And Margin Consumer Electronics Company Profile CP SS V. With our professional designs, you can trust that your presentation will pop and make delivering it a smooth process. And with Slidegeeks, you can trust that your presentation will be unique and memorable. So why wait Grab Operating Expenses And Margin Consumer Electronics Company Profile CP SS V today and make your presentation stand out from the rest Following slide displays Apple operating expenses in USdollar and operating margin. It includes key elements such as yearly operating expenses, operating expenses split by research and development and selling, general and administrative expenses.
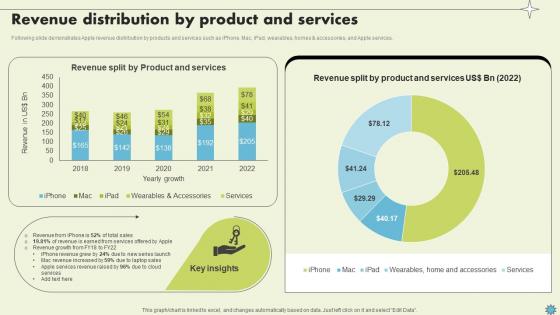
Revenue Distribution By Product And Services Consumer Electronics Company Profile CP SS V
Following slide demonstrates Apple revenue distribution by products and services such as iPhone, Mac, iPad, wearables, homes and accessories, and Apple services.Coming up with a presentation necessitates that the majority of the effort goes into the content and the message you intend to convey. The visuals of a PowerPoint presentation can only be effective if it supplements and supports the story that is being told. Keeping this in mind our experts created Revenue Distribution By Product And Services Consumer Electronics Company Profile CP SS V to reduce the time that goes into designing the presentation. This way, you can concentrate on the message while our designers take care of providing you with the right template for the situation. Following slide demonstrates Apple revenue distribution by products and services such as iPhone, Mac, iPad, wearables, homes and accessories, and Apple services.
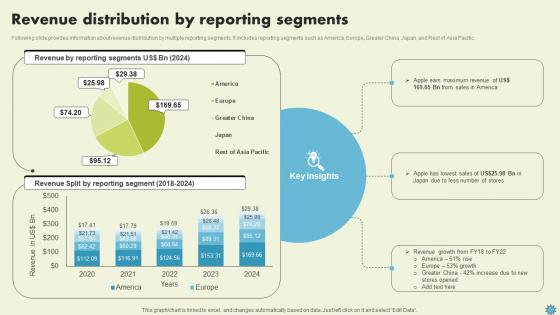
Revenue Distribution By Reporting Segments Consumer Electronics Company Profile CP SS V
Following slide provides information about revenue distribution by multiple reporting segments. It includes reporting segments such as America, Europe, Greater China, Japan, and Rest of Asia Pacific.This modern and well-arranged Revenue Distribution By Reporting Segments Consumer Electronics Company Profile CP SS V provides lots of creative possibilities. It is very simple to customize and edit with the Powerpoint Software. Just drag and drop your pictures into the shapes. All facets of this template can be edited with Powerpoint, no extra software is necessary. Add your own material, put your images in the places assigned for them, adjust the colors, and then you can show your slides to the world, with an animated slide included. Following slide provides information about revenue distribution by multiple reporting segments. It includes reporting segments such as America, Europe, Greater China, Japan, and Rest of Asia Pacific.
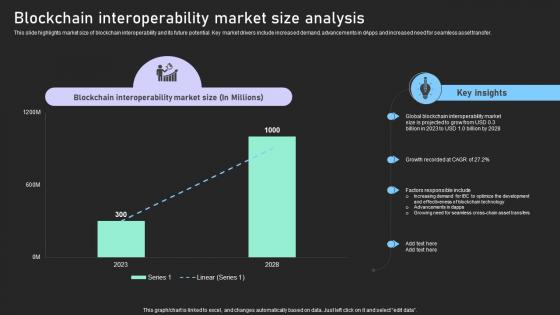
Understanding Various Blockchain Interoperability Blockchain Interoperability Market BCT SS V
This slide highlights market size of blockchain interoperability and its future potential. Key market drivers include increased demand, advancements in dApps and increased need for seamless asset transfer. Coming up with a presentation necessitates that the majority of the effort goes into the content and the message you intend to convey. The visuals of a PowerPoint presentation can only be effective if it supplements and supports the story that is being told. Keeping this in mind our experts created Understanding Various Blockchain Interoperability Blockchain Interoperability Market BCT SS V to reduce the time that goes into designing the presentation. This way, you can concentrate on the message while our designers take care of providing you with the right template for the situation. This slide highlights market size of blockchain interoperability and its future potential. Key market drivers include increased demand, advancements in dApps and increased need for seamless asset transfer.

Integrating AI With IoT Analyzing Survey Results Of AIoT Technology Adoption IoT SS V
Do you have to make sure that everyone on your team knows about any specific topic I yes, then you should give Integrating AI With IoT Analyzing Survey Results Of AIoT Technology Adoption IoT SS V a try. Our experts have put a lot of knowledge and effort into creating this impeccable Integrating AI With IoT Analyzing Survey Results Of AIoT Technology Adoption IoT SS V. You can use this template for your upcoming presentations, as the slides are perfect to represent even the tiniest detail. You can download these templates from the Slidegeeks website and these are easy to edit. So grab these today Our Integrating AI With IoT Analyzing Survey Results Of AIoT Technology Adoption IoT SS V are topically designed to provide an attractive backdrop to any subject. Use them to look like a presentation pro.
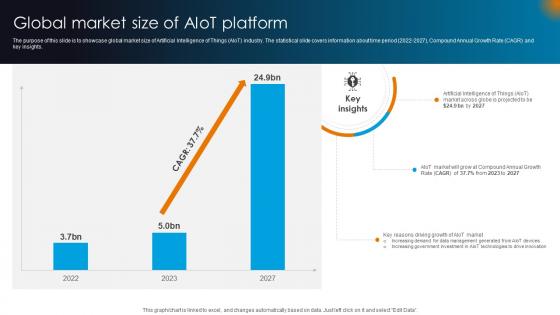
Integrating AI With IoT Global Market Size Of AIoT Platform IoT SS V
The purpose of this slide is to showcase global market size of Artificial Intelligence of Things AIoT industry. The statistical slide covers information about time period 2022-2027, Compound Annual Growth Rate CAGR and key insights. Formulating a presentation can take up a lot of effort and time, so the content and message should always be the primary focus. The visuals of the PowerPoint can enhance the presenters message, so our Integrating AI With IoT Global Market Size Of AIoT Platform IoT SS V was created to help save time. Instead of worrying about the design, the presenter can concentrate on the message while our designers work on creating the ideal templates for whatever situation is needed. Slidegeeks has experts for everything from amazing designs to valuable content, we have put everything into Integrating AI With IoT Global Market Size Of AIoT Platform IoT SS V. The purpose of this slide is to showcase global market size of Artificial Intelligence of Things AIoT industry. The statistical slide covers information about time period 2022-2027, Compound Annual Growth Rate CAGR and key insights.
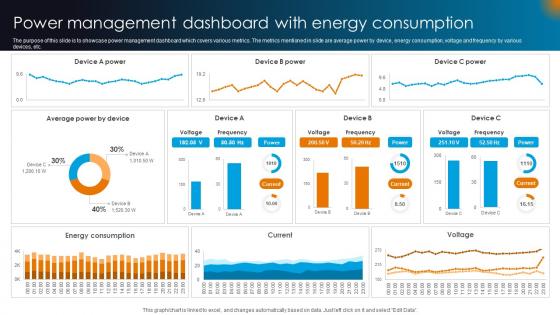
Integrating AI With IoT Power Management Dashboard With Energy Consumption IoT SS V
The purpose of this slide is to showcase power management dashboard which covers various metrics. The metrics mentioned in slide are average power by device, energy consumption, voltage and frequency by various devices, etc. Want to ace your presentation in front of a live audience Our Integrating AI With IoT Power Management Dashboard With Energy Consumption IoT SS V can help you do that by engaging all the users towards you. Slidegeeks experts have put their efforts and expertise into creating these impeccable powerpoint presentations so that you can communicate your ideas clearly. Moreover, all the templates are customizable, and easy-to-edit and downloadable. Use these for both personal and commercial use. The purpose of this slide is to showcase power management dashboard which covers various metrics. The metrics mentioned in slide are average power by device, energy consumption, voltage and frequency by various devices, etc.
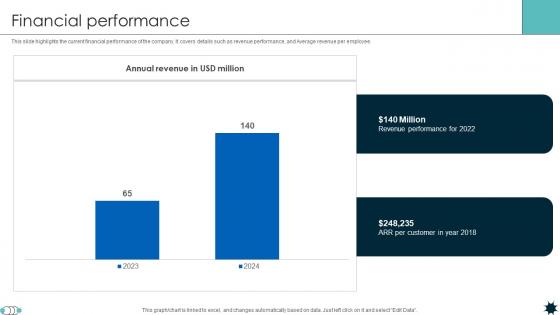
Financial Performance Life Coverage Platform Pitch Deck
This slide highlights the current financial performance of the company. It covers details such as revenue performance, and Average revenue per employee. Present like a pro with Financial Performance Life Coverage Platform Pitch Deck Create beautiful presentations together with your team, using our easy-to-use presentation slides. Share your ideas in real-time and make changes on the fly by downloading our templates. So whether you are in the office, on the go, or in a remote location, you can stay in sync with your team and present your ideas with confidence. With Slidegeeks presentation got a whole lot easier. Grab these presentations today. This slide highlights the current financial performance of the company. It covers details such as revenue performance, and Average revenue per employee.
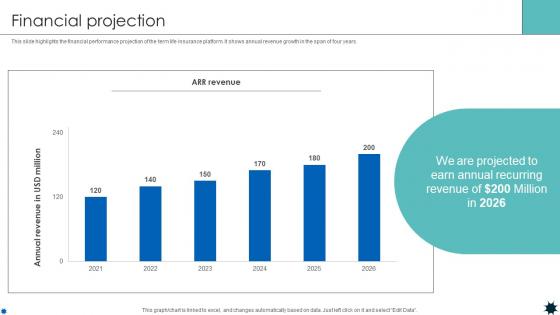
Financial Projection Life Coverage Platform Pitch Deck
This slide highlights the financial performance projection of the term life insurance platform. It shows annual revenue growth in the span of four years. Slidegeeks is here to make your presentations a breeze with Financial Projection Life Coverage Platform Pitch Deck With our easy-to-use and customizable templates, you can focus on delivering your ideas rather than worrying about formatting. With a variety of designs to choose from, you are sure to find one that suits your needs. And with animations and unique photos, illustrations, and fonts, you can make your presentation pop. So whether you are giving a sales pitch or presenting to the board, make sure to check out Slidegeeks first This slide highlights the financial performance projection of the term life insurance platform. It shows annual revenue growth in the span of four years.
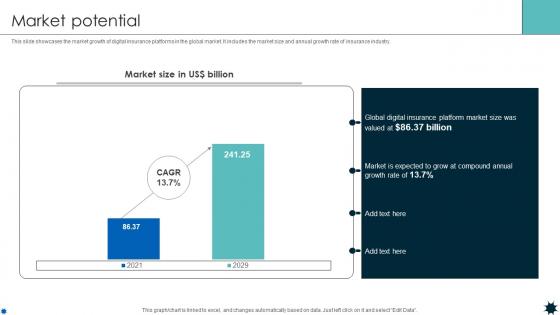
Market Potential Life Coverage Platform Pitch Deck
This slide showcases the market growth of digital insurance platforms in the global market. It includes the market size and annual growth rate of insurance industry. Are you in need of a template that can accommodate all of your creative concepts This one is crafted professionally and can be altered to fit any style. Use it with Google Slides or PowerPoint. Include striking photographs, symbols, depictions, and other visuals. Fill, move around, or remove text boxes as desired. Test out color palettes and font mixtures. Edit and save your work, or work with colleagues. Download Market Potential Life Coverage Platform Pitch Deck and observe how to make your presentation outstanding. Give an impeccable presentation to your group and make your presentation unforgettable. This slide showcases the market growth of digital insurance platforms in the global market. It includes the market size and annual growth rate of insurance industry.
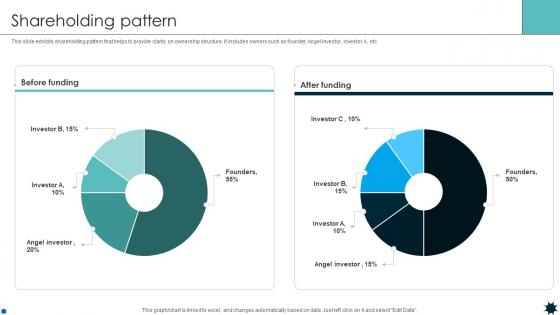
Shareholding Pattern Life Coverage Platform Pitch Deck
This slide exhibits shareholding pattern that helps to provide clarity on ownership structure. It includes owners such as founder, Angel Investor, investor A, etc. This Shareholding Pattern Life Coverage Platform Pitch Deck is perfect for any presentation, be it in front of clients or colleagues. It is a versatile and stylish solution for organizing your meetings. The Shareholding Pattern Life Coverage Platform Pitch Deck features a modern design for your presentation meetings. The adjustable and customizable slides provide unlimited possibilities for acing up your presentation. Slidegeeks has done all the homework before launching the product for you. So, do not wait, grab the presentation templates today This slide exhibits shareholding pattern that helps to provide clarity on ownership structure. It includes owners such as founder, Angel Investor, investor A, etc.
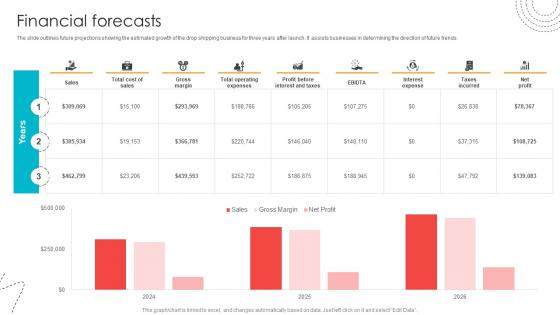
Financial Forecasts Blind Shipping GTM Strategy GTM SS V
The slide outlines future projections showing the estimated growth of the drop shipping business for three years after launch. It assists businesses in determining the direction of future trends.Slidegeeks is here to make your presentations a breeze with Financial Forecasts Blind Shipping GTM Strategy GTM SS V With our easy-to-use and customizable templates, you can focus on delivering your ideas rather than worrying about formatting. With a variety of designs to choose from, you are sure to find one that suits your needs. And with animations and unique photos, illustrations, and fonts, you can make your presentation pop. So whether you are giving a sales pitch or presenting to the board, make sure to check out Slidegeeks first The slide outlines future projections showing the estimated growth of the drop shipping business for three years after launch. It assists businesses in determining the direction of future trends.
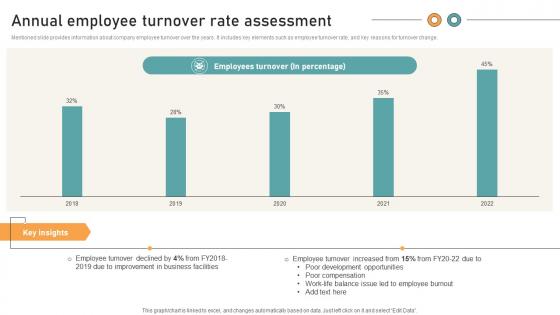
Comprehensive Guide For Website Annual Employee Turnover Rate Assessment
Mentioned slide provides information about company employee turnover over the years. It includes key elements such as employee turnover rate, and key reasons for turnover change. Do you have to make sure that everyone on your team knows about any specific topic I yes, then you should give Comprehensive Guide For Website Annual Employee Turnover Rate Assessment a try. Our experts have put a lot of knowledge and effort into creating this impeccable Comprehensive Guide For Website Annual Employee Turnover Rate Assessment. You can use this template for your upcoming presentations, as the slides are perfect to represent even the tiniest detail. You can download these templates from the Slidegeeks website and these are easy to edit. So grab these today Mentioned slide provides information about company employee turnover over the years. It includes key elements such as employee turnover rate, and key reasons for turnover change.
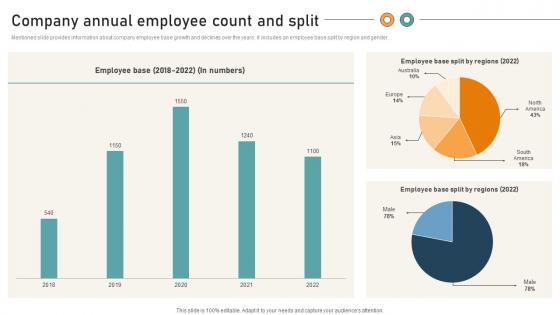
Comprehensive Guide For Website Company Annual Employee Count And Split
Mentioned slide provides information about company employee base growth and declines over the years. It includes an employee base split by region and gender. Find highly impressive Comprehensive Guide For Website Company Annual Employee Count And Split on Slidegeeks to deliver a meaningful presentation. You can save an ample amount of time using these presentation templates. No need to worry to prepare everything from scratch because Slidegeeks experts have already done a huge research and work for you. You need to download Comprehensive Guide For Website Company Annual Employee Count And Split for your upcoming presentation. All the presentation templates are 100 percent editable and you can change the color and personalize the content accordingly. Download now Mentioned slide provides information about company employee base growth and declines over the years. It includes an employee base split by region and gender.
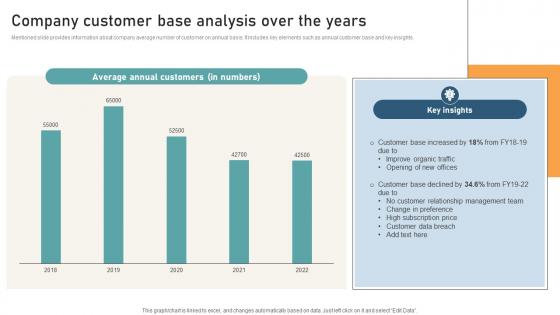
Comprehensive Guide For Website Company Customer Base Analysis Over The Years
Mentioned slide provides information about company average number of customer on annual basis. It includes key elements such as annual customer base and key insights. If your project calls for a presentation, then Slidegeeks is your go-to partner because we have professionally designed, easy-to-edit templates that are perfect for any presentation. After downloading, you can easily edit Comprehensive Guide For Website Company Customer Base Analysis Over The Years and make the changes accordingly. You can rearrange slides or fill them with different images. Check out all the handy templates Mentioned slide provides information about company average number of customer on annual basis. It includes key elements such as annual customer base and key insights.

Comprehensive Guide For Website Customer Engagement And Conversion Rate Evaluation
Mentioned slide provides information business annual customer conversion and engagement rate. It includes key components such as conversion rate, engagement rate, and key insights. Make sure to capture your audiences attention in your business displays with our gratis customizable Comprehensive Guide For Website Customer Engagement And Conversion Rate Evaluation. These are great for business strategies, office conferences, capital raising or task suggestions. If you desire to acquire more customers for your tech business and ensure they stay satisfied, create your own sales presentation with these plain slides. Mentioned slide provides information business annual customer conversion and engagement rate. It includes key components such as conversion rate, engagement rate, and key insights.
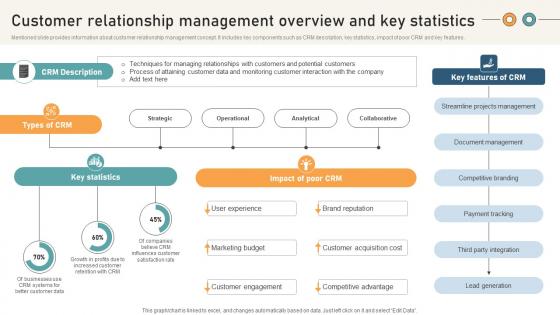
Comprehensive Guide For Website Customer Relationship Management Overview And Key
Mentioned slide provides information about customer relationship management concept. It includes key components such as CRM description, key statistics, impact of poor CRM and key features. Formulating a presentation can take up a lot of effort and time, so the content and message should always be the primary focus. The visuals of the PowerPoint can enhance the presenters message, so our Comprehensive Guide For Website Customer Relationship Management Overview And Key was created to help save time. Instead of worrying about the design, the presenter can concentrate on the message while our designers work on creating the ideal templates for whatever situation is needed. Slidegeeks has experts for everything from amazing designs to valuable content, we have put everything into Comprehensive Guide For Website Customer Relationship Management Overview And Key Mentioned slide provides information about customer relationship management concept. It includes key components such as CRM description, key statistics, impact of poor CRM and key features.
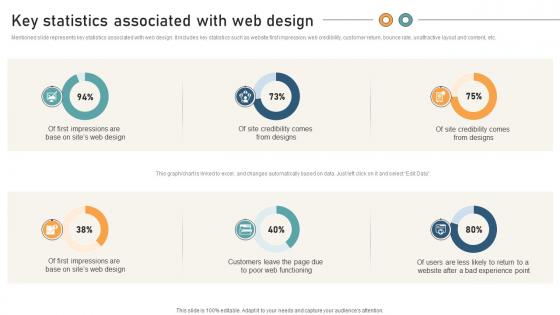
Comprehensive Guide For Website Development Key Statistics Associated With Web Design
Mentioned slide represents key statistics associated with web design. It includes key statistics such as website first impression, web credibility, customer return, bounce rate, unattractive layout and content, etc. Explore a selection of the finest Comprehensive Guide For Website Development Key Statistics Associated With Web Design here. With a plethora of professionally designed and pre-made slide templates, you can quickly and easily find the right one for your upcoming presentation. You can use our Comprehensive Guide For Website Development Key Statistics Associated With Web Design to effectively convey your message to a wider audience. Slidegeeks has done a lot of research before preparing these presentation templates. The content can be personalized and the slides are highly editable. Grab templates today from Slidegeeks. Mentioned slide represents key statistics associated with web design. It includes key statistics such as website first impression, web credibility, customer return, bounce rate, unattractive layout and content, etc.
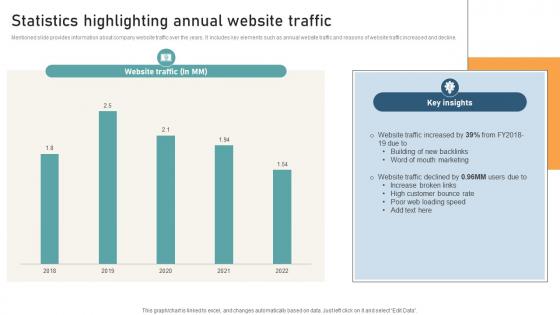
Comprehensive Guide For Website Statistics Highlighting Annual Website Traffic
Mentioned slide provides information about company website traffic over the years. It includes key elements such as annual website traffic and reasons of website traffic increased and decline. Find highly impressive Comprehensive Guide For Website Statistics Highlighting Annual Website Traffic on Slidegeeks to deliver a meaningful presentation. You can save an ample amount of time using these presentation templates. No need to worry to prepare everything from scratch because Slidegeeks experts have already done a huge research and work for you. You need to download Comprehensive Guide For Website Statistics Highlighting Annual Website Traffic for your upcoming presentation. All the presentation templates are 100 percent editable and you can change the color and personalize the content accordingly. Download now Mentioned slide provides information about company website traffic over the years. It includes key elements such as annual website traffic and reasons of website traffic increased and decline.
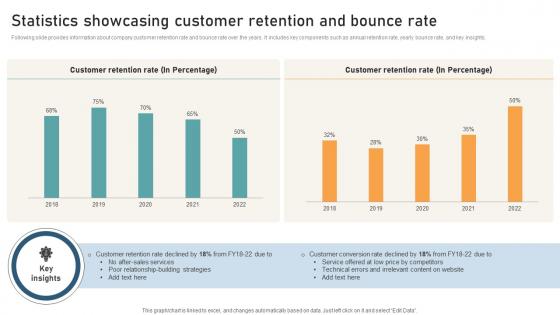
Comprehensive Guide For Website Statistics Showcasing Customer Retention And Bounce
Following slide provides information about company customer retention rate and bounce rate over the years. It includes key components such as annual retention rate, yearly bounce rate, and key insights. If your project calls for a presentation, then Slidegeeks is your go-to partner because we have professionally designed, easy-to-edit templates that are perfect for any presentation. After downloading, you can easily edit Comprehensive Guide For Website Statistics Showcasing Customer Retention And Bounce and make the changes accordingly. You can rearrange slides or fill them with different images. Check out all the handy templates Following slide provides information about company customer retention rate and bounce rate over the years. It includes key components such as annual retention rate, yearly bounce rate, and key insights.

Comprehensive Guide On Current Strategies Ongoing Market Trends And Size Of Food Packaging
The slide showcases market size and trends of food packaging technology currently going in industry. The slide consists of key insights and market trends in current year. Welcome to our selection of the Comprehensive Guide On Current Strategies Ongoing Market Trends And Size Of Food Packaging. These are designed to help you showcase your creativity and bring your sphere to life. Planning and Innovation are essential for any business that is just starting out. This collection contains the designs that you need for your everyday presentations. All of our PowerPoints are 100Percent editable, so you can customize them to suit your needs. This multi-purpose template can be used in various situations. Grab these presentation templates today. The slide showcases market size and trends of food packaging technology currently going in industry. The slide consists of key insights and market trends in current year.
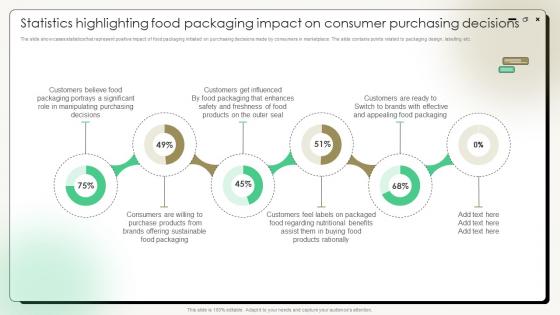
Comprehensive Guide On Current Strategies Statistics Highlighting Food Packaging Impact On Consumer
The slide showcases statistics that represent positive impact of food packaging initiated on purchasing decisions made by consumers in marketplace. The slide contains points related to packaging design, labelling etc. Here you can discover an assortment of the finest PowerPoint and Google Slides templates. With these templates, you can create presentations for a variety of purposes while simultaneously providing your audience with an eye-catching visual experience. Download Comprehensive Guide On Current Strategies Statistics Highlighting Food Packaging Impact On Consumer to deliver an impeccable presentation. These templates will make your job of preparing presentations much quicker, yet still, maintain a high level of quality. Slidegeeks has experienced researchers who prepare these templates and write high-quality content for you. Later on, you can personalize the content by editing the Comprehensive Guide On Current Strategies Statistics Highlighting Food Packaging Impact On Consumer. The slide showcases statistics that represent positive impact of food packaging initiated on purchasing decisions made by consumers in marketplace. The slide contains points related to packaging design, labelling etc.
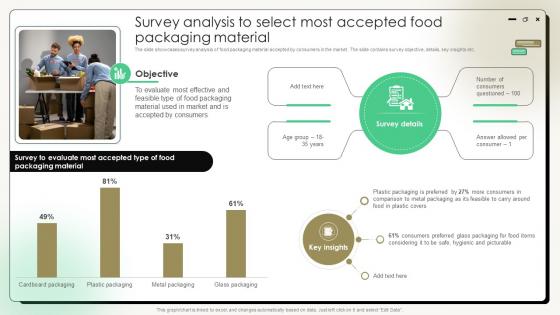
Comprehensive Guide On Current Strategies Survey Analysis To Select Most Accepted Food Packaging
The slide showcases survey analysis of food packaging material accepted by consumers in the market. The slide contains survey objective, details, key insights etc. There are so many reasons you need a Comprehensive Guide On Current Strategies Survey Analysis To Select Most Accepted Food Packaging. The first reason is you can not spend time making everything from scratch, Thus, Slidegeeks has made presentation templates for you too. You can easily download these templates from our website easily. The slide showcases survey analysis of food packaging material accepted by consumers in the market. The slide contains survey objective, details, key insights etc.
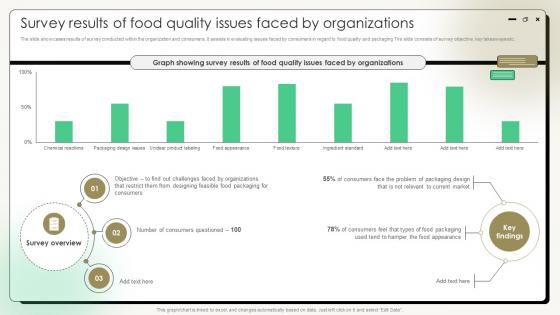
Comprehensive Guide On Current Strategies Survey Results Of Food Quality Issues Faced By Organizations
The slide showcases results of survey conducted within the organization and consumers. It assists in evaluating issues faced by consumers in regard to food quality and packaging The slide consists of survey objective, key takeaways etc. Do you have to make sure that everyone on your team knows about any specific topic I yes, then you should give Comprehensive Guide On Current Strategies Survey Results Of Food Quality Issues Faced By Organizations a try. Our experts have put a lot of knowledge and effort into creating this impeccable Comprehensive Guide On Current Strategies Survey Results Of Food Quality Issues Faced By Organizations. You can use this template for your upcoming presentations, as the slides are perfect to represent even the tiniest detail. You can download these templates from the Slidegeeks website and these are easy to edit. So grab these today The slide showcases results of survey conducted within the organization and consumers. It assists in evaluating issues faced by consumers in regard to food quality and packaging The slide consists of survey objective, key takeaways etc.
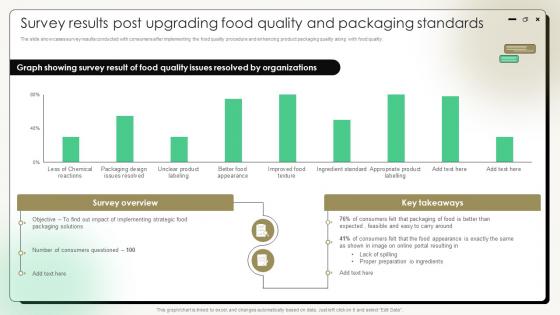
Comprehensive Guide On Current Strategies Survey Results Post Upgrading Food Quality And Packaging
The slide showcases survey results conducted with consumers after implementing the food quality procedure and enhancing product packaging quality along with food quality. Get a simple yet stunning designed Comprehensive Guide On Current Strategies Survey Results Post Upgrading Food Quality And Packaging. It is the best one to establish the tone in your meetings. It is an excellent way to make your presentations highly effective. So, download this PPT today from Slidegeeks and see the positive impacts. Our easy-to-edit Comprehensive Guide On Current Strategies Survey Results Post Upgrading Food Quality And Packaging can be your go-to option for all upcoming conferences and meetings. So, what are you waiting for Grab this template today. The slide showcases survey results conducted with consumers after implementing the food quality procedure and enhancing product packaging quality along with food quality.
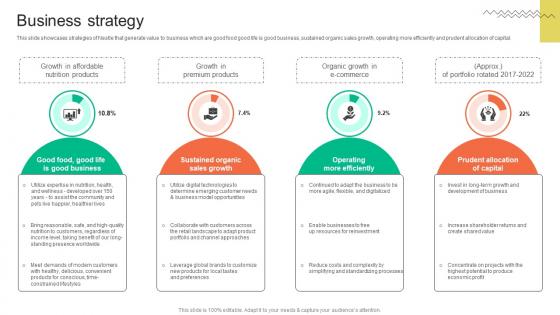
Business Strategy FMCG Provider Company Profile CP SS V
This slide showcases strategies of Nestle that generate value to business which are good food good life is good business, sustained organic sales growth, operating more efficiently and prudent allocation of capital.Want to ace your presentation in front of a live audience Our Business Strategy FMCG Provider Company Profile CP SS V can help you do that by engaging all the users towards you. Slidegeeks experts have put their efforts and expertise into creating these impeccable powerpoint presentations so that you can communicate your ideas clearly. Moreover, all the templates are customizable, and easy-to-edit and downloadable. Use these for both personal and commercial use. This slide showcases strategies of Nestle that generate value to business which are good food good life is good business, sustained organic sales growth, operating more efficiently and prudent allocation of capital.
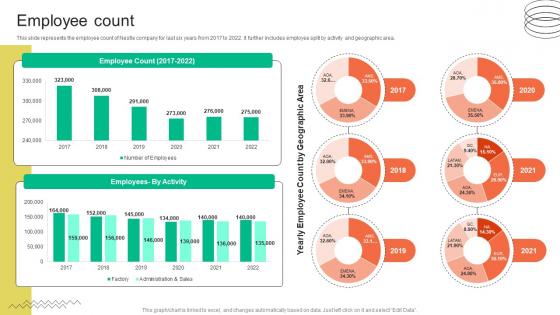
Employee Count FMCG Provider Company Profile CP SS V
This slide represents the employee count of Nestle company for last six years from 2017 to 2022. It further includes employee split by activity and geographic area. Do you have an important presentation coming up Are you looking for something that will make your presentation stand out from the rest Look no further than Employee Count FMCG Provider Company Profile CP SS V. With our professional designs, you can trust that your presentation will pop and make delivering it a smooth process. And with Slidegeeks, you can trust that your presentation will be unique and memorable. So why wait Grab Employee Count FMCG Provider Company Profile CP SS V today and make your presentation stand out from the rest This slide represents the employee count of Nestle company for last six years from 2017 to 2022. It further includes employee split by activity and geographic area.
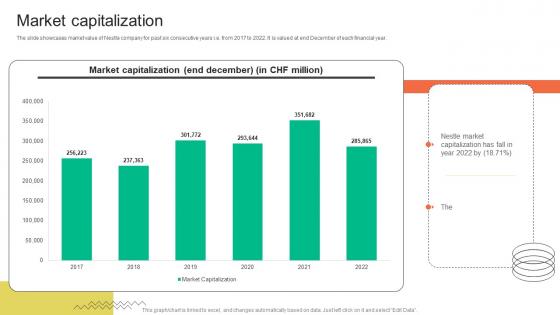
Market Capitalization FMCG Provider Company Profile CP SS V
The slide showcases market value of Nestle company for past six consecutive years i.e. from 2017 to 2022. It is valued at end December of each financial year. Make sure to capture your audiences attention in your business displays with our gratis customizable Market Capitalization FMCG Provider Company Profile CP SS V. These are great for business strategies, office conferences, capital raising or task suggestions. If you desire to acquire more customers for your tech business and ensure they stay satisfied, create your own sales presentation with these plain slides. The slide showcases market value of Nestle company for past six consecutive years i.e. from 2017 to 2022. It is valued at end December of each financial year.
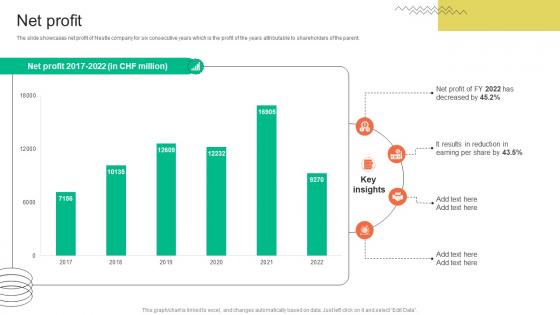
Net Profit FMCG Provider Company Profile CP SS V
The slide showcases net profit of Nestle company for six consecutive years which is the profit of the years attributable to shareholders of the parent. This Net Profit FMCG Provider Company Profile CP SS V is perfect for any presentation, be it in front of clients or colleagues. It is a versatile and stylish solution for organizing your meetings. The Net Profit FMCG Provider Company Profile CP SS V features a modern design for your presentation meetings. The adjustable and customizable slides provide unlimited possibilities for acing up your presentation. Slidegeeks has done all the homework before launching the product for you. So, do not wait, grab the presentation templates today The slide showcases net profit of Nestle company for six consecutive years which is the profit of the years attributable to shareholders of the parent.
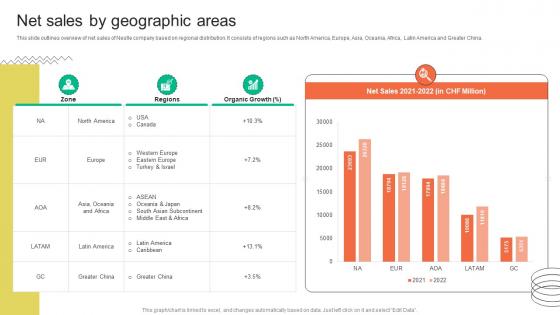
Net Sales By Geographic Areas FMCG Provider Company Profile CP SS V
This slide outlines overview of net sales of Nestle company based on regional distribution. It consists of regions such as North America, Europe, Asia, Oceania, Africa, Latin America and Greater China. Welcome to our selection of the Net Sales By Geographic Areas FMCG Provider Company Profile CP SS V. These are designed to help you showcase your creativity and bring your sphere to life. Planning and Innovation are essential for any business that is just starting out. This collection contains the designs that you need for your everyday presentations. All of our PowerPoints are 100 percent editable, so you can customize them to suit your needs. This multi-purpose template can be used in various situations. Grab these presentation templates today. This slide outlines overview of net sales of Nestle company based on regional distribution. It consists of regions such as North America, Europe, Asia, Oceania, Africa, Latin America and Greater China.
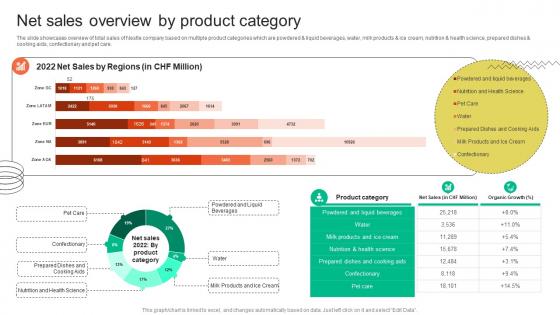
Net Sales Overview By Product Category FMCG Provider Company Profile CP SS V
The slide showcases overview of total sales of Nestle company based on multiple product categories which are powdered and liquid beverages, water, milk products and ice cream, nutrition and health science, prepared dishes and cooking aids, confectionary and pet care.Explore a selection of the finest Net Sales Overview By Product Category FMCG Provider Company Profile CP SS V here. With a plethora of professionally designed and pre-made slide templates, you can quickly and easily find the right one for your upcoming presentation. You can use our Net Sales Overview By Product Category FMCG Provider Company Profile CP SS V to effectively convey your message to a wider audience. Slidegeeks has done a lot of research before preparing these presentation templates. The content can be personalized and the slides are highly editable. Grab templates today from Slidegeeks. The slide showcases overview of total sales of Nestle company based on multiple product categories which are powdered and liquid beverages, water, milk products and ice cream, nutrition and health science, prepared dishes and cooking aids, confectionary and pet care.
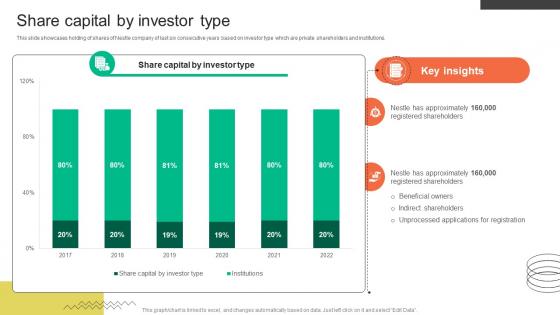
Share Capital By Investor Type FMCG Provider Company Profile CP SS V
This slide showcases holding of shares of Nestle company of last six consecutive years based on investor type which are private shareholders and institutions. Here you can discover an assortment of the finest PowerPoint and Google Slides templates. With these templates, you can create presentations for a variety of purposes while simultaneously providing your audience with an eye-catching visual experience. Download Share Capital By Investor Type FMCG Provider Company Profile CP SS V to deliver an impeccable presentation. These templates will make your job of preparing presentations much quicker, yet still, maintain a high level of quality. Slidegeeks has experienced researchers who prepare these templates and write high-quality content for you. Later on, you can personalize the content by editing the Share Capital By Investor Type FMCG Provider Company Profile CP SS V. This slide showcases holding of shares of Nestle company of last six consecutive years based on investor type which are private shareholders and institutions.
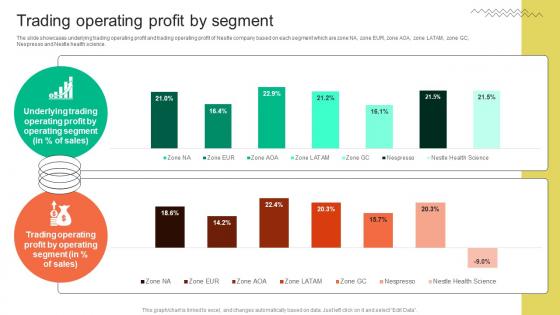
Trading Operating Profit By Segment FMCG Provider Company Profile CP SS V
The slide showcases underlying trading operating profit and trading operating profit of Nestle company based on each segment which are zone NA, zone EUR, zone AOA, zone LATAM, zone GC,Nespresso and Nestle health science.Create an editable Trading Operating Profit By Segment FMCG Provider Company Profile CP SS V that communicates your idea and engages your audience. Whether you are presenting a business or an educational presentation, pre-designed presentation templates help save time. Trading Operating Profit By Segment FMCG Provider Company Profile CP SS V is highly customizable and very easy to edit, covering many different styles from creative to business presentations. Slidegeeks has creative team members who have crafted amazing templates. So, go and get them without any delay. The slide showcases underlying trading operating profit and trading operating profit of Nestle company based on each segment which are zone NA, zone EUR, zone AOA, zone LATAM, zone GC,Nespresso and Nestle health science.
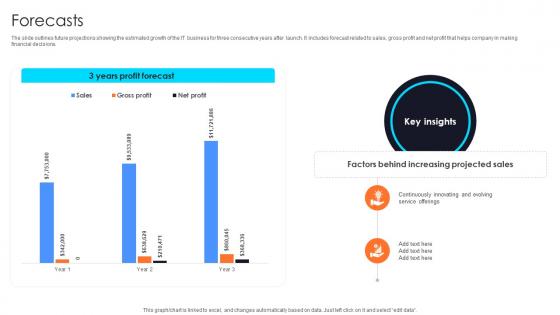
Forecasts Information Technology Startup Go To Market Strategy GTM SS V
The slide outlines future projections showing the estimated growth of the IT business for three consecutive years after launch. It includes forecast related to sales, gross profit and net profit that helps company in making financial decisions.Slidegeeks is here to make your presentations a breeze with Forecasts Information Technology Startup Go To Market Strategy GTM SS V With our easy-to-use and customizable templates, you can focus on delivering your ideas rather than worrying about formatting. With a variety of designs to choose from, you are sure to find one that suits your needs. And with animations and unique photos, illustrations, and fonts, you can make your presentation pop. So whether you are giving a sales pitch or presenting to the board, make sure to check out Slidegeeks first The slide outlines future projections showing the estimated growth of the IT business for three consecutive years after launch. It includes forecast related to sales, gross profit and net profit that helps company in making financial decisions.

Online Payment Techniques Cashless Payment Market Share By Industries
Following slide demonstrates market share of cashless transactions by different industries which can be used by businesses to determine future prospects. It includes industries such as BFSI, healthcare, IT and telecom, media, retail, ecommerce, etc. Welcome to our selection of the Online Payment Techniques Cashless Payment Market Share By Industries. These are designed to help you showcase your creativity and bring your sphere to life. Planning and Innovation are essential for any business that is just starting out. This collection contains the designs that you need for your everyday presentations. All of our PowerPoints are 100Percent editable, so you can customize them to suit your needs. This multi-purpose template can be used in various situations. Grab these presentation templates today. Following slide demonstrates market share of cashless transactions by different industries which can be used by businesses to determine future prospects. It includes industries such as BFSI, healthcare, IT and telecom, media, retail, ecommerce, etc.
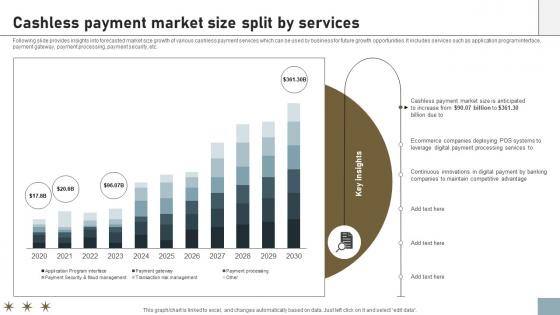
Online Payment Techniques For Providing Cashless Payment Market Size Split
Following slide provides insights into forecasted market size growth of various cashless payment services which can be used by business for future growth opportunities. It includes services such as application program interface, payment gateway, payment processing, payment security, etc. Take your projects to the next level with our ultimate collection of Online Payment Techniques For Providing Cashless Payment Market Size Split. Slidegeeks has designed a range of layouts that are perfect for representing task or activity duration, keeping track of all your deadlines at a glance. Tailor these designs to your exact needs and give them a truly corporate look with your own brand colors they will make your projects stand out from the rest Following slide provides insights into forecasted market size growth of various cashless payment services which can be used by business for future growth opportunities. It includes services such as application program interface, payment gateway, payment processing, payment security, etc.
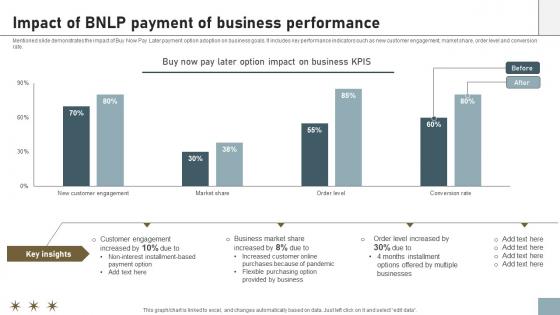
Online Payment Techniques Impact Of BNLP Payment Of Business Performance
Mentioned slide demonstrates the impact of Buy Now Pay Later payment option adoption on business goals. It includes key performance indicators such as new customer engagement, market share, order level and conversion rate. There are so many reasons you need a Online Payment Techniques Impact Of BNLP Payment Of Business Performance. The first reason is you can not spend time making everything from scratch, Thus, Slidegeeks has made presentation templates for you too. You can easily download these templates from our website easily. Mentioned slide demonstrates the impact of Buy Now Pay Later payment option adoption on business goals. It includes key performance indicators such as new customer engagement, market share, order level and conversion rate.
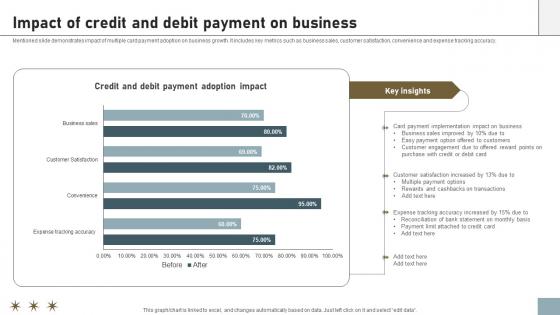
Online Payment Techniques Impact Of Credit And Debit Payment On Business
Mentioned slide demonstrates impact of multiple card payment adoption on business growth. It includes key metrics such as business sales, customer satisfaction, convenience and expense tracking accuracy. Get a simple yet stunning designed Online Payment Techniques Impact Of Credit And Debit Payment On Business. It is the best one to establish the tone in your meetings. It is an excellent way to make your presentations highly effective. So, download this PPT today from Slidegeeks and see the positive impacts. Our easy-to-edit Online Payment Techniques Impact Of Credit And Debit Payment On Business can be your go-to option for all upcoming conferences and meetings. So, what are you waiting for Grab this template today. Mentioned slide demonstrates impact of multiple card payment adoption on business growth. It includes key metrics such as business sales, customer satisfaction, convenience and expense tracking accuracy.
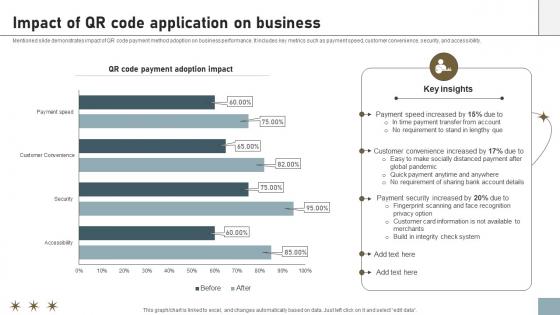
Online Payment Techniques Impact Of QR Code Application On Business
Mentioned slide demonstrates impact of QR code payment method adoption on business performance. It includes key metrics such as payment speed, customer convenience, security, and accessibility. Present like a pro with Online Payment Techniques Impact Of QR Code Application On Business. Create beautiful presentations together with your team, using our easy-to-use presentation slides. Share your ideas in real-time and make changes on the fly by downloading our templates. So whether you are in the office, on the go, or in a remote location, you can stay in sync with your team and present your ideas with confidence. With Slidegeeks presentation got a whole lot easier. Grab these presentations today. Mentioned slide demonstrates impact of QR code payment method adoption on business performance. It includes key metrics such as payment speed, customer convenience, security, and accessibility.
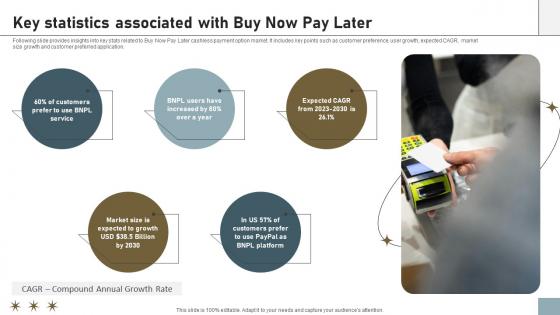
Online Payment Techniques Key Statistics Associated With Buy Now Pay Later
Following slide provides insights into key stats related to Buy Now Pay Later cashless payment option market. It includes key points such as customer preference, user growth, expected CAGR, market size growth and customer preferred application. Slidegeeks is here to make your presentations a breeze with Online Payment Techniques Key Statistics Associated With Buy Now Pay Later With our easy-to-use and customizable templates, you can focus on delivering your ideas rather than worrying about formatting. With a variety of designs to choose from, you are sure to find one that suits your needs. And with animations and unique photos, illustrations, and fonts, you can make your presentation pop. So whether you are giving a sales pitch or presenting to the board, make sure to check out Slidegeeks first Following slide provides insights into key stats related to Buy Now Pay Later cashless payment option market. It includes key points such as customer preference, user growth, expected CAGR, market size growth and customer preferred application.
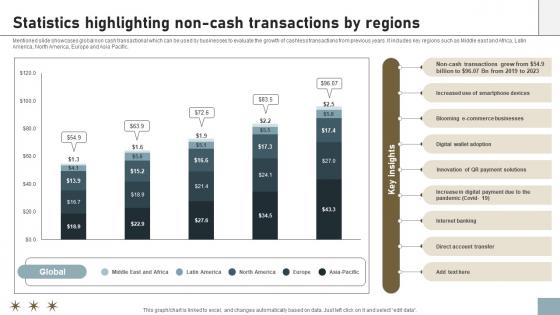
Online Payment Techniques Statistics Highlighting Non Cash Transactions By Regions
Mentioned slide showcases global non cash transactional which can be used by businesses to evaluate the growth of cashless transactions from previous years. It includes key regions such as Middle east and Africa, Latin America, North America, Europe and Asia Pacific. This modern and well-arranged Online Payment Techniques Statistics Highlighting Non Cash Transactions By Regions provides lots of creative possibilities. It is very simple to customize and edit with the Powerpoint Software. Just drag and drop your pictures into the shapes. All facets of this template can be edited with Powerpoint, no extra software is necessary. Add your own material, put your images in the places assigned for them, adjust the colors, and then you can show your slides to the world, with an animated slide included. Mentioned slide showcases global non cash transactional which can be used by businesses to evaluate the growth of cashless transactions from previous years. It includes key regions such as Middle east and Africa, Latin America, North America, Europe and Asia Pacific.
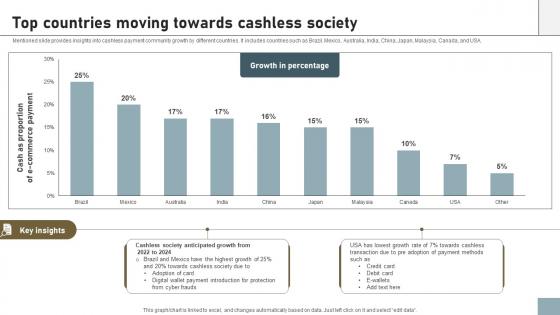
Online Payment Techniques Top Countries Moving Towards Cashless Society
Mentioned slide provides insights into cashless payment community growth by different countries. It includes countries such as Brazil, Mexico, Australia, India, China, Japan, Malaysia, Canada, and USA. Welcome to our selection of the Online Payment Techniques Top Countries Moving Towards Cashless Society. These are designed to help you showcase your creativity and bring your sphere to life. Planning and Innovation are essential for any business that is just starting out. This collection contains the designs that you need for your everyday presentations. All of our PowerPoints are 100Percent editable, so you can customize them to suit your needs. This multi-purpose template can be used in various situations. Grab these presentation templates today. Mentioned slide provides insights into cashless payment community growth by different countries. It includes countries such as Brazil, Mexico, Australia, India, China, Japan, Malaysia, Canada, and USA.

K166 Statistics Highlighting Positive Impact Of Glass Packaging Material Comprehensive Guide On Current
The slide showcases properties of glass packaging material that assist in preserving food quality and temperature in containers. The points are mechanical, thermal, optical properties. Do you have to make sure that everyone on your team knows about any specific topic I yes, then you should give K166 Statistics Highlighting Positive Impact Of Glass Packaging Material Comprehensive Guide On Current a try. Our experts have put a lot of knowledge and effort into creating this impeccable Statistics Highlighting Positive Impact Of Glass Packaging Material Comprehensive Guide On Current. You can use this template for your upcoming presentations, as the slides are perfect to represent even the tiniest detail. You can download these templates from the Slidegeeks website and these are easy to edit. So grab these today The slide showcases properties of glass packaging material that assist in preserving food quality and temperature in containers. The points are mechanical, thermal, optical properties.
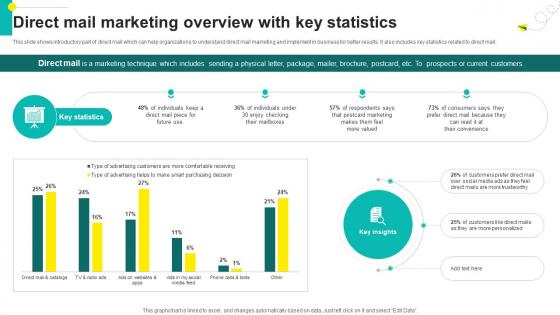
One On One Advertising Direct Mail Marketing Overview With Key Statistics Strategy SS V
This slide shows introductory part of direct mail which can help organizations to understand direct mail marketing and implement in business for better results. It also includes key statistics related to direct mail. Find highly impressive One On One Advertising Direct Mail Marketing Overview With Key Statistics Strategy SS V on Slidegeeks to deliver a meaningful presentation. You can save an ample amount of time using these presentation templates. No need to worry to prepare everything from scratch because Slidegeeks experts have already done a huge research and work for you. You need to download One On One Advertising Direct Mail Marketing Overview With Key Statistics Strategy SS V for your upcoming presentation. All the presentation templates are 100 percent editable and you can change the color and personalize the content accordingly. Download now This slide shows introductory part of direct mail which can help organizations to understand direct mail marketing and implement in business for better results. It also includes key statistics related to direct mail.
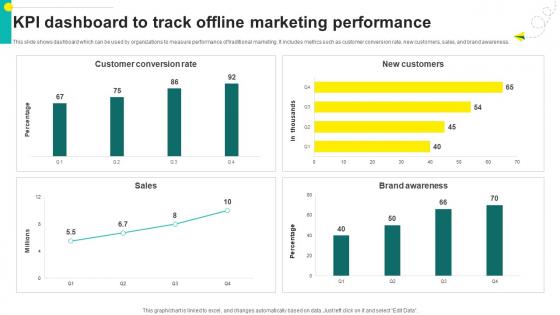
One On One Advertising Kpi Dashboard To Track Offline Marketing Performance Strategy SS V
This slide shows dashboard which can be used by organizations to measure performance of traditional marketing. It includes metrics such as customer conversion rate, new customers, sales, and brand awareness. Welcome to our selection of the One On One Advertising Kpi Dashboard To Track Offline Marketing Performance Strategy SS V. These are designed to help you showcase your creativity and bring your sphere to life. Planning and Innovation are essential for any business that is just starting out. This collection contains the designs that you need for your everyday presentations. All of our PowerPoints are 100Percent editable, so you can customize them to suit your needs. This multi-purpose template can be used in various situations. Grab these presentation templates today. This slide shows dashboard which can be used by organizations to measure performance of traditional marketing. It includes metrics such as customer conversion rate, new customers, sales, and brand awareness.

Financial Projection Global Hotel Chain Business Model BMC SS V
This slide showcases estimated sales of business and growth in earnings. It also showcases annual growth rates for both. There are so many reasons you need a Financial Projection Global Hotel Chain Business Model BMC SS V. The first reason is you can not spend time making everything from scratch, Thus, Slidegeeks has made presentation templates for you too. You can easily download these templates from our website easily. This slide showcases estimated sales of business and growth in earnings. It also showcases annual growth rates for both.

Revenue Model Global Hotel Chain Business Model BMC SS V
This slide showcases sources of revenue such as base management fees, franchise fees, incentive management fees, owned, leased and other revenue, etc. Find highly impressive Revenue Model Global Hotel Chain Business Model BMC SS V on Slidegeeks to deliver a meaningful presentation. You can save an ample amount of time using these presentation templates. No need to worry to prepare everything from scratch because Slidegeeks experts have already done a huge research and work for you. You need to download Revenue Model Global Hotel Chain Business Model BMC SS V for your upcoming presentation. All the presentation templates are 100 percent editable and you can change the color and personalize the content accordingly. Download now This slide showcases sources of revenue such as base management fees, franchise fees, incentive management fees, owned, leased and other revenue, etc.

 Home
Home