Finance Icons

Lego Bar Graph Business PowerPoint Templates And PowerPoint Themes 0312
Microsoft Powerpoint Templates and Background with diagram Our Lego Bar Graph Business PowerPoint Templates And PowerPoint Themes 0312 are designed to facilitate. They are conceived to make things easier for you.

Lego Bar Graph Success PowerPoint Templates And PowerPoint Themes 0312
Microsoft Powerpoint Templates and Background with diagram Aim for the skies with our Lego Bar Graph Success PowerPoint Templates And PowerPoint Themes 0312. You will come out on top.
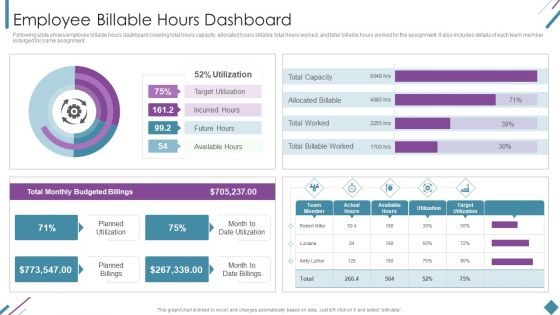
Metrics To Measure Business Performance Employee Billable Hours Dashboard Diagrams PDF
Following slide shows employee billable hours dashboard covering total hours capacity, allocated hours billable, total hours worked, and total billable hours worked for the assignment. It also includes details of each team member indulged for same assignment. Deliver an awe inspiring pitch with this creative Metrics To Measure Business Performance Employee Billable Hours Dashboard Diagrams PDF bundle. Topics like Total Monthly, Budgeted Billings, Planned Utilization can be discussed with this completely editable template. It is available for immediate download depending on the needs and requirements of the user.
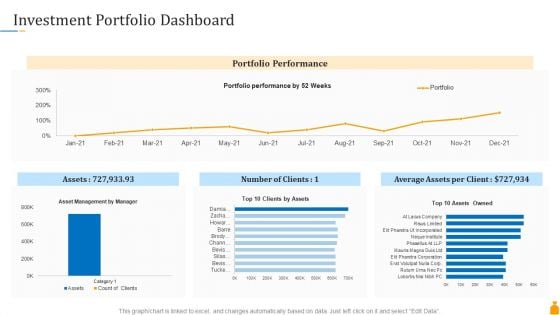
Financial Banking PPT Investment Portfolio Dashboard Ppt Slides Design Inspiration PDF
Deliver an awe-inspiring pitch with this creative financial banking ppt investment portfolio dashboard ppt slides design inspiration pdf bundle. Topics like investment portfolio dashboard can be discussed with this completely editable template. It is available for immediate download depending on the needs and requirements of the user.
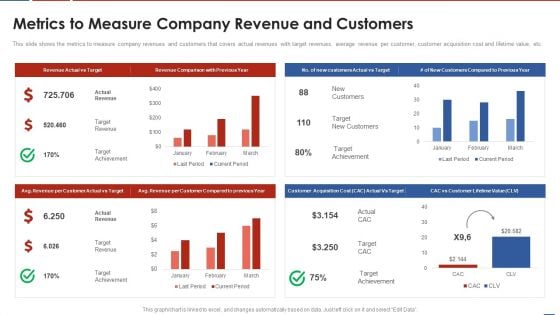
Formulating Product Development Action Plan To Enhance Client Experience Metrics To Measure Company Diagrams PDF
This slide shows the metrics to measure company revenues and customers that covers actual revenues with target revenues, average revenue per customer, customer acquisition cost and lifetime value, etc. Deliver and pitch your topic in the best possible manner with this formulating product development action plan to enhance client experience metrics to measure company diagrams pdf. Use them to share invaluable insights on target revenues, average revenue per customer, customer acquisition cost, lifetime value and impress your audience. This template can be altered and modified as per your expectations. So, grab it now.
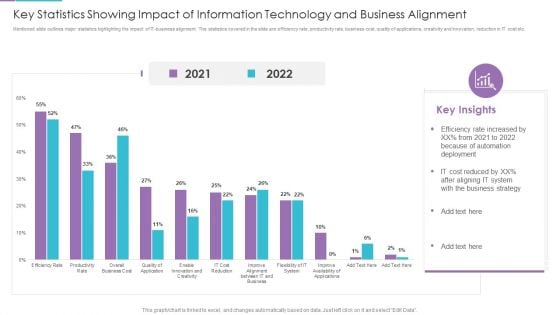
Key Statistics Showing Impact Of Information Technology And Business Alignment Diagrams PDF
Mentioned slide outlines major statistics highlighting the impact of IT business alignment. The statistics covered in the slide are efficiency rate, productivity rate, business cost, quality of applications, creativity and innovation, reduction in IT cost etc. Showcasing this set of slides titled key statistics showing impact of information technology and business alignment diagrams pdf. The topics addressed in these templates are reduced, system, business strategy. All the content presented in this PPT design is completely editable. Download it and make adjustments in color, background, font etc. as per your unique business setting.
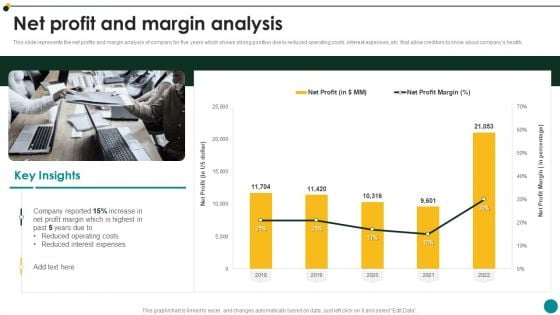
IT Services And Consulting Company Profile Net Profit And Margin Analysis Diagrams PDF
This slide represents the net profits and margin analysis of company for five years which shows strong position due to reduced operating costs, interest expenses, etc. that allow creditors to know about companys health.Deliver an awe inspiring pitch with this creative IT Services And Consulting Company Profile Net Profit And Margin Analysis Diagrams PDF bundle. Topics like Reduced Expenses, Reduced Operating Costs, Profit Highest can be discussed with this completely editable template. It is available for immediate download depending on the needs and requirements of the user.
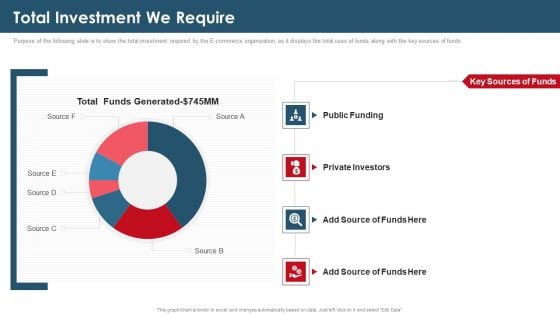
Investor Capital Raising Elevator Total Investment We Require Professional PDF
Purpose of the following slide is to show the total investment required by the E-commerce organization as it displays the total uses of funds along with the key sources of funds. Deliver and pitch your topic in the best possible manner with this investor capital raising elevator total investment we require professional pdf. Use them to share invaluable insights on public funding, private investors, key sources funds and impress your audience. This template can be altered and modified as per your expectations. So, grab it now.
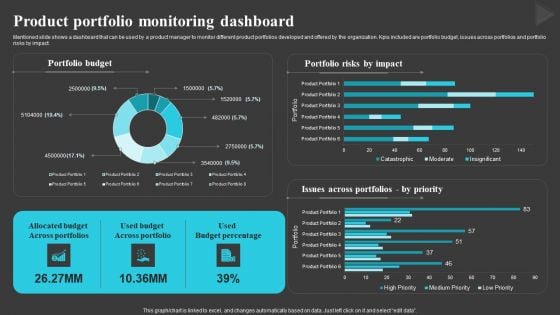
Product Portfolio Monitoring Dashboard Creating And Offering Multiple Product Ranges In New Business Diagrams PDF
Mentioned slide shows a dashboard that can be used by a product manager to monitor different product portfolios developed and offered by the organization. Kpis included are portfolio budget, issues across portfolios and portfolio risks by impact.Crafting an eye-catching presentation has never been more straightforward. Let your presentation shine with this tasteful yet straightforward Product Portfolio Monitoring Dashboard Creating And Offering Multiple Product Ranges In New Business Diagrams PDF template. It offers a minimalistic and classy look that is great for making a statement. The colors have been employed intelligently to add a bit of playfulness while still remaining professional. Construct the ideal Product Portfolio Monitoring Dashboard Creating And Offering Multiple Product Ranges In New Business Diagrams PDF that effortlessly grabs the attention of your audience Begin now and be certain to wow your customers.
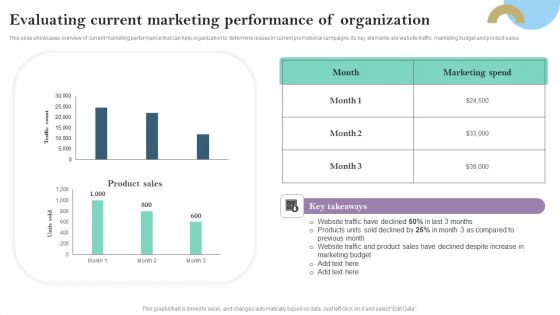
Evaluating Current Marketing Performance Of Organization Ppt PowerPoint Presentation Diagram Templates PDF
This slide showcases overview of current marketing performance that can help organization to determine issues in current promotional campaigns. Its key elements are website traffic, marketing budget and product sales Explore a selection of the finest Evaluating Current Marketing Performance Of Organization Ppt PowerPoint Presentation Diagram Templates PDF here. With a plethora of professionally designed and pre made slide templates, you can quickly and easily find the right one for your upcoming presentation. You can use our Evaluating Current Marketing Performance Of Organization Ppt PowerPoint Presentation Diagram Templates PDF to effectively convey your message to a wider audience. Slidegeeks has done a lot of research before preparing these presentation templates. The content can be personalized and the slides are highly editable. Grab templates today from Slidegeeks.

Tour Agency Business Profile Operating Profit 2018 To 2022 Diagrams PDF
This slide covers the operating profit of travel agency for last five years from 2018 to 2022 which shows increase in operating profits year after year due to more efficient use of resources.Deliver an awe inspiring pitch with this creative Tour Agency Business Profile Operating Profit 2018 To 2022 Diagrams PDF bundle. Topics like Operating Profit, Primary Reason, Improved Operating can be discussed with this completely editable template. It is available for immediate download depending on the needs and requirements of the user.
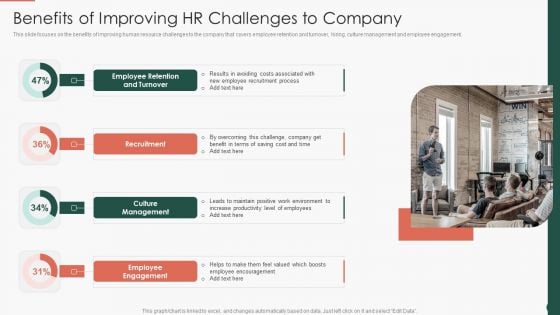
Developing HR Process Flow Benefits Of Improving HR Challenges To Company Diagrams PDF
This slide focuses on the benefits of improving human resource challenges to the company that covers employee retention and turnover, hiring, culture management and employee engagement.Deliver an awe inspiring pitch with this creative Developing HR Process Flow Benefits Of Improving HR Challenges To Company Diagrams PDF bundle. Topics like Recruitment Culture, Management Employee, Engagement can be discussed with this completely editable template. It is available for immediate download depending on the needs and requirements of the user.

Security Control Techniques For Real Estate Project Dashboard To Monitor Construction Site Injuries Diagrams PDF
The best PPT templates are a great way to save time, energy, and resources. Slidegeeks have 100 percent editable powerpoint slides making them incredibly versatile. With these quality presentation templates, you can create a captivating and memorable presentation by combining visually appealing slides and effectively communicating your message. Download Security Control Techniques For Real Estate Project Dashboard To Monitor Construction Site Injuries Diagrams PDF from Slidegeeks and deliver a wonderful presentation.
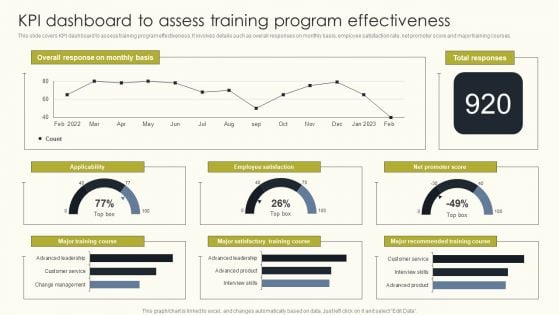
Employee Performance Management To Enhance Organizational Growth KPI Dashboard To Assess Training Diagrams PDF
The best PPT templates are a great way to save time, energy, and resources. Slidegeeks have 100 percent editable powerpoint slides making them incredibly versatile. With these quality presentation templates, you can create a captivating and memorable presentation by combining visually appealing slides and effectively communicating your message. Download Employee Performance Management To Enhance Organizational Growth KPI Dashboard To Assess Training Diagrams PDF from Slidegeeks and deliver a wonderful presentation.
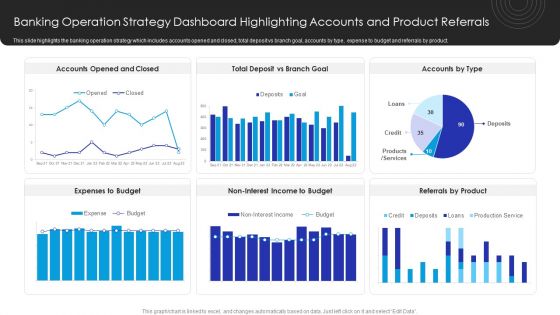
Operational Innovation In Banking Banking Operation Strategy Dashboard Highlighting Inspiration PDF
This slide highlights the banking operation strategy which includes accounts opened and closed, total deposit vs branch goal, accounts by type, expense to budget and referrals by product. Create an editable Operational Innovation In Banking Banking Operation Strategy Dashboard Highlighting Inspiration PDF that communicates your idea and engages your audience. Whether youre presenting a business or an educational presentation, pre-designed presentation templates help save time. Operational Innovation In Banking Banking Operation Strategy Dashboard Highlighting Inspiration PDF is highly customizable and very easy to edit, covering many different styles from creative to business presentations. Slidegeeks has creative team members who have crafted amazing templates. So, go and get them without any delay.
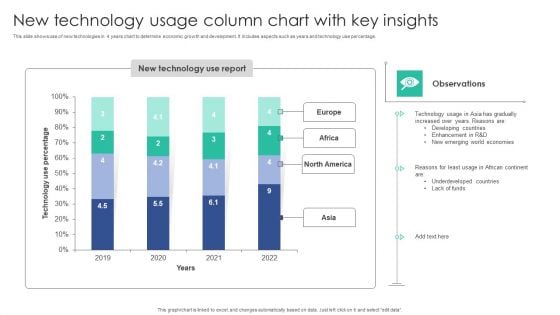
New Technology Usage Column Chart With Key Insights Brochure PDF
This slide shows use of new technologies in 4 years chart to determine economic growth and development. It Includes aspects such as years and technology use percentage.Pitch your topic with ease and precision using this New Technology Usage Column Chart With Key Insights Brochure PDF. This layout presents information on Technology Gradually, Increased Reasons, Developing Countries. It is also available for immediate download and adjustment. So, changes can be made in the color, design, graphics or any other component to create a unique layout.
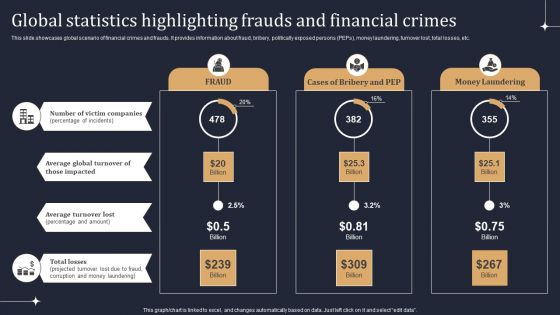
KYC Transaction Monitoring System Business Security Global Statistics Highlighting Frauds Diagrams PDF
This slide showcases global scenario of financial crimes and frauds. It provides information about fraud, bribery, politically exposed persons PEPs, money laundering, turnover lost, total losses, etc. Take your projects to the next level with our ultimate collection of KYC Transaction Monitoring System Business Security Global Statistics Highlighting Frauds Diagrams PDF. Slidegeeks has designed a range of layouts that are perfect for representing task or activity duration, keeping track of all your deadlines at a glance. Tailor these designs to your exact needs and give them a truly corporate look with your own brand colors they will make your projects stand out from the rest.

Techniques For Enhancing Buyer Acquisition Impact Analysis Of Increasing Acquired Customers Diagrams PDF
This slide covers the effect of improving consumers on CAC Client Acquisition Cost. It includes details such as the number of customers acquired and cost of acquisition on a monthly basis.Here you can discover an assortment of the finest PowerPoint and Google Slides templates. With these templates, you can create presentations for a variety of purposes while simultaneously providing your audience with an eye-catching visual experience. Download Techniques For Enhancing Buyer Acquisition Impact Analysis Of Increasing Acquired Customers Diagrams PDF to deliver an impeccable presentation. These templates will make your job of preparing presentations much quicker, yet still, maintain a high level of quality. Slidegeeks has experienced researchers who prepare these templates and write high-quality content for you. Later on, you can personalize the content by editing the Techniques For Enhancing Buyer Acquisition Impact Analysis Of Increasing Acquired Customers Diagrams PDF.
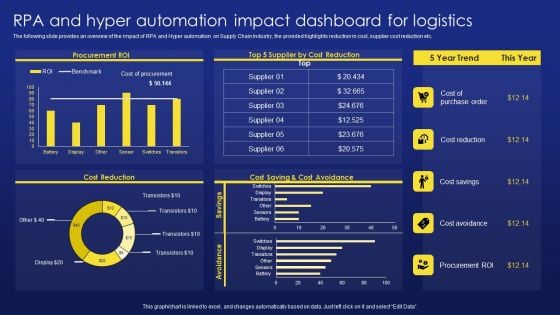
Deployment Procedure Of Hyper Automation RPA And Hyper Automation Impact Dashboard For Logistics Diagrams PDF
The following slide provides an overview of the impact of RPA and Hyper automation on Supply Chain Industry, the provided highlights reduction in cost, supplier cost reduction etc. Do you have to make sure that everyone on your team knows about any specific topic I yes, then you should give Deployment Procedure Of Hyper Automation RPA And Hyper Automation Impact Dashboard For Logistics Diagrams PDF a try. Our experts have put a lot of knowledge and effort into creating this impeccable Deployment Procedure Of Hyper Automation RPA And Hyper Automation Impact Dashboard For Logistics Diagrams PDF. You can use this template for your upcoming presentations, as the slides are perfect to represent even the tiniest detail. You can download these templates from the Slidegeeks website and these are easy to edit. So grab these today.
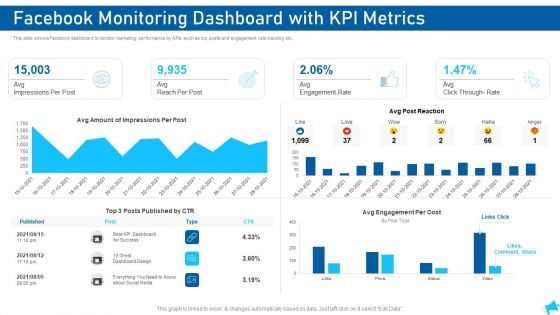
Social Media Marketing Facebook Monitoring Dashboard With KPI Metrics Diagrams PDF
This slide shows Facebook dashboard to monitor marketing performance by KPIs such as top posts and engagement rate tracking etc. Deliver an awe inspiring pitch with this creative social media marketing facebook monitoring dashboard with kpi metrics diagrams pdf bundle. Topics like design, cost, social media, dashboard can be discussed with this completely editable template. It is available for immediate download depending on the needs and requirements of the user.
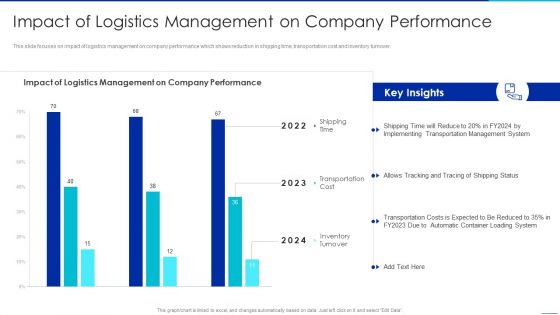
Optimizing Logistics Management Process Impact Of Logistics Management On Company Diagrams PDF
This slide focuses on impact of logistics management on company performance which shows reduction in shipping time, transportation cost and inventory turnover. Deliver an awe inspiring pitch with this creative optimizing logistics management process impact of logistics management on company diagrams pdf bundle. Topics like logistics management on company performance can be discussed with this completely editable template. It is available for immediate download depending on the needs and requirements of the user.
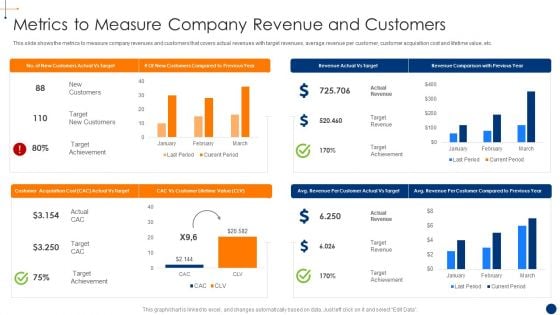
New Product Development Process Optimization Metrics To Measure Company Diagrams PDF
This slide shows the metrics to measure company revenues and customers that covers actual revenues with target revenues, average revenue per customer, customer acquisition cost and lifetime value, etc. Deliver an awe inspiring pitch with this creative new product development process optimization metrics to measure company diagrams pdf bundle. Topics like metrics to measure company revenue and customers can be discussed with this completely editable template. It is available for immediate download depending on the needs and requirements of the user.
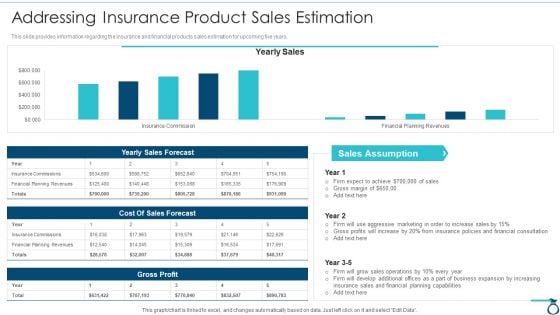
Financial Services Advisory Business Plan Addressing Insurance Product Sales Estimation Diagrams PDF
This slide provides information regarding the insurance and financial products sales estimation for upcoming five years. Deliver an awe inspiring pitch with this creative Financial Services Advisory Business Plan Addressing Insurance Product Sales Estimation Diagrams PDF bundle. Topics like Gross Profit, Cost Of Sales, Sales Assumption, Aggressive Marketing, Increasing Insurance can be discussed with this completely editable template. It is available for immediate download depending on the needs and requirements of the user.
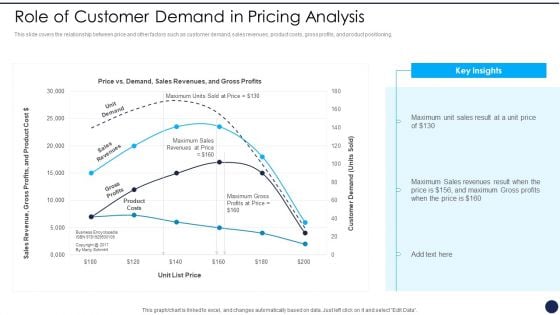
Product Pricing Strategies Analysis Role Of Customer Demand In Pricing Analysis Diagrams PDF
This slide covers the relationship between price and other factors such as customer demand, sales revenues, product costs, gross profits, and product positioning. Deliver an awe inspiring pitch with this creative Product Pricing Strategies Analysis Role Of Customer Demand In Pricing Analysis Diagrams PDF bundle. Topics like Maximum Unit Sales, Result Unit Price, Maximum Sales Revenues can be discussed with this completely editable template. It is available for immediate download depending on the needs and requirements of the user.
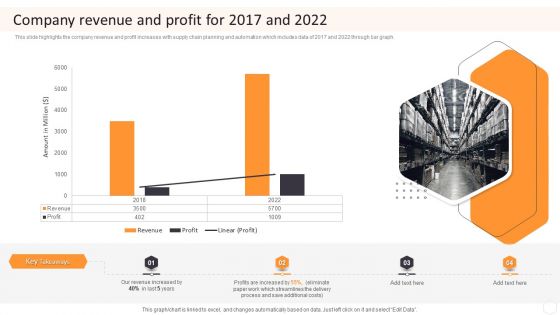
Cargo Logistics Company Profile Company Revenue And Profit For 2017 And 2022 Diagrams PDF
This slide highlights the company revenue and profit increases with supply chain planning and automation which includes data of 2017 and 2022 through bar graph. Deliver an awe inspiring pitch with this creative Cargo Logistics Company Profile Company Revenue And Profit For 2017 And 2022 Diagrams PDF bundle. Topics like Revenue, Profits, Additional Costs can be discussed with this completely editable template. It is available for immediate download depending on the needs and requirements of the user.
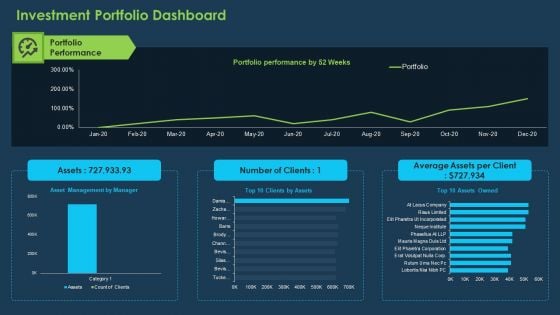
Commercial Banking Template Collection Investment Portfolio Dashboard Ppt Professional Layouts PDF
Deliver and pitch your topic in the best possible manner with this commercial banking template collection investment portfolio dashboard ppt professional layouts pdf. Use them to share invaluable insights on average assets per client, portfolio performance and impress your audience. This template can be altered and modified as per your expectations. So, grab it now.
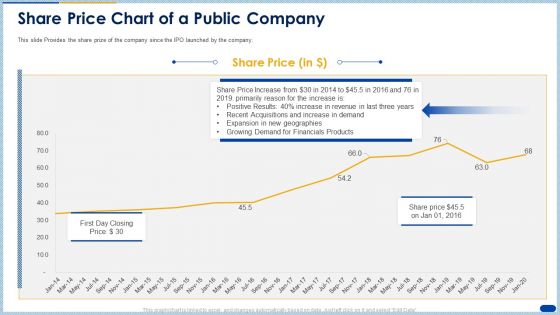
Raising Capital Banking Organizations Post Initial Offering Share Price Chart Of A Public Company Slides PDF
This slide Provides the share prize of the company since the IPO launched by the company. Deliver an awe inspiring pitch with this creative raising capital banking organizations post initial offering share price chart of a public company slides pdf bundle. Topics like growing demand, financials products, revenue can be discussed with this completely editable template. It is available for immediate download depending on the needs and requirements of the user.
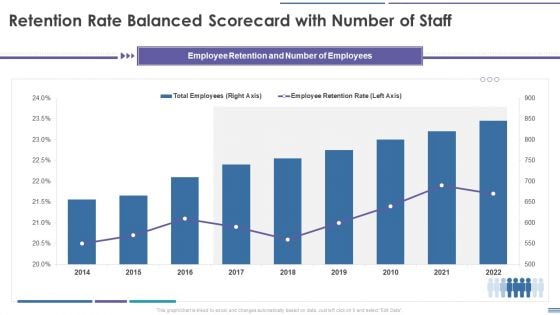
Staff Retention Balanced Scorecard Retention Rate Balanced Scorecard With Number Of Staff Diagrams PDF
This graph or chart is linked to excel, and changes automatically based on data. Just left click on it and select Edit Data. Deliver an awe inspiring pitch with this creative Staff Retention Balanced Scorecard Retention Rate Balanced Scorecard With Number Of Staff Diagrams PDF bundle. Topics like Total Employees, Employee Retention Rate, 2014 To 2022 can be discussed with this completely editable template. It is available for immediate download depending on the needs and requirements of the user.
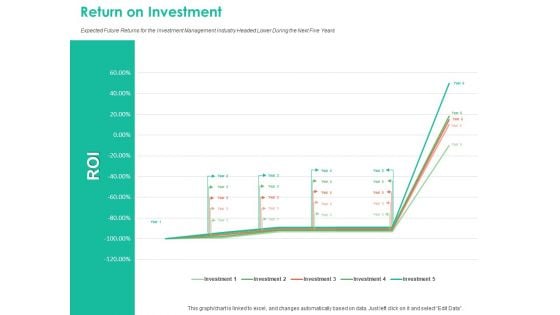
Investment Portfolio Management Return On Investment Ppt Portfolio
Presenting this set of slides with name investment portfolio management return on investment ppt portfolio. The topics discussed in these slide is return on investment. This is a completely editable PowerPoint presentation and is available for immediate download. Download now and impress your audience.
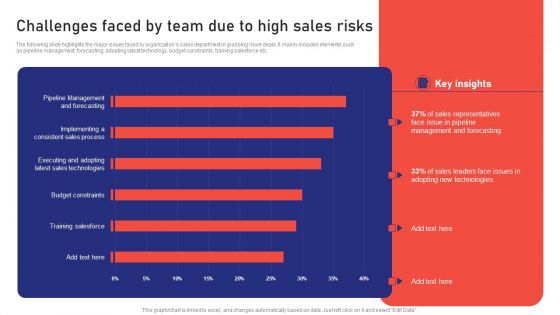
Sales Risk Assessment For Profit Maximization Challenges Faced By Team Due To High Sales Risks Diagrams PDF
The following slide highlights the major issues faced by organizations sales department in grabbing more deals. It mainly includes elements such as pipeline management, forecasting, adopting latest technology, budget constraints, training salesforce etc. Boost your pitch with our creative Sales Risk Assessment For Profit Maximization Challenges Faced By Team Due To High Sales Risks Diagrams PDF. Deliver an awe inspiring pitch that will mesmerize everyone. Using these presentation templates you will surely catch everyones attention. You can browse the ppts collection on our website. We have researchers who are experts at creating the right content for the templates. So you do not have to invest time in any additional work. Just grab the template now and use them.
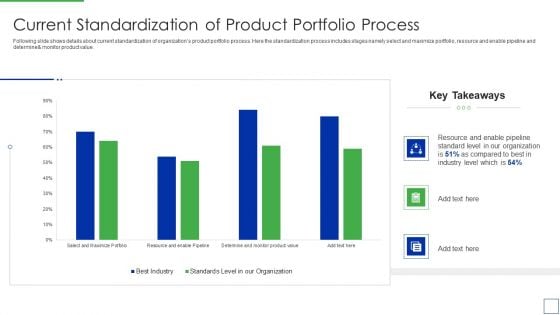
Product Portfolio Management For New Target Region Current Standardization Of Product Diagrams PDF
Following slide shows details about current standardization of organizations product portfolio process. Here the standardization process includes stages namely select and maximize portfolio, resource and enable pipeline and determine monitor product value.Deliver and pitch your topic in the best possible manner with this Product Portfolio Management For New Target Region Current Standardization Of Product Diagrams PDF Use them to share invaluable insights on Current Standardization of Product Portfolio Process and impress your audience. This template can be altered and modified as per your expectations. So, grab it now.
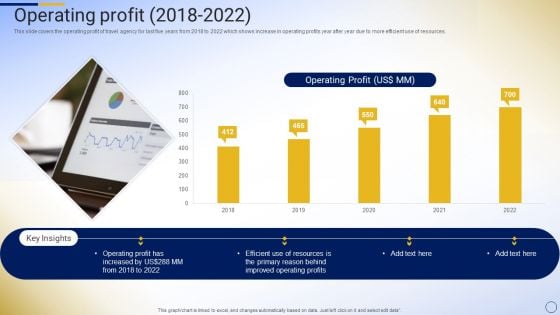
Online Tour And Travel Company Profile Operating Profit 2018 To 2022 Diagrams PDF
This slide covers the operating profit of travel agency for last five years from 2018 to 2022 which shows increase in operating profits year after year due to more efficient use of resources.Deliver and pitch your topic in the best possible manner with this Online Tour And Travel Company Profile Operating Profit 2018 To 2022 Diagrams PDF. Use them to share invaluable insights on Operating Profit, Improved Operating, Primary Reason and impress your audience. This template can be altered and modified as per your expectations. So, grab it now.
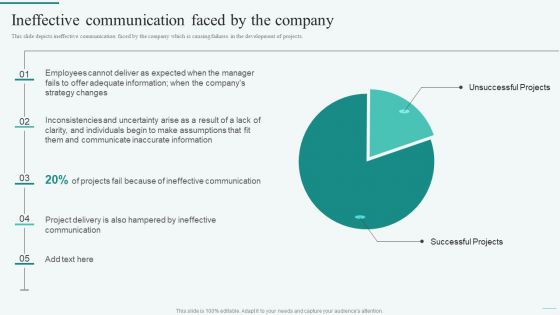
Ineffective Communication Faced By The Company Integration Of Dynamic System Diagrams PDF
This slide depicts ineffective communication faced by the company which is causing failures in the development of projects. The best PPT templates are a great way to save time, energy, and resources. Slidegeeks have 100 precent editable powerpoint slides making them incredibly versatile. With these quality presentation templates, you can create a captivating and memorable presentation by combining visually appealing slides and effectively communicating your message. Download Ineffective Communication Faced By The Company Integration Of Dynamic System Diagrams PDF from Slidegeeks and deliver a wonderful presentation.
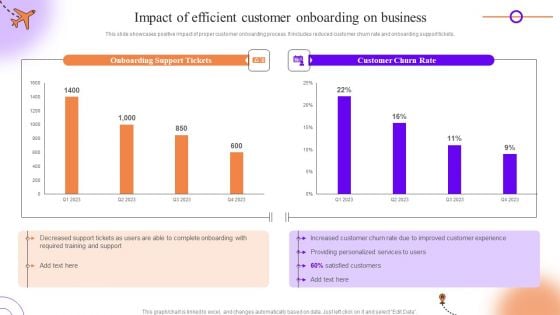
Client Onboarding Journey Impact On Business Impact Of Efficient Customer Onboarding Diagrams PDF
This slide showcases positive impact of proper customer onboarding process. It includes reduced customer churn rate and onboarding support tickets. Slidegeeks is one of the best resources for PowerPoint templates. You can download easily and regulate Client Onboarding Journey Impact On Business Impact Of Efficient Customer Onboarding Diagrams PDF for your personal presentations from our wonderful collection. A few clicks is all it takes to discover and get the most relevant and appropriate templates. Use our Templates to add a unique zing and appeal to your presentation and meetings. All the slides are easy to edit and you can use them even for advertisement purposes.
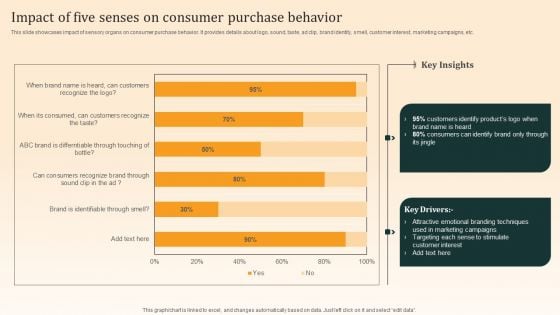
Nike Emotional Branding Strategy Impact Of Five Senses On Consumer Purchase Behavior Diagrams PDF
This slide showcases impact of sensory organs on consumer purchase behavior. It provides details about logo, sound, taste, ad clip, brand identity, smell, customer interest, marketing campaigns, etc. The best PPT templates are a great way to save time, energy, and resources. Slidegeeks have 100 percent editable powerpoint slides making them incredibly versatile. With these quality presentation templates, you can create a captivating and memorable presentation by combining visually appealing slides and effectively communicating your message. Download Nike Emotional Branding Strategy Impact Of Five Senses On Consumer Purchase Behavior Diagrams PDF from Slidegeeks and deliver a wonderful presentation.
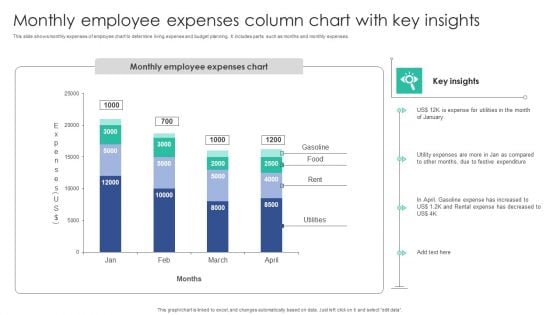
Monthly Employee Expenses Column Chart With Key Insights Download PDF
This slide shows monthly expenses of employee chart to determine living expense and budget planning. It includes parts such as months and monthly expenses.Showcasing this set of slides titled Monthly Employee Expenses Column Chart With Key Insights Download PDF. The topics addressed in these templates are Expense Utilities, Festive Expenditure, Gasoline Expense. All the content presented in this PPT design is completely editable. Download it and make adjustments in color, background, font etc. as per your unique business setting.

Digital Advertisement Spend Trend Chart By Industries Elements PDF
This slide depicts expenditure trends for digital advertising by top industries. It includes retail, automotive, financial services, telecom, consumer products, travel, healthcare, media, entertainment, etc. Showcasing this set of slides titled Digital Advertisement Spend Trend Chart By Industries Elements PDF. The topics addressed in these templates are Retail Sector, Total Budget, Chart By Industries. All the content presented in this PPT design is completely editable. Download it and make adjustments in color, background, font etc. as per your unique business setting.
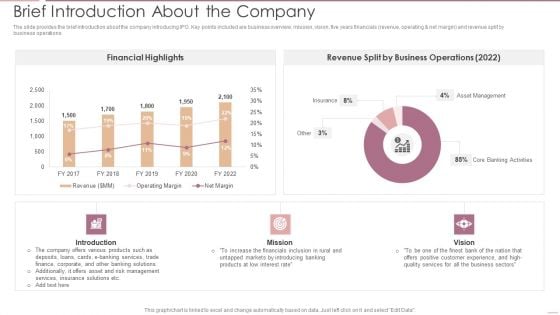
Investment Banking Security Underwriting Pitchbook Brief Introduction About The Company Portrait PDF
The slide provides the brief introduction about the company introducing IPO. Key points included are business overview, mission, vision, five years financials revenue, operating net margin and revenue split by business operations.Deliver and pitch your topic in the best possible manner with this Investment Banking Security Underwriting Pitchbook Brief Introduction About The Company Portrait PDF Use them to share invaluable insights on Financial Highlights, Business Operations, Asset Management and impress your audience. This template can be altered and modified as per your expectations. So, grab it now.
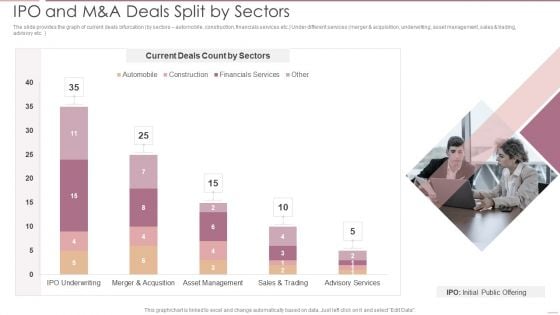
Investment Banking Security Underwriting Pitchbook IPO And M And A Deals Split By Sectors Brochure PDF
The slide provides the graph of current deals bifurcation by sectors automobile, construction, financials services etc.Under different services merger and acquisition, underwriting, asset management, sales trading, advisory etc.Deliver and pitch your topic in the best possible manner with this Investment Banking Security Underwriting Pitchbook IPO And M And A Deals Split By Sectors Brochure PDF Use them to share invaluable insights on Current Deals, Merger And Acquisition, Asset Management and impress your audience. This template can be altered and modified as per your expectations. So, grab it now.
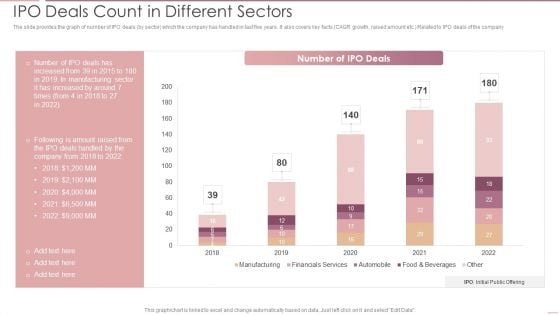
Investment Banking Security Underwriting Pitchbook IPO Deals Count In Different Sectors Mockup PDF
The slide provides the graph of number of IPO deals by sector which the company has handled in last five years. It also covers key facts CAGR growth, raised amount etc. Related to IPO deals of the company.Deliver and pitch your topic in the best possible manner with this Investment Banking Security Underwriting Pitchbook IPO Deals Count In Different Sectors Mockup PDF Use them to share invaluable insights on Manufacturing, Automobile, Financials Services and impress your audience. This template can be altered and modified as per your expectations. So, grab it now.
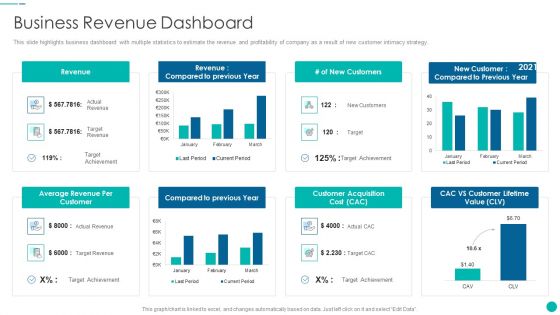
Tactical Procedure For Increasing Customer Intimacy Business Revenue Dashboard Diagrams PDF
This slide highlights business dashboard with multiple statistics to estimate the revenue and profitability of company as a result of new customer intimacy strategy. Deliver an awe inspiring pitch with this creative tactical procedure for increasing customer intimacy business revenue dashboard diagrams pdf bundle. Topics like average revenue per customer, compared to previous year, customer acquisition cost, cac vs customer lifetime value, revenue can be discussed with this completely editable template. It is available for immediate download depending on the needs and requirements of the user.
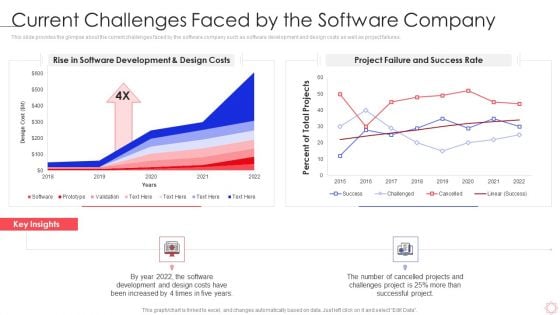
SPI Methodology Current Challenges Faced By The Software Company Ppt PowerPoint Presentation Diagram Templates PDF
This slide provides the glimpse about the current challenges faced by the software company such as software development and design costs as well as project failures. Deliver an awe inspiring pitch with this creative spi methodology current challenges faced by the software company ppt powerpoint presentation diagram templates pdf bundle. Topics like project failure and success rate, rise in software development can be discussed with this completely editable template. It is available for immediate download depending on the needs and requirements of the user.
Retail Trading Platform Dashboard Tracking Essential Kpis For Ecommerce Performance Diagrams PDF
This slide provides information regarding essential KPIs for ecommerce performance dashboard tracking average bounce rate, new vs. old customers, channel revenue vs. channel acquisitions costs, channel revenue vs. sales, average conversion rate, etc. Deliver an awe inspiring pitch with this creative retail trading platform dashboard tracking essential kpis for ecommerce performance diagrams pdf bundle. Topics like average bounce rate, average conversion rate, bounce rate, channel revenue sales can be discussed with this completely editable template. It is available for immediate download depending on the needs and requirements of the user.
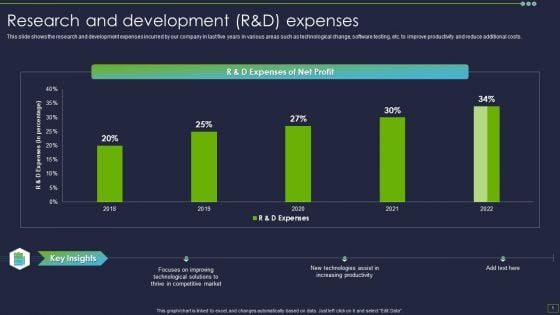
IT Consultancy Services Company Profile Research And Development Randd Expenses Diagrams PDF
This slide shows the research and development expenses incurred by our company in last five years in various areas such as technological change, software testing, etc. to improve productivity and reduce additional costs.Deliver an awe inspiring pitch with this creative IT Consultancy Services Company Profile Research And Development Randd Expenses Diagrams PDF bundle. Topics like Focuses Improving, Technological Solutions, Competitive Market can be discussed with this completely editable template. It is available for immediate download depending on the needs and requirements of the user.
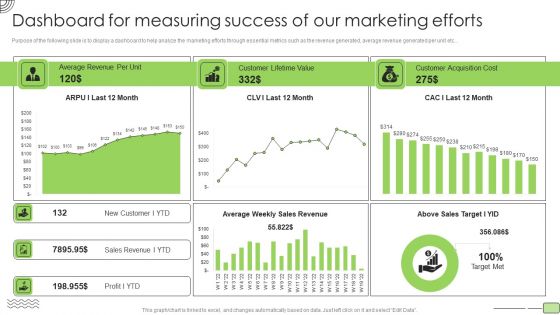
Organic Business Growth Strategies Dashboard For Measuring Success Of Our Marketing Efforts Diagrams PDF
Purpose of the following slide is to display a dashboard to help analyze the marketing efforts through essential metrics such as the revenue generated, average revenue generated per unit etc. Deliver an awe inspiring pitch with this creative Organic Business Growth Strategies Dashboard For Measuring Success Of Our Marketing Efforts Diagrams PDF bundle. Topics like Average Revenue, Customer Lifetime Value, Customer Acquisition Cost can be discussed with this completely editable template. It is available for immediate download depending on the needs and requirements of the user.
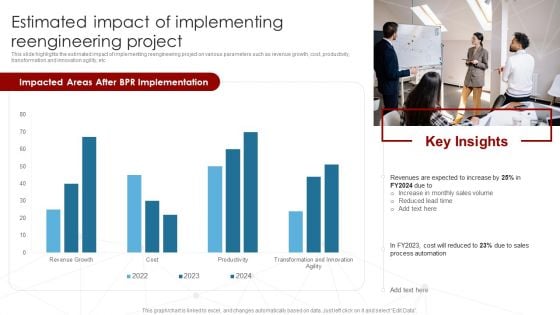
Deployment Of Business Process Estimated Impact Of Implementing Reengineering Diagrams PDF
This slide highlights the estimated impact of implementing reengineering project on various parameters such as revenue growth, cost, productivity, transformation and innovation agility, etc. Present like a pro with Deployment Of Business Process Estimated Impact Of Implementing Reengineering Diagrams PDF Create beautiful presentations together with your team, using our easy-to-use presentation slides. Share your ideas in real-time and make changes on the fly by downloading our templates. So whether youre in the office, on the go, or in a remote location, you can stay in sync with your team and present your ideas with confidence. With Slidegeeks presentation got a whole lot easier. Grab these presentations today.
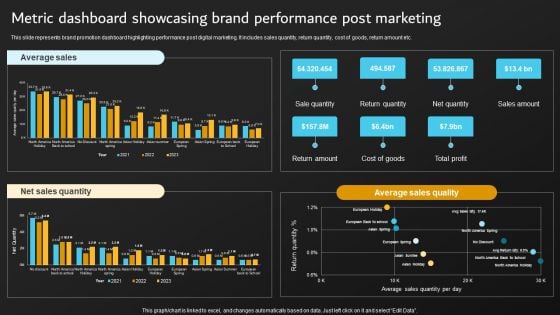
Implementation Of Digital Marketing Metric Dashboard Showcasing Brand Performance Diagrams PDF
This slide represents brand promotion dashboard highlighting performance post digital marketing. It includes sales quantity, return quantity, cost of goods, return amount etc. Slidegeeks has constructed Implementation Of Digital Marketing Metric Dashboard Showcasing Brand Performance Diagrams PDF after conducting extensive research and examination. These presentation templates are constantly being generated and modified based on user preferences and critiques from editors. Here, you will find the most attractive templates for a range of purposes while taking into account ratings and remarks from users regarding the content. This is an excellent jumping-off point to explore our content and will give new users an insight into our top-notch PowerPoint Templates.
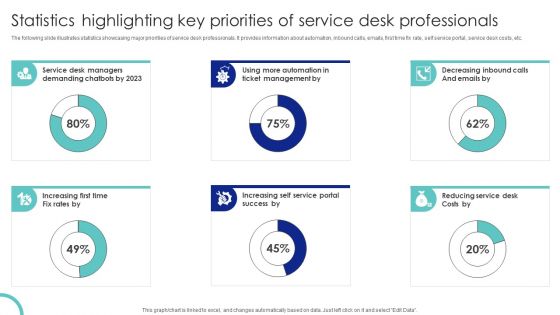
Statistics Highlighting Key Priorities Of Service Desk Professionals Ppt PowerPoint Presentation Diagram PDF
The following slide illustrates statistics showcasing major priorities of service desk professionals. It provides information about automation, inbound calls, emails, first time fix rate, self service portal, service desk costs, etc. If your project calls for a presentation, then Slidegeeks is your go to partner because we have professionally designed, easy to edit templates that are perfect for any presentation. After downloading, you can easily edit Statistics Highlighting Key Priorities Of Service Desk Professionals Ppt PowerPoint Presentation Diagram PDF and make the changes accordingly. You can rearrange slides or fill them with different images. Check out all the handy templates.
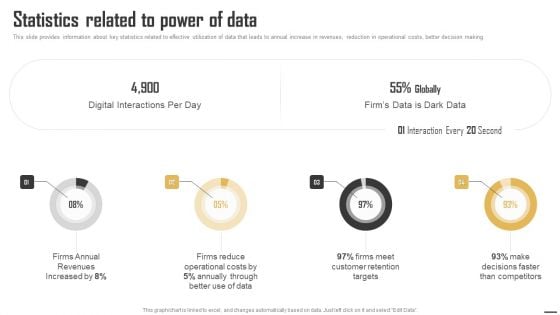
Data Monetization And Management Statistics Related To Power Of Data Diagrams PDF
This slide provides information about key statistics related to effective utilization of data that leads to annual increase in revenues, reduction in operational costs, better decision making. Find a pre-designed and impeccable Data Monetization And Management Statistics Related To Power Of Data Diagrams PDF. The templates can ace your presentation without additional effort. You can download these easy-to-edit presentation templates to make your presentation stand out from others. So, what are you waiting for Download the template from Slidegeeks today and give a unique touch to your presentation.
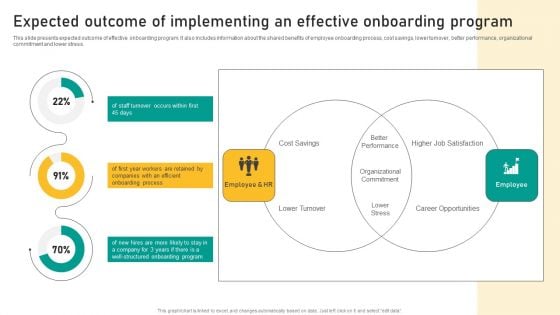
Talent Retention Initiatives For New Hire Onboarding Expected Outcome Of Implementing Diagrams PDF
This slide presents expected outcome of effective onboarding program. It also includes information about the shared benefits of employee onboarding process, cost savings, lower turnover, better performance, organizational commitment and lower stress. Want to ace your presentation in front of a live audience Our Talent Retention Initiatives For New Hire Onboarding Expected Outcome Of Implementing Diagrams PDF can help you do that by engaging all the users towards you. Slidegeeks experts have put their efforts and expertise into creating these impeccable powerpoint presentations so that you can communicate your ideas clearly. Moreover, all the templates are customizable, and easy to edit and downloadable. Use these for both personal and commercial use.
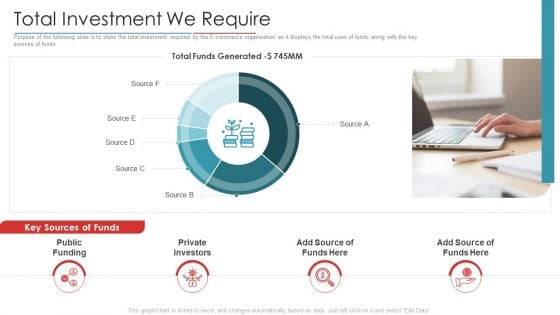
Digital Marketing Business Investor Funding Pitch Deck Total Investment We Require Download PDF
Purpose of the following slide is to show the total investment required by the E-commerce organization as it displays the total uses of funds along with the key sources of funds Deliver an awe inspiring pitch with this creative digital marketing business investor funding pitch deck total investment we require download pdf bundle. Topics like public funding, key sources of funds, private investors can be discussed with this completely editable template. It is available for immediate download depending on the needs and requirements of the user.
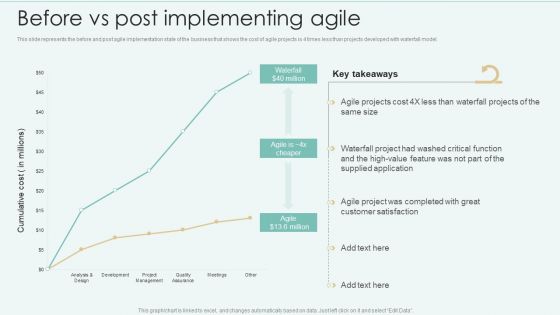
Strategies Of Agile Development To Enhance Processes Before Vs Post Implementing Agile Diagrams PDF
This slide represents the before and post agile implementation state of the business that shows the cost of agile projects is 4 times less than projects developed with waterfall model. Create an editable Strategies Of Agile Development To Enhance Processes Before Vs Post Implementing Agile Diagrams PDF that communicates your idea and engages your audience. Whether you are presenting a business or an educational presentation, pre designed presentation templates help save time. Strategies Of Agile Development To Enhance Processes Before Vs Post Implementing Agile Diagrams PDF is highly customizable and very easy to edit, covering many different styles from creative to business presentations. Slidegeeks has creative team members who have crafted amazing templates. So, go and get them without any delay.
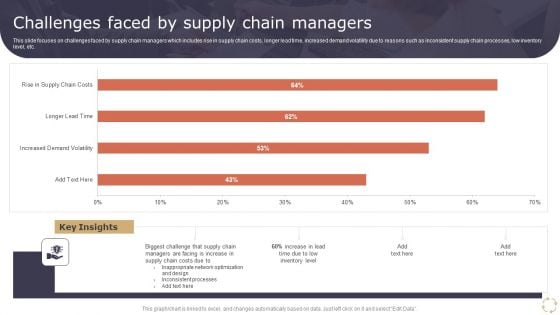
Optimizing Logistics Models To Enhance Supply Chain Management Challenges Faced By Supply Chain Managers Diagrams PDF
This slide focuses on challenges faced by supply chain managers which includes rise in supply chain costs, longer lead time, increased demand volatility due to reasons such as inconsistent supply chain processes, low inventory level, etc. Crafting an eye catching presentation has never been more straightforward. Let your presentation shine with this tasteful yet straightforward Optimizing Logistics Models To Enhance Supply Chain Management Challenges Faced By Supply Chain Managers Diagrams PDF template. It offers a minimalistic and classy look that is great for making a statement. The colors have been employed intelligently to add a bit of playfulness while still remaining professional. Construct the ideal Optimizing Logistics Models To Enhance Supply Chain Management Challenges Faced By Supply Chain Managers Diagrams PDF that effortlessly grabs the attention of your audience Begin now and be certain to wow your customers.
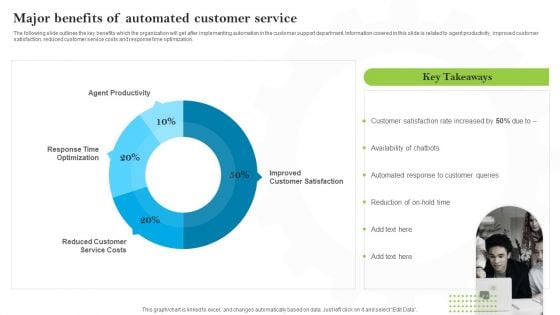
Introducing AI Tools Major Benefits Of Automated Customer Service Diagrams PDF
The following slide outlines the key benefits which the organization will get after implementing automation in the customer support department. Information covered in this slide is related to agent productivity, improved customer satisfaction, reduced customer service costs and response time optimization. Explore a selection of the finest Introducing AI Tools Major Benefits Of Automated Customer Service Diagrams PDF here. With a plethora of professionally designed and pre-made slide templates, you can quickly and easily find the right one for your upcoming presentation. You can use our Introducing AI Tools Major Benefits Of Automated Customer Service Diagrams PDF to effectively convey your message to a wider audience. Slidegeeks has done a lot of research before preparing these presentation templates. The content can be personalized and the slides are highly editable. Grab templates today from Slidegeeks.
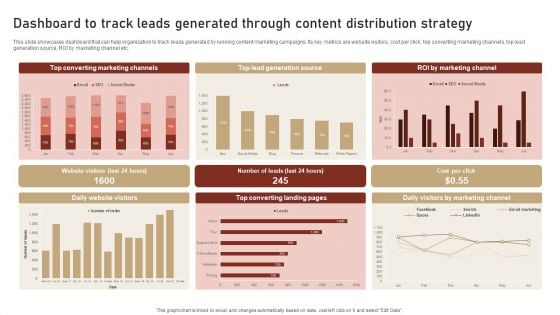
Content Delivery And Promotion Dashboard To Track Leads Generated Through Content Diagrams PDF
This slide showcases dashboard that can help organization to track leads generated by running content marketing campaigns. Its key metrics are website visitors, cost per click, top converting marketing channels, top lead generation source, ROI by marketing channel etc. Do you have an important presentation coming up Are you looking for something that will make your presentation stand out from the rest Look no further than Content Delivery And Promotion Dashboard To Track Leads Generated Through Content Diagrams PDF. With our professional designs, you can trust that your presentation will pop and make delivering it a smooth process. And with Slidegeeks, you can trust that your presentation will be unique and memorable. So why wait Grab Content Delivery And Promotion Dashboard To Track Leads Generated Through Content Diagrams PDF today and make your presentation stand out from the rest.
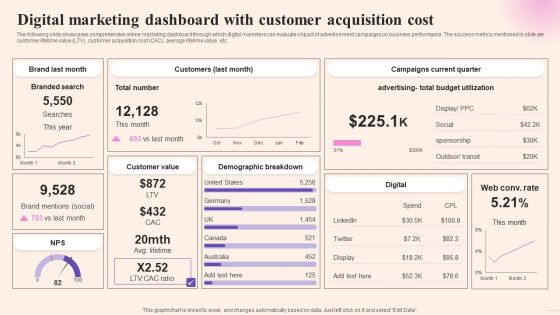
Comprehensive Guide To Build Marketing Digital Marketing Dashboard With Customer Acquisition Diagrams PDF
The following slide showcases comprehensive online marketing dashboard through which digital marketers can evaluate impact of advertisement campaigns on business performance. The success metrics mentioned in slide are customer lifetime value LTV, customer acquisition cost CAC, average lifetime value, etc. Do you have an important presentation coming up Are you looking for something that will make your presentation stand out from the rest Look no further than Comprehensive Guide To Build Marketing Digital Marketing Dashboard With Customer Acquisition Diagrams PDF. With our professional designs, you can trust that your presentation will pop and make delivering it a smooth process. And with Slidegeeks, you can trust that your presentation will be unique and memorable. So why wait Grab Comprehensive Guide To Build Marketing Digital Marketing Dashboard With Customer Acquisition Diagrams PDF today and make your presentation stand out from the rest.
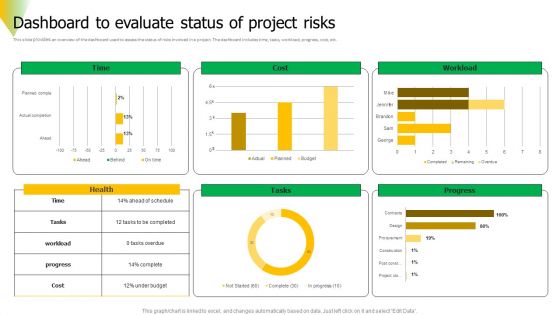
Risk Assessment Dashboard To Evaluate Status Of Project Risks Diagrams PDF
This slide provides an overview of the dashboard used to assess the status of risks involved in a project. The dashboard includes time, tasks, workload, progress, cost, etc. Get a simple yet stunning designed Risk Assessment Dashboard To Evaluate Status Of Project Risks Diagrams PDF. It is the best one to establish the tone in your meetings. It is an excellent way to make your presentations highly effective. So, download this PPT today from Slidegeeks and see the positive impacts. Our easy to edit Risk Assessment Dashboard To Evaluate Status Of Project Risks Diagrams PDF can be your go to option for all upcoming conferences and meetings. So, what are you waiting for Grab this template today.
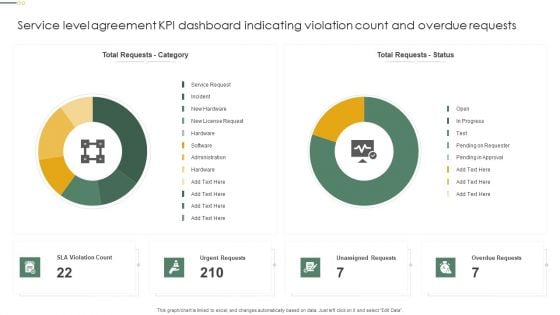
Service Level Agreement KPI Dashboard Indicating Violation Count And Overdue Requests Diagrams PDF
This graph or chart is linked to excel, and changes automatically based on data. Just left click on it and select Edit Data. Showcasing this set of slides titled Service Level Agreement KPI Dashboard Indicating Violation Count And Overdue Requests Diagrams PDF. The topics addressed in these templates are Total Requests Category, Total Requests Status, Urgent Requests. All the content presented in this PPT design is completely editable. Download it and make adjustments in color, background, font etc. as per your unique business setting.
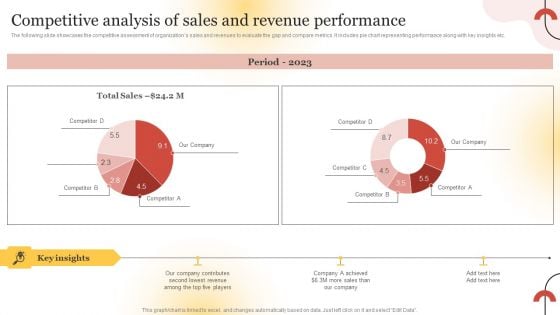
Executing Sales Risk Reduction Plan Competitive Analysis Of Sales And Revenue Performance Diagrams PDF
The following slide showcases the competitive assessment of organizations sales and revenues to evaluate the gap and compare metrics. It includes pie chart representing performance along with key insights etc. Take your projects to the next level with our ultimate collection of Executing Sales Risk Reduction Plan Competitive Analysis Of Sales And Revenue Performance Diagrams PDF. Slidegeeks has designed a range of layouts that are perfect for representing task or activity duration, keeping track of all your deadlines at a glance. Tailor these designs to your exact needs and give them a truly corporate look with your own brand colors they will make your projects stand out from the rest.
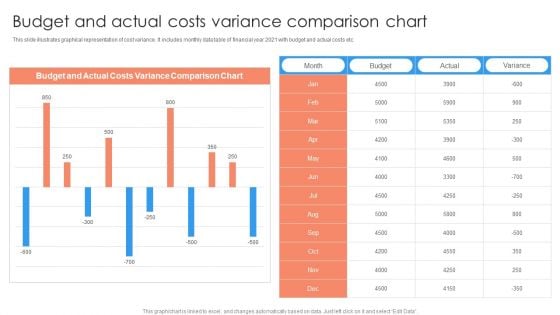
Budget And Actual Costs Variance Comparison Chart Ppt PowerPoint Presentation Show Graphics Example PDF
This slide illustrates graphical representation of cost variance. It includes monthly data table of financial year 2021 with budget and actual costs etc.Showcasing this set of slides titled Budget And Actual Costs Variance Comparison Chart Ppt PowerPoint Presentation Show Graphics Example PDF. The topics addressed in these templates are Budget And Actual, Costs Variance, Comparison Chart. All the content presented in this PPT design is completely editable. Download it and make adjustments in color, background, font etc. as per your unique business setting.

International Business Extension Expectations After Expanding Into Global Markets Diagrams PDF
This slide showcase graph that can help organization to estimate the impact on organizational sales after global expansion. It showcases sales in thousand dollars and forecast for a period of two years. If you are looking for a format to display your unique thoughts, then the professionally designed International Business Extension Expectations After Expanding Into Global Markets Diagrams PDF is the one for you. You can use it as a Google Slides template or a PowerPoint template. Incorporate impressive visuals, symbols, images, and other charts. Modify or reorganize the text boxes as you desire. Experiment with shade schemes and font pairings. Alter, share or cooperate with other people on your work. Download International Business Extension Expectations After Expanding Into Global Markets Diagrams PDF and find out how to give a successful presentation. Present a perfect display to your team and make your presentation unforgettable.
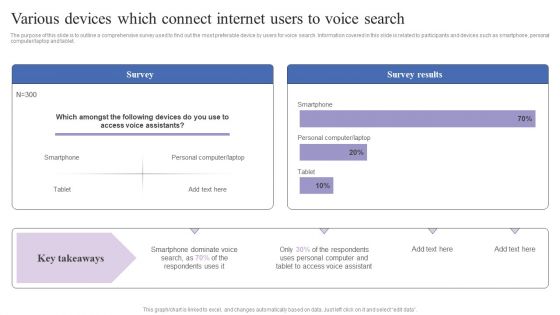
Various Devices Which Connect Internet Users To Voice Search Diagrams PDF
The purpose of this slide is to outline a comprehensive survey used to find out the most preferable device by users for voice search. Information covered in this slide is related to participants and devices such as smartphone, personal computer laptop and tablet. If you are looking for a format to display your unique thoughts, then the professionally designed Various Devices Which Connect Internet Users To Voice Search Diagrams PDF is the one for you. You can use it as a Google Slides template or a PowerPoint template. Incorporate impressive visuals, symbols, images, and other charts. Modify or reorganize the text boxes as you desire. Experiment with shade schemes and font pairings. Alter, share or cooperate with other people on your work. Download Various Devices Which Connect Internet Users To Voice Search Diagrams PDF and find out how to give a successful presentation. Present a perfect display to your team and make your presentation unforgettable.
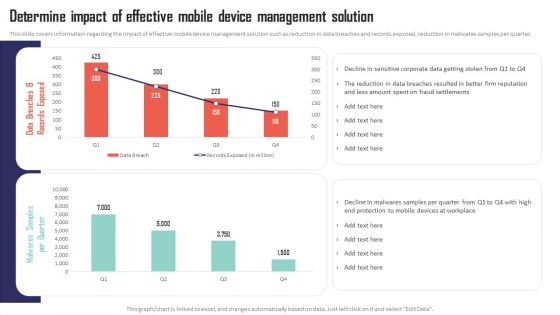
Mobile Device Management Determine Impact Of Effective Mobile Device Management Diagrams PDF
This slide covers information regarding the impact of effective mobile device management solution such as reduction in data breaches and records exposed, reduction in malwares samples per quarter. If you are looking for a format to display your unique thoughts, then the professionally designed Mobile Device Management Determine Impact Of Effective Mobile Device Management Diagrams PDF is the one for you. You can use it as a Google Slides template or a PowerPoint template. Incorporate impressive visuals, symbols, images, and other charts. Modify or reorganize the text boxes as you desire. Experiment with shade schemes and font pairings. Alter, share or cooperate with other people on your work. Download Mobile Device Management Determine Impact Of Effective Mobile Device Management Diagrams PDF and find out how to give a successful presentation. Present a perfect display to your team and make your presentation unforgettable.
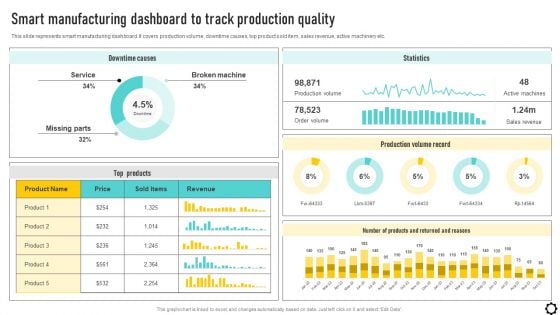
Optimizing Production Process Smart Manufacturing Dashboard To Track Production Diagrams PDF
This slide represents smart manufacturing dashboard. It covers production volume, downtime causes, top product sold item, sales revenue, active machinery etc. If you are looking for a format to display your unique thoughts, then the professionally designed Optimizing Production Process Smart Manufacturing Dashboard To Track Production Diagrams PDF is the one for you. You can use it as a Google Slides template or a PowerPoint template. Incorporate impressive visuals, symbols, images, and other charts. Modify or reorganize the text boxes as you desire. Experiment with shade schemes and font pairings. Alter, share or cooperate with other people on your work. Download Optimizing Production Process Smart Manufacturing Dashboard To Track Production Diagrams PDF and find out how to give a successful presentation. Present a perfect display to your team and make your presentation unforgettable.
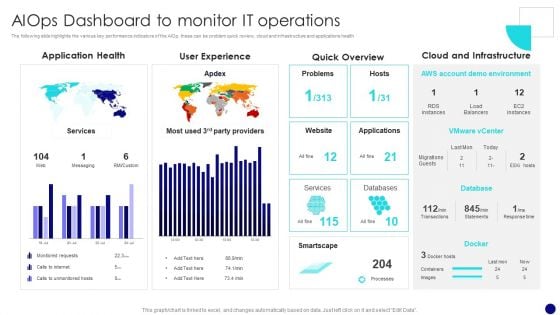
Information Technology Operations Administration With ML Aiops Dashboard To Monitor Diagrams PDF
The following slide highlights the various key performance indicators of the AIOp, these can be problem quick review, cloud and infrastructure and applications health. If you are looking for a format to display your unique thoughts, then the professionally designed Information Technology Operations Administration With ML Aiops Dashboard To Monitor Diagrams PDF is the one for you. You can use it as a Google Slides template or a PowerPoint template. Incorporate impressive visuals, symbols, images, and other charts. Modify or reorganize the text boxes as you desire. Experiment with shade schemes and font pairings. Alter, share or cooperate with other people on your work. Download Information Technology Operations Administration With ML Aiops Dashboard To Monitor Diagrams PDF and find out how to give a successful presentation. Present a perfect display to your team and make your presentation unforgettable.

Operational Strategy For ML In IT Sector Aiops Dashboard To Monitor IT Operations Diagrams PDF
The following slide highlights the various key performance indicators of the AIOps, these can be problem quick review, cloud and infrastructure and applications health If you are looking for a format to display your unique thoughts, then the professionally designed Operational Strategy For ML In IT Sector Aiops Dashboard To Monitor IT Operations Diagrams PDF is the one for you. You can use it as a Google Slides template or a PowerPoint template. Incorporate impressive visuals, symbols, images, and other charts. Modify or reorganize the text boxes as you desire. Experiment with shade schemes and font pairings. Alter, share or cooperate with other people on your work. Download Operational Strategy For ML In IT Sector Aiops Dashboard To Monitor IT Operations Diagrams PDF and find out how to give a successful presentation. Present a perfect display to your team and make your presentation unforgettable.

Mitigating Sales Risks With Strategic Action Planning Assessing Impact Of Sales Risk Management Diagrams PDF
The following slide highlights some key performance indicators KPIs to measure the influence of executing sales risk management strategies on revenue performance. It includes elements such as target attainment rate, gross profit, annual growth rate etc. If you are looking for a format to display your unique thoughts, then the professionally designed Mitigating Sales Risks With Strategic Action Planning Assessing Impact Of Sales Risk Management Diagrams PDF is the one for you. You can use it as a Google Slides template or a PowerPoint template. Incorporate impressive visuals, symbols, images, and other charts. Modify or reorganize the text boxes as you desire. Experiment with shade schemes and font pairings. Alter, share or cooperate with other people on your work. Download Mitigating Sales Risks With Strategic Action Planning Assessing Impact Of Sales Risk Management Diagrams PDF and find out how to give a successful presentation. Present a perfect display to your team and make your presentation unforgettable.
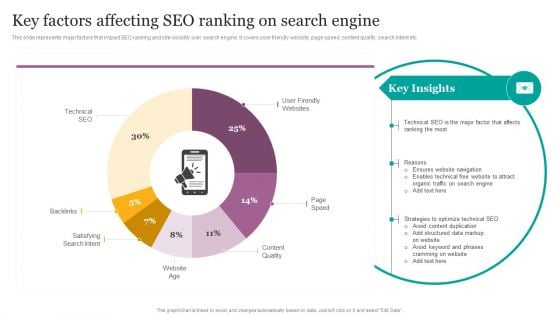
Key Factors Affecting SEO Ranking On Search Engine Ppt Infographics Diagrams PDF
This slide represents major factors that impact SEO ranking and site visibility over search engine. It covers user friendly website, page speed, content quality, search intent etc. If you are looking for a format to display your unique thoughts, then the professionally designed Key Factors Affecting SEO Ranking On Search Engine Ppt Infographics Diagrams PDF is the one for you. You can use it as a Google Slides template or a PowerPoint template. Incorporate impressive visuals, symbols, images, and other charts. Modify or reorganize the text boxes as you desire. Experiment with shade schemes and font pairings. Alter, share or cooperate with other people on your work. Download Key Factors Affecting SEO Ranking On Search Engine Ppt Infographics Diagrams PDF and find out how to give a successful presentation. Present a perfect display to your team and make your presentation unforgettable.
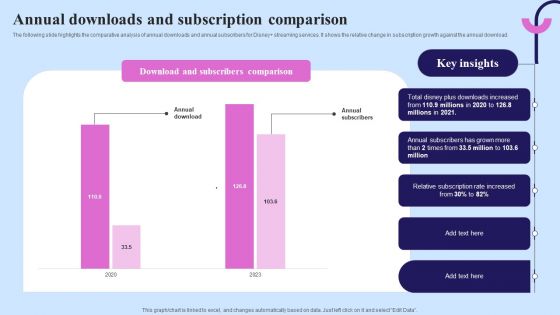
Video Streaming Technology Company Introduction Annual Downloads And Subscription Diagrams PDF
The following slide highlights the comparative analysis of annual downloads and annual subscribers for Disney plus streaming services. It shows the relative change in subscription growth against the annual download. If you are looking for a format to display your unique thoughts, then the professionally designed Video Streaming Technology Company Introduction Annual Downloads And Subscription Diagrams PDF is the one for you. You can use it as a Google Slides template or a PowerPoint template. Incorporate impressive visuals, symbols, images, and other charts. Modify or reorganize the text boxes as you desire. Experiment with shade schemes and font pairings. Alter, share or cooperate with other people on your work. Download Video Streaming Technology Company Introduction Annual Downloads And Subscription Diagrams PDF and find out how to give a successful presentation. Present a perfect display to your team and make your presentation unforgettable.
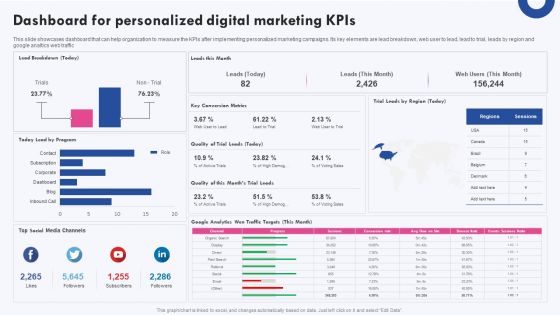
Targeted Marketing Campaigns To Improve Buyers Experience Dashboard For Personalized Digital Marketing Kpis Diagrams PDF
This slide showcases dashboard that can help organization to measure the KPIs after implementing personalized marketing campaigns. Its key elements are lead breakdown, web user to lead, lead to trial, leads by region and google analtics web traffic If you are looking for a format to display your unique thoughts, then the professionally designed Targeted Marketing Campaigns To Improve Buyers Experience Dashboard For Personalized Digital Marketing Kpis Diagrams PDF is the one for you. You can use it as a Google Slides template or a PowerPoint template. Incorporate impressive visuals, symbols, images, and other charts. Modify or reorganize the text boxes as you desire. Experiment with shade schemes and font pairings. Alter, share or cooperate with other people on your work. Download Targeted Marketing Campaigns To Improve Buyers Experience Dashboard For Personalized Digital Marketing Kpis Diagrams PDF and find out how to give a successful presentation. Present a perfect display to your team and make your presentation unforgettable.
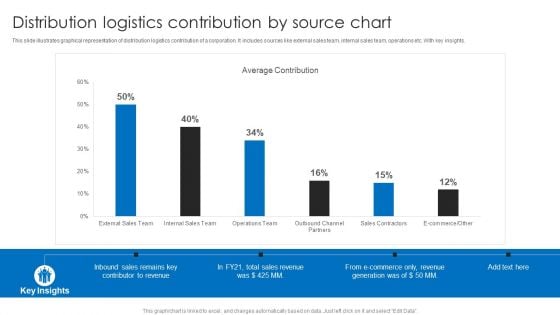
Distribution Logistics Contribution By Source Chart Ppt Model Guidelines PDF
This slide illustrates graphical representation of distribution logistics contribution of a corporation. It includes sources like external sales team, internal sales team, operations etc. With key insights. Showcasing this set of slides titled Distribution Logistics Contribution By Source Chart Ppt Model Guidelines PDF. The topics addressed in these templates are Average Contribution, Total Sales Revenue, E Commerce. All the content presented in this PPT design is completely editable. Download it and make adjustments in color, background, font etc. as per your unique business setting.
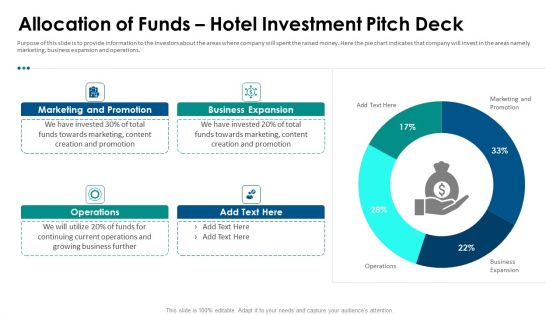
Hospitality Fundraising Allocation Of Funds Hotel Investment Pitch Deck Inspiration PDF
Purpose of this slide is to provide information to the investors about the areas where company will spent the raised money. Here the pie chart indicates that company will invest in the areas namely marketing, business expansion and operations. Deliver an awe inspiring pitch with this creative hospitality fundraising allocation of funds hotel investment pitch deck inspiration pdf bundle. Topics like business expansion, marketing, funds can be discussed with this completely editable template. It is available for immediate download depending on the needs and requirements of the user.
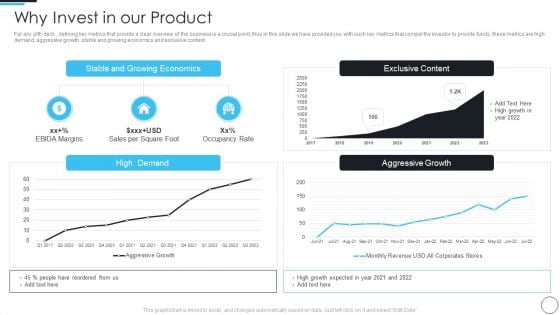
Artificial Intelligence Gaming Industry Fund Raising Elevator Why Invest In Our Product Growing Demonstration PDF
For any pith deck , defining key metrics that provide a clear overview of the business is a crucial point, thus in this slide we have provided you with such key metrics that compel the investor to provide funds, these metrics are high demand, aggressive growth, stable and growing economics and exclusive content Deliver an awe inspiring pitch with this creative artificial intelligence gaming industry fund raising elevator why invest in our product growing demonstration pdf bundle. Topics like why invest in our product can be discussed with this completely editable template. It is available for immediate download depending on the needs and requirements of the user.
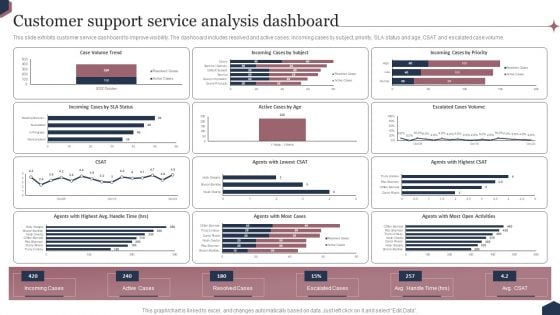
Enhance Customer Engagement Through After Sales Activities Customer Support Service Analysis Dashboard Diagrams Introduction PDF
This slide exhibits customer service dashboard to improve visibility. The dashboard includes resolved and active cases, incoming cases by subject, priority, SLA status and age, CSAT and escalated case volume. Slidegeeks is one of the best resources for PowerPoint templates. You can download easily and regulate Enhance Customer Engagement Through After Sales Activities Customer Support Service Analysis Dashboard Diagrams Introduction PDF for your personal presentations from our wonderful collection. A few clicks is all it takes to discover and get the most relevant and appropriate templates. Use our Templates to add a unique zing and appeal to your presentation and meetings. All the slides are easy to edit and you can use them even for advertisement purposes.
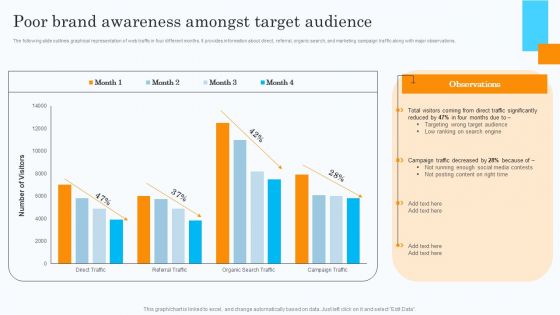
Market Research Assessment Of Target Market Requirements Poor Brand Awareness Amongst Target Audience Diagrams PDF
The following slide outlines graphical representation of web traffic in four different months. It provides information about direct, referral, organic search, and marketing campaign traffic along with major observations. Slidegeeks is one of the best resources for PowerPoint templates. You can download easily and regulate Market Research Assessment Of Target Market Requirements Poor Brand Awareness Amongst Target Audience Diagrams PDF for your personal presentations from our wonderful collection. A few clicks is all it takes to discover and get the most relevant and appropriate templates. Use our Templates to add a unique zing and appeal to your presentation and meetings. All the slides are easy to edit and you can use them even for advertisement purposes.
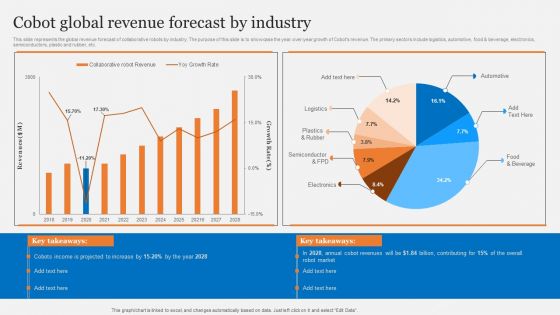
Cobots Usecases In Different Sectors Cobot Global Revenue Forecast By Industry Diagrams PDF
This slide represents the global revenue forecast of collaborative robots by industry. The purpose of this slide is to showcase the year-over-year growth of Cobots revenue. The primary sectors include logistics, automotive, food and beverage, electronics, semiconductors, plastic and rubber, etc. Slidegeeks is one of the best resources for PowerPoint templates. You can download easily and regulate Cobots Usecases In Different Sectors Cobot Global Revenue Forecast By Industry Diagrams PDF for your personal presentations from our wonderful collection. A few clicks is all it takes to discover and get the most relevant and appropriate templates. Use our Templates to add a unique zing and appeal to your presentation and meetings. All the slides are easy to edit and you can use them even for advertisement purposes.
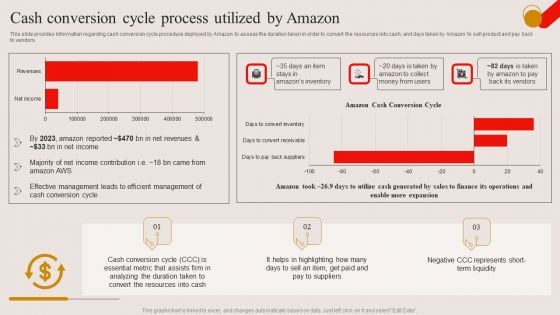
Cash Conversion Cycle Process Utilized By Amazon Ppt PowerPoint Presentation Diagram Images PDF
This slide provides information regarding cash conversion cycle procedure deployed by Amazon to assess the duration taken in order to convert the resources into cash, and days taken by Amazon to sell product and pay back to vendors. Present like a pro with Cash Conversion Cycle Process Utilized By Amazon Ppt PowerPoint Presentation Diagram Images PDF Create beautiful presentations together with your team, using our easy to use presentation slides. Share your ideas in real time and make changes on the fly by downloading our templates. So whether you are in the office, on the go, or in a remote location, you can stay in sync with your team and present your ideas with confidence. With Slidegeeks presentation got a whole lot easier. Grab these presentations today.
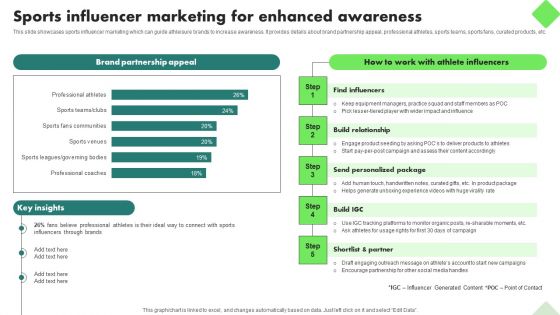
Fitness Product Promotion Campaigns Sports Influencer Marketing For Enhanced Awareness Diagrams PDF
This slide showcases sports influencer marketing which can guide athleisure brands to increase awareness. It provides details about brand partnership appeal, professional athletes, sports teams, sports fans, curated products, etc. Slidegeeks is one of the best resources for PowerPoint templates. You can download easily and regulate Fitness Product Promotion Campaigns Sports Influencer Marketing For Enhanced Awareness Diagrams PDF for your personal presentations from our wonderful collection. A few clicks is all it takes to discover and get the most relevant and appropriate templates. Use our Templates to add a unique zing and appeal to your presentation and meetings. All the slides are easy to edit and you can use them even for advertisement purposes.
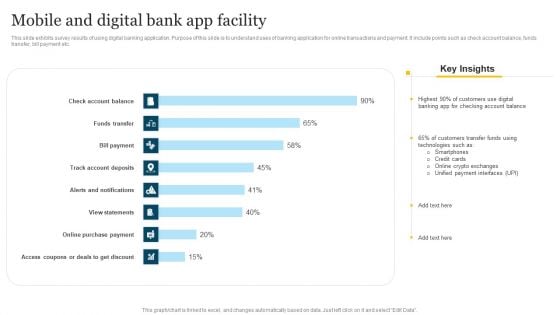
Mobile And Digital Bank App Facility Summary PDF
This slide exhibits survey results of using digital banking application. Purpose of this slide is to understand uses of banking application for online transactions and payment. It include points such as check account balance, funds transfer, bill payment etc. Pitch your topic with ease and precision using this Mobile And Digital Bank App Facility Summary PDF. This layout presents information on Unified Payment Interfaces, Customers Transfer Funds, Technologies It is also available for immediate download and adjustment. So, changes can be made in the color, design, graphics or any other component to create a unique layout.
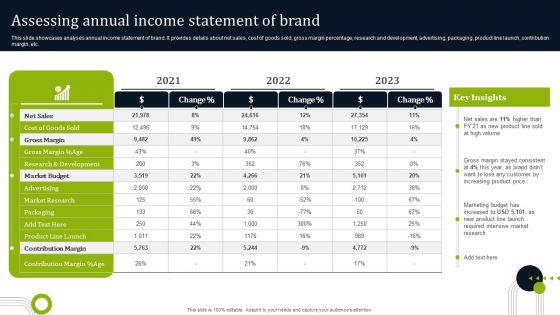
Introducing New Commodities Through Product Line Extension Assessing Annual Income Statement Diagrams PDF
This slide showcases analyses annual income statement of brand. It provides details about net sales, cost of goods sold, gross margin percentage, research and development, advertising, packaging, product line launch, contribution margin, etc. Slidegeeks is here to make your presentations a breeze with Introducing New Commodities Through Product Line Extension Assessing Annual Income Statement Diagrams PDF With our easy-to-use and customizable templates, you can focus on delivering your ideas rather than worrying about formatting. With a variety of designs to choose from, you are sure to find one that suits your needs. And with animations and unique photos, illustrations, and fonts, you can make your presentation pop. So whether you are giving a sales pitch or presenting to the board, make sure to check out Slidegeeks first.
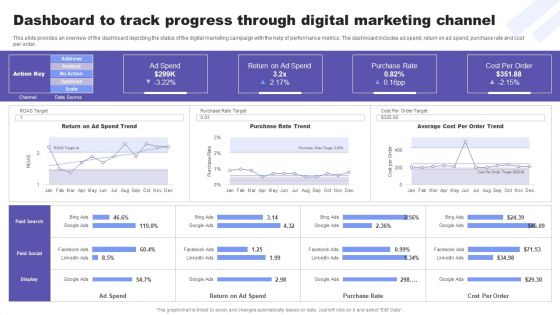
Direct Response Marketing Guide Ultimate Success Dashboard To Track Progress Diagrams PDF
This slide provides an overview of the dashboard depicting the status of the digital marketing campaign with the help of performance metrics. The dashboard includes ad spend, return on ad spend, purchase rate and cost per order. Are you in need of a template that can accommodate all of your creative concepts This one is crafted professionally and can be altered to fit any style. Use it with Google Slides or PowerPoint. Include striking photographs, symbols, depictions, and other visuals. Fill, move around, or remove text boxes as desired. Test out color palettes and font mixtures. Edit and save your work, or work with colleagues. Download Direct Response Marketing Guide Ultimate Success Dashboard To Track Progress Diagrams PDF and observe how to make your presentation outstanding. Give an impeccable presentation to your group and make your presentation unforgettable.
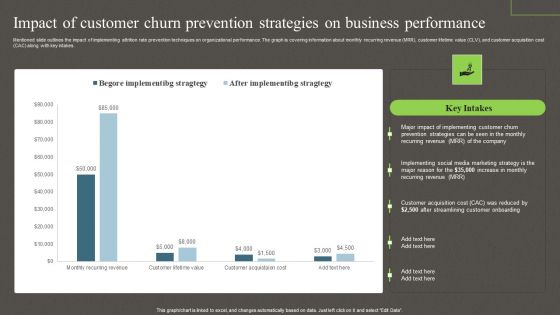
Impact Of Customer Churn Prevention Strategies On Business Performance Ppt PowerPoint Presentation Diagram Images PDF
Mentioned slide outlines the impact of implementing attrition rate prevention techniques on organizational performance. The graph is covering information about monthly recurring revenue MRR, customer lifetime value CLV, and customer acquisition cost CAC along with key intakes. The Impact Of Customer Churn Prevention Strategies On Business Performance Ppt PowerPoint Presentation Diagram Images PDF is a compilation of the most recent design trends as a series of slides. It is suitable for any subject or industry presentation, containing attractive visuals and photo spots for businesses to clearly express their messages. This template contains a variety of slides for the user to input data, such as structures to contrast two elements, bullet points, and slides for written information. Slidegeeks is prepared to create an impression.
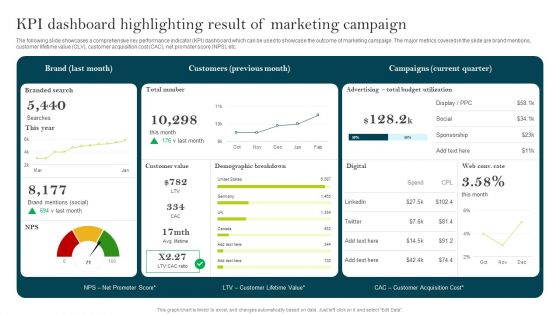
KPI Dashboard Highlighting Result Of Marketing Campaign Ppt PowerPoint Presentation Diagram Lists PDF
The following slide showcases a comprehensive key performance indicator KPI dashboard which can be used to showcase the outcome of marketing campaign. The major metrics covered in the slide are brand mentions, customer lifetime value CLV, customer acquisition cost CAC, net promoter score NPS, etc. Are you in need of a template that can accommodate all of your creative concepts This one is crafted professionally and can be altered to fit any style. Use it with Google Slides or PowerPoint. Include striking photographs, symbols, depictions, and other visuals. Fill, move around, or remove text boxes as desired. Test out color palettes and font mixtures. Edit and save your work, or work with colleagues. Download KPI Dashboard Highlighting Result Of Marketing Campaign Ppt PowerPoint Presentation Diagram Lists PDF and observe how to make your presentation outstanding. Give an impeccable presentation to your group and make your presentation unforgettable.
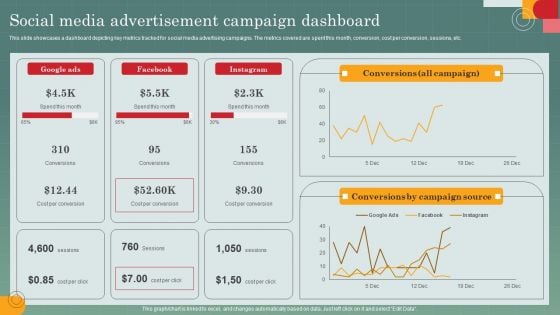
Advertising Programs Management Techniques Social Media Advertisement Campaign Dashboard Diagrams PDF
This slide showcases a dashboard depicting key metrics tracked for social media advertising campaigns. The metrics covered are spent this month, conversion, cost per conversion, sessions, etc. This modern and well arranged Advertising Programs Management Techniques Social Media Advertisement Campaign Dashboard Diagrams PDF provides lots of creative possibilities. It is very simple to customize and edit with the Powerpoint Software. Just drag and drop your pictures into the shapes. All facets of this template can be edited with Powerpoint no extra software is necessary. Add your own material, put your images in the places assigned for them, adjust the colors, and then you can show your slides to the world, with an animated slide included.
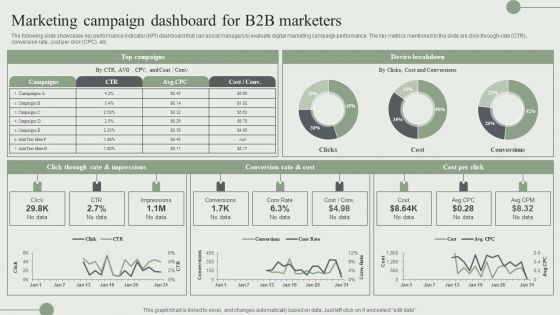
Marketing Campaign Dashboard For B2B Marketers Ppt PowerPoint Presentation File Diagrams PDF
The following slide showcases key performance indicator KPI dashboard that can assist managers to evaluate digital marketing campaign performance. The key metrics mentioned in the slide are click-through-rate CTR, conversion rate, cost per click CPC, etc. Present like a pro with Marketing Campaign Dashboard For B2B Marketers Ppt PowerPoint Presentation File Diagrams PDF Create beautiful presentations together with your team, using our easy to use presentation slides. Share your ideas in real time and make changes on the fly by downloading our templates. So whether you are in the office, on the go, or in a remote location, you can stay in sync with your team and present your ideas with confidence. With Slidegeeks presentation got a whole lot easier. Grab these presentations today.
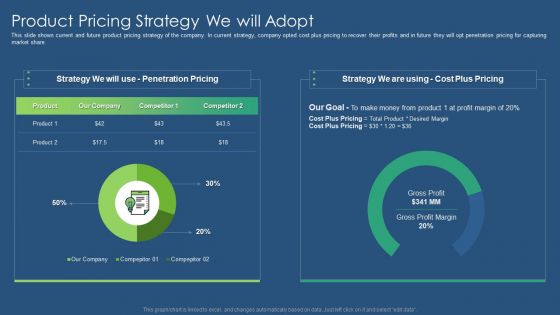
Sustainability Calculation With KPI Product Pricing Strategy We Will Adopt Information PDF Diagrams PDF
This slide shows current and future product pricing strategy of the company. In current strategy, company opted cost plus pricing to recover their profits and in future they will opt penetration pricing for capturing market share. Deliver an awe inspiring pitch with this creative sustainability calculation with kpi product pricing strategy we will adopt information pdf bundle. Topics like gross profit margin, cost plus pricing, penetration pricing can be discussed with this completely editable template. It is available for immediate download depending on the needs and requirements of the user.
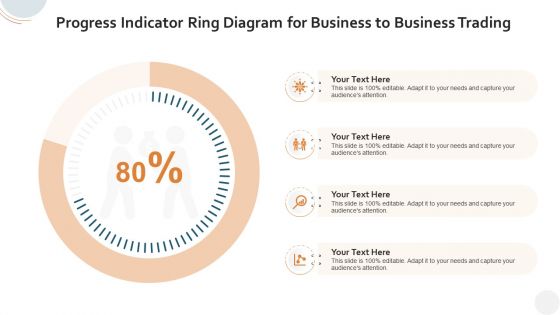
Progress Indicator Ring Diagram For Business To Business Trading Graphics PDF
Pitch your topic with ease and precision using this progress indicator ring diagram for business to business trading graphics pdf. This layout presents information on progress indicator ring diagram for business to business trading. It is also available for immediate download and adjustment. So, changes can be made in the color, design, graphics or any other component to create a unique layout.
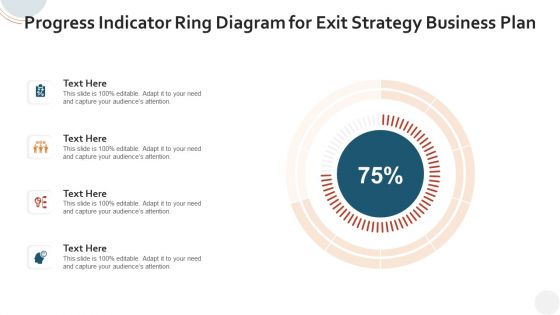
Progress Indicator Ring Diagram For Exit Strategy Business Plan Information PDF
Showcasing this set of slides titled progress indicator ring diagram for exit strategy business plan information pdf. The topics addressed in these templates are progress indicator ring diagram for exit strategy business plan. All the content presented in this PPT design is completely editable. Download it and make adjustments in color, background, font etc. as per your unique business setting.
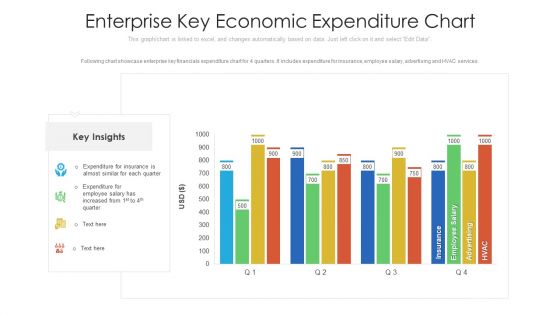
Enterprise Key Economic Expenditure Chart Ppt PowerPoint Presentation File Designs Download PDF
Following chart showcase enterprise key financials expenditure chart for 4 quarters. It includes expenditure for insurance, employee salary, advertising and HVAC services. Pitch your topic with ease and precision using this enterprise key economic expenditure chart ppt powerpoint presentation file designs download pdf. This layout presents information on enterprise key economic expenditure chart. It is also available for immediate download and adjustment. So, changes can be made in the color, design, graphics or any other component to create a unique layout.

Pie With Financial Arrow Business PowerPoint Themes And PowerPoint Slides 0411
Microsoft PowerPoint Theme and Slide with fifteen and eighty five percent proportion pie chart Upgrade your presentation with our Pie With Financial Arrow Business PowerPoint Themes And PowerPoint Slides 0411. Download without worries with our money back guaranteee.
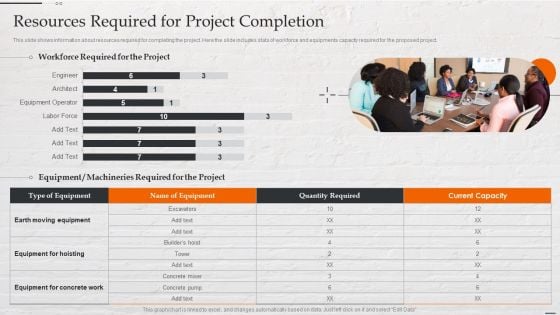
Capital Investment Options Resources Required For Project Completion Brochure PDF
This slide shows information about resources required for completing the project. Here the slide includes stats of workforce and equipments capacity required for the proposed project. Deliver an awe inspiring pitch with this creative Capital Investment Options Resources Required For Project Completion Brochure PDF bundle. Topics like Workforce Required, Project, Machineries Required can be discussed with this completely editable template. It is available for immediate download depending on the needs and requirements of the user.
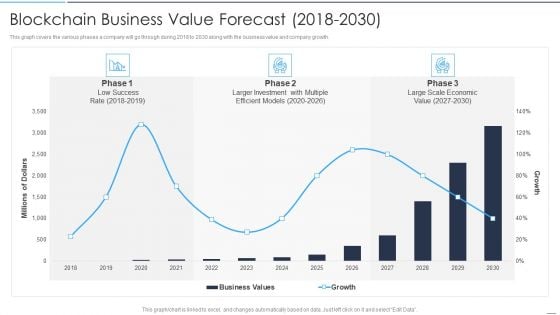
Accelerate Online Journey Now Blockchain Business Value Forecast 2018 To 2030 Designs PDF
This graph covers the various phases a company will go through during 2018 to 2030 along with the business value and company growth.Deliver an awe inspiring pitch with this creative Accelerate Online Journey Now Blockchain Business Value Forecast 2018 To 2030 Designs PDF bundle. Topics like Larger Investment, Multiple Efficient, Large Scale can be discussed with this completely editable template. It is available for immediate download depending on the needs and requirements of the user.
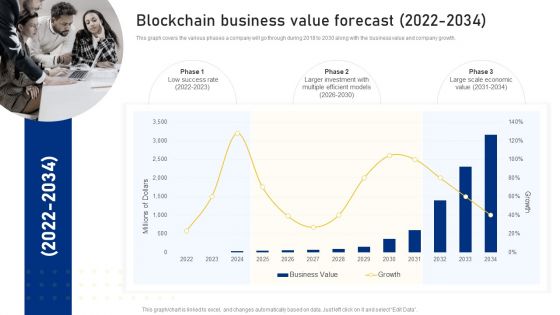
Reshaping Business In Digital Blockchain Business Value Forecast 2022 To 2034 Topics PDF
This graph covers the various phases a company will go through during 2018 to 2030 along with the business value and company growth Deliver an awe inspiring pitch with this creative Reshaping Business In Digital Blockchain Business Value Forecast 2022 To 2034 Topics PDF bundle. Topics like Low Success Rate, Larger Investment, Multiple Efficient Models can be discussed with this completely editable template. It is available for immediate download depending on the needs and requirements of the user.
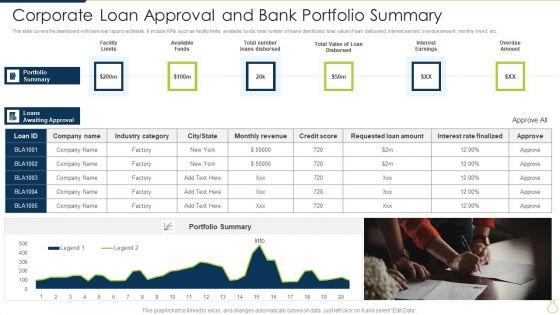
Corporate Loan Approval And Bank Portfolio Summary Portrait PDF
This slide covers the dashboard with bank loan approval details. It include KPIs such as facility limits, available funds, total number of loans distributed, total value of loan disbursed, interest earned, overdue amount, monthly trend, etc. Pitch your topic with ease and precision using this Corporate Loan Approval And Bank Portfolio Summary Portrait PDF. This layout presents information on Interest Earnings, Available Funds, Facility Limits. It is also available for immediate download and adjustment. So, changes can be made in the color, design, graphics or any other component to create a unique layout.
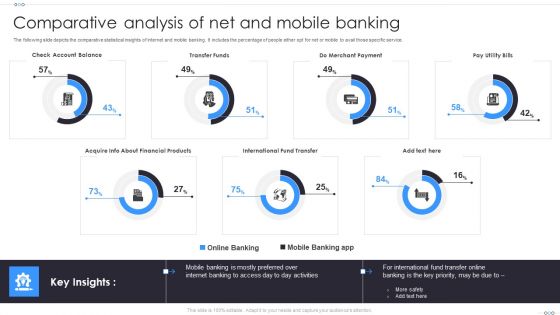
Comparative Analysis Of Net And Mobile Banking Template PDF
The following slide depicts the comparative statistical insights of internet and mobile banking. It includes the percentage of people either opt for net or mobile to avail those specific service. Showcasing this set of slides titled Comparative Analysis Of Net And Mobile Banking Template PDF. The topics addressed in these templates are Transfer Funds, Merchant Payment, International Fund Transfer. All the content presented in this PPT design is completely editable. Download it and make adjustments in color, background, font etc. as per your unique business setting.
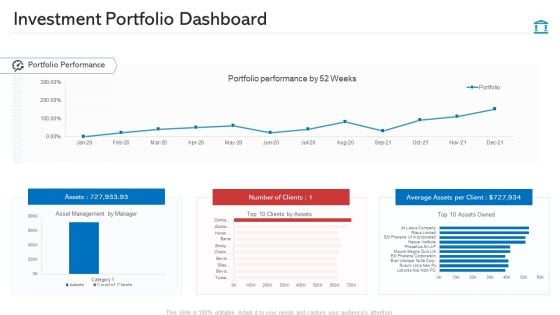
Investment Portfolio Dashboard Download PDF
Deliver an awe inspiring pitch with this creative investment portfolio dashboard download pdfbundle. Topics like portfolio performance, average assets per client, asset management by manager can be discussed with this completely editable template. It is available for immediate download depending on the needs and requirements of the user.
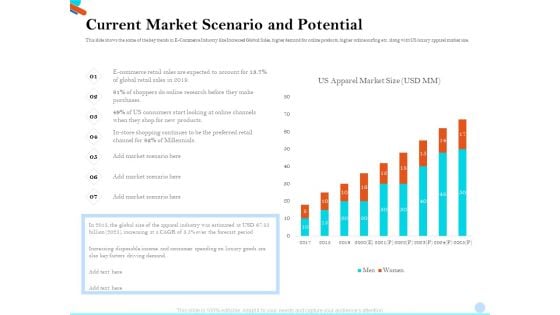
Pitch Presentation Raising Series C Funds Investment Company Current Market Scenario And Potential Mockup PDF
This slide shows the some of the key trends in E Commerce Industry like Increased Global Sales, higher demand for online products, higher online surfing etc. along with US luxury apparel market size. Deliver an awe inspiring pitch with this creative pitch presentation raising series c funds investment company current market scenario and potential mockup pdf bundle. Topics like industry, global, income, consumers, retail sales can be discussed with this completely editable template. It is available for immediate download depending on the needs and requirements of the user.

Weekly Performance Report Dashboard With Project Budget Download PDF
This slide contains the weekly performance report of various phases of project with the overdue tasks and their upcoming . it also includes the project budget with the tracking of workload on staff members. Pitch your topic with ease and precision using this Weekly Performance Report Dashboard With Project Budget Download PDF. This layout presents information on Planning, Design, Development, Testing. It is also available for immediate download and adjustment. So, changes can be made in the color, design, graphics or any other component to create a unique layout.
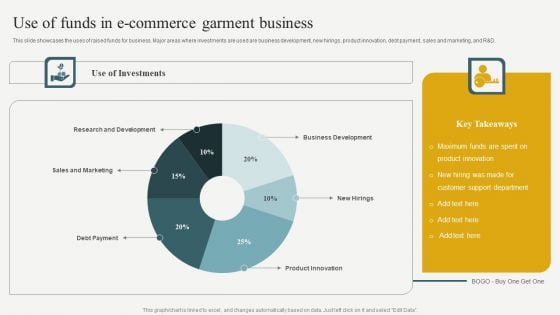
Evaluating Financial Position Of E Commerce Company Use Of Funds In E Commerce Garment Business Structure PDF
This slide showcases the uses of raised funds for business. Major areas where investments are used are business development, new hirings, product innovation, debt payment, sales and marketing, and R and D. Whether you have daily or monthly meetings, a brilliant presentation is necessary. Evaluating Financial Position Of E Commerce Company Use Of Funds In E Commerce Garment Business Structure PDF can be your best option for delivering a presentation. Represent everything in detail using Evaluating Financial Position Of E Commerce Company Use Of Funds In E Commerce Garment Business Structure PDF and make yourself stand out in meetings. The template is versatile and follows a structure that will cater to your requirements. All the templates prepared by Slidegeeks are easy to download and edit. Our research experts have taken care of the corporate themes as well. So, give it a try and see the results.
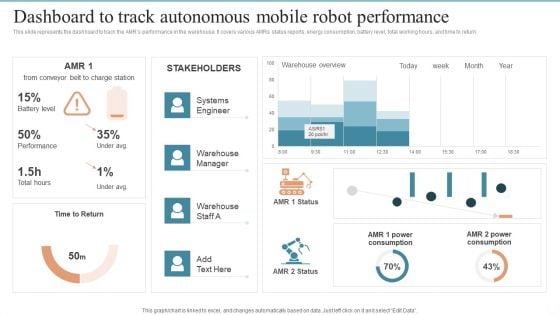
AMR Robot Dashboard To Track Autonomous Mobile Robot Performance Ppt PowerPoint Presentation Diagram Images PDF
This slide represents the dashboard to track the AMRs performance in the warehouse. It covers various AMRs status reports, energy consumption, battery level, total working hours, and time to return. Presenting this PowerPoint presentation, titled AMR Robot Dashboard To Track Autonomous Mobile Robot Performance Ppt PowerPoint Presentation Diagram Images PDF, with topics curated by our researchers after extensive research. This editable presentation is available for immediate download and provides attractive features when used. Download now and captivate your audience. Presenting this AMR Robot Dashboard To Track Autonomous Mobile Robot Performance Ppt PowerPoint Presentation Diagram Images PDF. Our researchers have carefully researched and created these slides with all aspects taken into consideration. This is a completely customizable AMR Robot Dashboard To Track Autonomous Mobile Robot Performance Ppt PowerPoint Presentation Diagram Images PDF that is available for immediate downloading. Download now and make an impact on your audience. Highlight the attractive features available with our PPTs.
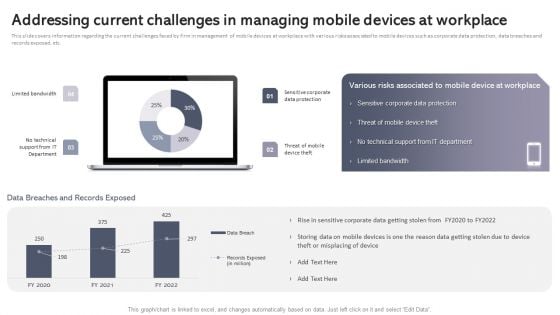
Addressing Current Challenges In Managing Mobile Devices At Workplace Diagrams PDF
This slide covers information regarding the current challenges faced by firm in management of mobile devices at workplace with various risks associated to mobile devices such as corporate data protection, data breaches and records exposed, etc. Presenting this PowerPoint presentation, titled Addressing Current Challenges In Managing Mobile Devices At Workplace Diagrams PDF, with topics curated by our researchers after extensive research. This editable presentation is available for immediate download and provides attractive features when used. Download now and captivate your audience. Presenting this Addressing Current Challenges In Managing Mobile Devices At Workplace Diagrams PDF. Our researchers have carefully researched and created these slides with all aspects taken into consideration. This is a completely customizable Addressing Current Challenges In Managing Mobile Devices At Workplace Diagrams PDF that is available for immediate downloading. Download now and make an impact on your audience. Highlight the attractive features available with our PPTs.

Employee Training And Development Strategy 70 2010 Rule For Leadership Development Diagrams PDF
The slide showcases 70 20 10 rule which focuses on daily learning along with processional training program. Key focus area of this rule is to make employees learn through peers, social group, daily challenging tasks, etc. Presenting this PowerPoint presentation, titled Employee Training And Development Strategy 70 2010 Rule For Leadership Development Diagrams PDF, with topics curated by our researchers after extensive research. This editable presentation is available for immediate download and provides attractive features when used. Download now and captivate your audience. Presenting this Employee Training And Development Strategy 70 2010 Rule For Leadership Development Diagrams PDF. Our researchers have carefully researched and created these slides with all aspects taken into consideration. This is a completely customizable Employee Training And Development Strategy 70 2010 Rule For Leadership Development Diagrams PDF that is available for immediate downloading. Download now and make an impact on your audience. Highlight the attractive features available with our PPTs.
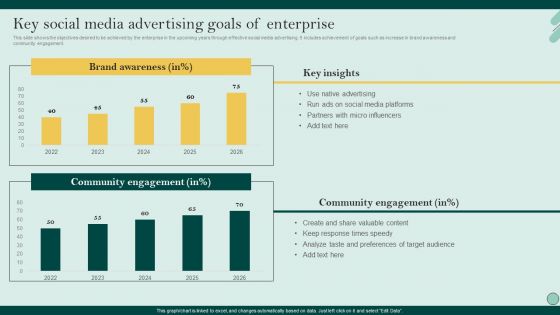
Social Networks Marketing To Improve Key Social Media Advertising Goals Of Enterprise Diagrams PDF
This slide shows the objectives desired to be achieved by the enterprise in the upcoming years through effective social media advertising. It includes achievement of goals such as increase in brand awareness and community engagement. Presenting this PowerPoint presentation, titled Social Networks Marketing To Improve Key Social Media Advertising Goals Of Enterprise Diagrams PDF, with topics curated by our researchers after extensive research. This editable presentation is available for immediate download and provides attractive features when used. Download now and captivate your audience. Presenting this Social Networks Marketing To Improve Key Social Media Advertising Goals Of Enterprise Diagrams PDF. Our researchers have carefully researched and created these slides with all aspects taken into consideration. This is a completely customizable Social Networks Marketing To Improve Key Social Media Advertising Goals Of Enterprise Diagrams PDF that is available for immediate downloading. Download now and make an impact on your audience. Highlight the attractive features available with our PPTs.
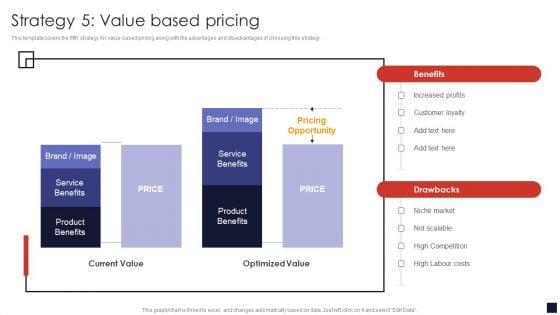
Strategy 5 Value Based Pricing Product Pricing Strategic Guide Diagrams PDF
This template covers the fifth strategy for value-based pricing along with the advantages and disadvantages of choosing this strategy.Are you searching for a Strategy 5 Value Based Pricing Product Pricing Strategic Guide Diagrams PDF that is uncluttered, straightforward, and original Its easy to edit, and you can change the colors to suit your personal or business branding. For a presentation that expresses how much effort you ve put in, this template is ideal With all of its features, including tables, diagrams, statistics, and lists, its perfect for a business plan presentation. Make your ideas more appealing with these professional slides. Download Strategy 5 Value Based Pricing Product Pricing Strategic Guide Diagrams PDF from Slidegeeks today.
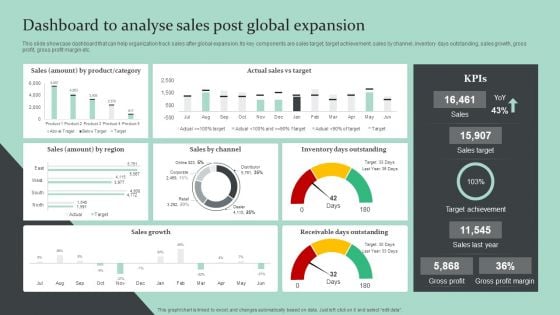
Strategic Global Expansion Business Plan Dashboard To Analyse Sales Post Global Expansion Diagrams PDF
This slide showcase dashboard that can help organization track sales after global expansion. Its key components are sales target, target achievement, sales by channel, inventory days outstanding, sales growth, gross profit, gross profit margin etc. Presenting this PowerPoint presentation, titled Strategic Global Expansion Business Plan Dashboard To Analyse Sales Post Global Expansion Diagrams PDF, with topics curated by our researchers after extensive research. This editable presentation is available for immediate download and provides attractive features when used. Download now and captivate your audience. Presenting this Strategic Global Expansion Business Plan Dashboard To Analyse Sales Post Global Expansion Diagrams PDF. Our researchers have carefully researched and created these slides with all aspects taken into consideration. This is a completely customizable Strategic Global Expansion Business Plan Dashboard To Analyse Sales Post Global Expansion Diagrams PDF that is available for immediate downloading. Download now and make an impact on your audience. Highlight the attractive features available with our PPTs.
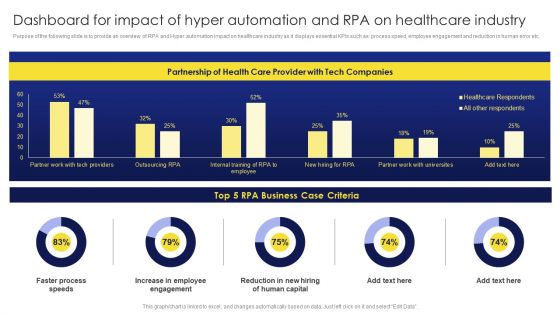
Dashboard For Impact Of Hyper Automation And RPA On Healthcare Industry Diagrams PDF
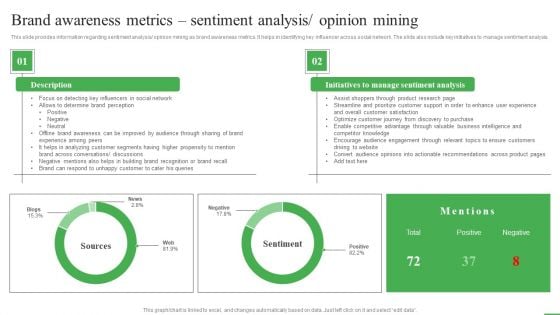
How To Boost Brand Recognition Brand Awareness Metrics Sentiment Analysis Diagrams PDF
This slide provides information regarding sentiment analysis or opinion mining as brand awareness metrics. It helps in identifying key influencer across social network. The slide also include key initiatives to manage sentiment analysis. Presenting this PowerPoint presentation, titled How To Boost Brand Recognition Brand Awareness Metrics Sentiment Analysis Diagrams PDF, with topics curated by our researchers after extensive research. This editable presentation is available for immediate download and provides attractive features when used. Download now and captivate your audience. Presenting this How To Boost Brand Recognition Brand Awareness Metrics Sentiment Analysis Diagrams PDF. Our researchers have carefully researched and created these slides with all aspects taken into consideration. This is a completely customizable How To Boost Brand Recognition Brand Awareness Metrics Sentiment Analysis Diagrams PDF that is available for immediate downloading. Download now and make an impact on your audience. Highlight the attractive features available with our PPTs.
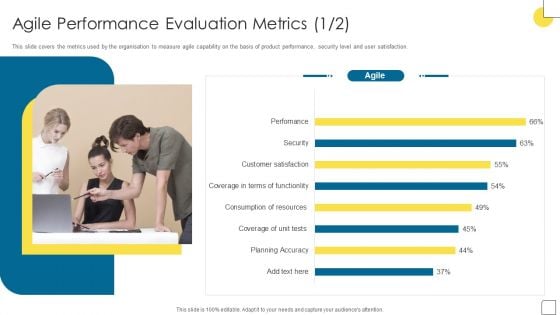
Agile Software Programming Module For IT Agile Performance Evaluation Metrics Diagrams PDF
This slide covers the metrics used by the organisation to measure agile capability on the basis of product performance, security level and user satisfaction. Presenting this PowerPoint presentation, titled Agile Software Programming Module For IT Agile Performance Evaluation Metrics Diagrams PDF, with topics curated by our researchers after extensive research. This editable presentation is available for immediate download and provides attractive features when used. Download now and captivate your audience. Presenting this Agile Software Programming Module For IT Agile Performance Evaluation Metrics Diagrams PDF. Our researchers have carefully researched and created these slides with all aspects taken into consideration. This is a completely customizable Agile Software Programming Module For IT Agile Performance Evaluation Metrics Diagrams PDF that is available for immediate downloading. Download now and make an impact on your audience. Highlight the attractive features available with our PPTs.
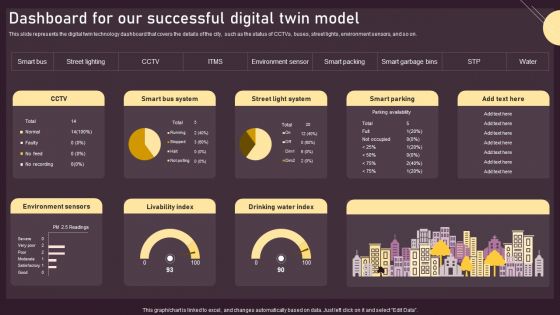
Dashboard For Our Successful Digital Twin Model Ppt PowerPoint Presentation Diagram Templates PDF
This slide represents the digital twin technology dashboard that covers the details of the city, such as the status of CCTVs, buses, street lights, environment sensors, and so on. Presenting this PowerPoint presentation, titled Dashboard For Our Successful Digital Twin Model Ppt PowerPoint Presentation Diagram Templates PDF, with topics curated by our researchers after extensive research. This editable presentation is available for immediate download and provides attractive features when used. Download now and captivate your audience. Presenting this Dashboard For Our Successful Digital Twin Model Ppt PowerPoint Presentation Diagram Templates PDF. Our researchers have carefully researched and created these slides with all aspects taken into consideration. This is a completely customizable Dashboard For Our Successful Digital Twin Model Ppt PowerPoint Presentation Diagram Templates PDF that is available for immediate downloading. Download now and make an impact on your audience. Highlight the attractive features available with our PPTs.
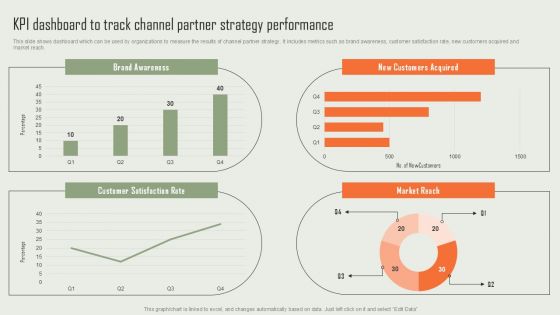
Product Marketing And Sales Expansion Through Channel KPI Dashboard To Track Channel Partner Strategy Diagrams PDF
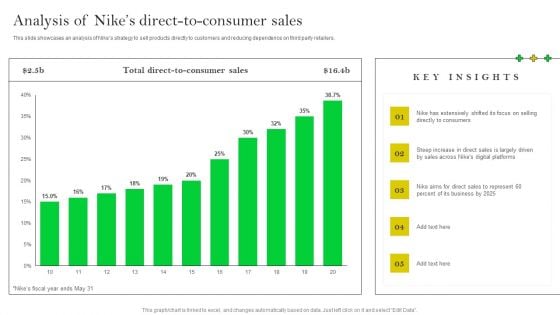
How Nike Developed And Executed Strategic Promotion Techniques Analysis Of Nikes Direct Diagrams PDF
This slide showcases an analysis of Nikes strategy to sell products directly to customers and reducing dependence on third party retailers. Presenting this PowerPoint presentation, titled How Nike Developed And Executed Strategic Promotion Techniques Analysis Of Nikes Direct Diagrams PDF, with topics curated by our researchers after extensive research. This editable presentation is available for immediate download and provides attractive features when used. Download now and captivate your audience. Presenting this How Nike Developed And Executed Strategic Promotion Techniques Analysis Of Nikes Direct Diagrams PDF. Our researchers have carefully researched and created these slides with all aspects taken into consideration. This is a completely customizable How Nike Developed And Executed Strategic Promotion Techniques Analysis Of Nikes Direct Diagrams PDF that is available for immediate downloading. Download now and make an impact on your audience. Highlight the attractive features available with our PPTs.

Predicted Benefits Achieve From Implementing Chatbot On Ecommerce Website Diagrams PDF
This slide shows the key benefits achieve by the company after implementing chatbot on companys website. Do you have an important presentation coming up Are you looking for something that will make your presentation stand out from the rest Look no further than Predicted Benefits Achieve From Implementing Chatbot On Ecommerce Website Diagrams PDF. With our professional designs, you can trust that your presentation will pop and make delivering it a smooth process. And with Slidegeeks, you can trust that your presentation will be unique and memorable. So why wait Grab Predicted Benefits Achieve From Implementing Chatbot On Ecommerce Website Diagrams PDF today and make your presentation stand out from the rest.

Marketing Plan To Sustain Competitive Advantage With Focus Strategy Diagrams PDF
Get a simple yet stunning designed Marketing Plan To Sustain Competitive Advantage With Focus Strategy Diagrams PDF. It is the best one to establish the tone in your meetings. It is an excellent way to make your presentations highly effective. So, download this PPT today from Slidegeeks and see the positive impacts. Our easy-to-edit Marketing Plan To Sustain Competitive Advantage With Focus Strategy Diagrams PDF can be your go-to option for all upcoming conferences and meetings. So, what are you waiting for Grab this template today.
Brand Identity Management Toolkit Overall Brand Performance Tracking Dashboard Diagrams PDF
This slide provides information regarding brand performance tracking dashboard capturing KPIs such as brand metric, brand commitment, advertising metrics, and purchase metrics. Create an editable Brand Identity Management Toolkit Overall Brand Performance Tracking Dashboard Diagrams PDF that communicates your idea and engages your audience. Whether youre presenting a business or an educational presentation, pre-designed presentation templates help save time. Brand Identity Management Toolkit Overall Brand Performance Tracking Dashboard Diagrams PDF is highly customizable and very easy to edit, covering many different styles from creative to business presentations. Slidegeeks has creative team members who have crafted amazing templates. So, go and get them without any delay.
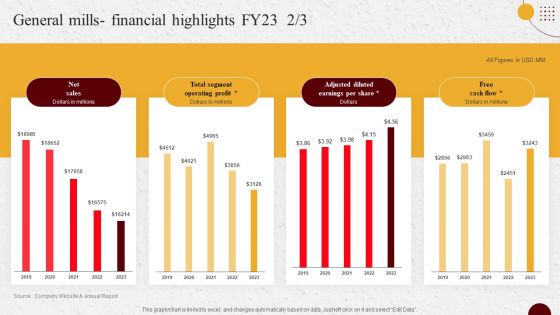
Industry Report Of Packaged Food Products Part 2 General Mills Financial Highlights Fy23 Diagrams PDF
Do you have to make sure that everyone on your team knows about any specific topic I yes, then you should give Industry Report Of Packaged Food Products Part 2 General Mills Financial Highlights Fy23 Diagrams PDF a try. Our experts have put a lot of knowledge and effort into creating this impeccable Industry Report Of Packaged Food Products Part 2 General Mills Financial Highlights Fy23 Diagrams PDF. You can use this template for your upcoming presentations, as the slides are perfect to represent even the tiniest detail. You can download these templates from the Slidegeeks website and these are easy to edit. So grab these today.
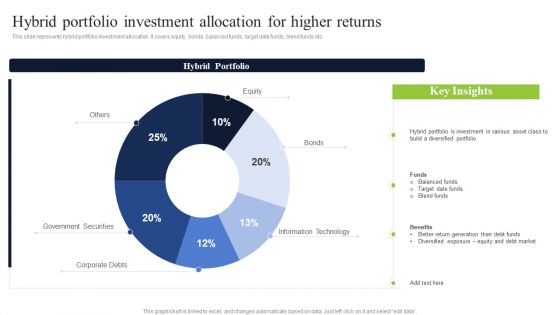
Hybrid Portfolio Investment Allocation For Higher Returns Designs PDF
This slide represents hybrid portfolio investment allocation. It covers equity, bonds, balanced funds, target date funds, blend funds etc. Deliver an awe inspiring pitch with this creative Hybrid Portfolio Investment Allocation For Higher Returns Designs PDF bundle. Topics like Target Date Funds, Diversified Portfolio, Investment can be discussed with this completely editable template. It is available for immediate download depending on the needs and requirements of the user.
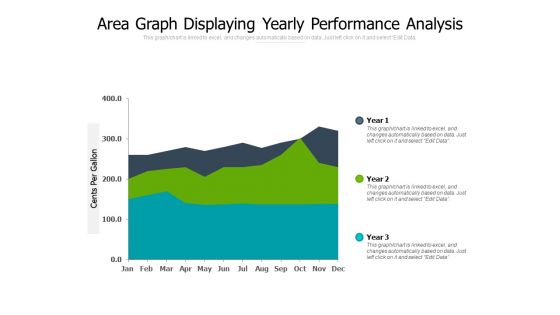
Area Graph Displaying Yearly Performance Analysis Ppt PowerPoint Presentation Slides Diagrams
Presenting this set of slides with name area graph displaying yearly performance analysis ppt powerpoint presentation slides diagrams. The topics discussed in these slide is area graph displaying yearly performance analysis. This is a completely editable PowerPoint presentation and is available for immediate download. Download now and impress your audience.
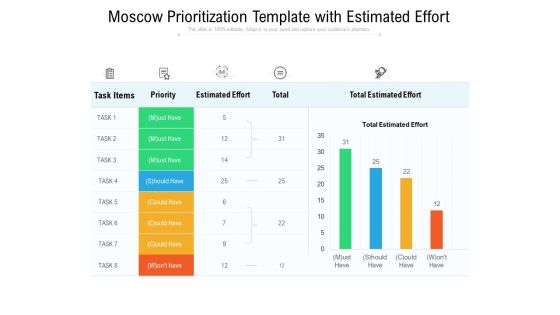
Moscow Prioritization Template With Estimated Effort Ppt PowerPoint Presentation Styles Diagrams PDF
Presenting this set of slides with name moscow prioritization template with estimated effort ppt powerpoint presentation styles diagrams pdf. The topics discussed in these slides are task items, priority, estimated effort, total, total estimated effort. This is a completely editable PowerPoint presentation and is available for immediate download. Download now and impress your audience.
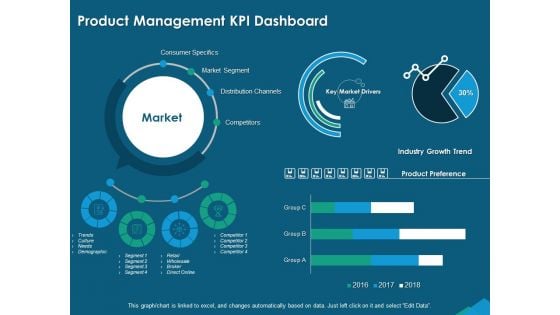
Guide For Managers To Effectively Handle Products Product Management KPI Dashboard Diagrams PDF
Presenting this set of slides with name guide for managers to effectively handle products product management kpi dashboard diagrams pdf. The topics discussed in these slides are consumer specifics, market segment, distribution channels, competitors, industry growth trend, product preference, key market drivers. This is a completely editable PowerPoint presentation and is available for immediate download. Download now and impress your audience.
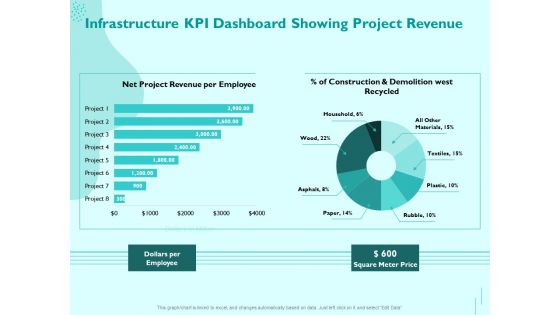
Managing IT Operating System Infrastructure KPI Dashboard Showing Project Revenue Diagrams PDF
Presenting this set of slides with name managing it operating system infrastructure kpi dashboard showing project revenue diagrams pdf. The topics discussed in these slides are dollars per employee, square meter price. This is a completely editable PowerPoint presentation and is available for immediate download. Download now and impress your audience.

 Home
Home