Finance Icons
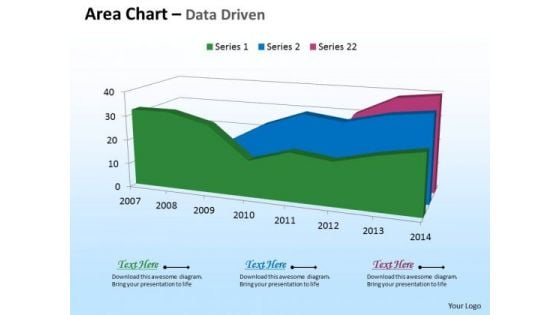
Microsoft Excel Data Analysis 3d Area Chart For Time Based PowerPoint Templates
Deliver The Right Dose With Our microsoft excel data analysis 3d area chart for time based Powerpoint Templates . Your Ideas Will Get The Correct Illumination.
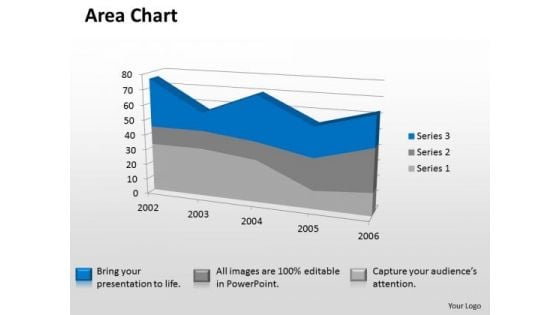
Microsoft Excel Data Analysis 3d Area Chart Showimg Change In Values PowerPoint Templates
Our microsoft excel data analysis 3d area chart showimg change in values Powerpoint Templates Deliver At Your Doorstep. Let Them In For A Wonderful Experience.
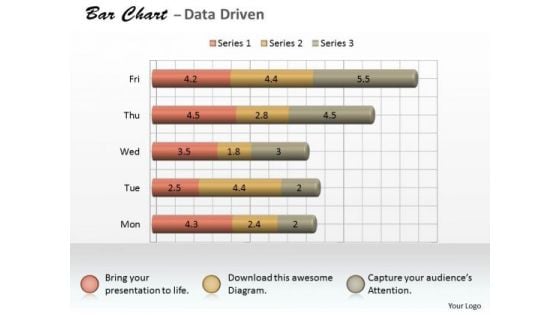
Microsoft Excel Data Analysis 3d Bar Chart As Research Tool PowerPoint Templates
Knock On The Door To Success With Our microsoft excel data analysis 3d bar chart as research tool Powerpoint Templates . Be Assured Of Gaining Entry.
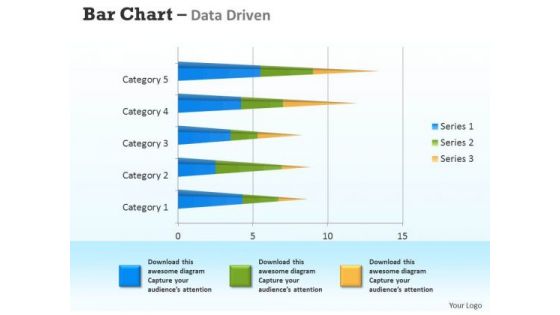
Microsoft Excel Data Analysis 3d Bar Chart For Analyzing Survey PowerPoint Templates
Connect The Dots With Our microsoft excel data analysis 3d bar chart for analyzing survey Powerpoint Templates . Watch The Whole Picture Clearly Emerge.
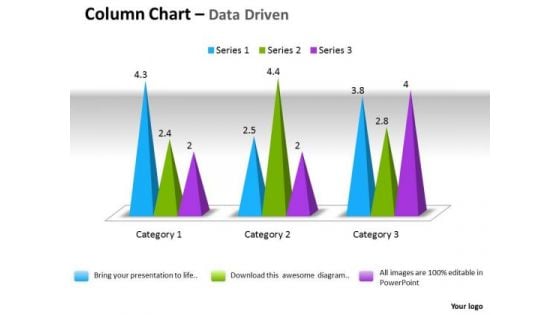
Microsoft Excel Data Analysis 3d Change In Business Process Chart PowerPoint Templates
Double Your Chances With Our microsoft excel data analysis 3d change in business process chart Powerpoint Templates . The Value Of Your Thoughts Will Increase Two-Fold.
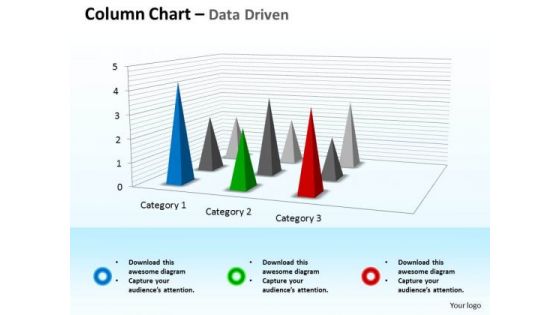
Microsoft Excel Data Analysis 3d Chart For Business Observation PowerPoint Templates
Double Up Our microsoft excel data analysis 3d chart for business observation Powerpoint Templates With Your Thoughts. They Will Make An Awesome Pair.
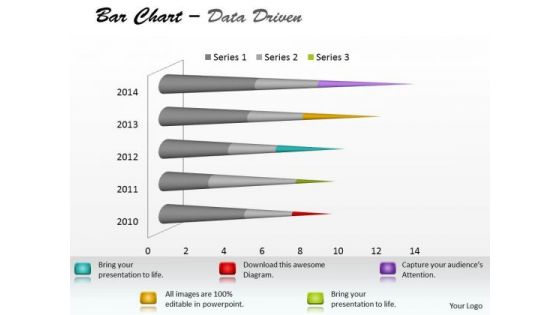
Microsoft Excel Data Analysis Bar Chart To Communicate Information PowerPoint Templates
With Our microsoft excel data analysis bar chart to communicate information Powerpoint Templates You Will Be Doubly Sure. They Possess That Stamp Of Authority.
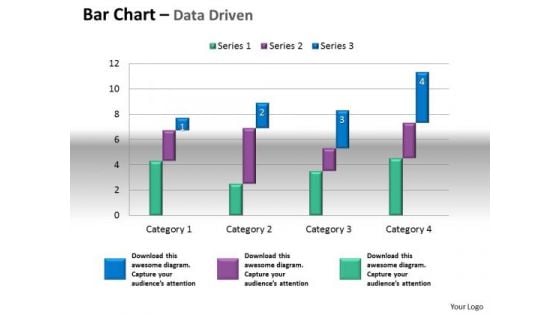
Microsoft Excel Data Analysis Bar Chart To Compare Quantities PowerPoint Templates
Our microsoft excel data analysis bar chart to compare quantities Powerpoint Templates Leave No One In Doubt. Provide A Certainty To Your Views.
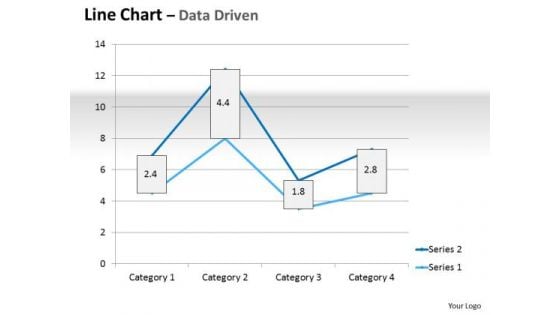
Multivariate Data Analysis Driven Line Chart Market Graph PowerPoint Slides Templates
Plan For All Contingencies With Our multivariate data analysis driven line chart market graph powerpoint slides Templates . Douse The Fire Before It Catches.
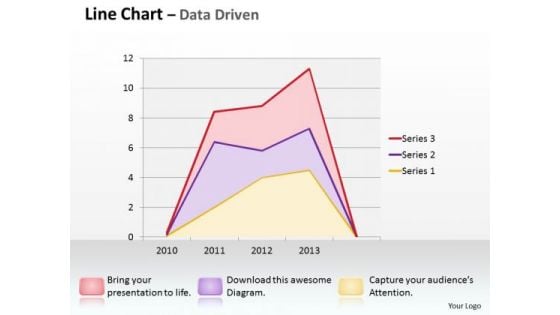
Multivariate Data Analysis Driven Line Chart Shows Revenue Trends PowerPoint Slides Templates
Good Camaraderie Is A Key To Teamwork. Our multivariate data analysis driven line chart shows revenue trends powerpoint slides Templates Can Be A Cementing Force.
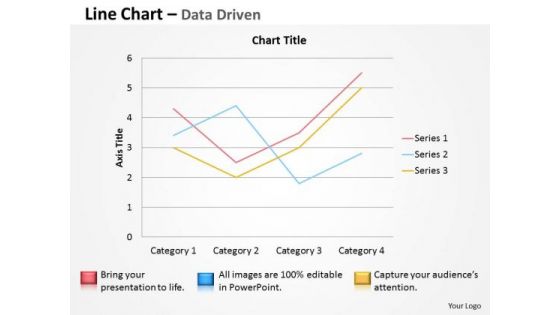
Multivariate Data Analysis Driven Line Chart To Demonstrate PowerPoint Slides Templates
Brace Yourself, Arm Your Thoughts. Prepare For The Hustle With Our multivariate data analysis driven line chart to demonstrate powerpoint slides Templates .
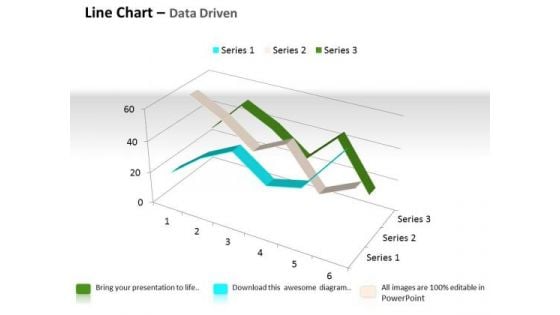
Quantitative Data Analysis 3d Line Chart For Comparison Of PowerPoint Templates
Touch Base With Our quantitative data analysis 3d line chart for comparison of Powerpoint Templates . Review Your Growth With Your Audience.

Quantitative Data Analysis 3d Pie Chart For Business Process PowerPoint Templates
Put Them On The Same Page With Our quantitative data analysis 3d pie chart for business process Powerpoint Templates . Your Team Will Sing From The Same Sheet.
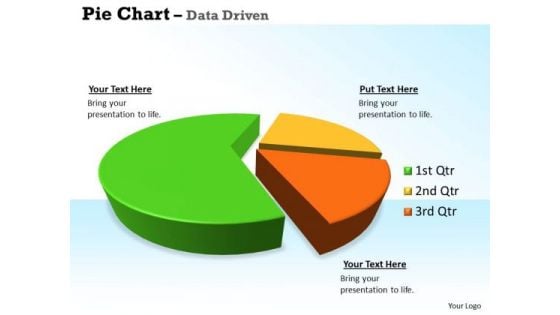
Quantitative Data Analysis 3d Pie Chart For Business Statistics PowerPoint Templates
Our quantitative data analysis 3d pie chart for business statistics Powerpoint Templates Allow You To Do It With Ease. Just Like Picking The Low Hanging Fruit.
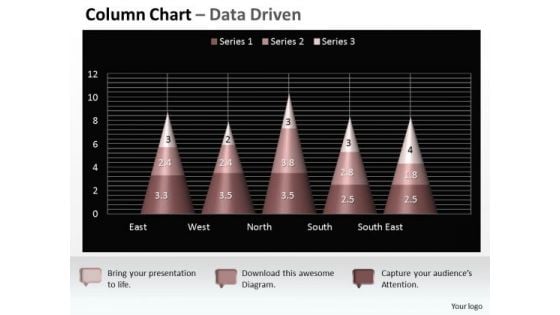
Data Analysis On Excel 3d Chart Shows Interrelated Sets Of PowerPoint Templates
Put Them On The Same Page With Our data analysis on excel 3d chart shows interrelated sets of Powerpoint Templates . Your Team Will Sing From The Same Sheet.
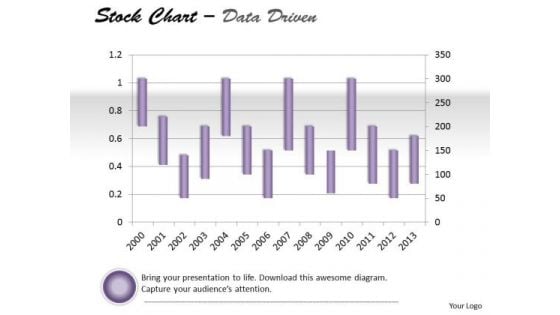
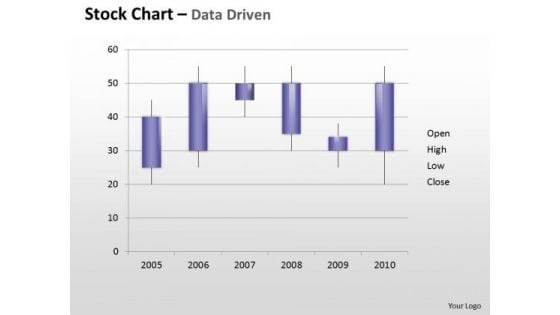
Data Analysis On Excel Driven Stock Chart For Market History PowerPoint Slides Templates
Draw Out The Best In You With Our data analysis on excel driven stock chart for market history powerpoint slides Templates . Let Your Inner Brilliance Come To The Surface.
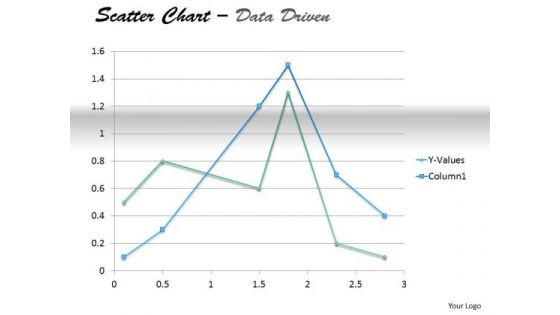
Examples Of Data Analysis Market Driven Present In Scatter Chart PowerPoint Slides Templates
Your Thoughts Will Take To Our examples of data analysis market driven present in scatter chart powerpoint slides Templates Like A Duck To Water. They Develop A Binding Affinity.
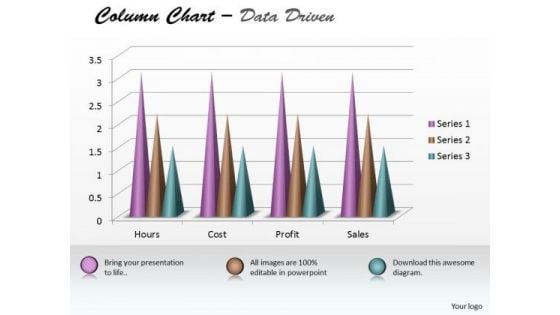
Excel Data Analysis Data Tools Data Methods Statistical Tool Survey Chart PowerPoint Templates
Analyze Ailments On Our excel data analysis data tools data methods statistical tool survey chart Powerpoint Templates . Bring Out The Thinking Doctor In You. Dock Your Thoughts With Our Excel Data Analysis . They Will Launch Them Into Orbit.
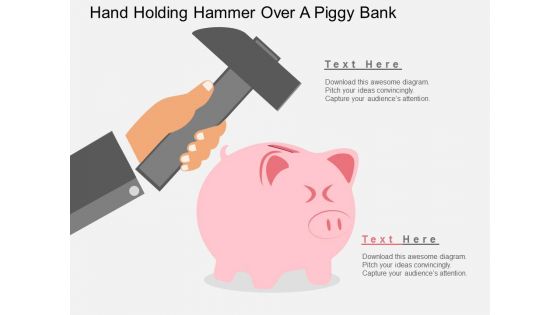
Hand Holding Hammer Over A Piggy Bank Powerpoint Templates
Our above business diagram displays vertical process infographic layout. This slide is suitable for to depict marketing and sales steps. Use this business diagram to present your work in a more smart and precise manner.
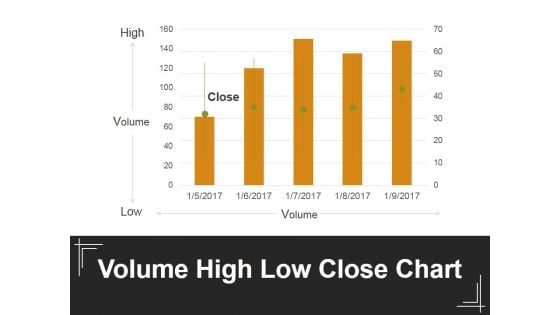
Volume High Low Close Chart Ppt PowerPoint Presentation Ideas Background Images
This is a volume high low close chart ppt powerpoint presentation ideas background images. This is a five stage process. The stages in this process are volume, high, low, close.
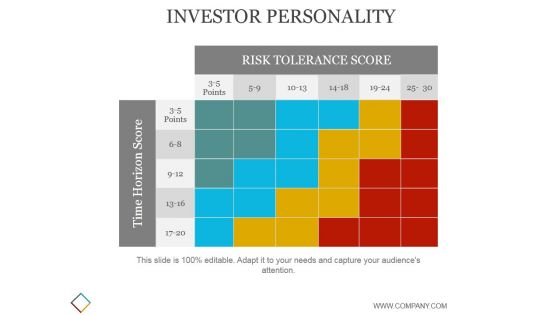
Investor Personality Template 2 Ppt PowerPoint Presentation Themes
This is a investor personality template 2 ppt powerpoint presentation themes. This is a four stage process. The stages in this process are risk tolerance score, time horizon score.
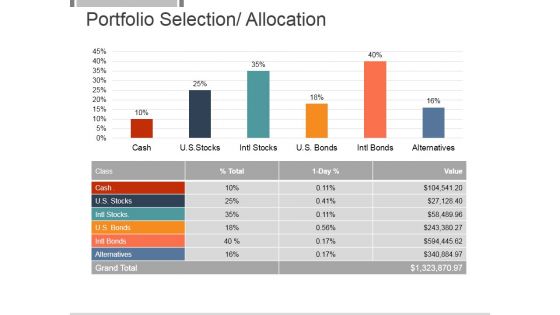
Portfolio Selection Allocation Template 1 Ppt PowerPoint Presentation Themes
This is a portfolio selection allocation template 1 ppt powerpoint presentation themes. This is a six stage process. The stages in this process are financial, business, strategy, management, marketing.
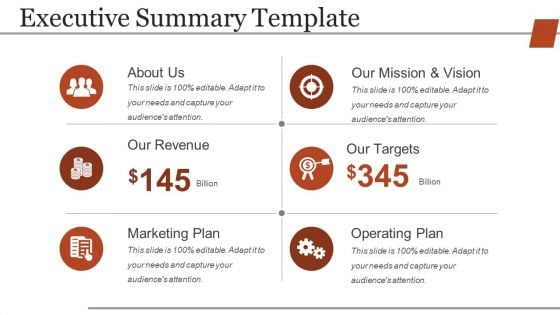
Executive Summary Template Ppt PowerPoint Presentation Slides Themes
This is a executive summary template ppt powerpoint presentation slides themes. This is a six stage process. The stages in this process are about us, our revenue, marketing plan, our mission and vision, our targets, operating plan.

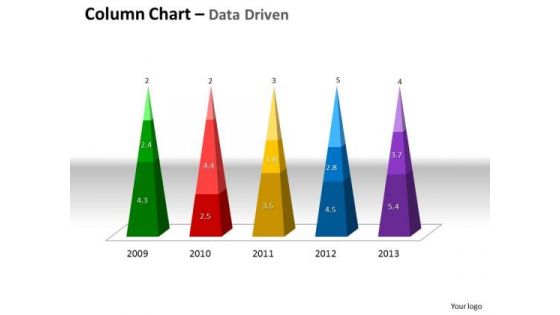
Data Analysis In Excel 3d Column Chart To Represent Information PowerPoint Templates
Rake In The Dough With
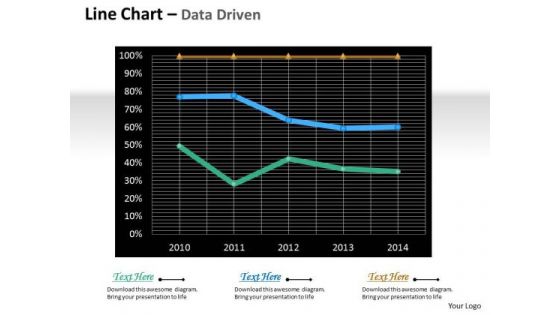
Multivariate Data Analysis Driven Line Chart For Market Survey PowerPoint Slides Templates
Rake In The Dough With
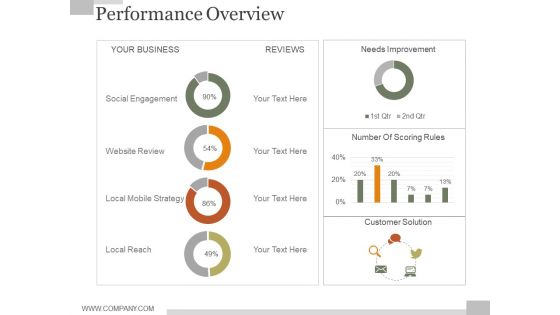
Performance Overview Ppt PowerPoint Presentation Diagrams
This is a performance overview ppt powerpoint presentation diagrams. This is a four stage process. The stages in this process are your business, social engagement, website review, local mobile strategy, local reach, reviews.
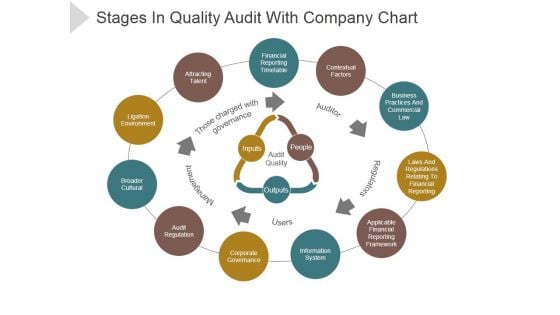
Stages In Quality Audit With Company Chart Ppt PowerPoint Presentation Files
This is a stages in quality audit with company chart ppt powerpoint presentation files. This is a eleven stage process. The stages in this process are financial reporting timetable, contextual factors, business practices and commercial law, applicable financial reporting framework.
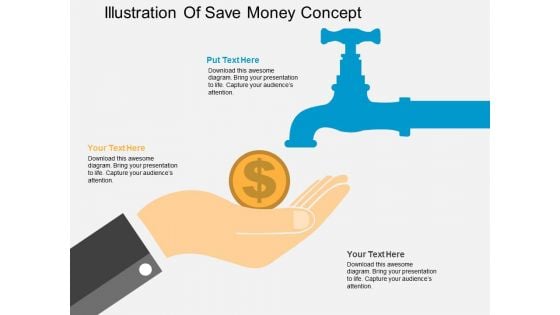
Illustration Of Save Money Concept Powerpoint Templates
This business slide has been designed with infographic square. These text boxes can be used for data representation. Use this diagram for your business presentations. Build a quality presentation for your viewers with this unique diagram.
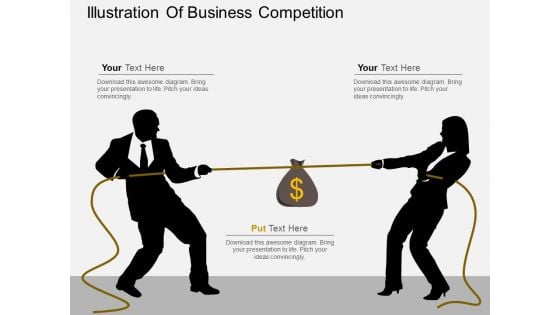
Illustration Of Business Competition Powerpoint Template
This business diagram displays graphics of two person pushing dollar bag. This business diagram has been designed to exhibit business competition. Download this diagram slide to make impressive presentations.
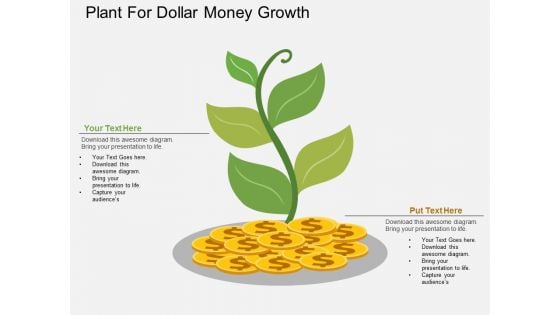
Plant For Dollar Money Growth Powerpoint Template
This PowerPoint template has been designed with diagram of money plant. This infographic template may be used to dollar money growth. Accelerate the impact of your ideas using this template.
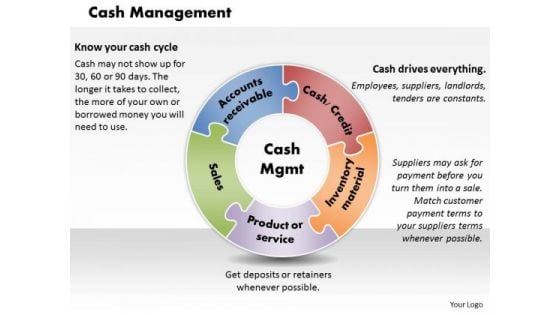
Cash Management Business PowerPoint Presentation
Double Your Chances With Our Cash Management Business Powerpoint Presentation Powerpoint Templates. The Value Of Your Thoughts Will Increase Two-Fold.
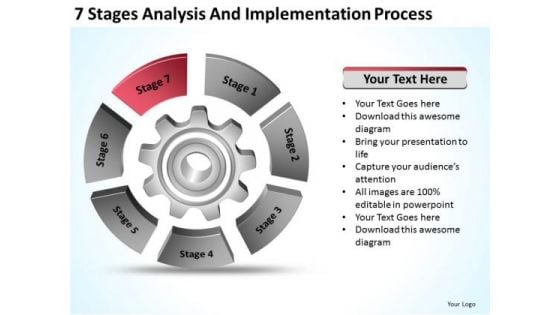
Analysis And Implementation Process Ppt Real Estate Business Plan Examples PowerPoint Slides
We present our analysis and implementation process ppt real estate business plan examples PowerPoint Slides.Present our Competition PowerPoint Templates because you can Break through with our PowerPoint Templates and Slides. Bring down the mental barriers of your audience. Present our Industrial PowerPoint Templates because You can Raise a toast with our PowerPoint Templates and Slides. Spread good cheer amongst your audience. Download our Business PowerPoint Templates because Our PowerPoint Templates and Slides are like the strings of a tennis racquet. Well strung to help you serve aces. Download our Gear Wheels PowerPoint Templates because Our PowerPoint Templates and Slides will Embellish your thoughts. They will help you illustrate the brilliance of your ideas. Use our Circle Charts PowerPoint Templates because It will Strengthen your hand with your thoughts. They have all the aces you need to win the day.Use these PowerPoint slides for presentations relating to Development, training, business, research, process, chart, design, idea, organization, plan, technical, layout, concept, arrow, sign, render, show, diagram, gain, graphic, integration, engineer, technology, gear, management, creative, quality, contractor, transparency, profit, work, industry, analyze, database, software, structure, continuous, methodology. The prominent colors used in the PowerPoint template are Red, Gray, Black. Allow discussions with our Analysis And Implementation Process Ppt Real Estate Business Plan Examples PowerPoint Slides. You will come out on top.
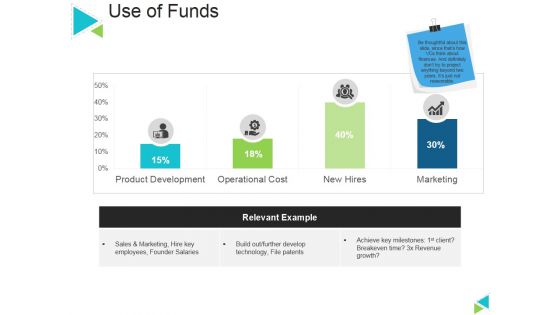
Use Of Funds Ppt PowerPoint Presentation Layouts Graphics Template
This is a use of funds ppt powerpoint presentation layouts graphics template. This is a four stage process. The stages in this process are relevant example, marketing, business, product development, new hires.
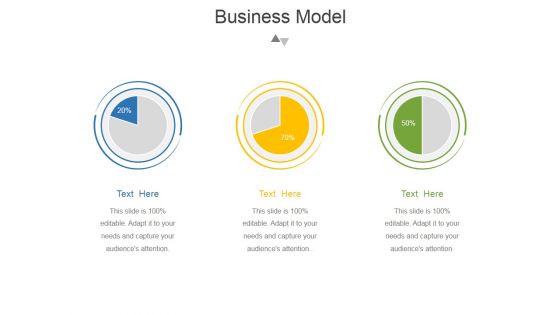
Business Model Template 2 Ppt PowerPoint Presentation Slides
This is a business model template 2 ppt powerpoint presentation slides. This is a three stage process. The stages in this process are business, pie chart, marketing, strategy, analysis.

Human Hand Holding Dollar Note Powerpoint Templates
Use this PowerPoint template, in your corporate presentations. It contains graphics of human hand holding dollar note. This slide is 100 percent editable. This business slide may be used to exhibit financial planning. Make wonderful presentations using this diagram.
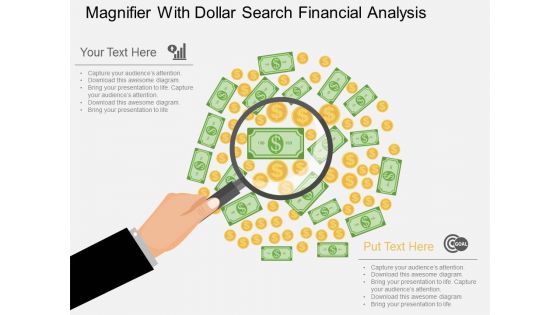
Magnifier With Dollar Search Financial Analysis Powerpoint Template
Our above business slide contains graphics of magnifier on dollar notes. This diagram can be used to display dollar search and financial analysis. Capture the attention of your audience with this professional slide.
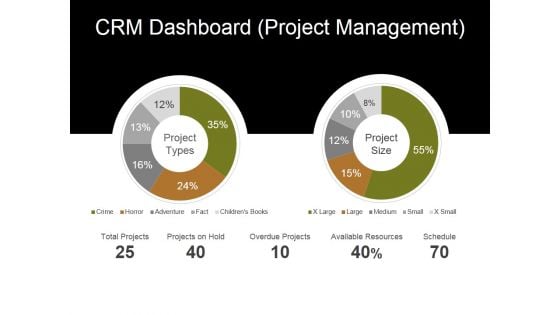
Crm Dashboard Project Management Ppt PowerPoint Presentation Layouts Ideas
This is a crm dashboard project management ppt powerpoint presentation layouts ideas. This is a two stage process. The stages in this process are total projects, projects on hold, overdue projects, available resources, schedule.
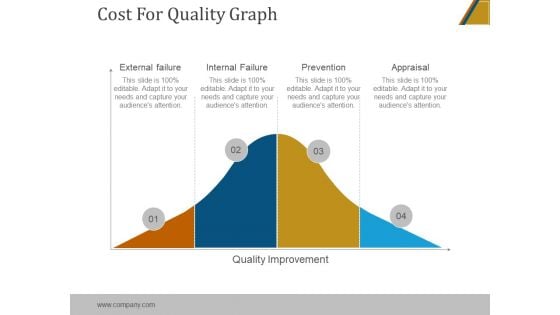
Cost For Quality Graph Ppt PowerPoint Presentation Graphics
This is a cost for quality graph ppt powerpoint presentation graphics. This is a four stage process. The stages in this process are external failure, internal failure, prevention, appraisal, quality improvement.
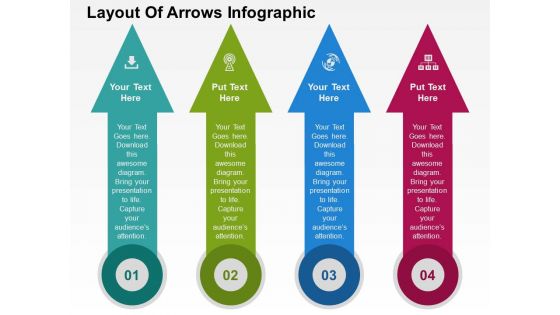
Layout Of Arrows Infographic Powerpoint Templates
Our professionally designed business diagram is as an effective tool for communicating concepts of global technology. This slide illustrates arrows infographic. Convey your views with this diagram slide.
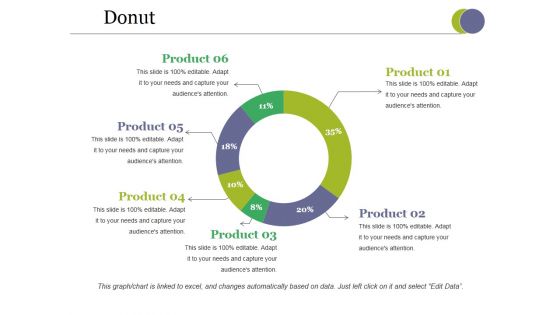
Donut Ppt PowerPoint Presentation File Designs
This is a donut ppt powerpoint presentation file designs. This is a six stage process. The stages in this process are donut chart, marketing, strategy, analysis, business.

Data Analysis Excel Bar Graph To Compare PowerPoint Templates
Get The Domestics Right With Our data analysis excel bar graph to compare Powerpoint Templates. Create The Base For Thoughts To Grow.
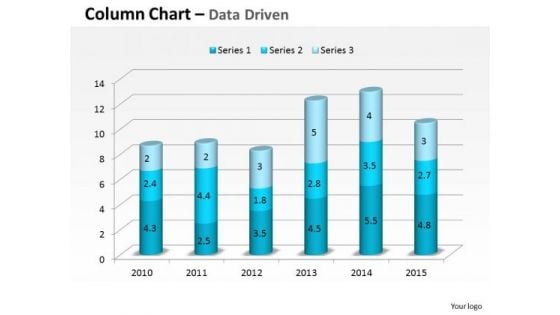
Data Analysis In Excel 3d Compare Yearly Business Performance PowerPoint Templates
Plan For All Contingencies With Our data analysis in excel 3d compare yearly business performance Powerpoint Templates . Douse The Fire Before It Catches.

Data Analysis On Excel Driven Sets Of Business Information PowerPoint Slides Templates
Break The Deadlock With Our data analysis on excel driven sets of business information powerpoint slides Templates . Let The Words Start To Flow.
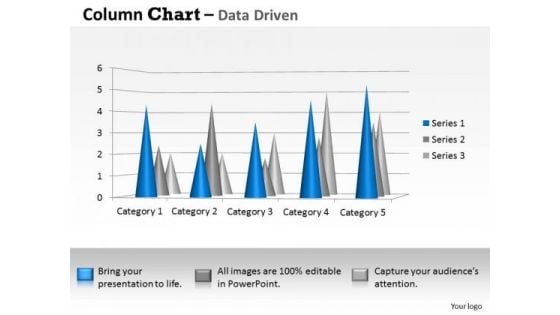
Data Analysis Techniques 3d Distribution Of In Sets PowerPoint Templates
Your Thoughts Will Be The Main Course. Provide The Dressing With Our data analysis techniques 3d distribution of in sets Powerpoint Templates .
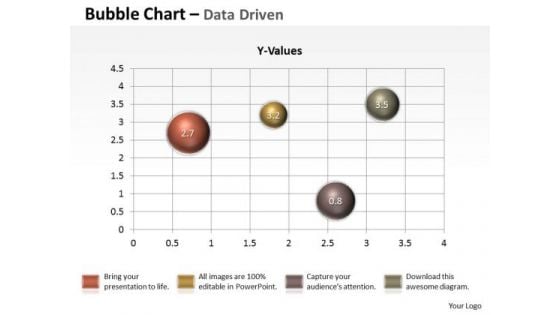
Data Analysis Techniques 3d Graphical Presentation Of PowerPoint Templates
Our data analysis techniques 3d graphical presentation of Powerpoint Templates Will Follow The Drill. They Accomplish The Task Assigned To Them.
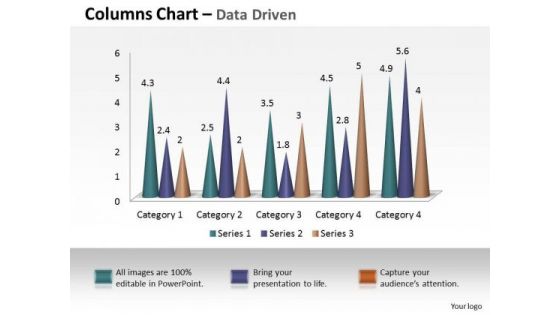
Examples Of Data Analysis Market 3d Business Intelligence And PowerPoint Templates
Our examples of data analysis market 3d business intelligence and Powerpoint Templates Are Dual Purpose. They Help Instruct And Inform At The Same Time.
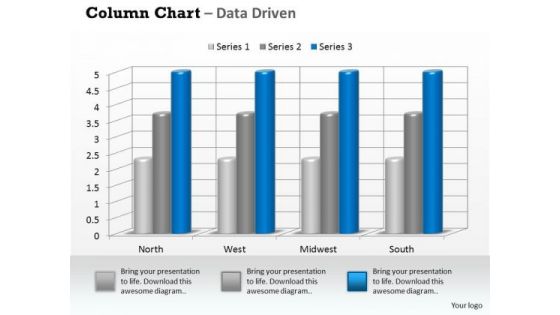
Examples Of Data Analysis Market 3d Business On Regular Intervals PowerPoint Templates
Drum It Out Loud And Clear On Our examples of data analysis market 3d business on regular intervals Powerpoint Templates . Your Words Will Ring In Their Ears.
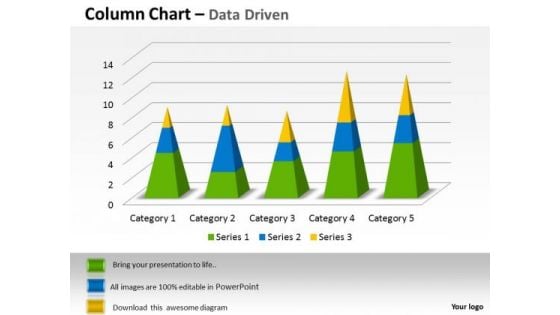
Examples Of Data Analysis Market 3d Categories Sets PowerPoint Templates
Our examples of data analysis market 3d categories sets Powerpoint Templates Give Your Thoughts Their Due. They Project Them With Full Intensity.
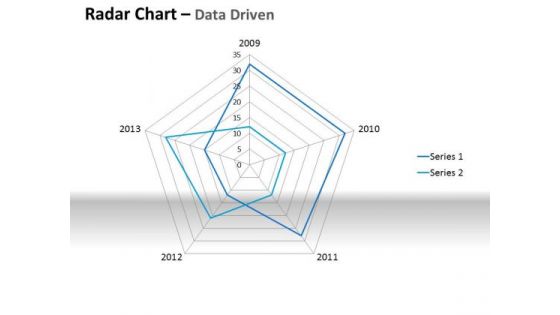
Examples Of Data Analysis Market Driven Plotting The Business Values PowerPoint Slides Templates
Ring The Duck With Our examples of data analysis market driven plotting the business values powerpoint slides Templates . Acquire The Points With Your Ideas.
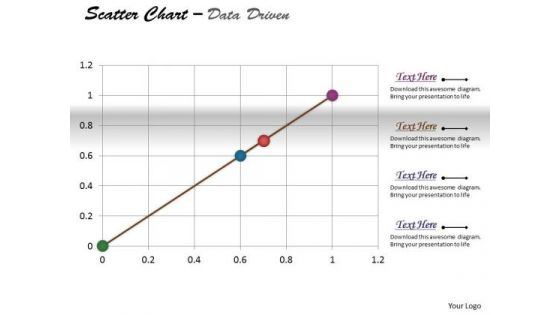
Excel Data Analysis Data Methods Statistical Tool Survey Driven PowerPoint Slides Templates
Be The Duke Of The Dais With Our excel data analysis data methods statistical tool survey driven powerpoint slides Templates . Acquire Royalty Status With Your Thoughts.
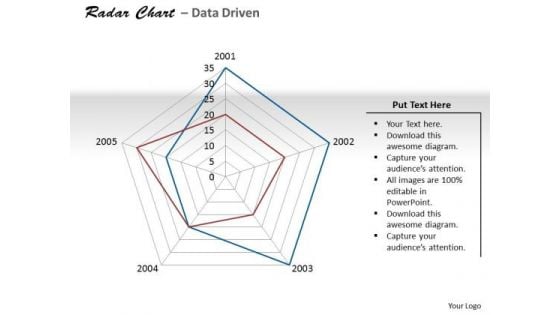
Excel Data Analysis Data Tools Data Methods Statistical Driven PowerPoint Slides Templates
There Is No Subject Too Dull For Our excel data analysis data tools data methods statistical driven powerpoint slides Templates . They Will Always Generate Keenness.
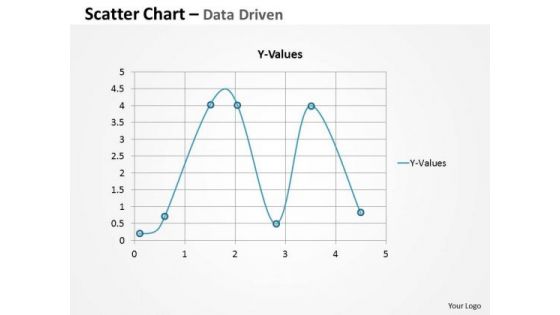
Excel Data Analysis Data Tools Data Methods Statistical Survey Driven PowerPoint Slides Templates
Ask For Assistance From Our excel data analysis data tools data methods statistical survey driven powerpoint slides Templates . You Will Be Duly Satisfied.
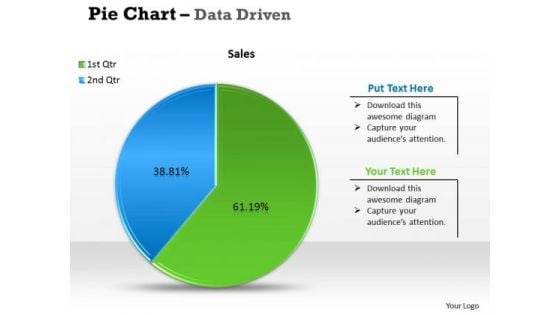
Excel Data Analysis Data Tools Data Methods Statistical Tool Survey PowerPoint Slides Templates
Get Out Of The Dock With Our excel data analysis data tools data methods statistical tool survey powerpoint slides Templates . Your Mind Will Be Set Free.
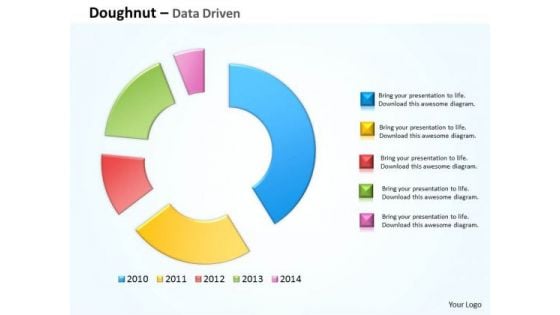
Financial Data Analysis Driven Compare Market Share Of Brand PowerPoint Templates
Doll Up Your Thoughts With Our financial data analysis driven compare market share of brand Powerpoint Templates . They Will Make A Pretty Picture.
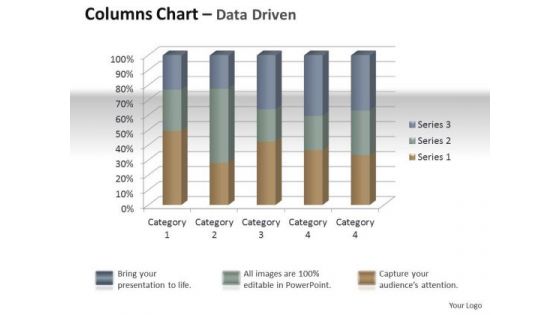
Marketing Data Analysis 3d Quality Control Of Units PowerPoint Templates
Establish Your Dominion With Our marketing data analysis 3d quality control of units Powerpoint Templates . Rule The Stage With Your Thoughts.
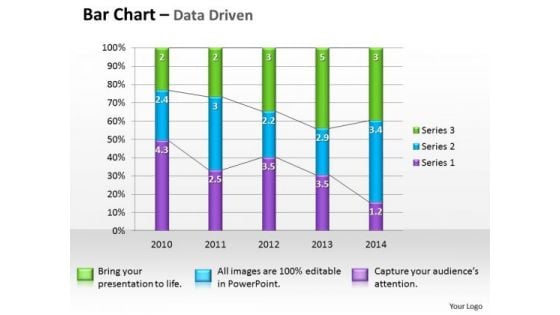
Microsoft Excel Data Analysis Bar Graph PowerPoint Templates
Double The Impact With Our microsoft excel data analysis bar graph Powerpoint Templates . Your Thoughts Will Have An Imposing Effect.
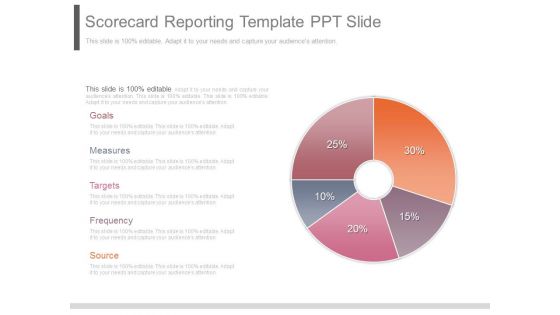
Scorecard Reporting Template Ppt Slide
This is a scorecard reporting template ppt slide. This is a five stage process. The stages in this process are goals, measures, targets, frequency, source.
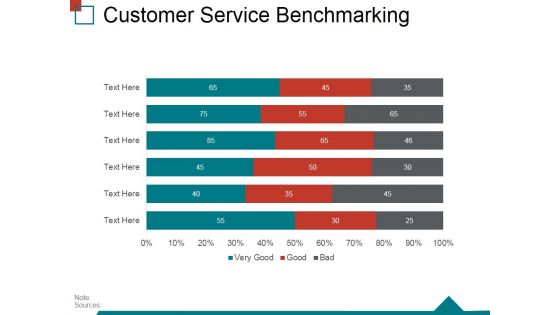
Customer Service Benchmarking Template 2 Ppt PowerPoint Presentation Inspiration Backgrounds
This is a customer service benchmarking template 2 ppt powerpoint presentation inspiration backgrounds. This is a three stage process. The stages in this process are business, process, marketing, management, customer service benchmarking.
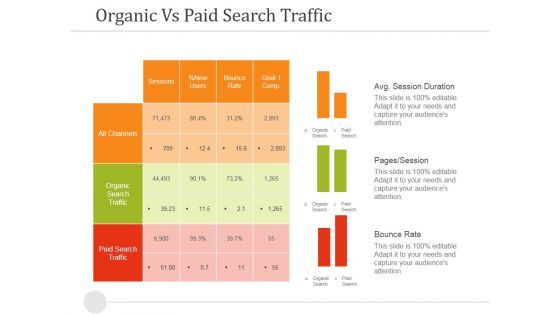
Organic Vs Paid Search Traffic Ppt PowerPoint Presentation Infographic Template Influencers
This is a organic vs paid search traffic ppt powerpoint presentation infographic template influencers. This is a three stage process. The stages in this process are avg session duration, pages session, bounce rate.
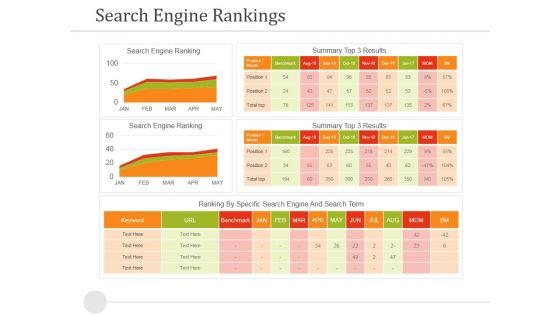
Search Engine Rankings Ppt PowerPoint Presentation Pictures Design Ideas
This is a search engine rankings ppt powerpoint presentation pictures design ideas. This is a two stage process. The stages in this process are search engine ranking, ranking by specific search engine and search term.
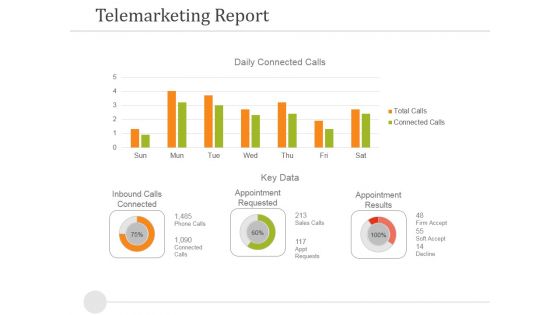
Telemarketing Report Template 1 Ppt PowerPoint Presentation Model Model
This is a telemarketing report template 1 ppt powerpoint presentation model model. This is a two stage process. The stages in this process are inbound calls connected, appointment requested, appointment results, key data.
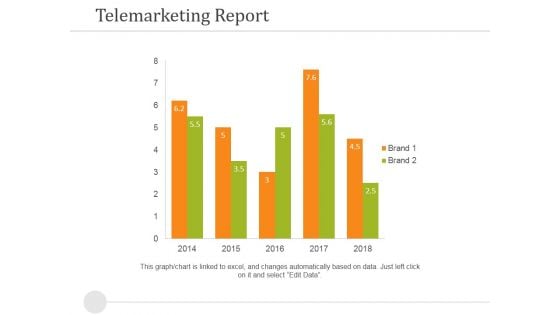
Telemarketing Report Template 2 Ppt PowerPoint Presentation Summary Inspiration
This is a telemarketing report template 2 ppt powerpoint presentation summary inspiration. This is a five stage process. The stages in this process are telemarketing report, business, marketing, success, strategy.
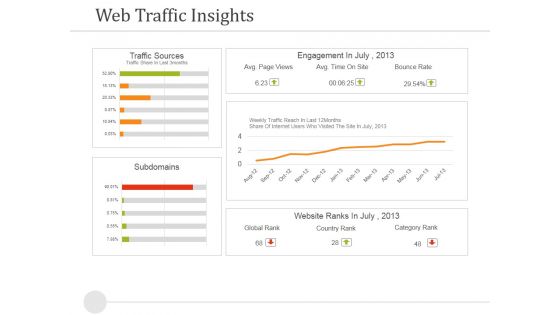
Web Traffic Insights Ppt PowerPoint Presentation Model Visual Aids
This is a web traffic insights ppt powerpoint presentation model visual aids. This is a two stage process. The stages in this process are traffic sources, engagement in, ranks in, subdomains.
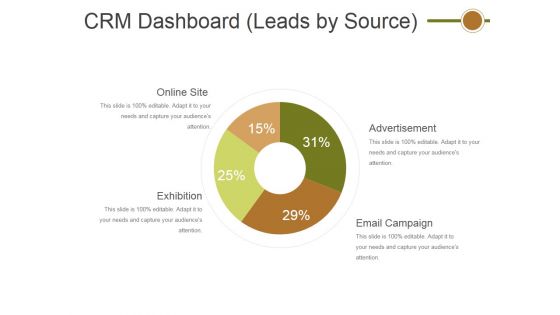
Crm Dashboard Leads By Source Ppt PowerPoint Presentation File Graphics Template
This is a crm dashboard leads by source ppt powerpoint presentation file graphics template. This is a four stage process. The stages in this process are online site, exhibition, advertisement, email campaign.
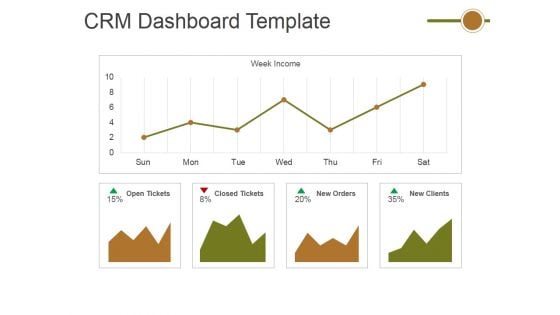
Crm Dashboard Template Ppt PowerPoint Presentation Gallery Shapes
This is a crm dashboard template ppt powerpoint presentation gallery shapes. This is a four stage process. The stages in this process are open tickets, closed tickets, new orders, new clients.
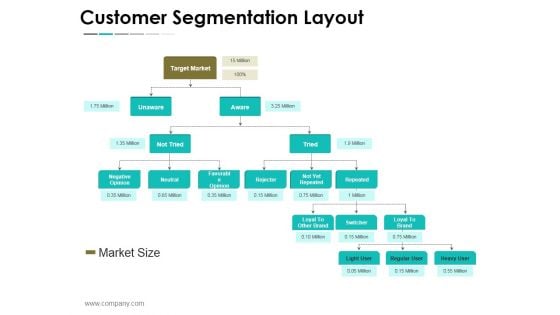
Customer Segmentation Layout Ppt PowerPoint Presentation Infographic Template Picture
This is a customer segmentation layout ppt powerpoint presentation infographic template picture. This is a five stage process. The stages in this process are target market, unaware, not tried, negative opinion, favorable, opinion, rejecter, not yet repeated, loyal to other brand, loyal to brand.
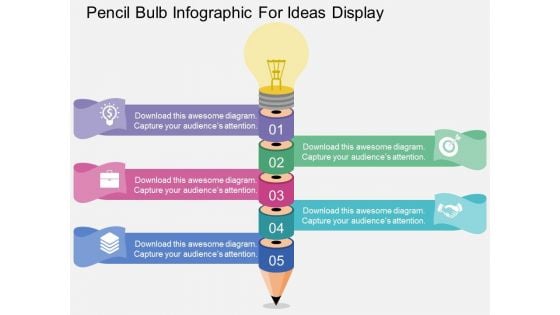
Pencil Bulb Infographic For Ideas Display Powerpoint Templates
This PowerPoint template contains pencil bulb Infographic. This diagram may be used to display ideas and strategies. This diagram slide will?link your ideas into a chain of thought and increase the strength of your overall concept.

Business Men On Gears Towards Success Trophy Powerpoint Templates
Our above slide contains diagram of business men on gears towards success trophy. It helps to exhibit strategy process and competition. Use this diagram to impart more clarity to data and to create more sound impact on viewers.
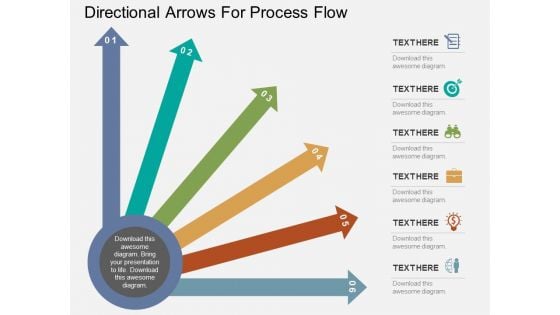
Directional Arrows For Process Flow Powerpoint Templates
This PPT slide has been designed with graphics of multi color arrows. This business diagram helps to exhibit directions for business process. Use this diagram to build an exclusive presentation.
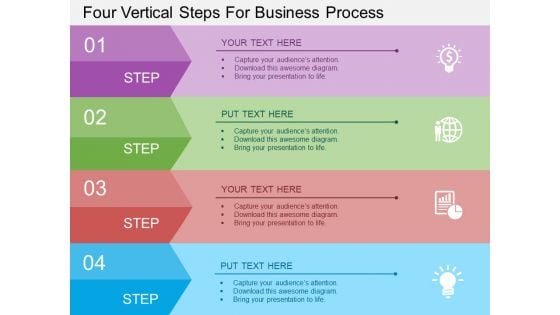
Four Vertical Steps For Business Process Powerpoint Template
Our above business diagram has been designed with graphics of four vertical tags. This business slide is suitable to present marketing planning. Use this business diagram to present your work in a more smart and precise manner.
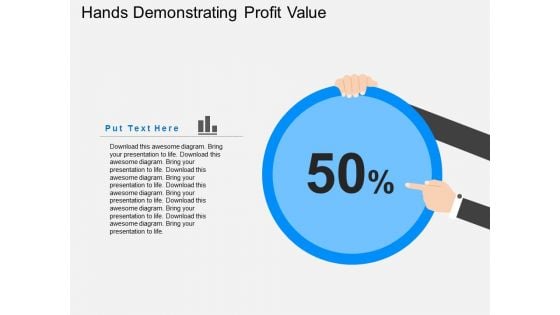
Hands Demonstrating Profit Value Powerpoint Templates
Our above slide contains diagram of zigzag arrow on monitor. It helps to display growth analysis and management. Use this diagram to impart more clarity to information and to create more sound impact on viewers.
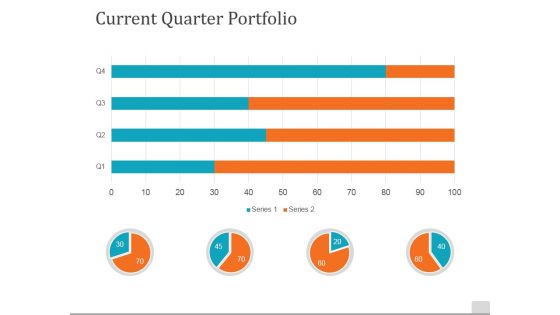
Current Quarter Portfolio Template 1 Ppt PowerPoint Presentation Styles Mockup
This is a current quarter portfolio template 1 ppt powerpoint presentation styles mockup. This is a four stage process. The stages in this process are current quarter portfolio, pie chart, bar graph, business, marketing.
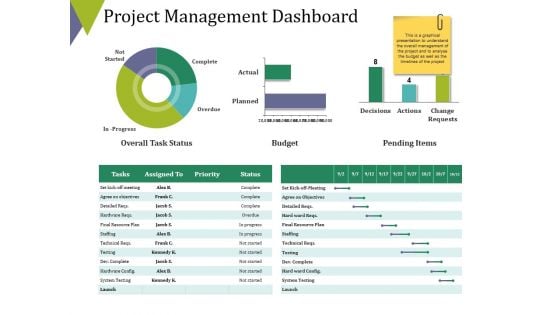
Project Management Dashboard Ppt PowerPoint Presentation Outline Summary
This is a project management dashboard ppt powerpoint presentation outline summary. This is a three stage process. The stages in this process are overall task status, budget, pending items, complete, overdue.
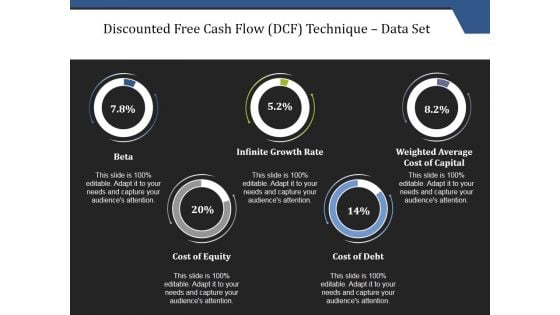
Discounted Free Cash Flow Dcf Technique Data Set Ppt PowerPoint Presentation File Inspiration
This is a discounted free cash flow dcf technique data set ppt powerpoint presentation file inspiration. This is a five stage process. The stages in this process are beta, infinite growth rate, weighted average cost of capital, cost of equity, cost of debt.
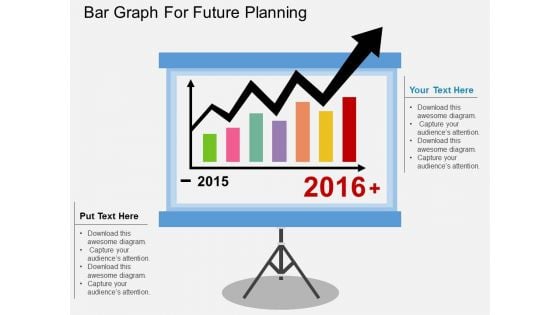
Bar Graph For Future Planning Powerpoint Template
This business diagram display bar graph for years 2015 and 2016. You may use this slide to display statistical analysis. This diagram provides an effective way of displaying information you can edit text, color, shade and style as per you need.

Starting Line Of Race Competition Powerpoint Template
Develop competitive advantage with our above template which contains diagram of four boys at starting line of competition of 2016. This diagram helps to display concepts of competition and race. You can edit text, color, shade and style as per you need.
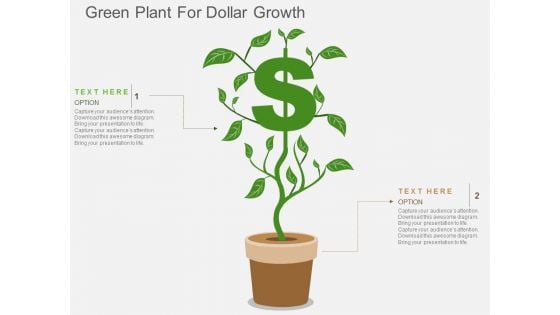
Green Plant For Dollar Growth Powerpoint Templates
This business slide contains graphics of Venn circles. This diagram is suitable to present financial ratio analysis. Download this diagram for schematic representation of any information. Visual effect of this slide helps in maintaining the flow of the discussion and provides more clarity to the subject.
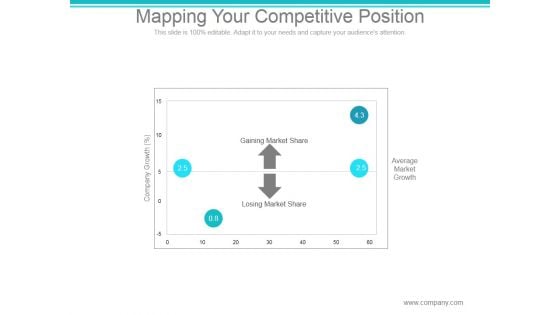
Mapping Your Competitive Position Ppt PowerPoint Presentation Files
This is a mapping your competitive position ppt powerpoint presentation files. This is a four stage process. The stages in this process are gaining market share, losing market share, company growth, average market growth.

Four Vertical Columns For Percentage Comparison Ppt PowerPoint Presentation Introduction
This is a four vertical columns for percentage comparison ppt powerpoint presentation introduction. This is a four stage process. The stages in this process are business, marketing, success, management, presentation.
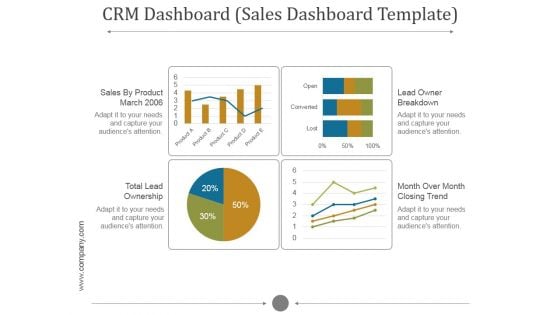
Crm Dashboard Sales Dashboard Template Ppt PowerPoint Presentation Inspiration
This is a crm dashboard sales dashboard template ppt powerpoint presentation inspiration. This is a five stage process. The stages in this process are sales by product march, lead owner breakdown, total lead ownership, month over month closing trend.
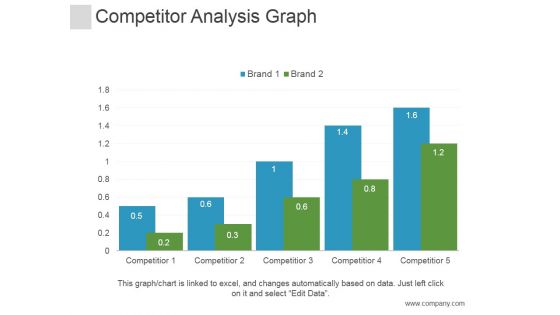
Competitor Analysis Graph Ppt PowerPoint Presentation Styles
This is a competitor analysis graph ppt powerpoint presentation styles. This is a five stage process. The stages in this process are graph, business, marketing, competitor.
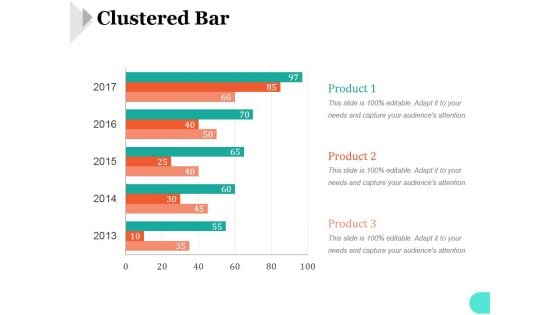
Clustered Bar Ppt PowerPoint Presentation Ideas
This is a clustered bar ppt powerpoint presentation ideas. This is a five stage process. The stages in this process are bar graph, marketing, strategy, analysis, business, success.
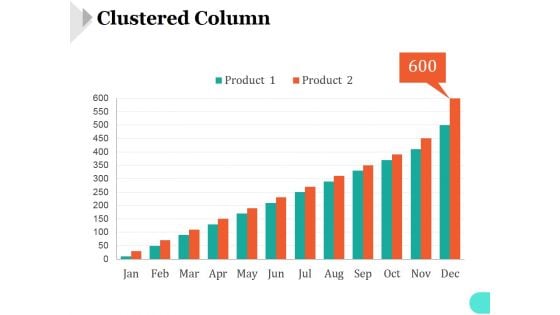
Clustered Column Template 1 Ppt PowerPoint Presentation Inspiration
This is a clustered column template 1 ppt powerpoint presentation inspiration. This is a twelve stage process. The stages in this process are bar graph, marketing, strategy, analysis, business, success.
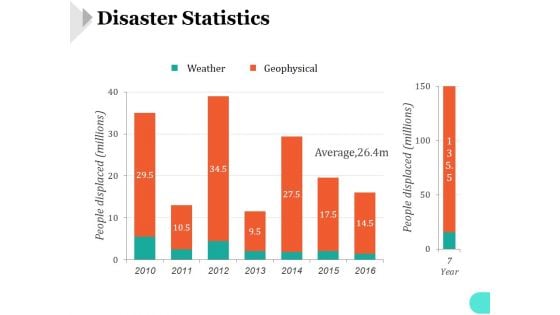
Disaster Statistics Ppt PowerPoint Presentation Portfolio
This is a disaster statistics ppt powerpoint presentation portfolio. This is a seven stage process. The stages in this process are weather, geophysical, average.
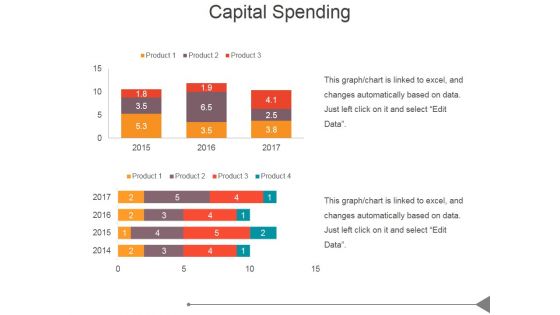
Capital Spending Ppt PowerPoint Presentation Graphics
This is a capital spending ppt powerpoint presentation graphics. This is a two stage process. The stages in this process are business, marketing, success, bar graph, management.
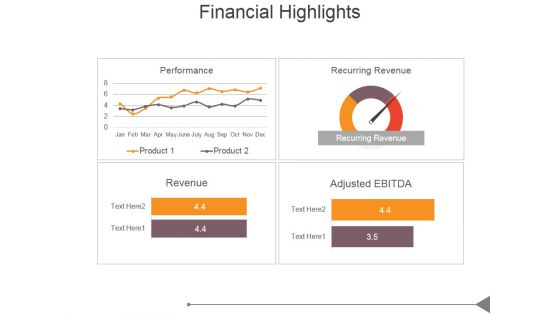
Financial Highlights Template 1 Ppt PowerPoint Presentation Model
This is a financial highlights template 1 ppt powerpoint presentation model. This is a four stage process. The stages in this process are business, marketing, success, business plan, bar graph.
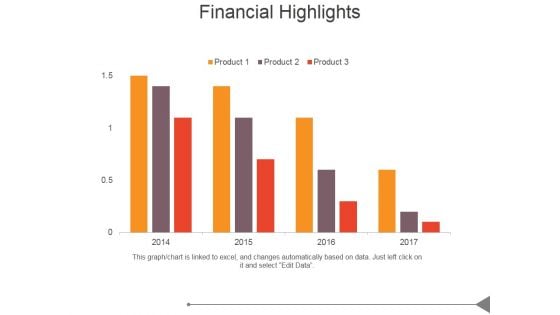
Financial Highlights Ppt PowerPoint Presentation Sample
This is a financial highlights ppt powerpoint presentation sample. This is a four stage process. The stages in this process are revenue, adjusted betide, recurring revenue, performance.
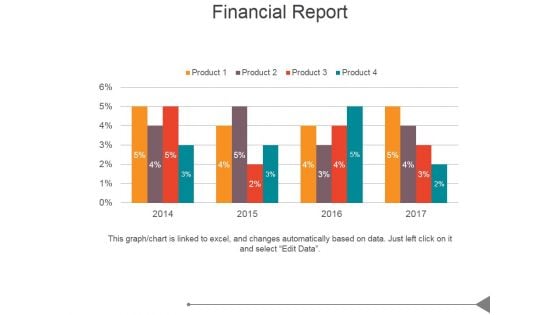
Financial Report Ppt PowerPoint Presentation Professional
This is a financial report ppt powerpoint presentation professional. This is a four stage process. The stages in this process are business, marketing, success, product, growth.
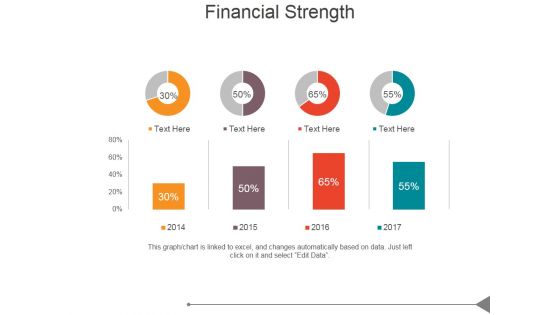
Financial Strength Ppt PowerPoint Presentation Shapes
This is a financial strength ppt powerpoint presentation shapes. This is a four stage process. The stages in this process are business, marketing, success, business plan, bar graph.
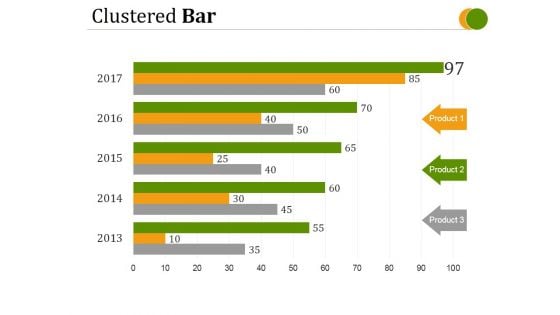
Clustered Bar Ppt PowerPoint Presentation Good
This is a clustered bar ppt powerpoint presentation good. This is a five stage process. The stages in this process are product, circular, business, marketing, bar graph.
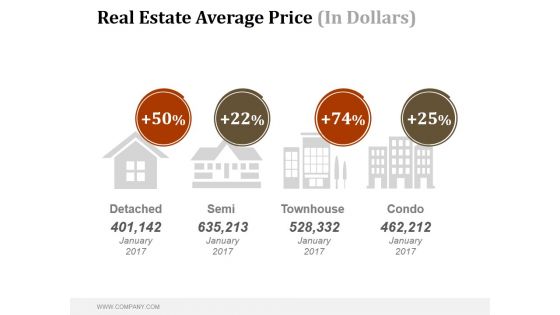
Real Estate Average Price In Dollars Ppt PowerPoint Presentation Inspiration
This is a real estate average price in dollars ppt powerpoint presentation inspiration. This is a four stage process. The stages in this process are detached, semi, townhouse, condo.
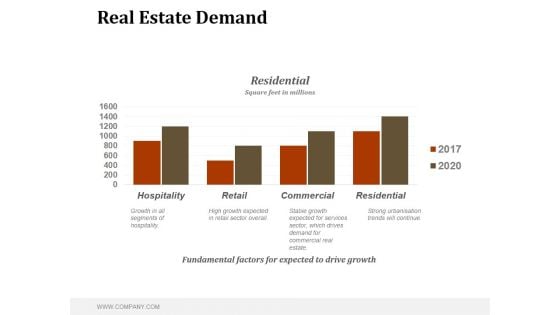
Real Estate Demand Ppt PowerPoint Presentation Graphics
This is a real estate demand ppt powerpoint presentation graphics. This is a four stage process. The stages in this process are fundamental factors for expected to drive growth, residential, square feet in millions.
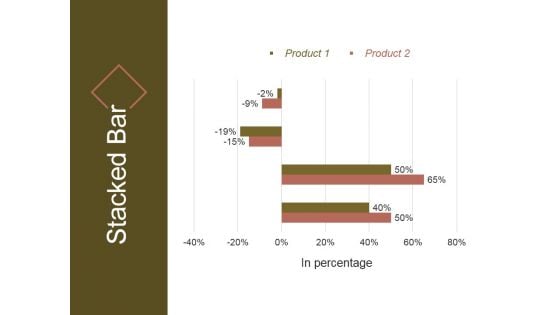
Stacked Bar Template 2 Ppt PowerPoint Presentation Pictures
This is a stacked bar template 2 ppt powerpoint presentation pictures. This is a four stage process. The stages in this process are in percentage, product, stacked bar.
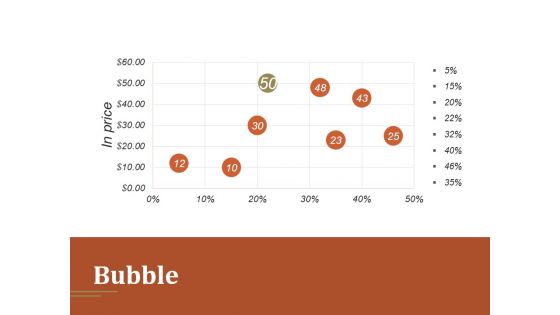
Bubble Ppt PowerPoint Presentation Guidelines
This is a bubble ppt powerpoint presentation guidelines. This is a five stage process. The stages in this process are bubble, business, bar graph, marketing, presentation.
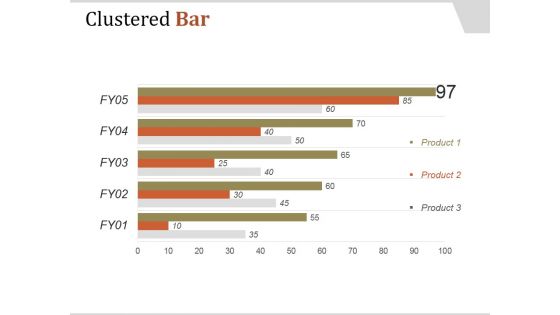
Clustered Bar Ppt PowerPoint Presentation Template
This is a clustered bar ppt powerpoint presentation template. This is a five stage process. The stages in this process are product, clustered bar, business, marketing, bar graph.
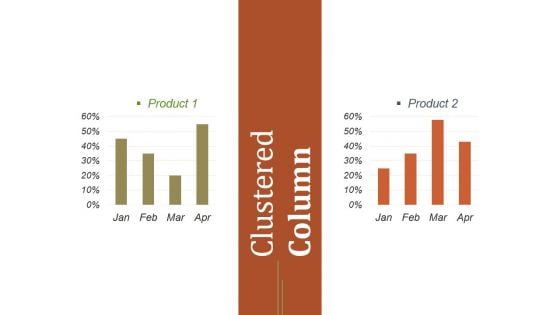
Clustered Column Ppt PowerPoint Presentation Example
This is a clustered column ppt powerpoint presentation example. This is a two stage process. The stages in this process are product, clustered column, business, planning, marketing.
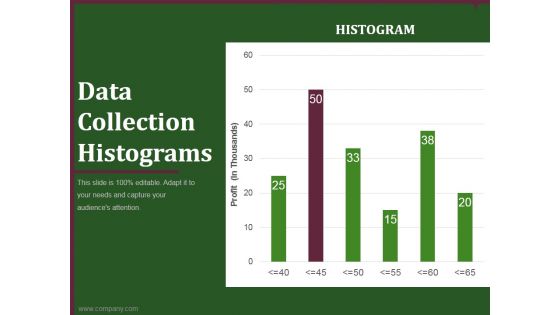
data collection histograms ppt powerpoint presentation example
This is a data collection histograms ppt powerpoint presentation example. This is a six stage process. The stages in this process are business, planning, marketing, histograms, graph.
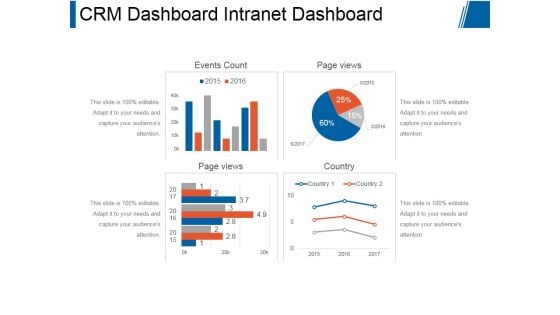
Crm Dashboard Intranet Dashboard Ppt PowerPoint Presentation Model
This is a crm dashboard intranet dashboard ppt powerpoint presentation model. This is a four stage process. The stages in this process are events count, page views, page views, country.
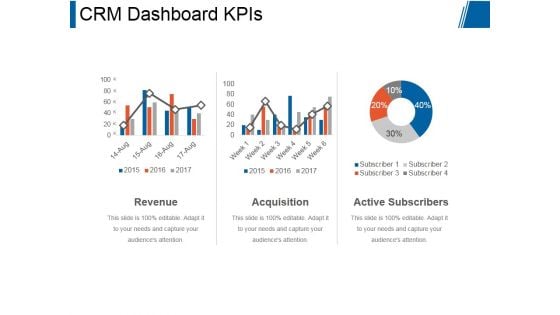
Crm Dashboard Kpis Ppt PowerPoint Presentation Rules
This is a crm dashboard kpis ppt powerpoint presentation rules. This is a three stage process. The stages in this process are revenue, acquisition, active subscribers.
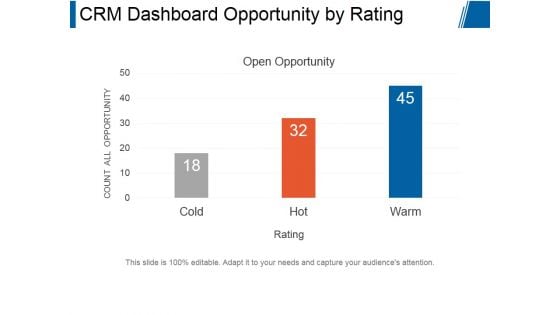
Crm Dashboard Opportunity By Rating Ppt PowerPoint Presentation Backgrounds
This is a crm dashboard opportunity by rating ppt powerpoint presentation backgrounds. This is a three stage process. The stages in this process are open opportunity, count all opportunity, rating.
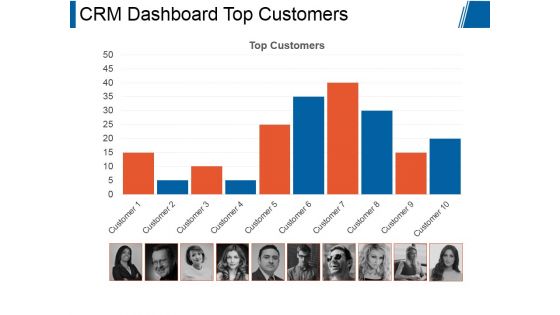
Crm Dashboard Top Customers Ppt PowerPoint Presentation Graphics
This is a crm dashboard top customers ppt powerpoint presentation graphics. This is a ten stage process. The stages in this process are top customers, business, marketing, process, management.
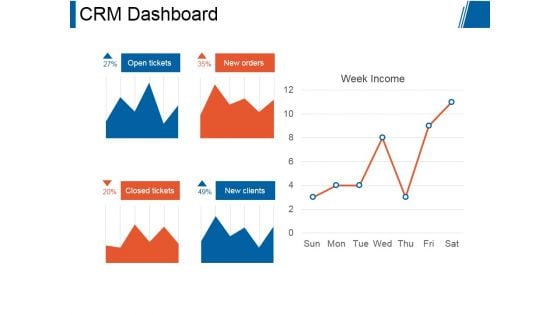
Crm Dashboard Ppt PowerPoint Presentation Good
This is a crm dashboard ppt powerpoint presentation good. This is a five stage process. The stages in this process are open tickets, new orders, closed tickets, new clients, week income.
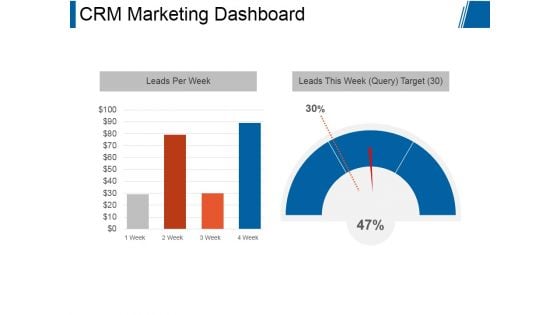
Crm Marketing Dashboard Ppt PowerPoint Presentation Designs
This is a crm marketing dashboard ppt powerpoint presentation designs. This is a two stage process. The stages in this process are leads per week, leads this week target.
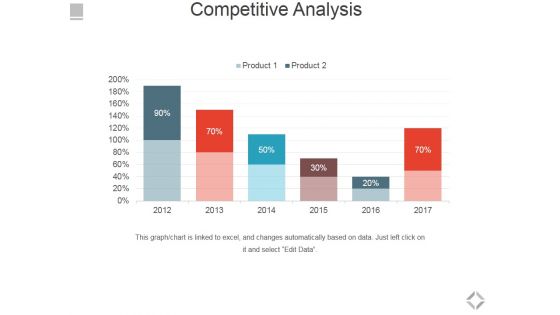
Competitive Analysis Ppt PowerPoint Presentation Slides Design Templates
This is a competitive analysis ppt powerpoint presentation slides design templates. This is a six stage process. The stages in this process are business, marketing, management, success, presentation.
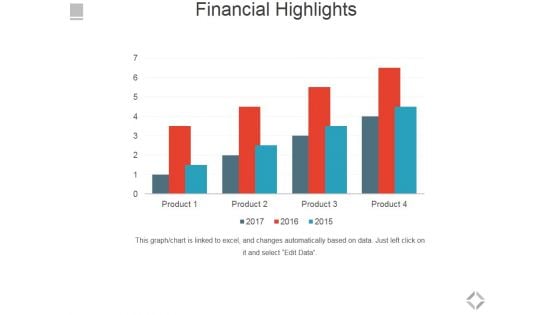
Financial Highlights Template 2 Ppt PowerPoint Presentation Outline Background Image
This is a financial highlights template 2 ppt powerpoint presentation outline background image. This is a four stage process. The stages in this process are financial highlights, business, marketing, success, management.
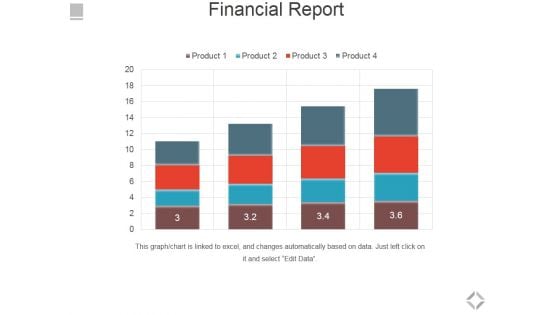
Financial Report Ppt PowerPoint Presentation Styles Skills
This is a financial report ppt powerpoint presentation styles skills. This is a four stage process. The stages in this process are bar graph, business, marketing, success, growth.
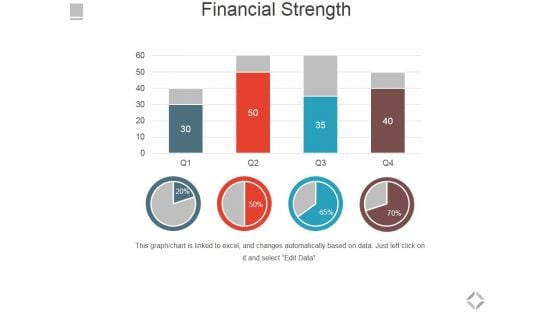
Financial Strength Ppt PowerPoint Presentation Summary Ideas
This is a financial strength ppt powerpoint presentation summary ideas. This is a four stage process. The stages in this process are bar graph, business, marketing, success, growth.
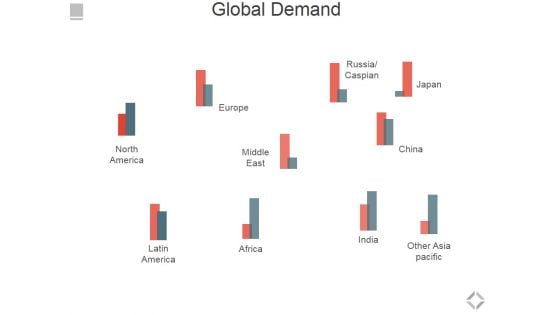
Global Demand Ppt PowerPoint Presentation Model Example Topics
This is a global demand ppt powerpoint presentation model example topics. This is a ten stage process. The stages in this process are europe, africa, latin america, north america, india.
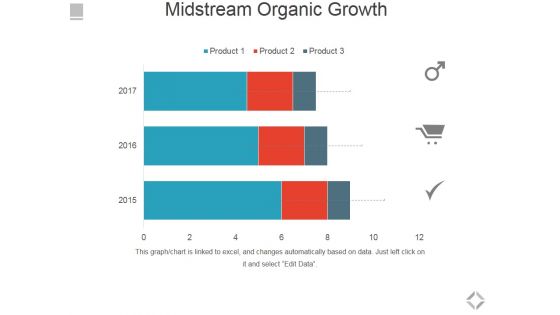
Midstream Organic Growth Ppt PowerPoint Presentation Ideas Graphics Tutorials
This is a midstream organic growth ppt powerpoint presentation ideas graphics tutorials. This is a three stage process. The stages in this process are business, marketing, bar graph, management, financials.
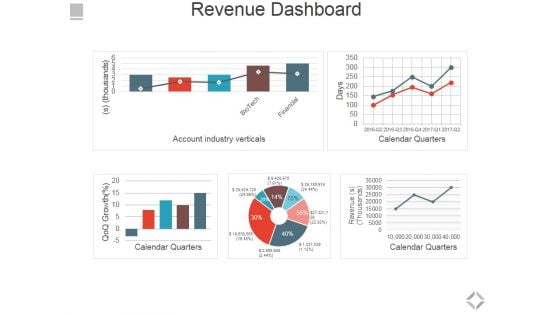
Revenue Dashboard Ppt PowerPoint Presentation Summary Brochure
This is a revenue dashboard ppt powerpoint presentation summary brochure. This is a five stage process. The stages in this process are account industry verticals, calendar quarters.
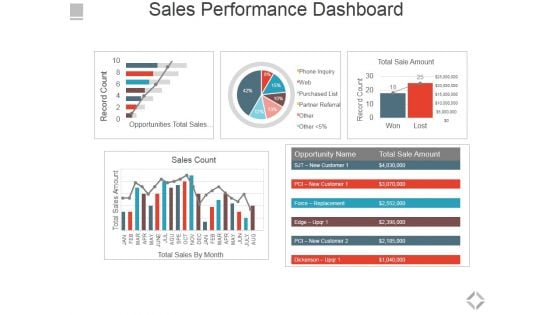
Sales Performance Dashboard Ppt PowerPoint Presentation File Graphics Pictures
This is a sales performance dashboard ppt powerpoint presentation file graphics pictures. This is a five stage process. The stages in this process are total sales by month, sales count, opportunities total sales by probability, total sale amount.
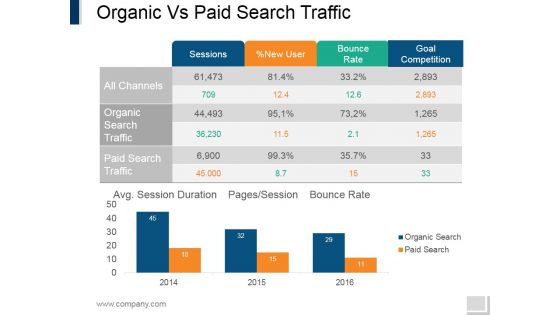
Organic Vs Paid Search Traffic Ppt PowerPoint Presentation Styles Sample
This is a organic vs paid search traffic ppt powerpoint presentation styles sample. This is a two stage process. The stages in this process are sessions, new user, bounce rate, goal competition, organic search traffic, paid search traffic.
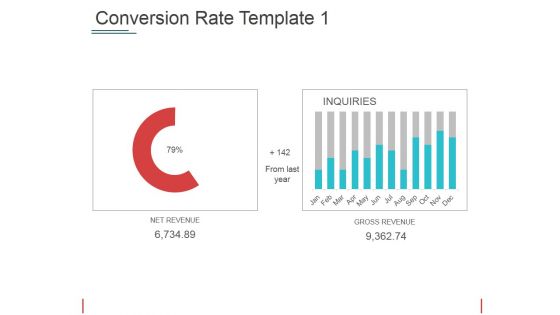
Conversion Rate Template 1 Ppt PowerPoint Presentation Visual Aids Files
This is a conversion rate template 1 ppt powerpoint presentation visual aids files. This is a two stage process. The stages in this process are net revenue gross revenue from last year.
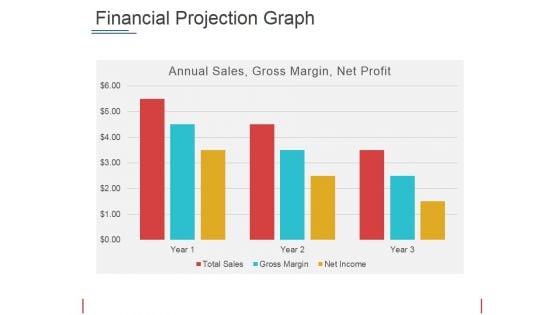
Financial Projection Graph Template 2 Ppt PowerPoint Presentation Show Picture
This is a financial projection graph template 2 ppt powerpoint presentation show picture. This is a three stage process. The stages in this process are annual sales, gross margin, net profit, years.
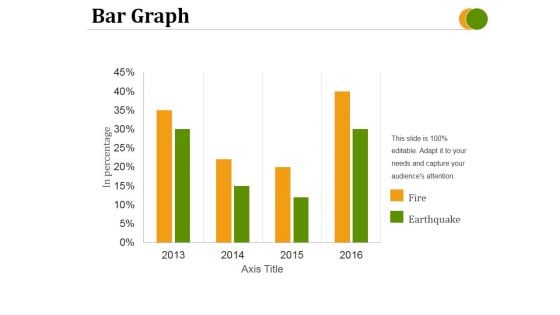
Bar Graph Ppt PowerPoint Presentation Layouts Pictures
This is a bar graph ppt powerpoint presentation layouts pictures. This is a four stage process. The stages in this process are fire, earthquake, axis title, in percentage.
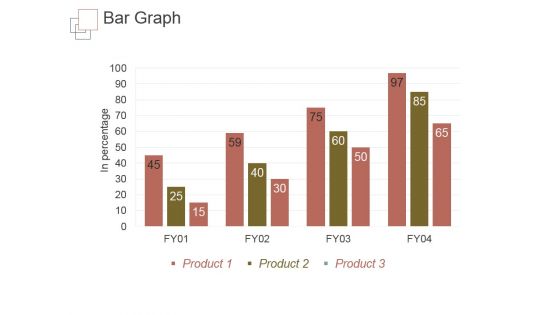
Bar Graph Ppt PowerPoint Presentation Gallery Skills
This is a bar graph ppt powerpoint presentation gallery skills. This is a four stage process. The stages in this process are in percentage, bar graph, business, marketing, product.
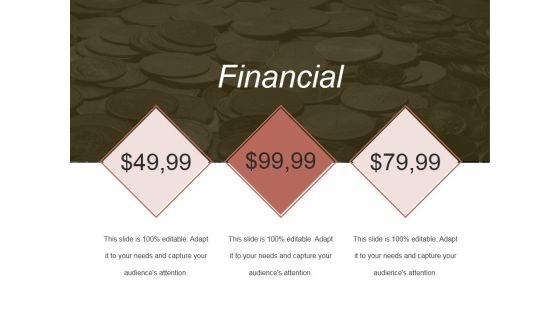
Financial Ppt PowerPoint Presentation Model Rules
This is a financial ppt powerpoint presentation model rules. This is a three stage process. The stages in this process are financial, sales, sales plan, business, marketing.
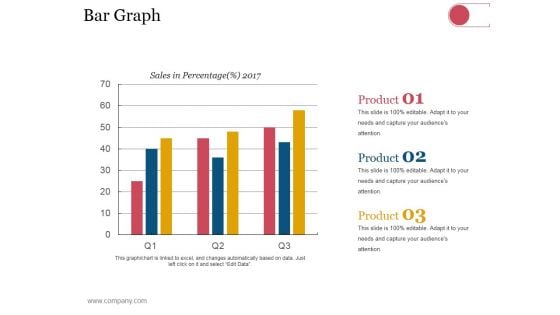
Bar Graph Ppt PowerPoint Presentation Visual Aids Model
This is a bar graph ppt powerpoint presentation visual aids model. This is a three stage process. The stages in this process are business, strategy, analysis, planning, sales in percentage.
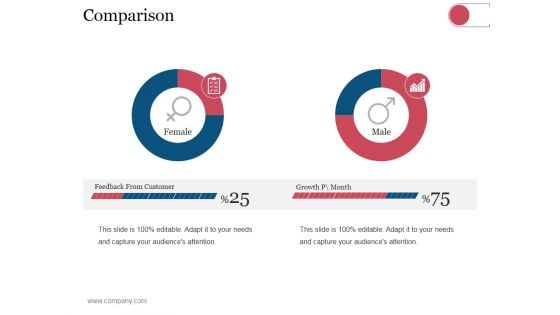
Comparison Ppt PowerPoint Presentation Pictures Templates
This is a comparison ppt powerpoint presentation pictures templates. This is a two stage process. The stages in this process are business, strategy, analysis, planning, feedback from customer, growth.
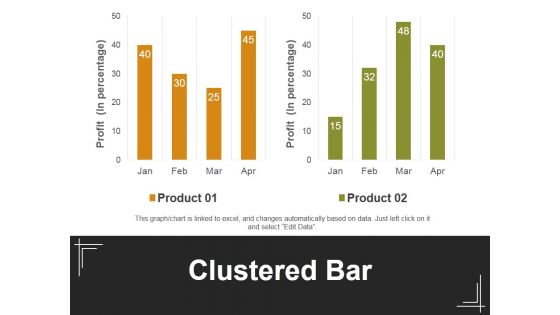
Clustered Bar Ppt PowerPoint Presentation Summary Design Inspiration
This is a clustered bar ppt powerpoint presentation summary design inspiration. This is a two stage process. The stages in this process are product, clustered bar, profit, business, marketing.
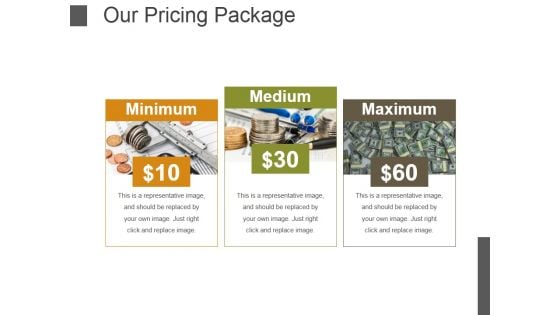
Our Pricing Package Ppt PowerPoint Presentation Gallery Design Inspiration
This is a our pricing package ppt powerpoint presentation gallery design inspiration. This is a three stage process. The stages in this process are minimum, medium, maximum.
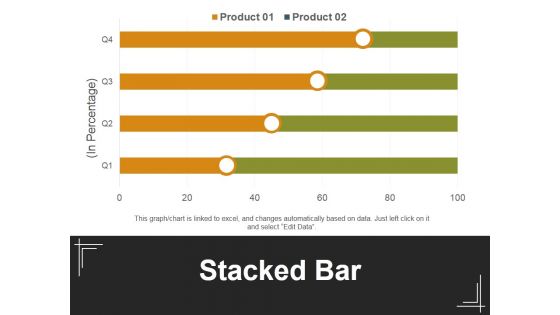
Stacked Bar Template 1 Ppt PowerPoint Presentation Inspiration Background Designs
This is a stacked bar template 1 ppt powerpoint presentation inspiration background designs. This is a four stage process. The stages in this process are in percentage, stacked bar, product, business, marketing.
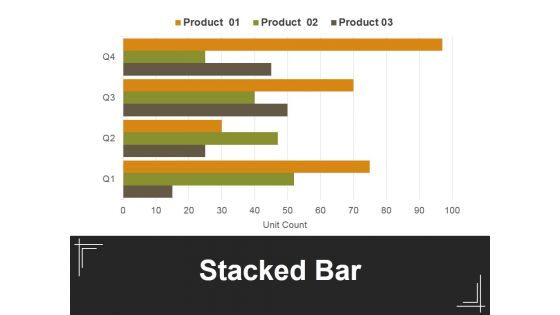
Stacked Bar Template 2 Ppt PowerPoint Presentation Professional Example
This is a stacked bar template 2 ppt powerpoint presentation professional example. This is a four stage process. The stages in this process are in percentage, stacked bar, product, business, marketing.
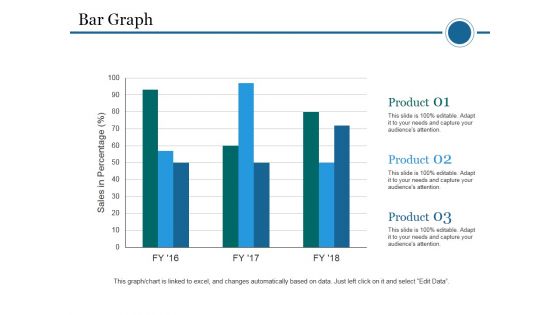
Bar Graph Ppt PowerPoint Presentation Infographic Template Template
This is a bar graph ppt powerpoint presentation infographic template template. This is a three stage process. The stages in this process are bar graph, sales in percentage, product, planning, business.
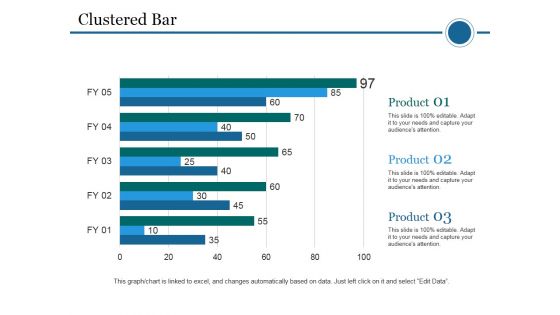
Clustered Bar Ppt PowerPoint Presentation File Topics
This is a clustered bar ppt powerpoint presentation file topics. This is a five stage process. The stages in this process are clustered bar, product, planning, business, marketing.
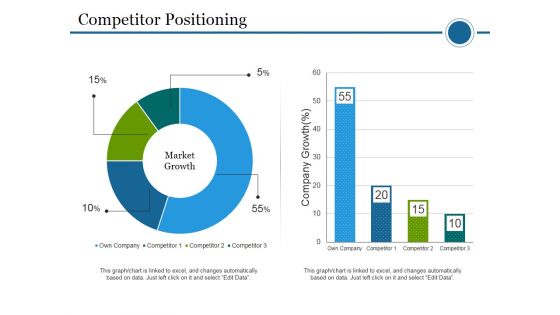
Competitor Positioning Ppt PowerPoint Presentation Infographics Gridlines
This is a competitor positioning ppt powerpoint presentation infographics gridlines. This is a two stage process. The stages in this process are competitor positioning, company, growth, market growth, business, marketing.
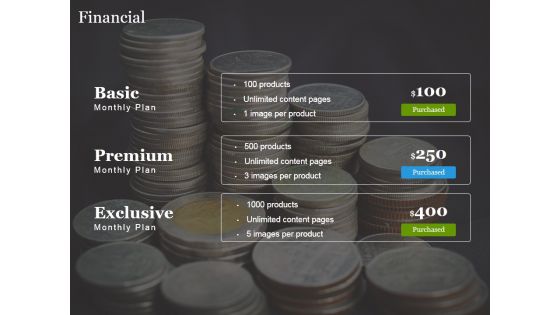
Financial Ppt PowerPoint Presentation Show Microsoft
This is a financial ppt powerpoint presentation show microsoft. This is a three stage process. The stages in this process are basic, premium, exclusive, purchased.
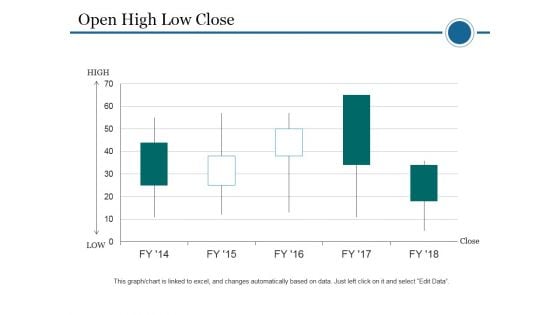
Open High Low Close Ppt PowerPoint Presentation Pictures Example Introduction
This is a open high low close ppt powerpoint presentation pictures example introduction. This is a five stage process. The stages in this process are high, low, close, business, marketing.
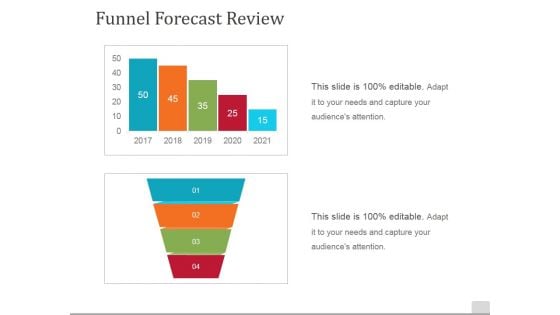
Funnel Forecast Review Template 1 Ppt PowerPoint Presentation Portfolio Deck
This is a funnel forecast review template 1 ppt powerpoint presentation portfolio deck. This is a two stage process. The stages in this process are funnel, forecast review, process, marketing, business.
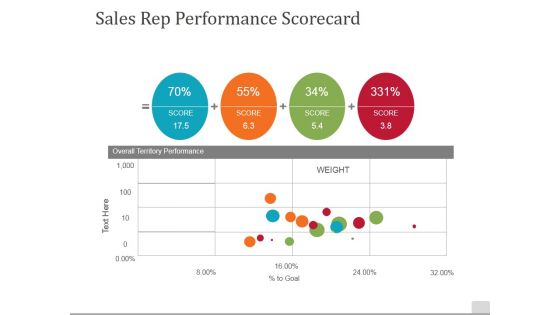
Sales Rep Performance Scorecard Ppt PowerPoint Presentation Gallery Design Templates
This is a sales rep performance scorecard ppt powerpoint presentation gallery design templates. This is a four stage process. The stages in this process are overall territory performance, weight, score.
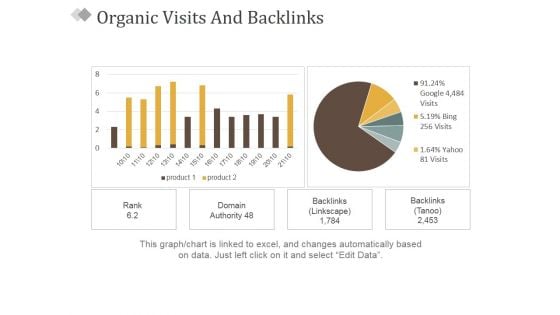
Organic Visits And Backlinks Ppt PowerPoint Presentation Styles Smartart
This is a organic visits and backlinks ppt powerpoint presentation styles smartart. This is a two stage process. The stages in this process are rank, domain, backlinks, backlinks.
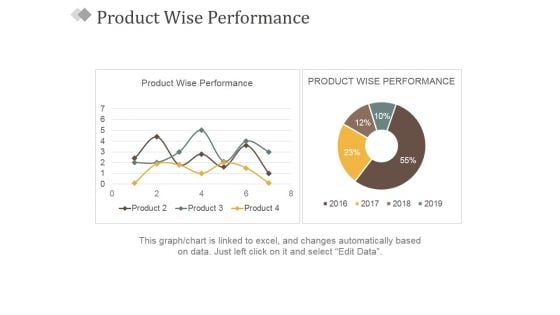
Product Wise Performance Ppt PowerPoint Presentation Slides Professional
This is a product wise performance ppt powerpoint presentation slides professional. This is a two stage process. The stages in this process are product wise performance, product wise performance.
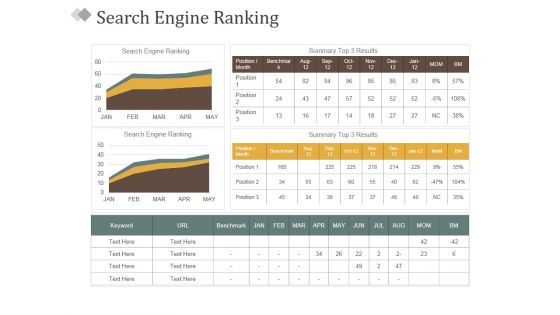
Search Engine Ranking Ppt PowerPoint Presentation Model Example Introduction
This is a search engine ranking ppt powerpoint presentation model example introduction. This is a five stage process. The stages in this process are search engine ranking, summary top 3 results, position, planning, business.
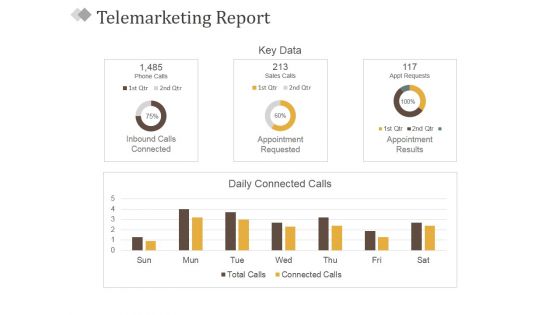
Telemarketing Report Template 1 Ppt PowerPoint Presentation Show Structure
This is a telemarketing report template 1 ppt powerpoint presentation show structure. This is a four stage process. The stages in this process are inbound calls connected, appointment requested, appointment results, key data, daily connected calls.
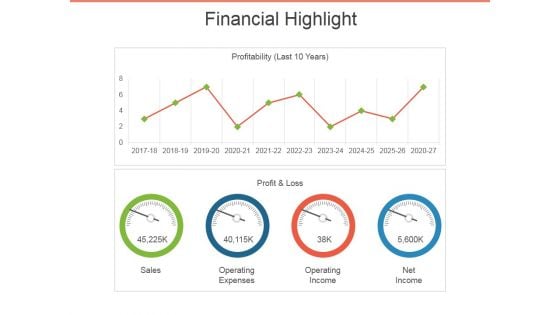
Financial Highlight Template 2 Ppt PowerPoint Presentation Outline Visuals
This is a financial highlight template 2 ppt powerpoint presentation outline visuals. This is a two stage process. The stages in this process are sales, profit and loss, operating expenses, operating income, net income.
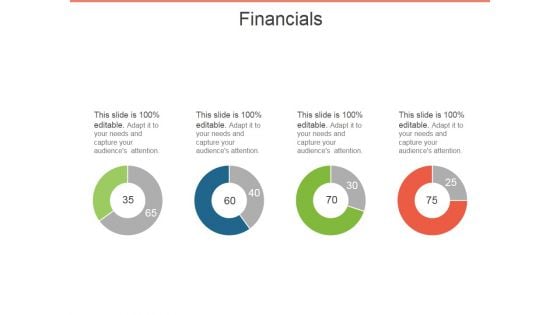
Financials Ppt PowerPoint Presentation Model Background
This is a financials ppt powerpoint presentation model background. This is a four stage process. The stages in this process are financials, business, process, marketing, success.
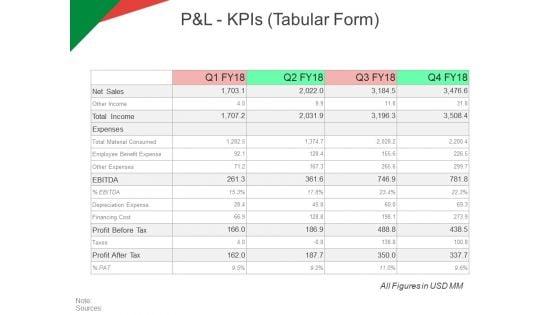
P And L Kpis Tabular Form Ppt PowerPoint Presentation Model Ideas
This is a p and l kpis tabular form ppt powerpoint presentation model ideas. This is a four stage process. The stages in this process are revenue, operating profit, cogs, net profit.
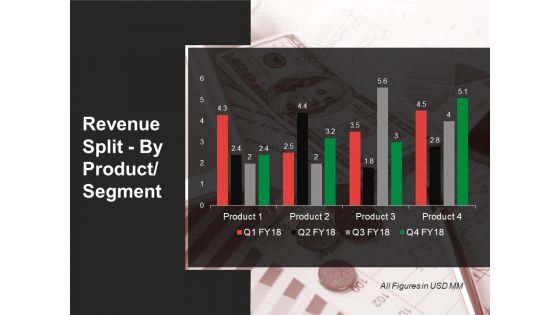
Revenue Split By Product Segment Template 2 Ppt PowerPoint Presentation Infographic Template Smartart
This is a revenue split by product segment template 2 ppt powerpoint presentation infographic template smartart. This is a four stage process. The stages in this process are Product, Business, Marketing, Strategy, Management.
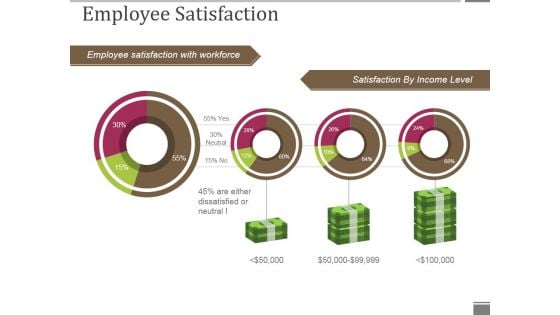
Employee Satisfaction Ppt PowerPoint Presentation Gallery Graphics
This is a employee satisfaction ppt powerpoint presentation gallery graphics. This is a four stage process. The stages in this process are employee satisfaction with workforce, satisfaction by income level.

Employee Who Leave Within First 6 Months Ppt PowerPoint Presentation Model Layout Ideas
This is a employee who leave within first 6 months ppt powerpoint presentation model layout ideas. This is a two stage process. The stages in this process are barely on board, top 3 reasons why they left, business, process, marketing.
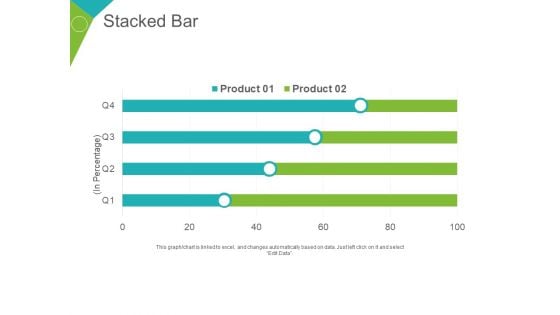
Stacked Bar Ppt PowerPoint Presentation Summary Portfolio
This is a stacked bar ppt powerpoint presentation summary portfolio. This is a two stage process. The stages in this process are product, business, planning, marketing, in percentage.
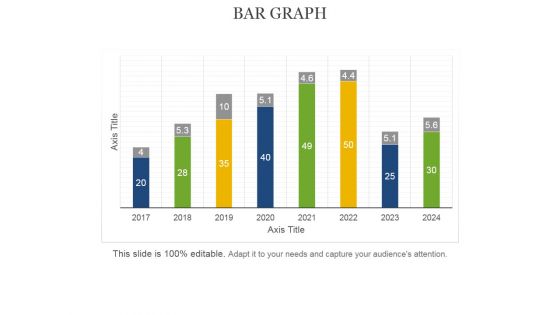
Bar Graph Ppt PowerPoint Presentation Professional Guide
This is a bar graph ppt powerpoint presentation professional guide. This is a eight stage process. The stages in this process are axis title, bar graph, business, marketing, management.
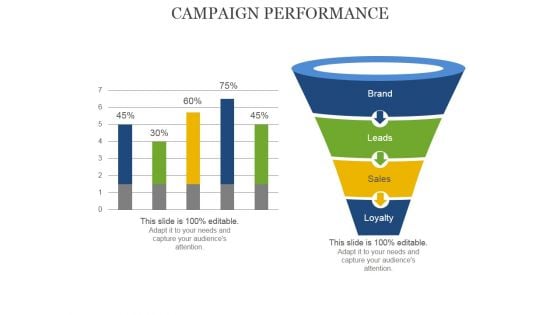
Campaign Performance Ppt PowerPoint Presentation Inspiration Vector
This is a campaign performance ppt powerpoint presentation inspiration vector. This is a two stage process. The stages in this process are loyalty, sales, leads, brand.
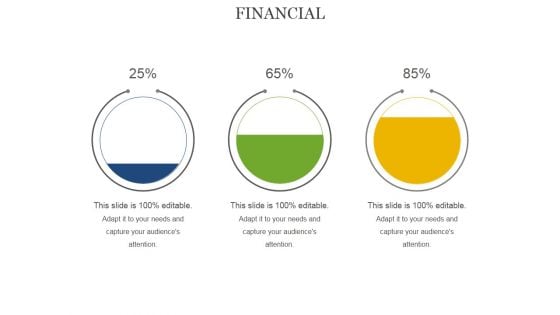
Financial Ppt PowerPoint Presentation Ideas Graphics Download
This is a financial ppt powerpoint presentation ideas graphics download. This is a three stage process. The stages in this process are financial, process., sales, plan, business.
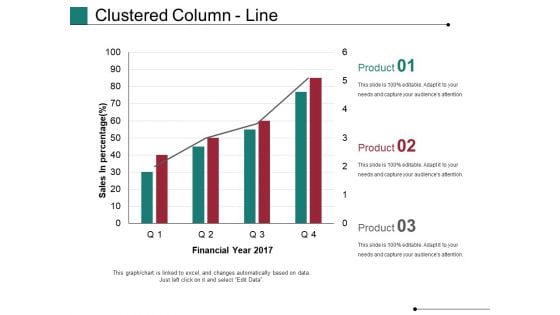
Clustered Column Line Ppt PowerPoint Presentation Model Rules
This is a clustered column line ppt powerpoint presentation model rules. This is a four stage process. The stages in this process are financial year, sales in percentage, business, marketing, growth, graph.
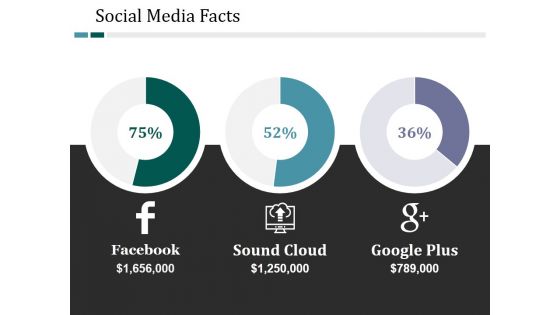
Social Media Facts Ppt PowerPoint Presentation Gallery Layout
This is a social media facts ppt powerpoint presentation gallery layout. This is a three stage process. The stages in this process are facebook, sound cloud, google plus.
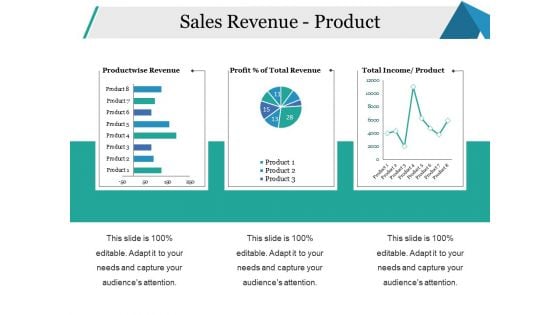
Sales Revenue Product Ppt PowerPoint Presentation Styles Skills
This is a sales revenue product ppt powerpoint presentation styles skills. This is a three stage process. The stages in this process are productwise revenue, income product, business, percentage, strategy.
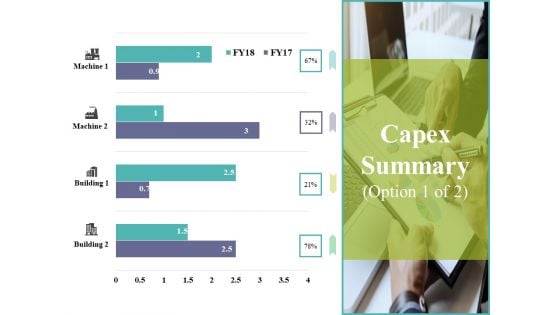
Capex Summary Template 1 Ppt PowerPoint Presentation Gallery Visuals
This is a capex summary template 1 ppt powerpoint presentation gallery visuals. This is a four stage process. The stages in this process are building, machine, business, marketing, graph.
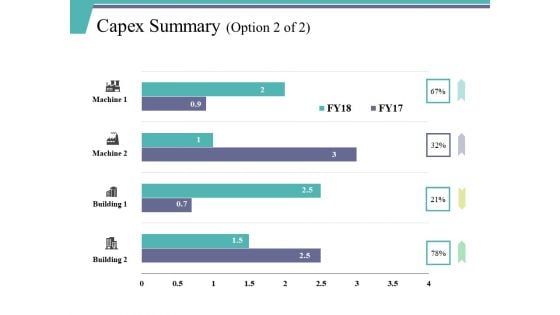
Capex Summary Template 2 Ppt PowerPoint Presentation File Background Designs
This is a capex summary template 2 ppt powerpoint presentation file background designs. This is a four stage process. The stages in this process are building, machine, business, marketing, graph.
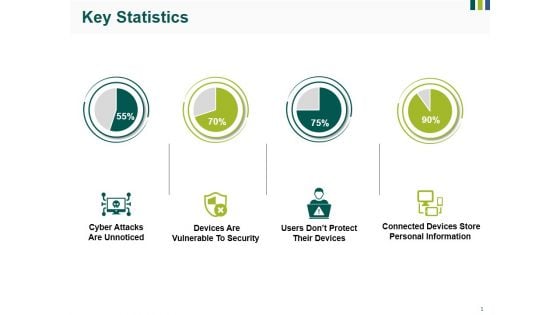
Key Statistics Ppt PowerPoint Presentation Gallery Format Ideas
This is a key statistics ppt powerpoint presentation gallery format ideas. This is a four stage process. The stages in this process are cyber attacks are unnoticed, devices are vulnerable to security, users dont protect their devices, connected devices store personal information.
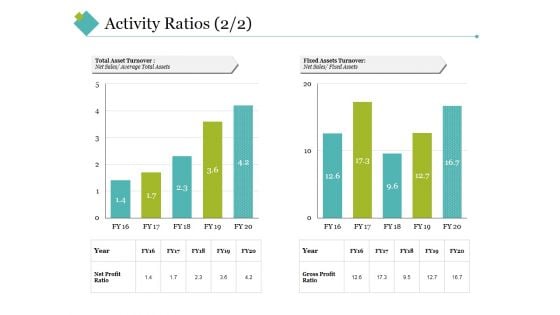
Activity Ratios Template 4 Ppt PowerPoint Presentation Styles Slideshow
This is a activity ratios template 4 ppt powerpoint presentation styles slideshow. This is a two stage process. The stages in this process are total asset turnover, fixed assets turnover, net sales, year, net profit ratio, gross profit ratio.
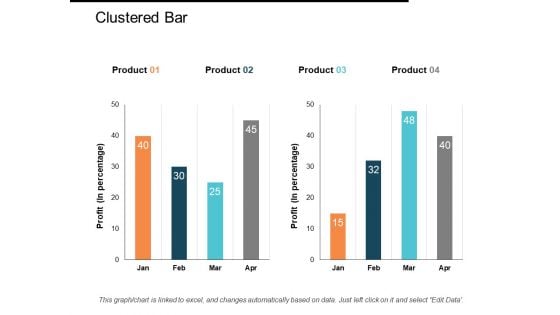
Clustered Bar Ppt PowerPoint Presentation Gallery Inspiration
This is a clustered bar ppt powerpoint presentation gallery inspiration. This is a four stage process. The stages in this process are clustered bar, product, profit, business, bar graph.
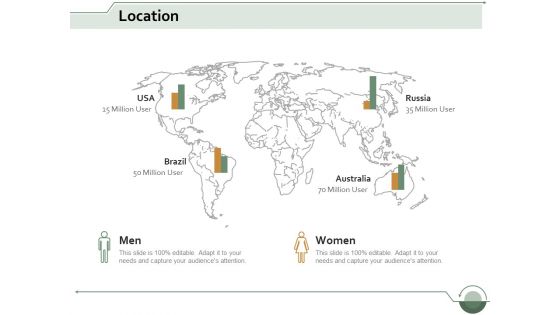
location geography ppt powerpoint presentation gallery template
This is a location geography ppt powerpoint presentation gallery template. This is a four stage process. The stages in this process are location, information, geography, management, strategy.

Zigzag Graphic With Five Directional Arrows Powerpoint Templates
This PPT slide has been designed with zigzag graphic. This diagram is suitable to display core competencies of business. This professional slide helps in making an instant impact on viewers.
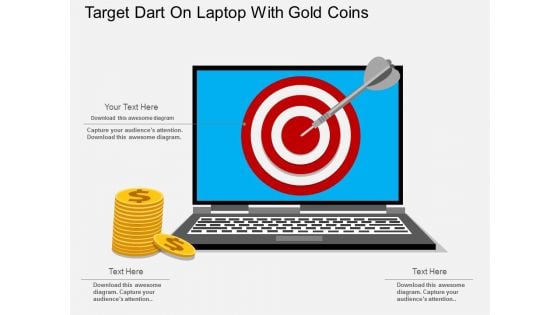
Target Dart On Laptop With Gold Coins Powerpoint Template
This business PowerPoint slide displays target dart on laptop with gold coins. This diagram is suitable for financial planning and target related topics. Download this PPT slide to make impressive presentations.
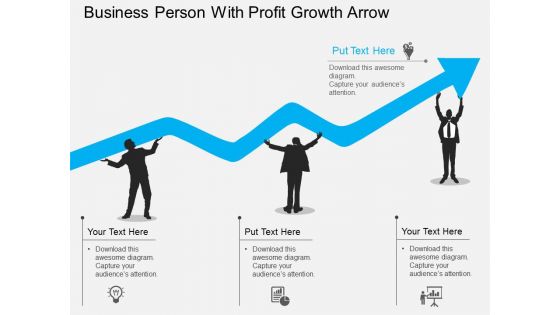
Business Person With Profit Growth Arrow Powerpoint Template
This slide has been designed with graphics of business men with arrow. This diagram is designed to display growth in business profit. This professional slide helps in making an instant impact on viewers.
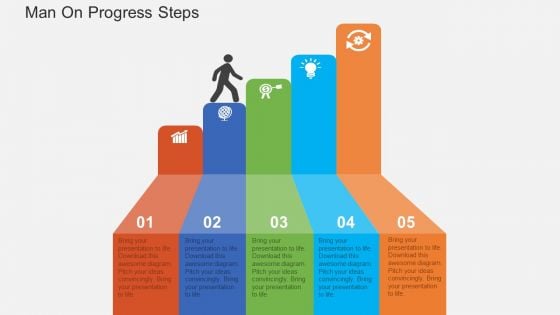
Man On Progress Steps Powerpoint Templates
Create visually amazing presentations with this business diagram. Use this business slide to depict concepts of progress, success, and winner. You may use this slide to share a plan to achieve the desired goals.

Financial Action Task Force Standard For AML Mapping Out The Anti Money Fin SS V
The following slide explains the FATF international standard for anti-money laundering to understand the principles. It provides various details such as description, recommendations, and benefits received. Download our innovative and attention grabbing Financial Action Task Force Standard For AML Mapping Out The Anti Money Fin SS V template. The set of slides exhibit completely customizable icons. These icons can be incorporated into any business presentation. So download it immediately to clearly communicate with your clientele. The following slide explains the FATF international standard for anti-money laundering to understand the principles. It provides various details such as description, recommendations, and benefits received.
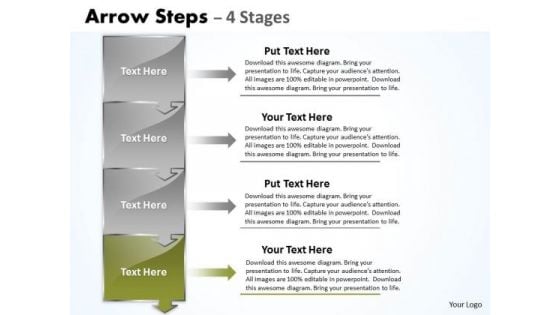
Usa Ppt Background Arrow Create PowerPoint Macro 4 Stage 5 Image
USA PPT Background arrow create powerpoint macro 4 stage 5 Image-Visually support your Microsoft office PPT Presentation with our above template illustrating vertical block list. It is a useful captivating tool conceived to enable you to define your message in your business and finance PPT presentations. Create captivating presentations to deliver comparative and weighted arguments.-USA PPT Background arrow create powerpoint macro 4 stage 5 Image-Arrow, Background, Business, Chart, Diagram, Financial, Graphic, Gray, Icon, Illustration, Management, Orange, Perspective, Planning, Process, Shapes, Metaphor, Stages, Steps, Text Influence teams with our Usa Ppt Background Arrow Create PowerPoint Macro 4 Stage 5 Image. Download without worries with our money back guaranteee.
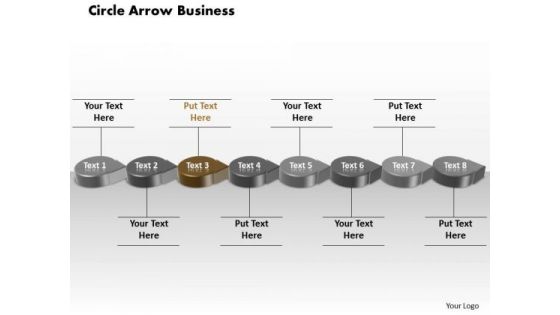
Ppt Brown PowerPoint Presentation Circular Arrow Business Transactions Diagram Templates
PPT brown powerpoint presentation circular arrow business transactions diagram Templates-This 3D Business PowerPoint Diagram Displays the circular arrows connected to each other signifying the continuous flow of steps to be executed. This Diagram can be used to represent Process charts, Business chart, Sales process chart and Finance process etc.-PPT brown powerpoint presentation circular arrow business transactions diagram Templates-3d, Advertisement, Advertising, Arrow, Border, Business, Circles, Collection, Customer, Design, Element, Icon, Idea, Illustration, Info, Information, Isolated, Label, Light, Location, Needle, New, Notification, Notify, Point, Pointer, Promotion, Role, Rounded Our Ppt Brown PowerPoint Presentation Circular Arrow Business Transactions Diagram Templates always show a full face. Get a complete view from any angle.
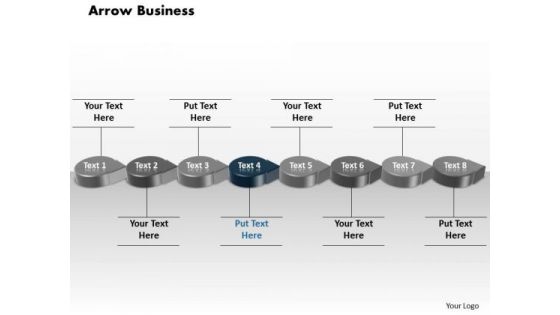
Ppt Blue Circular Arrow Business Transactions Diagram PowerPoint Slide Text Templates
PPT blue circular arrow business transactions diagram powerpoint slide text Templates-This 3D Business PowerPoint Diagram Displays the circular arrows connected to each other signifying the continuous flow of steps to be executed. This Diagram can be used to represent Process charts, Business chart, Sales process chart and Finance process etc.-PPT blue circular arrow business transactions diagram powerpoint slide text Templates-3d, Advertisement, Advertising, Arrow, Border, Business, Circles, Collection, Customer, Design, Element, Icon, Idea, Illustration, Info, Information, Isolated, Label, Light, Location, Needle, New, Notification, Notify, Point, Pointer, Promotion, Role, Rounded Establish the fundamentals of the venture. Fix the parameters. with our Ppt Blue Circular Arrow Business Transactions Diagram PowerPoint Slide Text Templates.
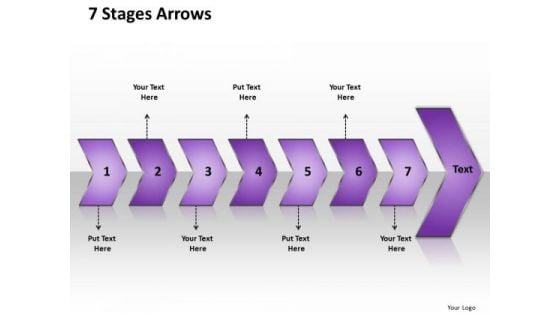
Ppt 7 Linear Curved Arrows PowerPoint 2010 Placed Sequentially Templates
PPT 7 linear curved arrows powerpoint 2010 placed sequentially Templates-This 3D Business PowerPoint Diagram Displays the curved arrows Successive to each other signifying the continuous flow of steps to be executed. This Diagram can be used to represent Process charts, Business chart, and Sales process chart and Finance process etc. An excellent graphic to attract the attention of your audience to improve earnings.-PPT 7 linear curved arrows powerpoint 2010 placed sequentially Templates-Arrow, Background, Process, Business, Chart, Diagram, Financial, Graphic, Gray, Icon, Illustration, Management, Orange, Perspective, Process, Reflection, Stage, Text, Transparency You will find our Ppt 7 Linear Curved Arrows PowerPoint 2010 Placed Sequentially Templates truly amenable. They will vibe well with your thoughts.
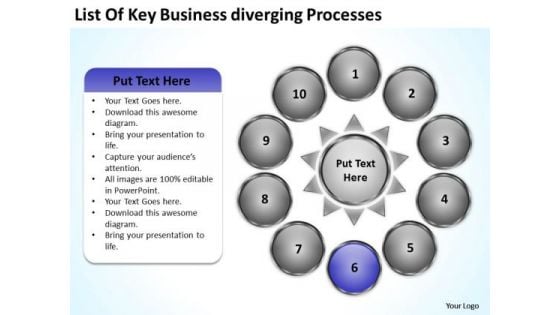
Nine Stages Diverging Factors Flow Chart Circular Network PowerPoint Templates
We present our nine stages diverging factors flow chart Circular Network PowerPoint templates.Use our Ring Charts PowerPoint Templates because they enhance the essence of your viable ideas. Download our Process and Flows PowerPoint Templates because it depicts Rolling along while gathering profits along the way is the aim. Use our Circle charts PowerPoint Templates because you should Emphasise the process of your business or corporate growth. Use our Arrows PowerPoint Templates because by using this slide you can Heighten the anticipation of your audience listing . Download and present our Success PowerPoint Templates because your brain is always churning out ideas like cogs in a wheel.Use these PowerPoint slides for presentations relating to Communication,competition, development, diagram,direction, element, finance, financial,forward, graphic, growth, guide,increase, investment, leader, leadership,management, marketing, motion,moving, organization, path, plan,presentation, price, profit, progress,report, representation, shape, sign. The prominent colors used in the PowerPoint template are Purple, Gray, White. People tell us our nine stages diverging factors flow chart Circular Network PowerPoint templates will save the presenter time. Customers tell us our finance PowerPoint templates and PPT Slides are Romantic. Professionals tell us our nine stages diverging factors flow chart Circular Network PowerPoint templates are topically designed to provide an attractive backdrop to any subject. Presenters tell us our element PowerPoint templates and PPT Slides will make the presenter successul in his career/life. Use our nine stages diverging factors flow chart Circular Network PowerPoint templates are readymade to fit into any presentation structure. Presenters tell us our finance PowerPoint templates and PPT Slides are designed by professionals You will be held in high esteem. Use our Nine Stages Diverging Factors Flow Chart Circular Network PowerPoint Templates as a coat-of-arms.
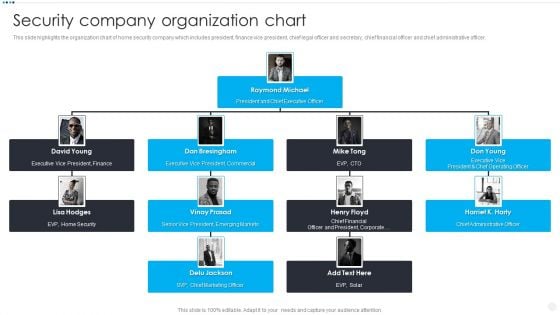
Smart Home Security Solutions Company Profile Security Company Organization Chart Diagrams PDF
This slide highlights the organization chart of home security company which includes president, finance vice president, chief legal officer and secretary, chief financial officer and chief administrative officer. Presenting Smart Home Security Solutions Company Profile Security Company Organization Chart Diagrams PDF to provide visual cues and insights. Share and navigate important information on four stages that need your due attention. This template can be used to pitch topics like Executive Vice President, EVP Home Security, Chief Marketing Officer, Chief Administrative Officer. In addtion, this PPT design contains high resolution images, graphics, etc, that are easily editable and available for immediate download.
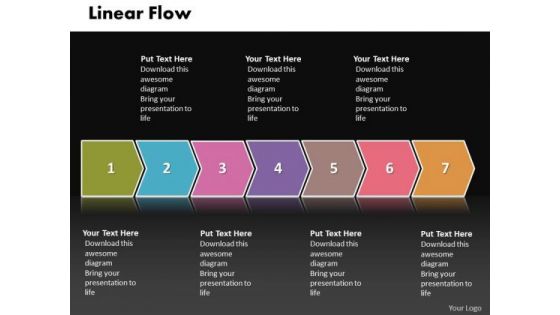
Ppt Linear Flow PowerPoint Theme Illustration Steps Of Process Templates
PPT linear flow powerpoint theme illustration steps of process Templates-This PowerPoint Diagram shows you the 3D Successive representation to Prevent finance Losses in Business. It Signifies amass, deposit, heap, invest, lay aside, lay away, mass, mound, pile, put by, salt away, save, sock away, and speculate.-PPT linear flow powerpoint theme illustration steps of process Templates-3d, Arrow, Background, Banner, Business, Chart, Colorful, Diagram, Direction, Element, Financial, Flow, Gradient, Illustration, Isolated, Mirrored, Placeholder, Presentation, Process, Steps Our Ppt Linear Flow PowerPoint Theme Illustration Steps Of Process Templates bring you closer to your dream. They give you an avenue to achieve them.
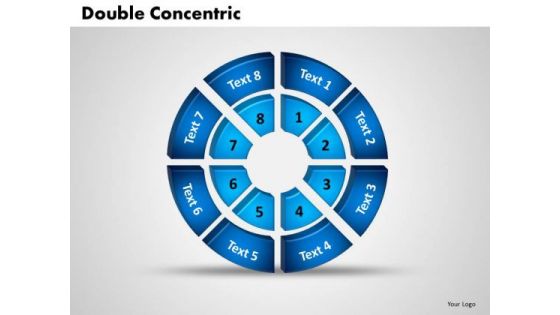
Business Image PowerPoint Templates Business 3d Double Concentric Rings Pieces Ppt Slides
Business Image PowerPoint Templates Business 3d double concentric rings pieces PPT Slides-Use this diagram to explain the contribution of each of the elements and how they provide impetus to the next phase. Highlight any anticipated problems, shortfalls or weak areas-Business Image PowerPoint Templates Business 3d double concentric rings pieces PPT Slides-This ppt can be used for concepts relating to-3d, Abstract, Account, Achievement, Analyst, Annual, Background, Blue, Business, Capital, Chart, Circular, Conceptual, Data, Design, Diagram, Document, Earnings, Economic, Finance Etc. Eliminate contradictions with our Business Image PowerPoint Templates Business 3d Double Concentric Rings Pieces Ppt Slides. Dilemmas will begin to disappear.
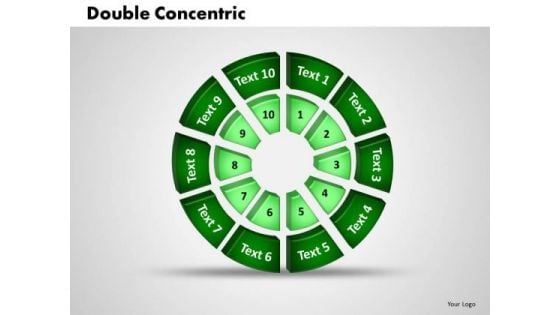
Business Leadership PowerPoint Templates Business 3d Double Concentric Rings Piece Ppt Slides
Business Leadership PowerPoint Templates Business 3d double concentric rings piece PPT Slides-Use this diagram to explain the contribution of each of the elements and how they provide impetus to the next phase. Highlight any anticipated problems, shortfalls or weak areas-Business Leadership PowerPoint Templates Business 3d double concentric rings pieces PPT Slides-This ppt can be used for concepts relating to-3d, Abstract, Account, Achievement, Analyst, Annual, Background, Blue, Business, Capital, Chart, Circular, Conceptual, Data, Design, Diagram, Document, Earnings, Economic, Finance Etc. Present pioneering technologies with our Business Leadership PowerPoint Templates Business 3d Double Concentric Rings Piece Ppt Slides. They will make you look good.
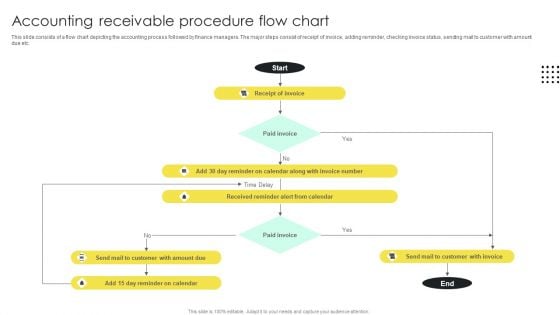
Accounting Receivable Procedure Flow Chart Inspiration PDF
This slide consists of a flow chart depicting the accounting process followed by finance managers. The major steps consist of receipt of invoice, adding reminder, checking invoice status, sending mail to customer with amount due etc. Showcasing this set of slides titled Accounting Receivable Procedure Flow Chart Inspiration PDF. The topics addressed in these templates are Invoice, Chart, Receivable. All the content presented in this PPT design is completely editable. Download it and make adjustments in color, background, font etc. as per your unique business setting.
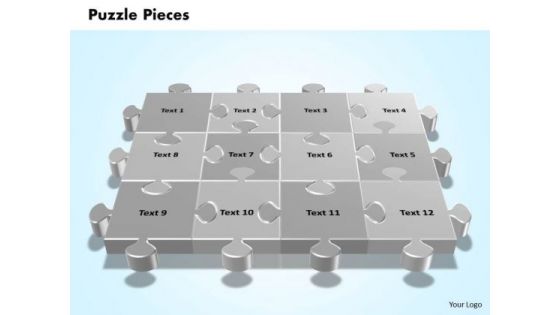
Business Diagrams PowerPoint Templates Business 3d Interconnected Jigsaw Puzzle Pieces Ppt Slides
Business Diagrams PowerPoint Templates Business 3d interconnected jigsaw puzzle pieces PPT Slides- Use this diagram to highlight the performance of your team and remind your team of these key aspects before moving on to the final phases of your strategy or plan.-Business Diagrams PowerPoint Templates Business 3d interconnected jigsaw puzzle pieces PPT Slides-This ppt can be used for concepts relating to-Arrow, Bars, Blue, Business, Chart, Colorful, Comparison, Construction, Development, Estate, Finance etc. Control your audience with our Business Diagrams PowerPoint Templates Business 3d Interconnected Jigsaw Puzzle Pieces Ppt Slides. Just download, type and present.
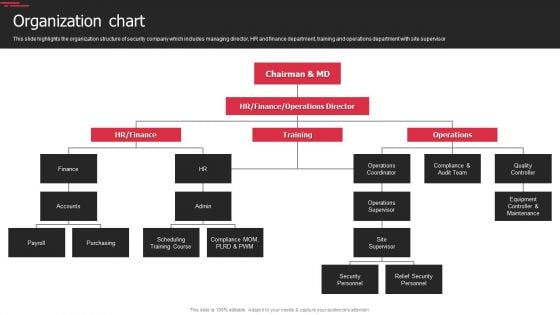
Security Agency Business Profile Organization Chart Topics PDF
This slide highlights the organization structure of security company which includes managing director, HR and finance department, training and operations department with site supervisor. This is a Security Agency Business Profile Organization Chart Topics PDF template with various stages. Focus and dispense information on six stages using this creative set, that comes with editable features. It contains large content boxes to add your information on topics like Operations Supervisor, Security Personnel, Relief Security Personnel. You can also showcase facts, figures, and other relevant content using this PPT layout. Grab it now.

Tips To Effectively Manage Restaurant Budget Management Diagrams PDF
This slide provide tips to effectively manage restaurant finance to avoid any kind of contingences and fund shortage situations. It includes elements such as compliance expenses, audit, optimize operation, formulate safety working capital. Presenting Tips To Effectively Manage Restaurant Budget Management Diagrams PDF to dispense important information. This template comprises four stages. It also presents valuable insights into the topics including Compliance Expenses, Optimize Operation, Formulate Safety. This is a completely customizable PowerPoint theme that can be put to use immediately. So, download it and address the topic impactfully.

Wealth Protection Money On Hand Ppt Powerpoint Presentation File Gridlines
This is a wealth protection money on hand ppt powerpoint presentation file gridlines. This is a one stage process. The stages in this process are icon save money, icon save expenses, icon save cost.
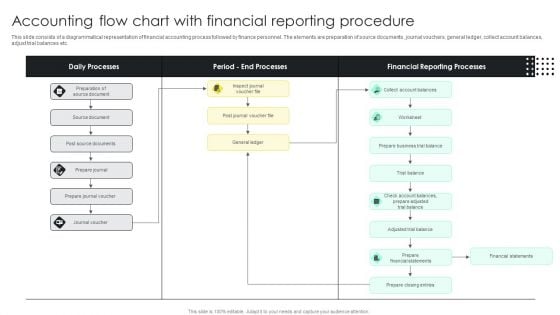
Accounting Flow Chart With Financial Reporting Procedure Clipart PDF
This slide consists of a diagrammatical representation of financial accounting process followed by finance personnel. The elements are preparation of source documents, journal vouchers, general ledger, collect account balances, adjust trial balances etc. Showcasing this set of slides titled Accounting Flow Chart With Financial Reporting Procedure Clipart PDF. The topics addressed in these templates are Source Document, Prepare Journal, Journal Voucher . All the content presented in this PPT design is completely editable. Download it and make adjustments in color, background, font etc. as per your unique business setting.
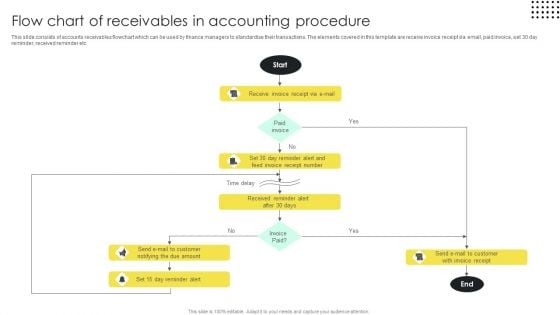
Flow Chart Of Receivables In Accounting Procedure Brochure PDF
This slide consists of accounts receivables flowchart which can be used by finance managers to standardise their transactions. The elements covered in this template are receive invoice receipt via email, paid invoice, set 30 day reminder, received reminder etc. Pitch your topic with ease and precision using this Flow Chart Of Receivables In Accounting Procedure Brochure PDF. This layout presents information on Reminder Alert, Invoice Receipt, Procedure. It is also available for immediate download and adjustment. So, changes can be made in the color, design, graphics or any other component to create a unique layout.
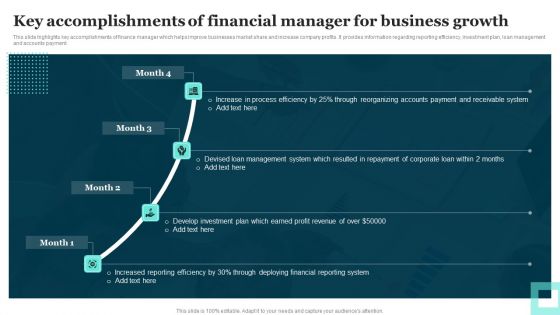
Key Accomplishments Of Financial Manager For Business Growth Diagrams PDF
This slide highlights key accomplishments of finance manager which helps improve businesses market share and increase company profits. It provides information regarding reporting efficiency, investment plan, loan management and accounts payment. Presenting Key Accomplishments Of Financial Manager For Business Growth Diagrams PDF to dispense important information. This template comprises four stages. It also presents valuable insights into the topics including Increased Reporting, Develop Investment, Devised Loan. This is a completely customizable PowerPoint theme that can be put to use immediately. So, download it and address the topic impactfully.
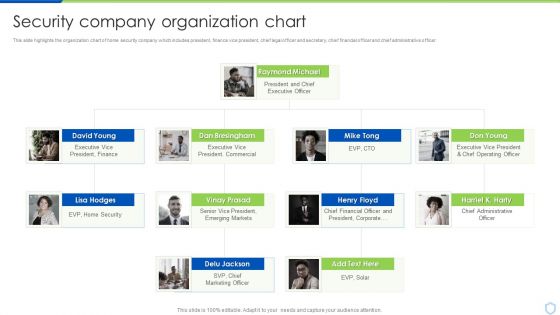
Security And Surveillance Company Profile Security Company Organization Chart Portrait PDF
This slide highlights the organization chart of home security company which includes president, finance vice president, chief legal officer and secretary, chief financial officer and chief administrative officer. This is a Security And Surveillance Company Profile Security Company Organization Chart Portrait PDF template with various stages. Focus and dispense information on four stages using this creative set, that comes with editable features. It contains large content boxes to add your information on topics like Raymond Michael, Executive President, Emerging Markets. You can also showcase facts, figures, and other relevant content using this PPT layout. Grab it now.
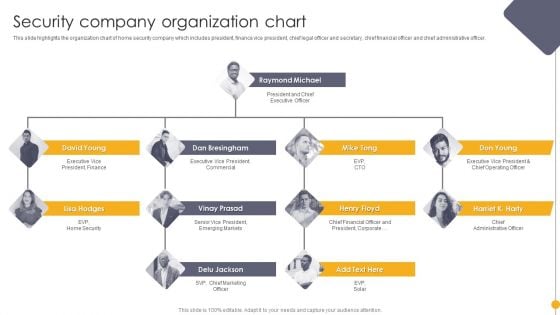
Portable Home Safety Systems Company Profile Security Company Organization Chart Demonstration PDF
This slide highlights the organization chart of home security company which includes president, finance vice president, chief legal officer and secretary, chief financial officer and chief administrative officer. Presenting Portable Home Safety Systems Company Profile Security Company Organization Chart Demonstration PDF to provide visual cues and insights. Share and navigate important information on four stages that need your due attention. This template can be used to pitch topics like Chief Financial, Executive Vice President, Chief Operating Officer. In addtion, this PPT design contains high resolution images, graphics, etc, that are easily editable and available for immediate download.
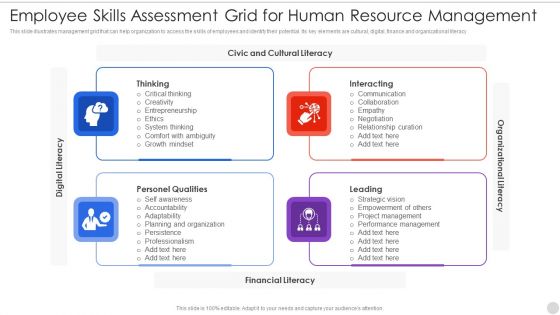
Employee Skills Assessment Grid For Human Resource Management Diagrams PDF
This slide illustrates management grid that can help organization to access the skills of employees and identify their potential. Its key elements are cultural, digital, finance and organizational literacy. Persuade your audience using this employee skills assessment grid for human resource management diagrams pdf. This PPT design covers four stages, thus making it a great tool to use. It also caters to a variety of topics including thinking, interacting, leading. Download this PPT design now to present a convincing pitch that not only emphasizes the topic but also showcases your presentation skills.

 Home
Home